Article

The Contribution of Root Turnover on Biological Nitrification Inhibition and Its Impact on the Ammonia-Oxidizing Archaea under Brachiaria Cultivations

Japan International Research Center for Agricultural Sciences (JIRCAS), Ohwashi 1−1, Tsukuba, Ibaraki 305-8686, Japan
*
Author to whom correspondence should be addressed.
Agronomy 2020, 10(7), 1003; https://doi.org/10.3390/agronomy10071003
Submission received: 14 April 2020 / Revised: 7 July 2020 / Accepted: 7 July 2020 / Published: 13 July 2020

Abstract

:
Aims: Biological nitrification inhibition (BNI) has been reported as an emerging technology to control soil nitrifier activity for effective N-utilization in cropping systems. Brachiaria have been reported to suppress nitrifier populations by releasing nitrification inhibitors from roots through exudation. Substantial BNI activity has been reported to be present in the root tissues of Brachiaria grasses; however, BNI contribution, such as root turnover, has not been addressed in previous studies. The present study aimed to clarify the contribution of root turnover on BNI under Brachiaria cultivations and its impact on nitrifier populations. Methods: We monitored root growth, changes in ammonia-oxidizing bacteria (AOB) and ammonia-oxidizing archaea (AOA) numbers, nitrification rate, and available nitrogen (N) content under seven germplasm lines of Brachiaria, for 18 months with seasonal profile sampling. Results: Brachiaria cultivation increased soil NH4+-N, available N, and total soil carbon levels. Though we did not find any correlation between the changes in AOB populations and potential nitrification, the potential nitrification rate decreased when AOA populations decreased. Multiple regression analysis indicated that BNI substances from root tissue turnover had a significant contribution to the BNI function in the field. Conclusion Results indicated that the inhibitory effect of BNI was mostly evident in AOA, and not in AOB, in this study. Brachiaria cvs. ‘Marandu’, ‘Mulato’, and ‘Tupy’ had the most substantial BNI effect among the seven cultivars evaluated. The estimated total BNI activities and available N content of root tissue explained the observed nitrification inhibition. In conclusion, the release of BNI substances through plant decomposition contributes to the decrease in the abundance of AOA, and thus the inhibition of nitrification under Brachiaria cultivation.

1. Introduction

Nitrogen (N) dynamics in agricultural soils is one of the most significant factors for crop production and environmental load from the farming sector. Recently, biological nitrification inhibition (BNI) has been attracting international attention as a technology for effective N-utilization in cropping systems [1,2,3]. In-depth investigations of Brachiaria grass (Brachiaria spp.) had led to the discovery of ‘Brachialactone’ in Brachiaria humidicola. Brachialactone, a cyclic diterpene with a unique 5-8-5-membered ring system and a y-lactone ring is an active BNI compound [1], and it plays a substantial role in the mitigation of agricultural greenhouse gas (GHG) emissions [2,4]. It also plays a role in yield enhancement of subsequent crops in Brachiaria-based agropastoral production systems [5]. Subbarao et al. reported that B. humidicola releases the nitrification inhibitor, Brachialactone into the rhizosphere soil as hydrophilic root exudate [1]. The presence of NH4+-N in the rhizosphere stimulates the release of BNIs from root systems and that includes Brachialactone [6], which blocks the pathways of ammonia monooxygenase (AMO) and hydroxylamine oxidoreductase (HAO) enzymatic pathways in Nitrosomonas europaea [1].
In this regard, various studies have recently pointed out the positive effects of BNI pasture cultivation on annual crops, such as maize and sorghum. Moreta et al. suggested that the accumulation of BNI compounds in the soil of a long-term B. humidicola pasture improved grain yield and agronomic nitrogen use efficiency (NUE) of the subsequent maize crop [7]. Zhang et al. also reported that seven vegetables planted in a field previously cultivated with sorghum, which releases the inhibitor, Sorgoleone [8], increased yields, reflecting improvements in NUE [9].
Previous studies that showed evidence of nitrification inhibition effect of Brachiaria pastures, suggested that Brachiaractone was a component of root exudate, whereas Gopalakrishnan et al. specified that Methyl ferulate and Methyl p-coumarate are nitrification inhibitors from root tissues for B. humidicola roots [10]. Therefore, the Brachiaria grasses may release the compound from root turnover, following organic matter decomposition, and influence the soil-N dynamics. Although Subbarao et al. have already pointed out that those plants have BNI inhibitors in their plant tissues [1], the contribution of BNI inhibitors present in plant tissues on the overall BNI phenomenon is less investigated.
Therefore, we aimed to clarify the effect of Brachiaria cultivation on nitrification inhibition (focusing on their root amount and its turnover in soil) and to show the changes of microbial flora, especially the ammonium-oxidizing bacteria (AOB) and ammonium-oxidizing archaea (AOA).

2. Materials and Methods

2.1. Investigated Brachiaria Lines

Eight genotypes of Brachiaria sp. were tested in this study, as shown in Table 1. They include: Brachiaria brizantha cv. Marandu (T1), B. decumbens cv. Basirisk (T2), B. ruziziensis cv. Kennedy (T3), B. hybrid cv. Mulato (T4), B. hybrid cv. Mulato II (T5), B. humidicola cv. Tupy (T6), B. humidicola cv. Tully (T7), and a bare soil set as control (T8). The control plot has been regularly hand-weeded to keep maintaining the bare soil during the experiment.
‘Marandu’ is known as a line with high root mass and fits well to fertile soil [11]. The genetic line ‘Basirisk’ originated from Uganda and was later disseminated in large areas due to its adaptability to low fertility and acidic soil conditions [12]. ‘Kennedy’ is the only registered cultivar in B. ruziziensis, which has been utilized mainly in South-East Asia, but hardly used in South America due to its low adaptability to low soil fertility [13]. ‘Mulato’ is the first hybrid variety of Brachiaria developed at CIAT, and it was selected from a progeny population of B. ruziziensis and B. brizantha [14]. ‘Mulato II’ is the hybrid variety selected from progeny populations, which is the crossed line of B. brizantha with the sexual germline, selected from the progeny population of B. ruziziensis and B. decumbens [15].
The BNI activities of root exudates are shown in Table 1 as allylthiourea unit (ATU). The inhibitory effect from 0.22 μM AT in an assay containing 18.9 mM of NH4+ is defined as one ATU of activity [16]. ‘Tupy’ is a high BNI line that possesses the highest BNI activity (46.3 ATU g−1 DM root day−1), and Kennedy has a BNI activity value of 24.4 ATU g−1 DM root day−1. ‘Basirisk’ and ‘Tully’ showed similar activities of BNI in root exudate of 18.3 and 17.5 ATU g−1 DM root day−1, respectively. ‘Marandu’ and ‘Mulato’ have relatively low values of 2.0 and 10.2 ATU g−1 DM root day−1, respectively. Although there was no report about BNI activity in the root exudate of Mulato II, we expect it to have a similar value as ‘Mulato’ due to their breeding background.

2.2. Research Site and Experimental Design

This study was conducted for 18 months, from October 2016 to March 2018 in the experimental field of the Japan International Research Center for Agricultural Sciences, Tropical Agriculture Research Front (JIRCAS-TARF, 24°22′39′ N, 124°11′43′ E) located at Ishigaki Island, in Japan. The annual mean temperature and precipitations in 2017 were 24.3 °C and 2417 mm, respectively. The daily mean temperature and rainfall during the experiment are shown in Figure 1. Soils in the field were Haplic Acrisol, and showed the properties in 0–30 cm depths as follows: pH of 6.22 (H2O), 6.41 g C kg−1 of total C, 0.81 g N kg−1 of total N, 1.04 and 1.17 mg kg−1 of NO3-N and NH4+-N, respectively.
At first, the seven Brachiaria sp. germplasm nurseries grew for two weeks in a greenhouse. After that, they were transplanted into the experimental fields on October 20th, 2016 and the bare plot (control); together, they formed eight treatments that were arranged in a randomized complete block design with three replications. The plot size was 2.7 m × 2.7 m and the spacing of the Brachiaria plants was 90 cm × 90 cm, which gave a total of nine plants per plot. As basal fertilizer, 10 kg N, 4.4 kg P, and 8.3 kg K ha−1 were applied, using ammonium sulfate, single superphosphate, and potassium chloride, respectively. After the basal application, there were no additional fertilizer applications during the cultivation. Additionally, we cut the top of grasses to avoid heading as appropriate. The irrigation was carried out at appropriate timing using an irrigation tube.

2.3. Soil Sampling

Soil sampling was done once every six months at 0–30 cm depth at the points between plant and plant to avoid drastic variance effect by root mass. Soils from each 3 cm depth were collected using a scraper plate [17]. The scraper plate method is used for taking samples by stripping soil off in small amounts from the ground surface in a fixed constant area. The scraper plate consists of a plate to shave off the soil from the surface, and a steel guide frame to fix the sampling area. Opening holes in the plate can also hold the steel bar to fix the depths to shave [18]. Soil sampling using a scraper plate is approved as the standard method of depth direction soil sampling by the International Atomic Energy Agency (IAEA). In our study, the dimension of the sampling area was configured as 200 mm × 300 mm and could allow sampling of soils and plant roots from a secured volume (1800 cm3) in each layer.
Soil samples were collected in bulk and weighed; 200 g of soil samples were then taken from the bulk soil samples and immediately frozen at −20 °C. To estimate the plant root mass in each layer, the remaining soil samples were air-dried and passed through a 4 mm sieve. The plant roots were then carefully and manually taken and weighed after oven drying at 80 °C for 72 h.

2.4. Chemical and Biological Analysis

Soil chemical analysis was conducted on the air-dried soil samples. Soil pH was determined by a glass electrode using a pH meter LAQUA (Horiba co., Japan). Total carbon and nitrogen (N) were determined via the dry combustion method using an NC analyzer (Sumigraph NC 220F, Sumika, Osaka, Japan). Nitrate-N (NO3-N) and ammonium-N (NH4+-N) were extracted by 2 M KCl solution and, respectively, determined by the cadmium reduction–naphthyl ethylenediamine method [19], and salicylate method [20], through continuous flow analysis using Auto Analyzer III (BL-TEC K. K., Tokyo, Japan). Available N was determined by the hot water extraction method [21]. Two grams of air-dried soil samples were taken into a 50 mL test tube; 33.3 mL of 80 °C hot water was then added into the test tube and kept in an oven at 80 °C for 16 h. After cooling, 3.33 mL of 100 mg g−1 potassium sulfate was added. The samples were hand-shaken and then filtered using filter paper No. 5C (ADVANTEC). The N content in the filtered solution was analyzed by TN−100 (Mitsubishi chemical analytech, Japan). The potential nitrification rate was determined using the method described by Belser and Mays [22]. Phosphate buffer solution (pH = 7) was added to two grams of air-dried soil samples; nitrate-N content was determined before incubation. After four hours of incubation with a horizontal shaker at 25 °C and 180 rpm, nitrate-N content was again determined by the method described above. The nitrate-N increment was calculated as the potential nitrification rate.
For the biological analysis, we first defrosted the soil samples and air-dried c.a. 3 g per sample for one day at room temperature. After that, the soil DNA was extracted from 0.4 g air-dried subsamples using the Fast DNA Spin Kit for soil (Mo-Bio, Carlsbad, CA, USA). The remaining soil samples were oven-dried at 105 °C for 24 h to calculate the water content in the 0.4 g soil samples. Extracted pure DNA was used to quantify the ammonia-oxidizing archaea (AOA) and ammonia-oxidizing bacteria (AOB) by determining the abundance of the ammonia monooxygenase (amoA) genes by real-time polymerase chain reaction (PCR). Quantitative PCRs (qPCR) were performed in a CFX96 TouchTM Real-Time PCR Detection System (Bio-Rad) using 96-well PCR plates. Each well contained 15 µL reaction mixture, which composed of 7.5 µL of SsoAdvancedTM Universal SYBR Green Supermix (Bio-Rad, Bio-Rad Laboratories, Inc, Hercules, CA), 0.25 µM of each primer (corresponding to 0.0375 µL of 100 pmol µL−1), 1 µL of 1/10 diluted DNA and 6.425 µL sterilized MilliQ water. However, to carry out the qPCR of each gene, we first prepared a master solution for several plates by mixing the necessary volumes of all components except the DNA. Following that, 14 µL mixture was applied in each well before 1 µL of 1/10 diluted DNA was added. Standard curves were generated using 10-fold serial dilutions of the plasmids, and gene abundance generated using the regression equation which converts the cycle threshold (Ct) value to the known gene abundance in the standards. Gene abundance as then converted per gram of dry soil using the following formula:
Gene   abundance   = X × d × V / 0.4 × ( 1 M ) ,
where X indicates the abundance of genes detected by qPCR; d indicates the dilution factor; V indicates the volume (µL) of extracted DNA; 0.4 indicates the amount of soil used for DNA extraction (g); and M indicates soil moisture. For all assays, amplification efficiency ranged between 88.3% and 106.2% and R2 values were 0.992–1.000. All qPCR reactions were run in duplicate for each DNA sample.

2.5. Plant Growth Monitoring

The plant growth of each Brachiaria sp. was monitored using the unmanned aerial vehicle (UAV), Phantom 4 (DJI instrument, China), until the first cut (March 2017). Plants were pictured once every two weeks from c.a. 30 m height with resolution of c.a. 1.2 cm mesh. The pictures were orthorectified using the software PhotoScan (Agisoft, LLC, Russia). The orthorectified pictures were then cut out from each plot, and ImageJ version 1.52 g [23], used to perform the calculation of fractional green areas of the pictures of each plot. Consequently, canopy coverage was calculated by digital imagery analysis [24].

2.6. Evaluation of BNI Activities in Plant Root Tissue

To identify the effect of root turnover on BNI, we determined BNI activities of root tissue, according to Subbarao et al. [16]: 200 mg powdered freeze-dried plant roots were weighed into a glass tube and extracted by 10 mL of methanol for three times as decantation. The total methanol extracts (30 mL) were evaporated to dryness and re-extracted by 5 mL of methanol. The re-extracts were dried up using an evaporator, and then extracted by 150 μL of methanol, which was dried up and dissolved in dimethyl sulfoxide (DMSO); the final sample was used for determining BNI activity using recombinant luminescent Nitrosomonas assay described earlier [16]. Root turnover was estimated from the C/N ratio of plant roots. Cardoso et al. indicated the value of root length turnover (RLT) of 6 Brachiaria grasses which correlated with root C/N ratio (R2 = 0.654, p = 0.051) and lignin/N value (R2 = 0.277) [25]. According to these data, we estimated RLT as follows.
Estimated   RLT   = 0.0034 × C / N   ratio   of   plant   root + 1.0689

2.7. Statistical Analysis

Multiple comparison analysis was done using Tukey’s HSD method, and multiple regression analysis was performed using Kyplot ver. 5 (Kyence Japan). F-test was used to evaluate the significance of multiple coefficients of determination.

3. Results and Discussion

3.1. Effect of Brachiaria Cultivation on General Soil Chemical Properties and Potential Nitrification Rate

The chemical properties of several soils, obtained after 18 months cultivation of the seven Brachiaria lines, are shown in Table 2. There were clear differences in total soil carbon (C) content. The control (soil without plant) had the lowest (5.64 g kg−1) carbon content compared to other treatments; the cultivation of Brachiaria improved the soil-C, especially in cv. ‘Kennedy’, which soil-C level (6.65 g C kg−1) was significantly higher than that of ‘Mulato’ and ‘Tupy’. Available N concentration increased in all Brachiaria grown plots compared to that of the control (Table 2). Relatively higher available N was observed in cv. ‘Tully’ (34.9 mg N kg−1) and cv. ‘Kennedy’ (33.8 mg N kg−1). We noticed that the available N concentration generally increased with the plant root amount, reflecting N immobilization and root decomposition, and this outcome was supported by a significant correlation between available N concentration and total soil-C (R2 = 0.724, p < 0.01). Besides, soil-NH4+-N significantly correlated with soil-C levels (R2 = 0.730, p < 0.01), indicating that NH4+-N was supplied mainly through plant root decomposition. This is also supported by Figure 2 which shows the relationships between root amount and total carbon, NH4+-N, and available N. The coefficients of determination in these correlations were 0.708 (p < 0.05), 0.541 (n.s.), and 0.657 (p < 0.05), respectively, except for ‘Kennedy’. The low value of the root amount in ‘Kennedy’ may be underestimated, possibly reflecting the vast amounts of very fine roots. Sarr et al. found similar results in sorghum cultivation where rhizosphere soils contained higher organic carbon and total nitrogen concentrations than soils without plant (control) [26]. In contrast, soil-NO3-N levels did not show any significant correlation with soil-C, soil-NH4+-N, and available soil-N levels (data not shown). This implies that NH4+-N drove the availability of N. Most importantly, in the occurrence of a constant nitrification rate, treatments with higher soil-NH4+-N content would generally have higher soil-NO3-N. However, such a result was not obtained in this study and some factors may have been responsible for the control of nitrification, and one of those factors could be the BNIs released by the Brachiaria grasses, which could differ in their nature and quantity among the Brachiarias tested. However, BNIs themselves may not be enough of a factor to explain the observed result, considering that the seven Brachiaria types of grasses may have also absorbed soil-NO3-N at different capacities. For example, high nitrification rates may have occurred in some cases, but higher NO3-N absorption or denitrification into NO2 in some Brachiaria than in others could diminish its content in the soil.

3.2. Changes of Plant Root Abundance under Brachiaria Cultivation and Its BNI Activities

The cultivation of Brachiaria sp. resulted in a considerable increase in organic matter, indicating the addition of soil carbon from root turnover and decomposition. For example, Rao et al. indicated that nine-year-old pastures of Brachiaria dictyoneura had a significantly higher annual root production than that of the native pastures of Colombia [27]. They also stated that greater amounts of live roots in Brachiaria pastures contributed to superior root turnover than the native pastures. Recently, it has been reported that there was a significant increase in soil organic carbon under several Brachiaria cultivation (‘Tully’, ‘Mulato’, and B. humidicola cv CIAT16888) [28]. Meanwhile, our results showed that there were clear differences among the seven Brachiaria cultivars tested for roots abundance (Figure 3). Two varieties of B. humidicola (‘Tupy’ and ‘Tully’) showed the highest root amount in the surface layer (0–3 cm). It was similar to that of B. ruziziensis cv. Kennedy which showed a high root amount in the surface layers. Although the root distribution pattern was the same between ‘Kennedy’ and the two B. humidicola cvs., ‘Tupy’ and ‘Tully’, the total root amount in ‘Kennedy’ was lower than those of ‘Tupy’ and ‘Tully’. The highest root amount was observed in ‘Basirisk’ (1147 kg DM ha−1), followed by ‘Tully’ (1109 kg DM ha−1), ‘Mulato II’ (855 kg DM ha−1), ‘Marandu’ (849 kg DM ha−1), ‘Tupy’ (699 kg DM ha−1), ‘Mulato’ (648 kg DM ha−1), and ‘Kennedy’ (488 kg DM ha−1). A previous study reported that ‘Basirisk’ and ‘Marandu’ had a more substantial root amount than ‘Mulato II’ [29].
The total root amount and the BNI activity in the root tissue of several Brachiaria sp. cultivars are indicated in Table 3. Although all lines had some amounts of BNI activity in their root tissue, the seven Brachiaria genetic stocks tested in this study can be grouped into two: the high group–‘Kennedy’, ‘Mulato’, ‘Mulato II’, and ‘Tupy’, which had BNI activity in their root tissue ranging from 200 to 210 ATU g−1 DM and the low group, ‘Marandu’, ‘Basirisk’, and ‘Tully’, which had BNI activity in their root tissue, ranging from 175 to 185 ATU g−1 DM.
To better understand the impact of root exudate and root tissue BNI activity, we roughly estimated daily BNI activity values (ATU g−1 root DM d−1, reported in Table 1) i.e., daily BNI values are assumed constant, whereas root exudates vary depending on the soil type and climate conditions. The estimated total BNI activity from the root tissues considering root turnover ranged from 144 million ATU ha−1 year−1 in ‘Kennedy’ to 289 million ATU ha−1 year−1 in ‘Basirisk’. The BNI activity in plant roots is expressed by the release of BNI substances, Brachialactone, during plant decomposition.
However, further investigations are necessary to understand the seasonal changes of BNI in root exudate and to monitor the root turnover.

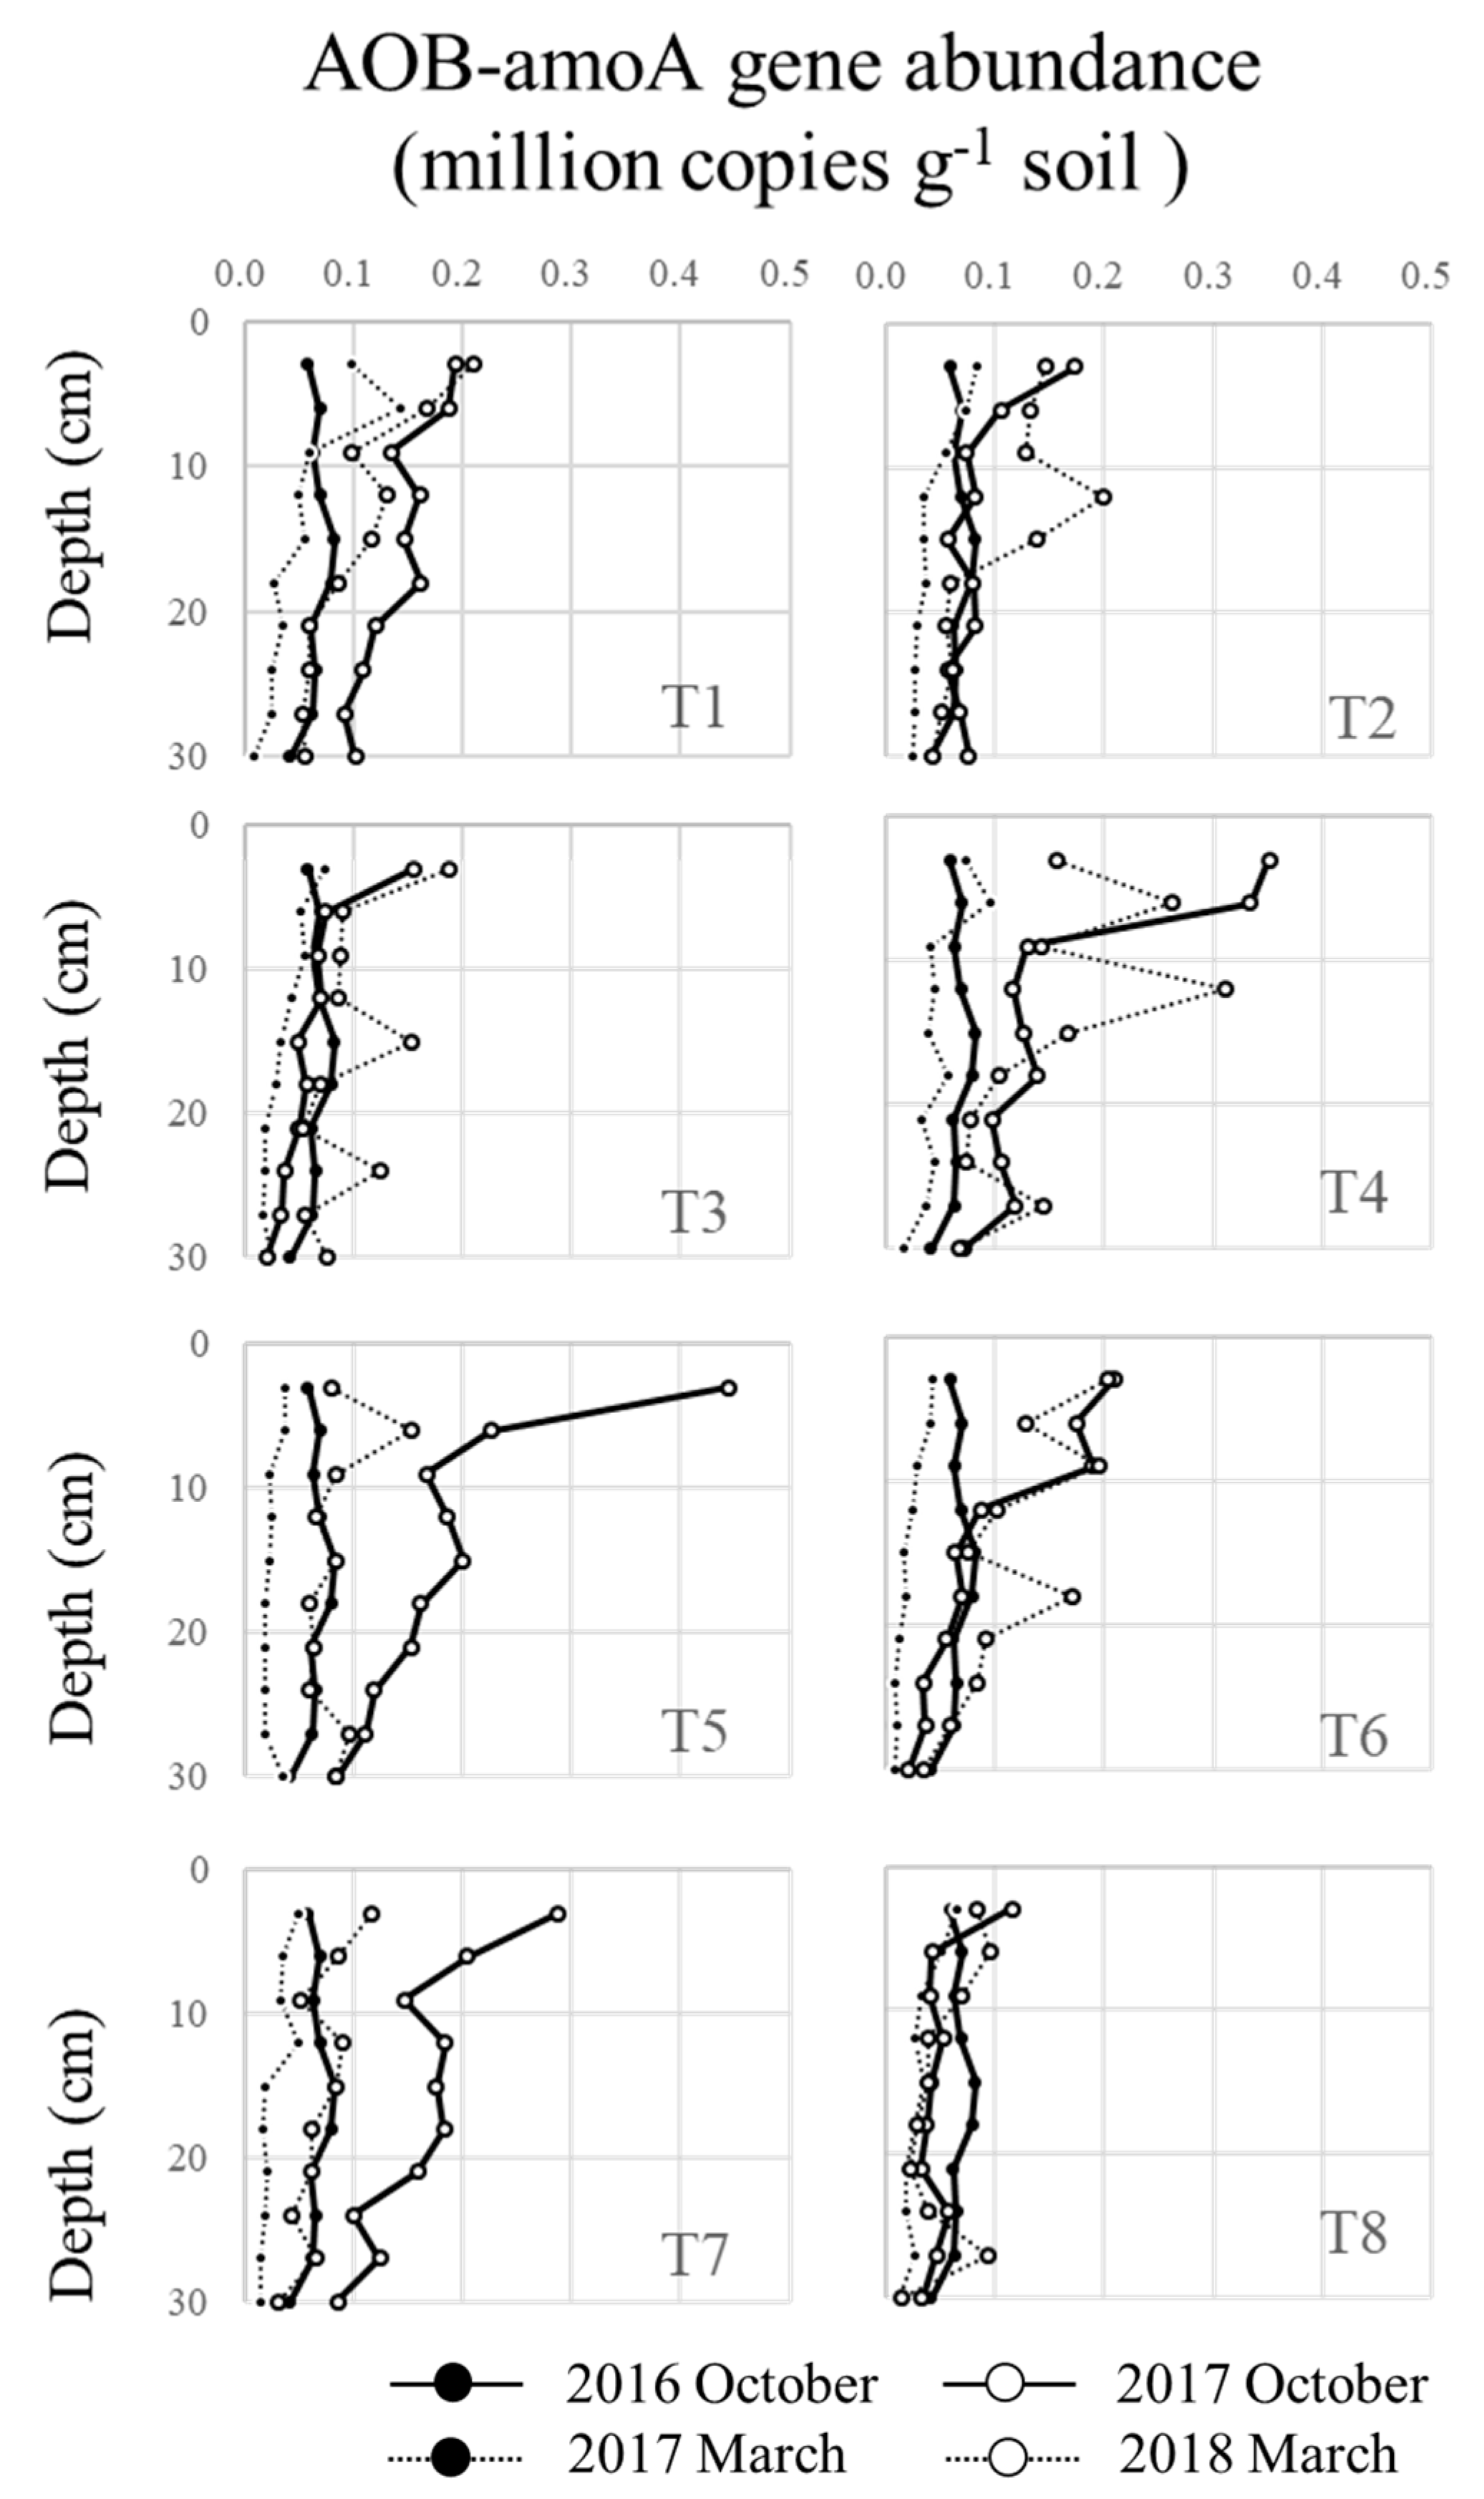
3.3. Seasonal and Profile Changes in AOB and AOA under Brachiaria Cultivation

Figure 4 illustrates the seasonal changes and the changes of AOB abundance along the soil profile under several Brachiaria sp. cvs cultivation. The results show that AOB generally increased as time progressed, although the increase rate differed among the seven varieties tested. Results suggest that AOB increases with plant growth, reflecting the supply of organic matter due to plant root decomposition. Brachiaria cvs. ‘Mulato’, ‘Mulato II’, ‘Tupy’, and ‘Tully’ expressed a clear increase in AOB amoA genes during the later growth stage (October 2017 and March 2018). In the earlier stage (October 2016 to March 2017), there was no significant increase in AOB populations in all Brachiaria field plots, possibly because plants were in the stage of root elongation with little root decomposition. Figure 5 shows the vegetative coverage change from October 2016 to March 2017. Most of the tested Brachiaria lines showed good growth except the two lines of B. humidicola (‘Tupy’ and ‘Tully’). Although ‘Tupy’ and ‘Tully’ reached 100% of vegetative coverage, they showed slower growth than the other tested lines. After the vegetative coverage attained 100%, it remained at approximately this level until the end of the experiment.
On the other hand, AOA populations in Brachiaria sp. experimental plots changed with seasonal conditions (Figure 6). In general, the abundance levels of AOA amoA genes were higher during October (2016, 2017), but decreased during March (2017, 2018) as shown in Figure 6. This result seemed to have indicated that the AOA growth was, to some extent, influenced by soil temperature and/or soil water status. Besides the environmental factors, plant growth also affected the dynamics of AOA populations, since the patterns of AOA abundance varied among groups.

3.4. Relationships between Ammonium Oxidizers and Potential Nitrification

The BNI effect from Brachiaria sp. pastures has been mainly explained by the BNIs released from root exudation [1]. However, it can be considered that the BNI compound in root tissue can also contribute to the overall inhibitory effect on nitrification from Brachiaria pastures and has been hypothesized to be through root turnover and decomposition [1]. This hypothesis seemed important because BNIs are constantly released from roots over a long period. Supplementation with BNIs added from root turnover determines soil nitrifier activity and soil-N dynamics; this can have a significant impact on nitrogen recovery of the subsequent annual crop that follows Brachiaria cultivation.
As indicated above, ammonium oxidizers showed seasonal changes, due to plant growth stage for AOB and environmental factors for AOA in the study site. To estimate the impact of Brachiaria cultivation during the cultivation period, the cumulative nitrification rate was calculated, and the results of 1.5 years were reported and shown in Figure 7. Five lines (‘Marandu’, ‘Mulato’, ‘Mulato II’, ‘Tupy’, and ‘Tully’) presented significant inhibition on potential soil nitrification compared to the control, and also ‘Marandu’, ‘Mulato’, and ‘Tupy’ had significantly higher inhibition compared to ‘Mulato II’ and ‘Tully’. Therefore, ‘Marandu’, ‘Mulato’, and ‘Tupy’ would be recommended for higher inhibition of soil nitrification in Brachiaria-based cropping systems. These three lines inhibited the nitrification by 32.2, 38.5, and 36.0 mg N kg−1 1.5 year−1, respectively. Byrnes et al. reported that ‘Tully’ inhibits nitrification stronger than ‘Mulato’ under bovine urine patches [4]. Our results did not support such notions, although both lines showed a significant nitrification inhibition effect. On the other hand, ‘Basirisk’ and ‘Kennedy’ showed comparable nitrification rate with the control. Interestingly, these two lines presented also the lowest BNI activities.
The relationships between potential nitrification and changes in AOB and AOA amoA genes against the control are shown in Figure 8. Changes of AOA showed a significant (p < 0.05) correlation with potential nitrification rate, while those of AOB did not show a significant correlation.
Several studies have reported AOB as being the leading players for nitrification [30,31], while other reports showed a higher contribution of AOA [32,33]. Although this is still debatable, Taylor et al. evoked that the contributions of nitrifiers on soil nitrification potential are related to their abundance [34]. These authors found an increase in AOB abundance under N fertilization, while the AOA population was more important in the absence of fertilization. In the present study, we applied N at a rate of 10 kg N ha−1. Due to this low N supply, the limited N condition in the study site may have favored AOA over AOB. The AOA abundance was 10−100 times higher than that of AOB. Ultimately, the impact of BNI on nitrifiers was more pronounced for AOA than AOB. Accordingly, our results suggest that BNI in Brachiaria inhibits soil nitrification through the abundance of AOA in the study site. In our study, the initial population of AOB was very low, which may be the reason why we did not observe any impacts of BNI on the inhibition of AOB. Although AOA outnumbered AOB, AOB abundance under Brachiaria was higher than the AOB abundance of the control. As discussed above, AOB was mostly affected by organic matter supply, which explained the fact that AOB are more abundant under Brachiaria plants than under control. Moreover, the observed continuous increase in NH4+-N over time following root decomposition may have favored the autotrophic AOB, which uses the ammonia source for their metabolism as reported in other studies [35,36]. Furthermore, in October 2017, low AOB abundance was recorded while the potential nitrification rate was higher. This high potential nitrification values obtained while AOB abundance was low can be understandable since, at this period, we observed an overall increase in AOA abundance at the top 9 cm, and these AOA may drive the observed higher PNR in the case of absence of inhibition by BNIs. Moreover, in this study, the DNA-based amoA genes were quantified and not the rRNA based abundance, which provides more accurate information in terms of nitrifier activity.
On the aspect of differences among Brachiaria sp. in their BNI capacity, the average of ΔAOA against control is shown in Figure 9. It almost matched the result of the cumulative nitrification rate shown in Figure 7. The highest inhibitory effect on AOA abundance was obtained in ‘Tupy’, followed by ‘Tully’, ‘Mulato’, and then ‘Marandu’. In contrast, AOA abundance in field plots of ‘Kennedy’ was higher than that of the control plots. Therefore, we concluded that ‘Tupy’, ‘Mulato’, and ‘Marandu’ had higher BNI capacity among the seven Brachiaria cultivars evaluated in this study.

3.5. Effect of BNI Activity in Root Exudate and Root Tissue Decomposition

The 1.5 years cultivation of Brachiaria grasses led to an increase in soil organic matter, available soil-N, and soil NH4+-N, but a decrease in AOA compared to the control. These results suggest that nitrification under Brachiaria cultivation is influenced by soil organic matter (SOM) additions from root turnover/decomposition, a decrease of AOA by the BNIs added from root exudation, and root tissue decomposition from root turnover. Multiple regression analysis was performed to estimate the contributions of organic matter supply and BNI compound release.
As discussed above, BNI activity in root exudate is an experimental value that is determined using seedlings cultivated in hydroponics [1,6]. So, it involves some error for both, the estimation of its contribution to nitrification inhibition and the estimated values of root turnover. Thus, the result of multiple regression analysis should be considered as rough estimates which may contribute to understanding the possible impact of BNIs from root exudate and root tissues in the present study site.
As a result, we got significant multiple regression for the entire period of Brachiaria cultivation and each season, although the determination coefficient (R2) was just 0.091 (p < 0.001) for the entire period (Table 4). Standard regression coefficients, which show the rate of contribution for determination, were 0.261 for BNI activity in root tissue, 0.109 for BNI activity in root exudate, and -0.205 for available N content. These data suggest that BNI released from the root turnover contributed to nitrification inhibition significantly, while the available N contributed negatively to nitrification inhibition. Most of the previous studies consider that BNI phenomenon was caused mostly by BNI activity release from exudation [1,6,16] but our results showed that BNI released from root tissue also had a significant contribution to the inhibitory effect from Brachiaria sp. in the field.
Furthermore, multiple regression analysis using every six months showed the changes in contributions of each variable for the determination coefficient. Although in March and October 2017, available N had a relatively strong negative influence, there was no significant contribution in March 2018.
Although BNI in root exudate showed significant contribution in October 2017, there were no significant contributions in the entire period. It is important to note that BNI activity in root exudate may also have seasonal change. We calculated BNI in root exudate as a fixed value, but it must change with the plant growth stage. If the specific BNI activity in root exudate showed a higher value than this fixed value, the contribution of root exudate on nitrification inhibition must be more extensive. Therefore, further studies are necessary for the time-sequential changes of N dynamics under BNI plant cultivation, including plant uptake.

4. Conclusions

Seven cultivars of Brachiaria grass were grown in a field to evaluate the overall contribution of Brachiaria BNI on N-cycling and nitrifier populations. We found out that Brachiaria cultivation increased the soil-NH4+-N, available soil-N, and total carbon content in the soil, reflecting organic matter supply through plant root decomposition. Such root decomposition also added BNIs in the process, which needs consideration.
The monitoring of plant root growth and changes of AOB and AOA under Brachiaria cultivation suggests that AOB was affected by organic matter supply while AOA was affected by the time of year. The relationship between potential nitrification rate and changes of AOB was not significant, possibly because AOB changes from BNI activity were masked by the increase in total bacteria. On the other hand, the potential nitrification rate decreased as AOA decreased indicating that the observed inhibitory effect following Brachiaria cultivation was mainly related to a reduction of AOA populations. Results indicate that ‘Marandu’, ‘Mulato’, and ‘Tupy’ had the highest BNI effect among the seven Brachiaria sp. cultivars tested.
According to multiple regression analysis, we could relate nitrification inhibition to the total BNI activities of root tissue and the available N content. Nonetheless, the entire BNI activities of root exudate showed only a slight contribution to nitrification inhibition, possibly due to their changes with root growth and/or field conditions. In conclusion, the release of BNI substances through plant decomposition contributes to the nitrification inhibition by inhibiting the abundance of AOA in the study site.

Author Contributions

S.N. designed the work, executed field trial and sampling, analyzed the data, wrote the manuscript. P.S.S. participated in sampling and manuscript editing. M.T. performed chemical and molecular analysis. Y.A. performed molecular analysis. G.V.S. revised the draft. All authors have read and agreed to the published version of the manuscript.

Funding

This research received no external funding.

Acknowledgments

Authors are grateful to Shinkichi Goto and Ken Okamoto, and all the technical staff of JIRCAS-TARF for managing the field experiment, and for providing weather data. We appreciate Kazuhiro Suenaga’s help for giving us the information about each Brachiaria grass.

Conflicts of Interest

The authors declare no conflicts of interest.

References

  1. Subbarao, G.V.; Nakahara, K.; Hurtado, M.P.; Ono, H.; Moreta, D.E.; Salcedo, A.F.; Yoshihashi, T.; Ishikawa, T.; Ishitani, M.; Ohnishi-Kameyama, M.; et al. Evidence for biological nitrification inhibition in Brachiaria pastures. Proc. Natl. Acad. Sci. USA 2009, 106, 17302–17307. [Google Scholar] [CrossRef] [PubMed] [Green Version]
  2. Subbarao, G.V.; Arango, J.; Masahiro, K.; Hooper, A.M.; Yoshihashi, T.; Ando, Y.; Nakahara, K.; Deshpande, S.; Ortiz-Monasterio, I.; Ishitani, M.; et al. Genetic mitigation strategies to tackle agricultural GHG emissions: The case for biological nitrification inhibition technology. Plant Sci. 2017, 262, 165–168. [Google Scholar] [CrossRef]
  3. Coskun, D.; Britto, D.T.; Shi, W.; Kronzucker, H.J. Nitrogen transformations in modern agriculture and the role of biological nitrification inhibition. Nat. Plants 2017, 3, 17074. [Google Scholar] [CrossRef] [PubMed]
  4. Brynes, R.C.; Nùñez, J.; Arenas, L.; Rao, I.; Trujillo, C.; Alvarez, C.; Arango, J.; Rasche, F.; Chirinda, N. Biological nitrification inhibition by Brachiaria grasses mitigates soil nitrous oxide emissions from bovine urine patches. Soil Biol. Biochem. 2017, 107, 156–163. [Google Scholar] [CrossRef]
  5. Karwat, H.; Moreta, D.; Arango, J.; Núñez, J.; Rao, I.; Rincón, Á.; Rasche, F.; Cadisch, G. Residual effect of BNI by Brachiaria humidicola pasture on nitrogen recovery and grain yield of subsequent maize. Plant Soil 2017, 420, 389–406. [Google Scholar] [CrossRef]
  6. Subbarao, G.V.; Wang, H.Y.; Ito, O.; Nakahara, K.; Berry, W.L. NH4+ triggers the synthesis and release of biological nitrification inhibition compounds in Brachiaria humidicola roots. Plant Soil 2007, 290, 1–2. [Google Scholar] [CrossRef]
  7. Moreta, D.E.; Arango, J.; Sotelo, M.; Vergara, D.; Rincon, A.; Ishitani, M.; Castro, A.; Miles, J.; Peters, M.; Tohme, J.; et al. Biological nitrification inhibition (BNI) in Brachiaria pastures: A novel strategy to improve eco-efficiency of crop-livestock systems and to mitigate climate change. Trop. Grassl. 2014, 2, 88–91. [Google Scholar] [CrossRef]
  8. Subbarao, G.V.; Nakahara, K.; Ishikawa, T.; Ono, H.; Yoshida, M.; Yoshihashi, T.; Sahrawat, K.L. Biological nitrification inhibition (BNI) activity in sorghum and its characterization. Plant Soil 2013, 366, 243–259. [Google Scholar] [CrossRef] [Green Version]
  9. Zhang, M.; Fan, C.H.; Li, Q.L.; Li, B.; Zhu, Y.Y.; Xiong, Z.Q. A 2-yrfield assessment of the effects of chemical and biological nitrification inhibitors on nitrous oxide emissions and nitrogen use efficiency in an intensively managed vegetable cropping system. Agric. Ecosyst. Environ. 2015, 201, 43–50. [Google Scholar] [CrossRef]
  10. Gopalakrishnan, S.; Subbarao, G.V.; Nakahara, K.; Yoshihashi, T.; Ito, O.; Maeda, I.; Ono, H.; Yoshida, M. Nitrification Inhibitors from the Root Tissues of Brachiaria humidicola, a Tropical Grass. J. Agric. Food Chem. 2007, 55, 1385–1388. [Google Scholar] [CrossRef]
  11. Kanno, T.; Macedo, M.C.; Euclides, V.P.B.; Bono, J.A.; Santos, J.D.G.; Rocha, M.C.; Bereta, L.G. Root biomass of five tropical grass pastures under continuous grazing in Brazilian savannas. J. Jpn. Grassl. Sci. 1999, 45, 9–14. [Google Scholar]
  12. Santos, F.L.F. Seed production: Perspective from the Brazilian private sector. In Brachiaria: Biology, Agronomy and Improvement; Miles, J.W., Maass, B.L., do Valle, C.B., Eds.; CIAT, Cali, Colombia and CNPGC/EMBRAPA: Campo Grande, MS, Brazil, 1996; pp. 141–146. [Google Scholar]
  13. Kouki, K.; Ebina, M. Breeding and forage utilization of Brachiaria grass (Brachiaria spp.). J. Jpn. Grassl. Sci. 2009, 55, 179–187. (In Japanese) [Google Scholar]
  14. Argel, P.J.; Miles, J.W.; Guiot, J.D.; Carolos, E.; Lascano, C.E. Cultivar Mulato (Brachiaria hibrido CIAT36061). 2001. Available online: https://core.ac.uk/download/pdf/132682261.pdf (accessed on 1 March 2020).
  15. Argel, P.J.; Miles, J.W.; Guiot, J.D.; Cuadrado, H.; Lascano, C.E. Cultivar Mulato II (Brachiaria Hybrid CIAT 36087): A High Quality Forage Grass, Resistant to Spittlebugs and Adapted to Well-Drained, Acid Tropical Soils; International Center for Tropical Agriculture (CIAT): Cali, Colombia, 2007; p. 21. [Google Scholar]
  16. Subbarao, G.V.; Ishikawa, T.; Ito, O.; Nakahara, K.; Wang, H.Y.; Berry, W.L. A bioluminescence assay to detect nitrification inhibitors released from plant roots: A case study with Brachiaria humidicola. Plant Soil 2006, 288, 101–112. [Google Scholar] [CrossRef]
  17. Loughran, R.J.; Wallbrink, P.J.; Walling, D.E.; Appleby, P.G. Sampling methods. In Handbook for the Assessment of Soil Erosion and Sedimentation Using Environmental Radionuclides; Springer: Berlin/Heidelberg, Germany, 2002; Chapter 3; pp. 41–57. [Google Scholar]
  18. Matsuda, N.; Mikami, S.; Shimoura, S.; Takahashi, J.; Nakano, M.; Shimada, K.; Uno, K.; Hagiwara, S.; Saito, K. Depth profiles of radioactive cesium in soil using a scraper plate over a wide area surrounding the Fukushima Dai-ichi Nuclear Power Plant. Jpn. J. Environ. Radioact. 2015, 139, 427–434. [Google Scholar] [CrossRef] [Green Version]
  19. Ma, L.; Oshima, M.; Motomizu, S.; Hattori, T. Simultaneous determination of nitrate and nitrite ion by micro-flow injection analysis. Jpn. Analyst. 1998, 47, 375–380. [Google Scholar] [CrossRef] [Green Version]
  20. Nelson, D.W. Determination of ammonium in KCl extracts of soils by the salicylate method. Commun. Soil Sci. Plant Anal. 1983, 14, 1051–1062. [Google Scholar] [CrossRef]
  21. Uezono, I.; Kano, N.; Moriizumi, M. Applicability of rapid analysis by 80 °C-16 h hot water extraction for estimating available nitrogen in upland soil in Japan. Jpn. J. Soil Sci. Plant Nutr. 2010, 81, 39–43. [Google Scholar]
  22. Belser, L.W.; Mays, E.L. Specific inhibition of nitrite oxidation by chlorate and its use in assessing nitrification in soils and sediments. Appl. Environ. Microbiol. 1980, 39, 505–510. [Google Scholar] [CrossRef] [Green Version]
  23. Schneider, C.A.; Rasband, W.S.; Eliceiri, K.W. NIH Image to ImageJ: 25 years of image analysis. Nat. Methods 2012, 9, 671–675. [Google Scholar] [CrossRef]
  24. Tsujimoto, Y.; Pedro, A.J.; Boina, G.; Murracama, V.M.; Tobita, S.; Oya, T.; Nakamura, S.; Cuambe, E.C.; Martinho, C. An application of digital imagery analysis to understand the effect of N application on light interception, radiation use efficiency, and grain yield of maize under various agro-environments in Northern Mozambique. Plant Prod. Sci. 2017, 20, 12–23. [Google Scholar] [CrossRef]
  25. Cardoso, J.A.; Jimenez, J.C.; Gichangi, E.; Njarui, D.M.G.; Mutimura, M.; Rao, I.M. Climate-smart Brachiaria grasses: Progress in identifying the role of root traits in soil carbon accumulation. In Proceedings of the Poster presentation in 9th International Symposium of Root Research, Canberra, Australia, 5–9 October 2015. [Google Scholar]
  26. Sarr, P.S.; Ando, Y.; Nakamura, S.; Deshpande, S.; Subbarao, G.V. Sorgoleone release from sorghum roots shapes the composition of nitrifying populations, total bacterial and archaea and determines the level of nitrification. Biol. Fertil. Soils 2020, 56, 145–166. [Google Scholar] [CrossRef] [Green Version]
  27. Rao, I.M.; Plazas, C.; Ricaurte, J. Root turnover and nutrient cycling in native and introduced pastures in tropical savannas. In Plant Nutrition; Developments in Plant and Soil Sciences; Horst, W.J., Schenk, M.K., Bürkert, A., Claassen, N., Flessa, H., Frommer, W.B., Goldbach, H., Olfs, H.W., Römheld, V., Sattelmacher, B., et al., Eds.; Springer: Dordrecht, The Netherlands, 2001; Volume 92, pp. 976–977. [Google Scholar] [CrossRef]
  28. Horrocks, C.A.; Arango, J.; Arevalo, A.; Nuñez, J.; Cardoso, J.A.; Dungait, J.A.J. Smart forage selection could significantly improve soil health in the tropics. Sci. Total. Environ. 2019, 688, 609–621. [Google Scholar] [CrossRef] [PubMed]
  29. Gichangi, E.M.; Njarui, D.M.G.; Gatheru, M. Plant shoots and roots biomass of Brachiaria grasses and their effects on soil carbon in the semi-arid tropics of Kenya. Trop. Subtrop. Agroecosyst. 2017, 20, 65–74. [Google Scholar]
  30. Di, H.; Cameron, K.; Shen, J.; He, J. Nitrification driven by bacteria and not archaea in nitrogen-rich grassland soils. Nat. Geosci. 2009, 2, 621–624. [Google Scholar] [CrossRef]
  31. Banning, N.; Maccarone, L.; Fisk, L.; Murphy, D.V. Ammonia-oxidising bacteria not archaea dominate nitrification activity in semi-arid agricultural soil. Sci. Rep. 2015, 5, 11146. [Google Scholar] [CrossRef] [Green Version]
  32. Zhang, L.; Hu, H.; Shen, J.; He, J. Ammonia-oxidizing archaea have more important role than ammonia-oxidizing bacteria in ammonia oxidation of strongly acidic soils. ISME J. 2012, 6, 1032–1045. [Google Scholar] [CrossRef] [Green Version]
  33. Hu, H.; Xu, Z.; He, J. Ammonia-Oxidizing Archaea play a predominant role in acid soil nitrification. Adv. Agron. 2014, 125, 261–294. [Google Scholar] [CrossRef]
  34. Taylor, A.E.; Zeglin, L.H.; Wanzek, T.A.; Myrold, D.D.; Bottomley, P.J. Dynamics of ammonia-oxidizing archaea and bacteria populations and contributions to soil nitrification potentials. ISME J. 2012, 6, 2024–2032. [Google Scholar] [CrossRef]
  35. Di, H.J.; Cameron, K.C.; Shen, J.; Winefield, C.S.; O’Callaghan, M.; Bowatte, S.; He, J. Ammonia-oxidizing bacteria and archaea grow under contrasting soil nitrogen conditions. FEMS Microbiol. Ecol. 2010, 72, 386–394. [Google Scholar] [CrossRef] [Green Version]
  36. Verhamme, D.T.; Prosser, J.I.; Nicol, G.W. Ammonia concentration determines differential growth of ammonia-oxidising archaea and bacteria in soil microcosms. ISME J. 2011, 5, 1067–1071. [Google Scholar] [CrossRef] [Green Version]
Figure 1. Precipitation and daily mean temperature during the experiment.
Agronomy 10 01003 g001
Figure 2. Relationship between root mass and soil total carbon, NH4+-N, and available N. Black circle indicates the values of ‘Kennedy’, while the white circles indicate the other seven treatments including control. Regression lines were calculated using white circles data. Asterisks shows significance using p-value; * p < 0.05.
Agronomy 10 01003 g002
Figure 3. Seasonal and profile changes of plant roots abundance under the seven Brachiaria cultivations T1: Marandu, T2: Basirisk, T3: Kennedy, T4: Mulato, T5: Mulato II, T6: Tupy, T7: Tully, T8: Control. The bars indicate Fisher’s LSD (p < 0.05) in each depth (n = 3).
Agronomy 10 01003 g003
Figure 4. Seasonal and profile changes of ammonia-oxidizing bacteria (AOB) gene abundance under the seven Brachiaria cultivations T1: Marandu, T2: Basirisk, T3: Kennedy, T4: Mulato, T5: Mulato II, T6: Tupy, T7: Tully, T8: Control.
Agronomy 10 01003 g004
Figure 5. Changes of vegetative coverage in the seven Brachiaria grasses for 5 months growth after transplanting Error bars are standard error (n = 3). Brachiaria grasses were transplanted on October 20th, 2016.
Agronomy 10 01003 g005
Figure 6. Seasonal and profile changes of AOA under the seven Brachiaria cultivations. T1: Marandu, T2: Basirisk, T3: Kennedy, T4: Mulato, T5: Mulato II, T6: Tupy, T7: Tully, T8: Control.
Agronomy 10 01003 g006
Figure 7. Cumulative nitrifications rate in each treatment. Error bar indicates standard error (n = 3), different letters indicate significant differences by Tukey’s HSD method. Cumulative nitrification rate is the total amount of potential nitrification in 1.5 years, which was calculated as the sum of averaged potential nitrification rate (mg N kg−1 day−1) multiplied by the numbers of the days.
Agronomy 10 01003 g007
Figure 8. Relationships between potential nitrification rate and changes of AOB (left) and AOA (right) against control in three seasons. ΔAOB and ΔAOA were calculated as the difference of amoA gene copies of AOB and AOA between Brachiaria cultivars and Control. Each data indicates mean value of 0–30 cm depths.
Agronomy 10 01003 g008
Figure 9. Difference of AOA changes among seven Brachiaria cultivars. Error bars are standard error (n = 3), different letters indicate significant differences by Tukey’s HSD method. ΔAOA was calculated as the difference of amoA gene copies of AOA between Brachiaria cultivars and Control. Each data indicates mean value of 0–30 cm depths.
Agronomy 10 01003 g009
Table 1. Investigated Brachiaria lines and its biological nitrification inhibition (BNI) activity in root exudate.
VarietyCIAT No.BNI Activity in Root Exudate
ATU †† g−1 Root DM d−1 (year−1)
References
T1Brachiaria brizantha cv.MaranduCIAT62942.0 (730)[6]
T2B. decumbens cv.BasiriskCIAT60618.3 (6680)[6]
T3B. ruziziensis cv.KennedyCIAT60524.4 (8906)Subbarao (unpublished data)
T4B. hybrid cv.MulatoCIAT360613.0 to 10.0 (1095 to 3650)[1]
T5B. hybrid cv.Mulato IICIAT36087N.D.
T6B. humidicola cv.TupyCIAT2615946.3 (16900)[6]
T7B. humidicola cv.TullyCIAT67917.5 (6388)[6]
T8Bare soil as control
† CIAT: International Center for Tropical Agriculture. †† ATU: Allylthiourea (AT) unit defined for inhibitory effect [15].
Table 2. Soil nitrogen fertility after 18 months’ cultivation of seven Brachiaria.
Lab IDCultivarpH (H2O)T-NT-CC/NNO3-NNH4+-NAvailable N
g kg−1mg N kg−1
T1Marandu6.83 b0.779 6.11 ab7.81 ab1.09 bc8.66 b32.4 ab
T2Basirisk6.80 b0.771 6.24 ab8.07 ab1.20 b9.70 ab31.9 ab
T3Kennedy6.77 b0.791 6.65 a8.34 a0.97 bc11.72 a33.8 ab
T4Mulato6.69 b0.769 5.89 b7.63 ab1.03 bc9.17 b31.2 ab
T5Mulato II6.81 b0.782 6.07 ab7.74 ab0.95 bc10.27 a30.7 ab
T6Tupy7.17 a0.741 5.78 b7.76 ab0.77 bc8.99 b30.9 ab
T7Tully6.73 b0.774 6.37 ab8.17 ab0.60 c9.71 ab34.9 a
T8Control6.67 b0.750 5.64 b7.51 b1.69 a7.68 b27.5 b
ANOVAp-value***n.s.**********
For each soil parameter, values followed by different letters are significantly different at p < 0.05. Asterisks in ANOVA indicate p < 0.001 (***), p < 0.01 (**), p < 0.05 (*), following Tukey’s HSD test. n.s. signifies no significance. T-N: total nitrogen, T-C: total carbon.
Table 3. BNI activity in root tissue in the seven cultivars of Brachiaria.
Root MassBNI Activity in Root TissueEstimated Root Length TurnoverEstimated Annual BNI Activity
Treatment0–30 cm0–9 cmRoot Exudate (A)Root Tissue (B)Total BNI (A + B)
kg DM ha−1ATU g−1 Root DMYear−1Million ATU ha−1 year−1
T1Marandu849 334174.9 a1.39619 206 826
T2Basirisk1147 557174.5 a1.447661 289 7951
T3Kennedy488 326207.0 b1.434343 144 4486
T4Mulato648 309200.5 b1.412366 183 2550
T5Mulato II855 341202.8 b1.433121 247 3369
T6Tupy699 239208.6 b1.3111,804 192 11,996
T7Tully1109 698183.2 a1.327082 269 7351
Estimated annual BNI activity from root exudate (A) was calculated as BNI activity in root exudate (ATU g−1 root DM day−1), as shown in Table 1, multiplied by the root mass at 0-30 cm depth (kg DM ha−1). Estimated annual BNI activity from root tissue (B) was calculated as BNI activity in root tissue (ATU g−1 root DM) multiplied by root mass (kg DM ha−1) and estimated root length turnover (year−1). Root length turnover was estimated from C/N ratio using the formula calculated from data shown in Cardoso et al.; root length turnover = 0.00349 × C/N ratio of plant root + 1.0689 (R2 = 0.6542). In BNI activity in root tissue, values followed by different letters are significantly different at p < 0.05.
Table 4. Regression coefficients of multiple regression equations for the entire period and every six months.
Explanatory Variables1.5 year
(0–18 Months)
2017 March
(0–6 Months)
2017 October
(6–12 Months)
2018 March
(12–18 Months)
Partial Standard †† Partial Standard Partial Standard Partial Standard
b00.042 * 0.126 *** 0.086 ** −0.036 n.s.
b1: (Total BNI in root tissue)0.001 ***0.2610.003 ***0.4020.002 ***0.5270.002 **0.362
b2: (Total BNI in root exudate)0.000 n.s.0.1090.000 n.s.−0.1390.000 *0.2700.000 n.s.0.163
b3: (Available N)−0.003 **−0.205−0.007 **−0.389−0.007 ***−0.6180.001 n.s.0.050
R20.091 *** 0.245 *** 0.324 *** 0.193**
The response variable in the multiple regression analysis was the nitrification inhibition and was calculated as the difference of potential nitrification rate against control in each season (mg N kg−1 day−1). partial regression coefficient, and †† standard regression coefficient. Significance of partial regression coefficient and the determination coefficient were expressed as follows: n.s.—not significant, *: p < 0.05, **: p < 0.01, ***: p < 0.001, respectively.

