Article

Potential of Biochar to Alternate Soil Properties and Crop Yields 3 and 4 Years after the Application

1
Department of Biometeorology and Hydrology, Faculty of Horticulture and Landscape Engineering, Slovak University of Agriculture, 949 76 Nitra, Slovakia
2
Department of Soil Science, Faculty of Agrobiology and Food Resources, Slovak University of Agriculture, 949 76 Nitra, Slovakia
*
Authors to whom correspondence should be addressed.
Agronomy 2020, 10(6), 889; https://doi.org/10.3390/agronomy10060889
Submission received: 30 May 2020 / Revised: 18 June 2020 / Accepted: 19 June 2020 / Published: 22 June 2020
(This article belongs to the Special Issue Impact of Biochar and Compost on Soil Quality and Crop Yield)

Abstract

:
Several studies have reported that biochar can improve soil properties which are linked with higher crop yields and this effect is long-term. This paper aimed to study the effects of biochar (0, 10 and 20 t ha−1) and its combinations with N-fertilization (zero, first and second level of N-fertilization) after 3 and 4 years of its application on improving soil characteristics of loamy Haplic Luvisol and crop yields (Dolná Malanta, Slovakia). The results indicated an increase in soil pH (+7%), improvement in sorption properties (hydrolytic acidity decreased by 11%, sum of basic cations and base saturation increased by 20% and 5%, respectively) and soil organic carbon rose by 27% with increasing biochar rate in the soil. N-fertilization applied to biochar treatments was a stabilizing moment in C sequestration even in the case of its labile forms. Overall, humus stability and quality were not significantly changed, however in biochar treatments without N-fertilization, the humus stability and quality decreased 3 and 4 years after biochar application. Yield parameters differed with relation to climate conditions during both vegetation crop seasons, however the combination of 20 t ha−1 of biochar with the first and second level of N-fertilization had the highest potential to increase the grain yield.

1. Introduction

Soil fertility decline is a major factor that prevents realizing food productivity potential. Around 1.5 billion hectares of cropland globally has been degraded [1]. Since soil resources are finite, requisite measures are required to rejuvenate degraded soils and wastelands. Areas excluded from cultivation due to social and economic reasons are replenished by reclaiming these lands and by arresting further loss of production potential [2]. If we want to manage soil efficiently and economically, we need to know its characteristics, the causes of low fertility and ways to eliminate them. Only such an approach enables the rational use of land resources and the high cost-effectiveness needed to stabilize and increase the fertility and production capacity of soils. One way to reduce this problem is to apply sustainable agriculture strategies that minimize adverse impacts of farming on the environment, e.g., a reduction of agrochemicals, while also increasing the interaction and synergism between various components of agroecosystems [3].
There is no need to think of new ways—the inspiration can be taken from the past. Several examples are known in history, when people living at that time tried to improve soil properties by applying, for example, ash, imperfectly burned wood, etc., and its accumulation in the soil had a profound effect on improving soil properties. The most well-known example in the literature is the creation of man-made dark soils (Chernozems), also called Terra Preta de Índio, more than 8000 years ago by the Amazon native inhabitants. These soils were created thanks to the massive accumulation of organic waste materials such as kitchen debris, excrement and waste biomass, along with the remains of unburned wood, which were further decomposed [4]. Similar soils have been documented in some other countries of South America and Western and South Africa [5]. As it is known, these soils are characterized by high fertility [6,7]. According to Kuzyakov et al. [8] Glinka was the first to recognize the importance of pyrogenic C in the year 1914: “There was almost no soil profile, in which charcoal particles did not occur in the upper horizon.” In contrast to many other topics in soil science, the importance of ash and fire, char and biochar for processes in soils was recognized only two to three decades ago. Biochar related to the Terra Preta de Índio phenomenon and many environmental benefits reported in various studies has become a hot topic for many scientific teams [5,9,10,11,12]. The soils throughout the world contain specific amounts of biochar as a result of natural events such as natural fires, paleo fires [8] and land use history—deforestation, pre-industrial charcoal kilns and anthropogenic oven mounds [8,13]. The attention of the scientific community is directed to the production of biochar itself, which is then applied to the soil as a potential soil improver. A number of reviews and studies have highlighted the potential benefits of utilizing biochar as a soil amendment [7,14,15,16]. Many studies have shown that biochar is a potential soil amendment to improve physical [6,12], chemical [3,17,18] and biological properties [6,19] of soils. The agronomic value of biochar mainly resides in its value as a fertilizer and its ability to improve soil properties and increase crop production [20,21,22,23].
The scientific reviews, e.g., References [21,23,24,25,26,27], summarizing the current knowledge and findings on biochar according to specific criteria are of rising importance because of increasing amounts of pot and field studies conducted under various conditions. In their review, Yu et al. [23] reported the effect of biochar application on crop yields’ increase after the application in problematic soils (acidic, alkaline, saline, as well as contaminated soils). In acidic soils, biochar can at least partially neutralize soil acidity due to its own alkalinity and high pH buffering capacity. Shift in pH and the reduction in Al can increase the bioavailability of P, Ca and Mg, resulting in enhanced plant growth. In alkaline soils, acidic biochar should be used to shift pH and improve the availability of P, Fe and Mg for plants. The authors further mentioned that biochar application to saline and sodic soils can directly improve the plant growth by adsorption of Na onto biochar surfaces or entrapment of Na in biochar pore structure and the release of plant essential nutrients, such as K, Ca, Mg, Mn, Cu, and Zn, helping to offset the adverse impacts of salts. In soils contaminated by heavy metals, the plant growth can be improved by biochar immobilization of heavy metals and reduction of their availability to plants. According to Subedi et al. [22], biochar-amended soils can enhance crop growth and yield via several mechanisms, such as expanded plant nutrient and water availability through increased use efficiencies, improved soil quality and suppression of soil and plant diseases. Yield response to biochar addition has been shown to be more evident in acidic and sandy soils than in alkaline and fine-textured soils.
According to Burrell et al. [28], changes induced by cropping, consolidation, biochar hydrophobicity, weathering of biochar particles and washout of ash and soluble elements are unlikely to be captured in short-time pot studies. Conversely, long-term field trials are much more likely to yield results that represent these indirect effects over time. However, to study the effect of biochar application to the full extent is impossible during a human lifespan due to reported resistance of biochar to microbial decomposition and persistence in the soil for as long as 100–1000 years [26], or over millennia [8]. Overall, there is a scarcity of studies presenting the mid-term and long-term effects of biochar amendment on the soil properties and crop yields [13]. Moreover, these studies can be divided into two major groups. Experiments in the first group are focused on the effect of repeatable biochar application for a period of a few years. Bai et al. [29] reported the effects of biochar application for six years on soil physicochemical properties and the fungal community in an intensively managed crop rotation system (rice–wheat). Li at al. [30] investigated the effect on the fertility and physical properties of cotton fields after biochar application for five and ten years. The other group of studies gathers works with a single application of biochar at the beginning of the experiment establishment, followed by a monitoring period reaching up to 3–4 years [31,32]. The experiment reported by Burrell et al. [28] was run in a glasshouse for the first year and then the pots were left to fallow outside for another two years. In the study of Altdorff et al. [33], the changes of soil water content were measured three years after the biochar application and two years after its reapplication.
From the perspective of a farmer, a clear economic profit along with the potential increase in crop yield and improvement of soil properties are important issues to consider. Although a considerable amount of pot and field studies have been published so far—Liu et al. [24] elaborated on a dataset of 103 publications—only a few are related to soil-climatic conditions of Central Europe, Slovakia (e.g., Reference [34]) and our experimental site (Haplic Luvisols in temperate zone). Moreover, there is a lack of studies reporting the effect more than three years after biochar application. Therefore, biochar application in agricultural land on Haplic Luvisols in a temperate zone (and areas with similar conditions) is associated with a lack of knowledge regarding its effects on both soil properties and crop yields.
The aim of this work was to quantify the extent of the effect of applied biochar during the fourth and fifth year after its application in combination with N-fertilization on soil pH, sorptive characteristics and soil organic matter parameters, including humus as well as crop yields. Considering that the acidic soil was amended by biochar with alkaline pH, we tested the hypothesis (H) that biochar application will cause an increase of the soil pH, and thus it will improve the cation exchange capacity, nutrient uptake and crop yields (H1). We also assumed that biochar in combination with N-fertilization will have a more intensive effect on soil properties by accelerating mineralization with a positive effect on increasing the crop yields (H2).

2. Materials and Methods

2.1. Study Site and Description of the Field Experiment

The experimental site of the Slovak University of Agriculture in Nitra is located in Dolná Malanta (lat. 48°19′00″; lon. 18°09′00″). The study area is characterized by a warm lowland climate with long, warm, dry summers, short dry winters, and only a very short duration of snow cover (14–30 days). The mean long-term air temperature and precipitation according to the 30-year climatic normal for the period 1961–1990 was 9.8 °C and 540 mm, respectively [35]. The mean air temperature and precipitation amount at the experimental site during the vegetation season in 2017 and 2018 are shown in Supplementary Materials Figure S1. Field research was conducted on agricultural soil formerly under standard conventional practice and crop rotation. The experiment was established on a loamy Haplic Luvisol [36]. The initial characteristics of the topsoil at the study site are presented in Table 1.
The field experiment on studying the effect of biochar application on gas emission, soil properties and crop yields was established in 2014 [11,37,38]. Nine different treatments were organized into a randomized block design at 27 plots of agricultural land (4 × 6 m) representing one of three replications (Table 2; Supplementary Materials Figure S2). The biochar was produced by pyrolyzing paper fiber sludge and grain husks (1:1 w/w). Biomass was pyrolyzed at 550 °C for 30 min in a Pyreg reactor (Pyreg GmbH, Dörth, Germany). As declared by the manufacturer (company Sonnenerde, Riedlingsdorf, Austria), biochar had particle sizes between 1 to 5 mm. On average, it contained 531 g kg−1 and 14 g kg−1 of total organic C and total N respectively, as well as 57 g kg−1 of Ca, 3.9 g kg−1 of Mg, 15 g kg−1 of K and 0.77 g kg−1 of Na. The specific surface area was 21.7 m2 g−1 and the content of ash was 38.3%. The average biochar pH was 8.8. The biochar was manually applied into the top of the soil (0–10 cm) at rates of 10 and 20 t ha−1 on 10 March 2014, and initially incorporated into the soil by rakes. Regarding treatments with fertilization, ammonium nitrate (N fertilizer) was manually applied to fertilized plots in two N fertilization levels (N1 and N2) according to the experimental plan. The doses of level 1 were calculated according to the required average crop nutrient supply using the balance method. The level 2 included an application of an additional 50% of N in 2017 and an additional 100% of N in the year 2018 (Table 2). Both soil amendments were then incorporated into the soil by disking with a tractor cultivator. In the following years of the experiment, only N fertilizer was applied, the rates and time of application were dependent on the sown crop. Maize (Zea mays L. cultivar LG 30.275) was sown on 10 April 2017. N fertilizer in rates of 0, 160 and 240 kg N ha−1 (indicating fertilization level N0, N1 and N2, respectively) was applied on two application dates: 9 May 2017 and 14 August 2017. Maize was sprayed uniformly at all plots with ADENGO (at rate 0.4 L ha−1) and LAUDIS (at rate 2.2 L ha−1) pesticides on 17 May 2017. After harvest, crop residues were left at all plots. Spring barley (Hordeum vulgare L. var. Malz) was sown on 9 April 2018. After the crop emergence, Mustang herbicide was applied at all plots (0.5 L ha−1) on 3 May 2018. Treatments with N fertilizer amendment were fertilized at rates of 0, 40 and 80 kg N ha−1 (N0, N1 and N2, respectively) on 7 May 2018.

2.2. Soil Sampling and Analysis

The soil samples were collected at monthly intervals from the beginning (April) till the end (September) of the maize growing season in 2017 (from the 38th to 43rd month since biochar application) and from April to July in 2018 during the vegetation season of spring barley (from the 50th to 53rd month since biochar application).
Standard soil analyses were used to determine the sorption parameters, such as: hydrolytic acidity (Ha), sum of basic cations (SBC), cation exchange capacity (CEC) and base saturation (Bs) [39]. Soil pH was analyzed potentiometrically (Elmetron CPC 401) in suspension with 1 mol dm−3 KCl solution. Soil organic carbon (Corg) content was measured using the wet combustion method—oxidation of soil organic matter (SOM) by a mixture of 0.07 mol dm−3 H2SO4 and K2Cr2O7 with titration using Mohr’s salt [40,41]. The group and fraction composition of humic substances (extracted by a mixture of 0.01 mol dm−3 Na4P2O7, 10 H2O and 0.1 mol dm−3 NaOH) was determined by the Belchikova and Kononova method [40]. The light absorbance of humic substances (HS) and humic acids (HA) was measured at 465 and 650 nm using a Jenway 6400 Spectrophotometer to calculate the color quotients of humic substances Q4/6HS and humic acids Q4/6HA. Labile carbon (CL) content was determined using 0.005 mol dm−3 KMnO4 [42].

2.3. Plant Sampling

Plants of maize and spring barley were sampled at the end of the vegetation season on 26 September 2017 and 25 July 2018, respectively. Whole aboveground plant material was taken from one randomly selected 1 m row in the case of maize (wide row crop), while the spring barley was sampled from a randomly selected 0.5 × 0.5 m square (narrow row crop). The plant material was transported to the laboratory, where the plants, ears and grains were counted. Final grain yield was calculated as a multiplication of total number of ears per m2, number of grains per ear and average grain weight of dry biomass [43]. To obtain the weight of dry biomass, grains and the rest of the sampled plant material were dried separately in the oven at 60 °C until constant dry weight.

2.4. Statistical Analysis

All datasets were analyzed using the Statgraphics Centurion XV.I software (Statpoint Technologies, Inc., Washington, DC, USA). Average values of soil parameters over the whole study period and the selected crop yield parameters were analyzed by one-way analysis of variance (ANOVA) and subjected to the LSD test at p ≤ 0.05. The Mann–Kendall test was used to evaluate the trends of the soil parameters during the investigated period. A correlation analysis was performed using Pearson’s product-moment correlation coefficient (Pearson coefficient) to evaluate the linear relationships and their significance (at p ≤ 0.05, p ≤ 0.01 and p ≤ 0.001) between the studied variables. The first tested dataset consisted of monthly values of selected soil properties. Because the length of vegetation growth season in 2017 and 2018 was different, degrees of freedom (df) also varied: df in 2017 was 52 and df in 2018 was 34. The second dataset included averages of observed soil properties for the specific crop vegetation seasons in 2017 and 2018 as the correlations were sought with selected crop yield parameters (df = 7 in both studied years).

3. Results and Discussion

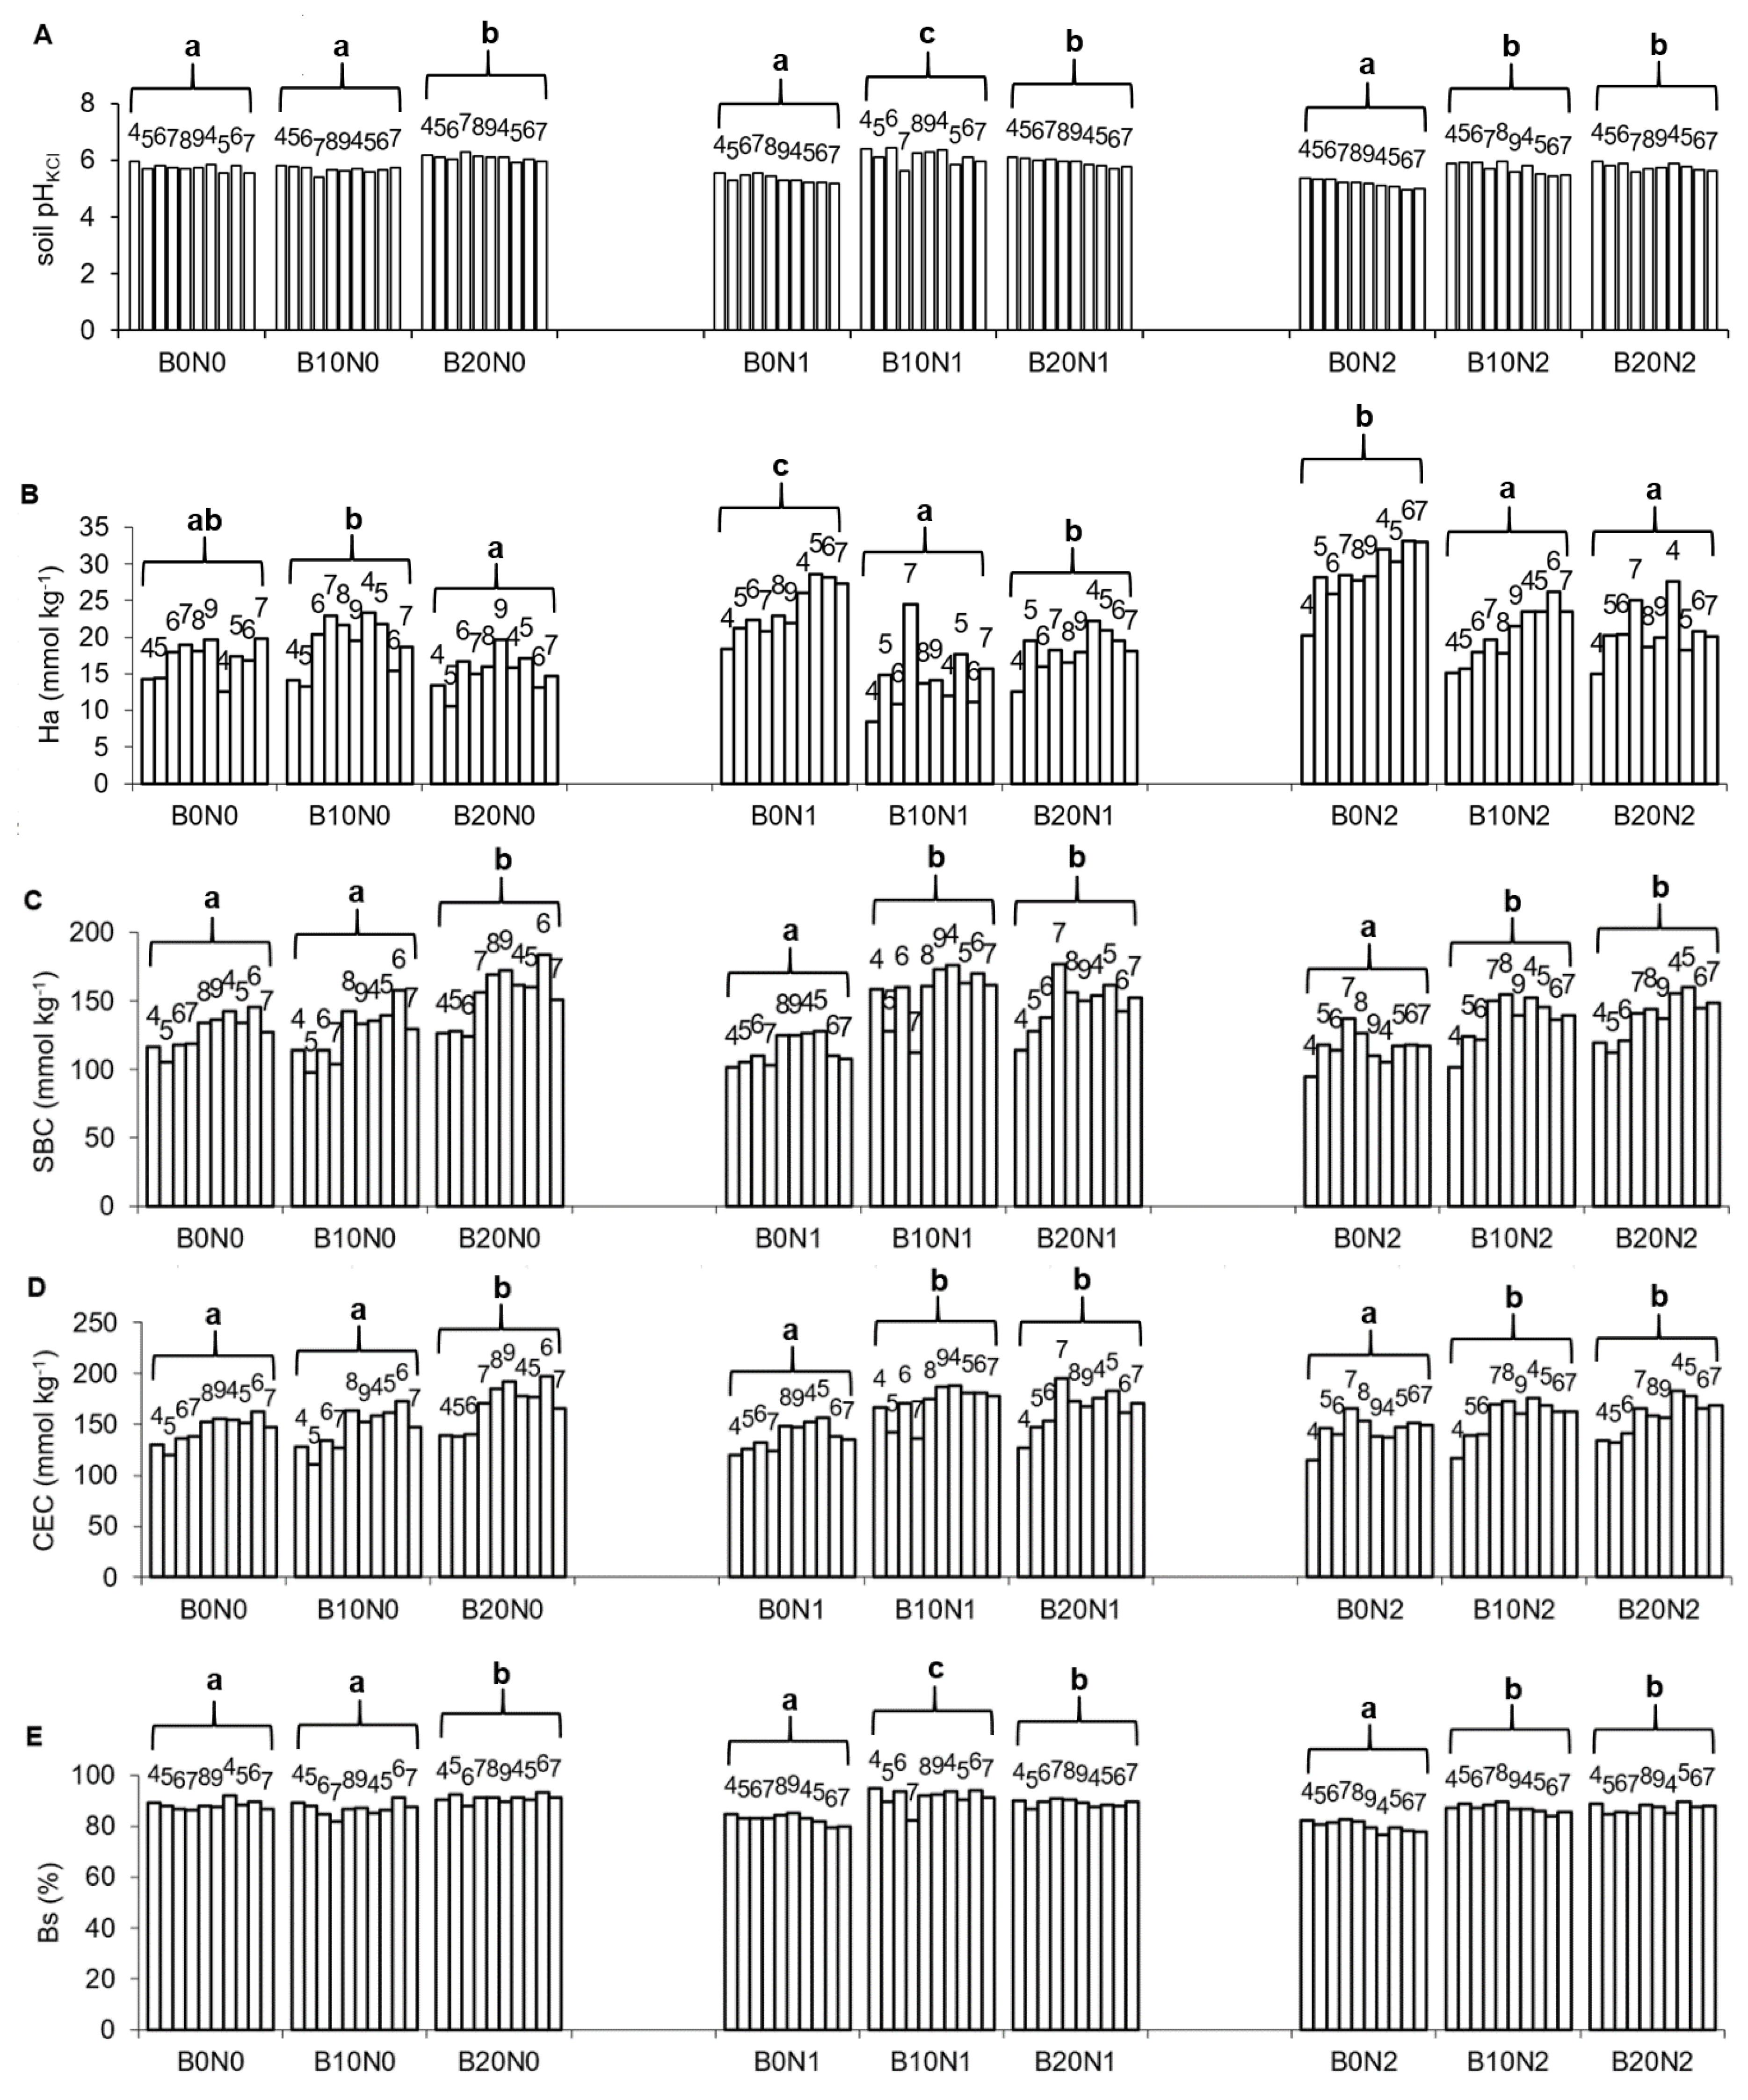
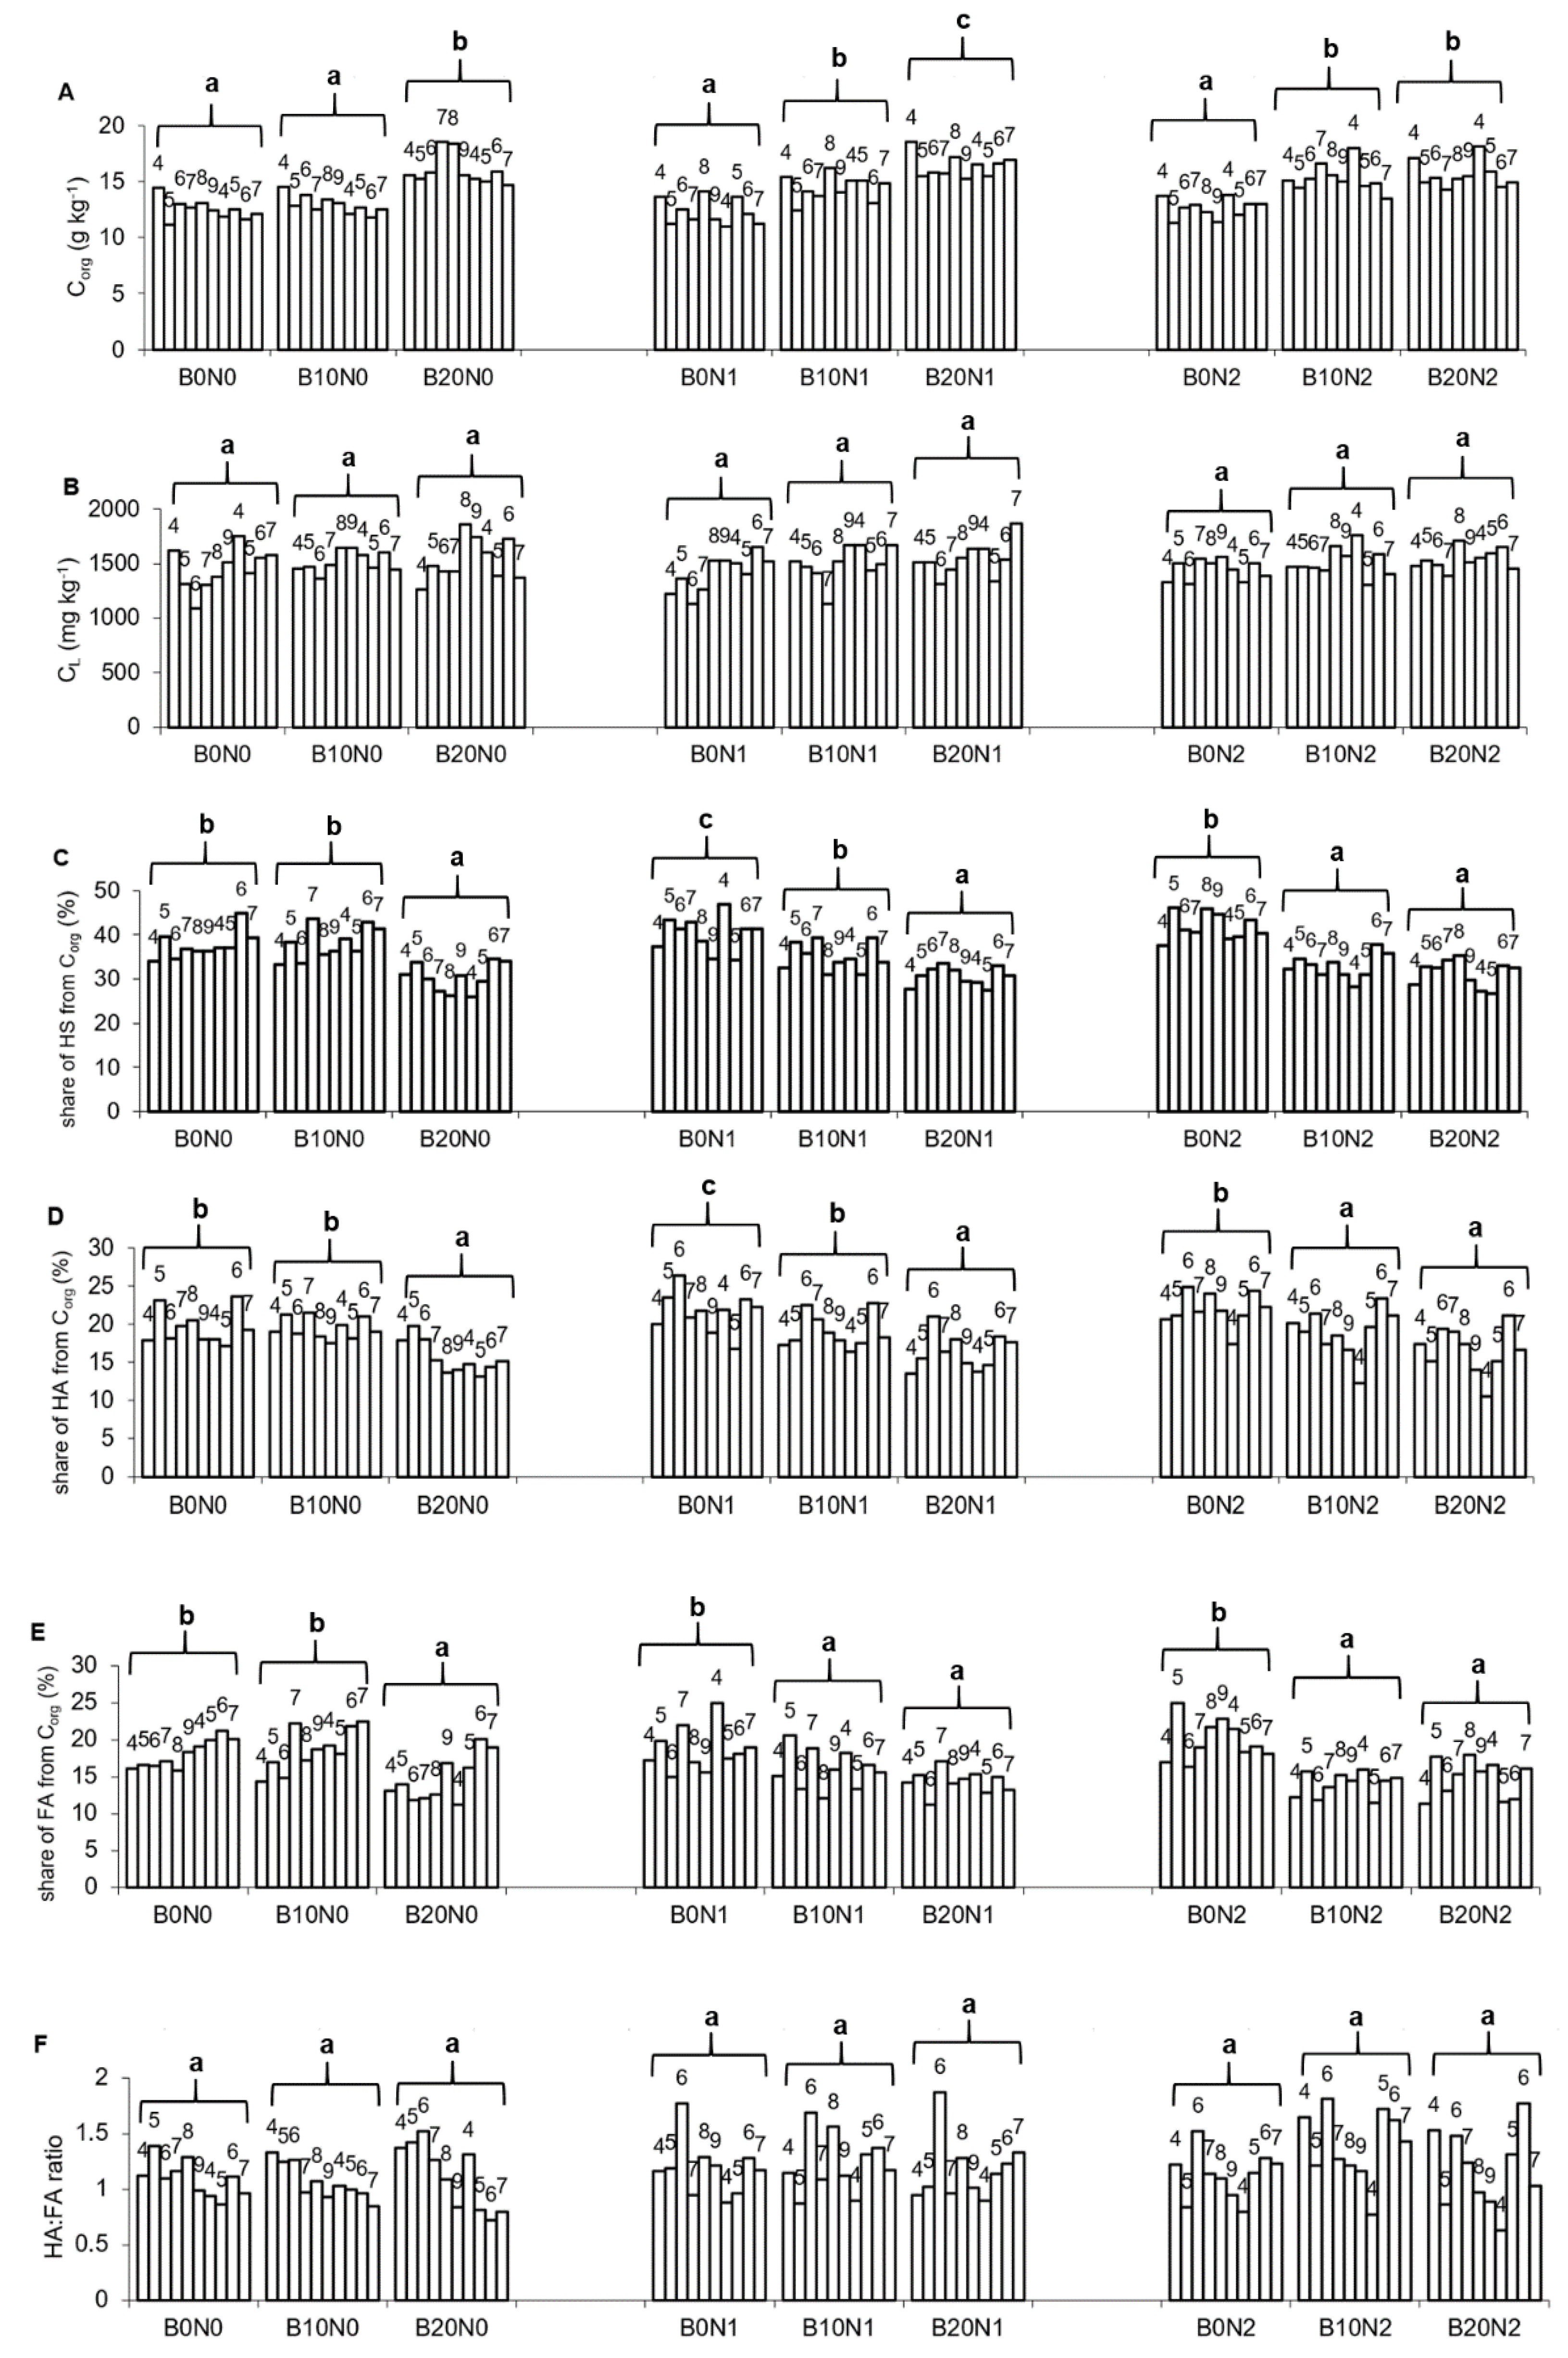
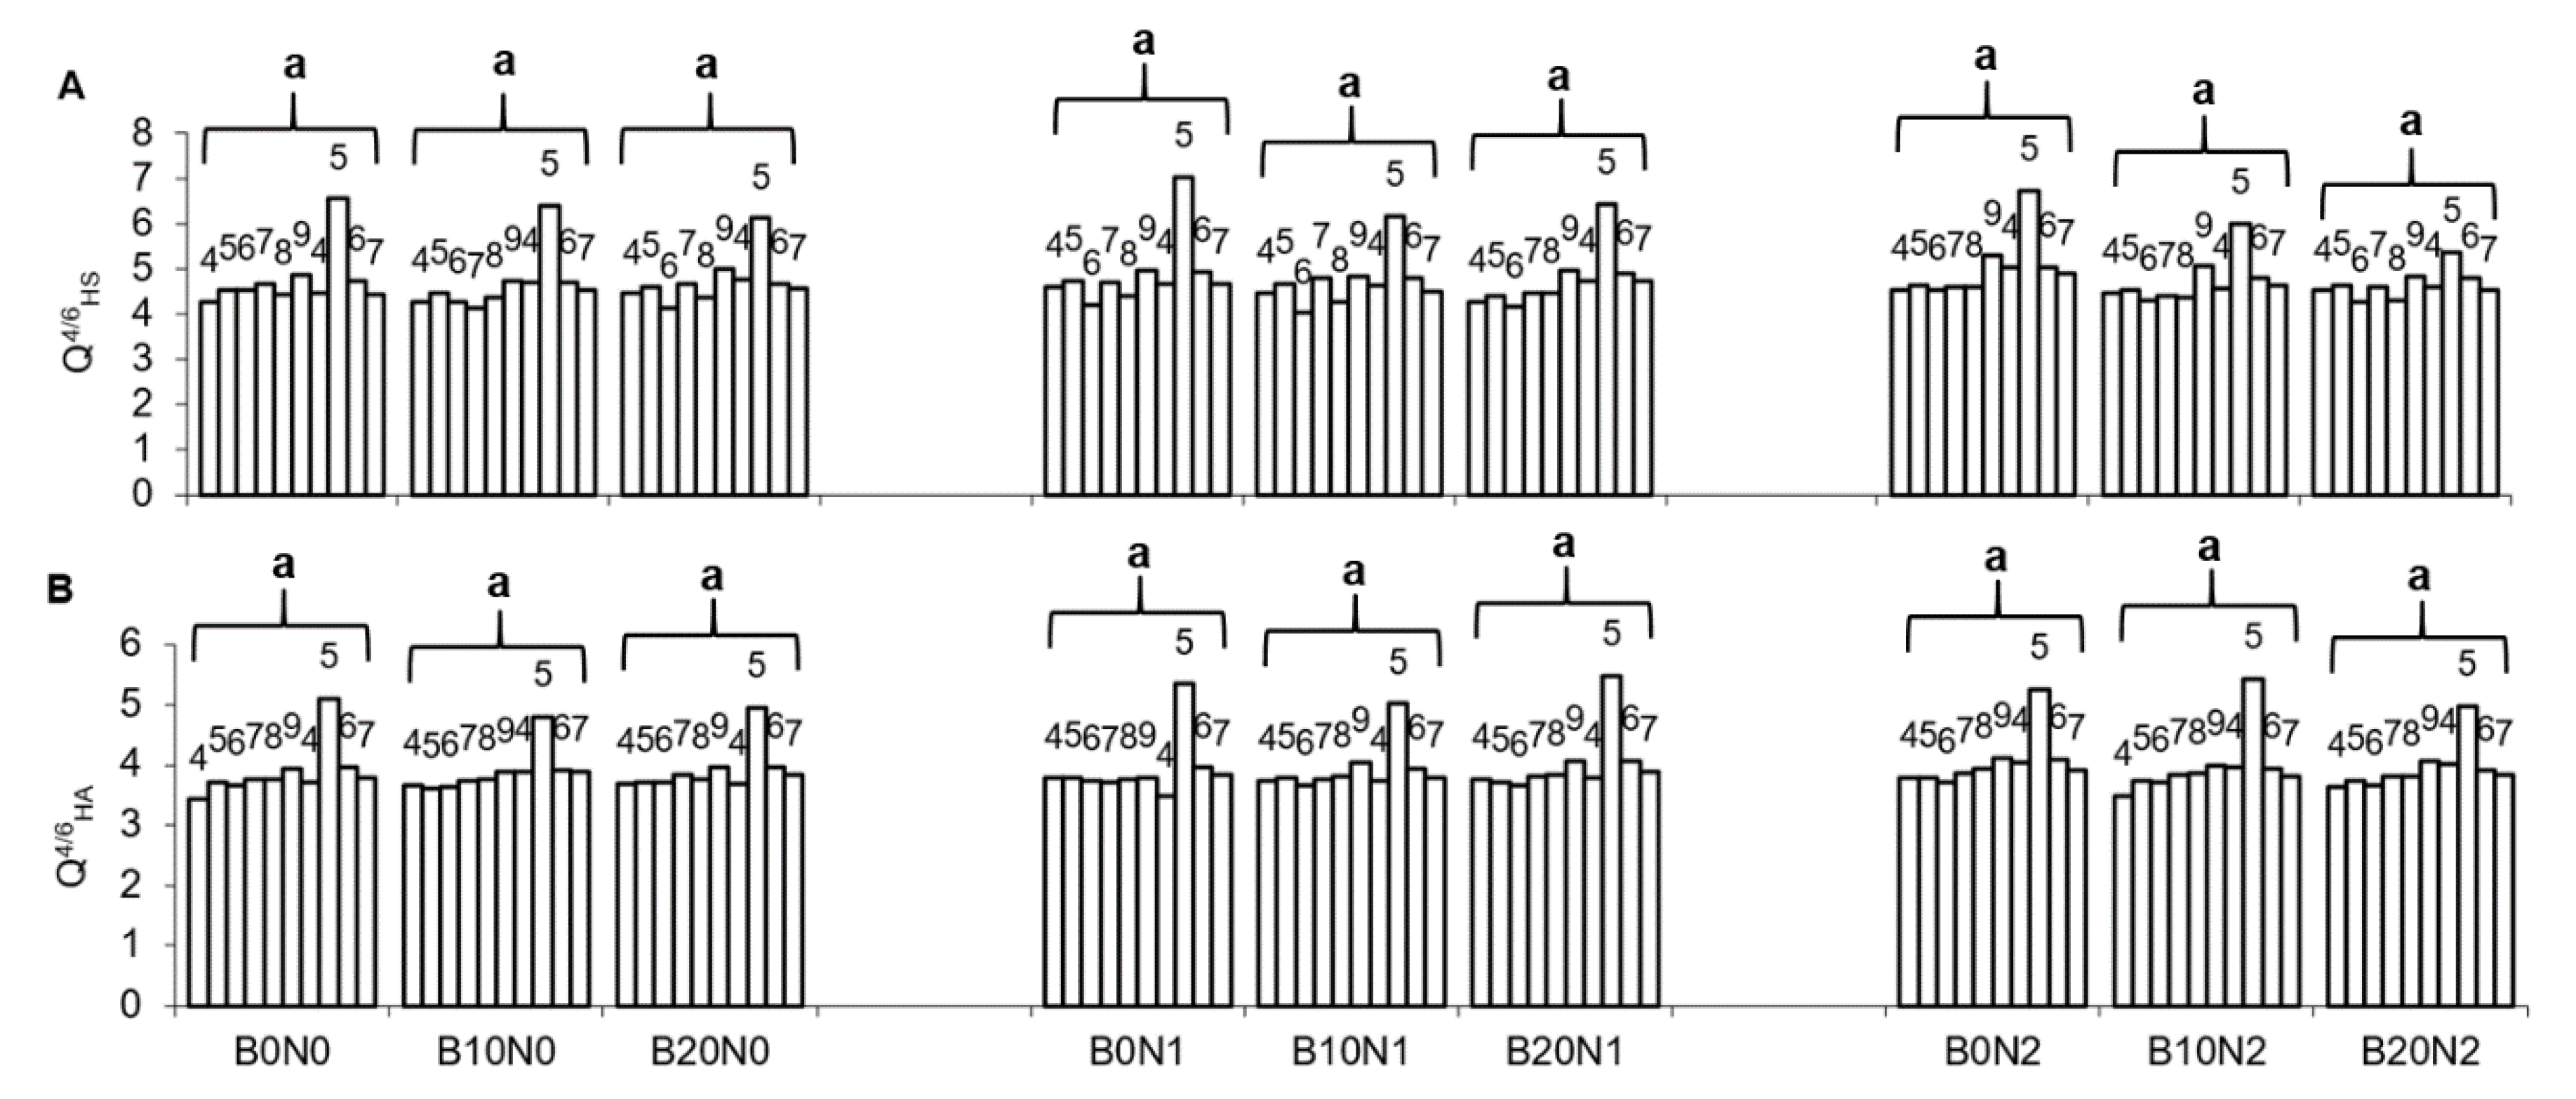
3.1. Soil Properties
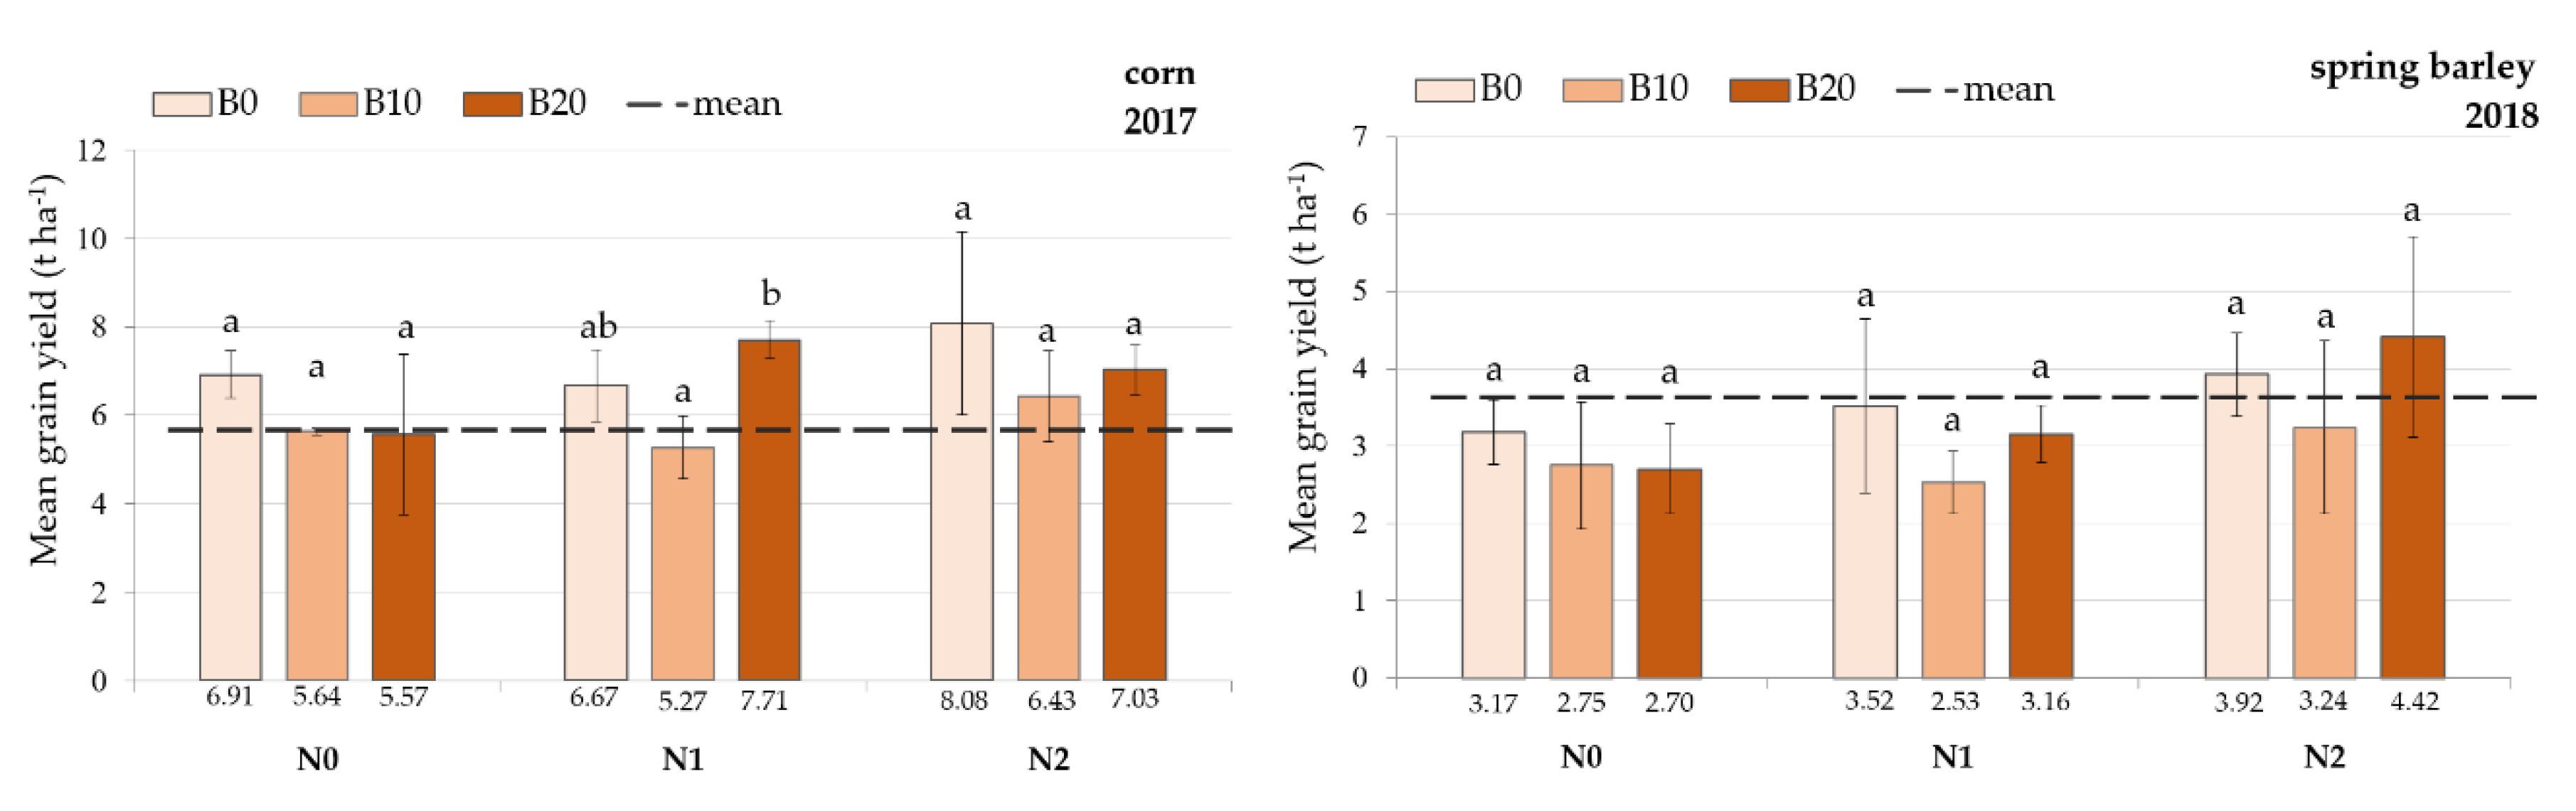
Soil was acidic (pHKCl = 5.71) before the experiment, so application of biochar which is alkaline can be a useful tool for improving one of the most important soil properties as the modification of the soil pH might enhance available nutrient concentration in the soil [44], with a positive impact on plant growth and development. The optimum soil pH for nutrient release and intake for most plants is from slightly acid up to neutral (pH 6–7) [45,46]. This level was almost reached thanks to biochar. There were significant (p ≤ 0.05) increases in soil pH compared to relevant controls, except treatment B10N0 (Figure 1A). The highest increase was observed in B10N1 when compared to B0N1 and in B20N2 when compared to B0N2. The results of the Mann–Kendall test showed that application of N-fertilization in both levels without biochar had a negative effect, causing a decrease of soil pH dynamics during vegetation season in 2017 and 2018 (Table 3). Chodak et al. [47] reported that intensive N-fertilization and its higher doses were related to the decrease in soil pH and soil acidification.
Changes in hydrolytic acidity (Ha) after biochar amendment and biochar with N-fertilization are shown in Figure 1B. Adding biochar to soil decreased Ha but statistically significant differences were determined only between biochar treatments B10N0 and B20N0. Our study showed that the average Ha in B0N1, B10N1 and B20N1 was 23.8, 14.3 and 18.2 mmol kg−1 respectively, which clearly indicates a decrease of Ha values due to the combination of biochar application together with lower level of N-fertilization (N1). The same effect—a decrease in Ha—was observed in the case of biochar combination with a higher (second) level of N-fertilization. Similar findings were described in several studies [48,49]. These effects were due to the alkalinity of biochar and high levels of Ca2+ and Mg2+ in ash of biochar [50].
Despite the fact that the average values of Ha decreased (Figure 1B) after biochar application, its dynamics during the investigated period (vegetation season in 2017–2018) were different (Table 3).
The dynamics of Ha revealed no trend in all treatments, except B0N1, B0N2 and B10N2 treatments during the growing seasons in 2017–2018. The content of Ha increased with time in the above-mentioned treatments, which shows that N-fertilization is a key element in acidification of soil and biochar is a stabilizing element. Incorporation of biochar to soil may enhance the specific surface, area which improves soil sorption [51], which increases cation exchange capacity (CEC) [52]. The results of the LSD test in all fertilized treatments showed significant differences between the average values of other sorption parameters due to application of biochar to soil (Figure 1C–E). A higher dose of biochar amendment without N-fertilization applied to the soil resulted in a higher increase of sum of basic cations (SBC) and CEC. Addition of N at the first level together with 10 and 20 t ha−1 of biochar and N-fertilization at the second level, together with both 10 and 20 t ha−1 of biochar, significantly increased the value of SBC by 37% and 29%, as well as by 18% and 19% respectively, compared to B0N1 and B0N2. In the similar levels, the CEC values have been increased if biochar was applied together with N-fertilization in comparison to fertilized controls (B0N1 and B0N2).
Values of base saturation (Bs) fluctuated from 80.1% to 91.4%, and the applied biochar (p = 0.0002) and biochar with N-fertilization in the first (p = 0.0000) and second (p = 0.0000) levels had a significant influence on these values. The sorption complex after the application of biochar and biochar in combination with N-fertilization became fully saturated. The most significant saturation was observed in the B10N1 treatment compared to B0N1. A higher dose of biochar (20 t ha−1) rather than a lower dose of biochar but without N-fertilization had a positive effect on the increase of Bs when compared to B0N0 (Figure 1E).
The trends of sorption parameters in biochar and biochar with N-fertilization treatments were evaluated according to the results of the Mann–Kendall test (Table 3). The dynamics of SBC and CEC according to the above-mentioned test revealed no trend in all treatments, except B0N0 and B20N2 treatments during the growing season in 2017–2018. The content of SBC and CEC increased with time in B0N0 and B20N2 treatments. The results of Bs obtained seem to contradict the overall assessment of the application of biochar, but it must be pointed out that the biochar was applied only once at the beginning of the experiment and the dose of N was applied annually. So, the trends for 2017–2018 might differ. The values of Bs decreased with time in B0N1, B0N2 and B10N2 treatments (Table 3).
The results showed that biochar application produced significant changes in Corg (Figure 2A). These results are not surprising because biochar is a significant source of organic carbon (C) [53] and biochar used in this study contained 53% of total organic C. The most significant effect of applied biochar on increase of Corg was observed in treatment B20N1 when compared to B0N1. The results of the Mann–Kendall analysis showed the dynamics of SOM and humus parameters (including Corg) during the investigated period (Table 4). Even though the average values of Corg increased after biochar application overall (Figure 2A), its dynamics during the investigated period were different during the vegetation period of 2017–2018 (Table 4). The dynamics of Corg revealed no trend in all biochar treatments with N-fertilization and unfertilized control (B0N0), except B10N0 and B20N0 treatments. In B10N0 and B20N0, the contents of Corg decreased with time during the vegetation seasons from 2017 to 2018.
Biochar 3–4 years after incorporation to the soil increased the content of Corg, but then gradually its content decreased, as shown by our results from the evaluation of dynamics (Mann–Kendall test). Biochar could be subjected to mineralization, resulting in a decrease of its volume in soil, including a decrease in soil Corg as a result of positive priming effect [54]. As reported in the literature, this is associated with biochar properties, particularly depending on the feedstock used and the production process itself [55]. It is evident from our results that the application of N-fertilization can be a stabilizing element in C sequestration after the application of biochar to the soil. As our findings indicate, nitrogen fertilization prolongs the effect of biochar to maintain a higher amount of Corg in the soil after biochar application. The explanation may be related to microbial activity and microbial biomass production [56,57], but also to the formation of root exudates [58], which ultimately contributes to the increase of Corg in the soil.
The labile carbon fractions have a much shorter turnover time [59] and thus are affected much more rapidly by management-induced changes in organic matter inputs or losses. To the contrary, our findings showed that biochar application did not produce changes in CL that were significant (Figure 2B). According to the results of the Mann–Kendall test, the dynamics of CL were stable in all treatments, except B20N0 during vegetation season 2017–2018. In B20N0, the content of CL increased with time (Table 4). A higher dose of biochar in 3–4 years after its application significantly enhanced biological properties, resulting in an increase in CL production in this treatment. Based on our results, N-fertilization together with biochar is a stabilizing moment in C sequestration even in the case of its labile forms.
Humus substances (HS) play an important role in the sequestration of C [60] in addition to soil fertility. A study of Jindo et al. [61] showed that biochar can play an important role in the formation of HS; therefore, we also evaluated the quality and stability of humus parameters, including HS with regard to the biochar application (Figure 2C–E). Application of a higher rate of biochar had more significant effects on the decrease of HS when compared to fertilized and unfertilized controls. The most significant decrease in HS was observed in B20N1 when compared to B0N1. The same effects have been observed in case of humic (HA) and fulvic (FA) acids as one of the most significant humus substances. This means that the most significant effects on decreased HA and FA were determined after application of a higher rate of biochar with or without N-fertilization, in comparison to respective controls. Biochar is composed predominantly of stable structures and only small quantities of labile molecules. For this reason, microorganisms are not able to intensively decompose biochar and the production of humus substances is limited. It all depends on biochar production conditions, as was mentioned by several authors [15,53,55,62]. These results are in contrast with the findings of Li et al. [63]. According to Li et al. [63], biochar is very beneficial for the formation of humus in the soil. The authors demonstrated increased contents of humic acids and fulvic acids after the application of biochar in a lab experiment, but our results came from the field experiment on a loamy Haplic Luvisol located in Central Europe.
The Mann–Kendall test showed that the dynamics of HS over time (for the vegetation season in 2017–2018) changed only in the case of FA (Table 4). In treatments B0N0 and B10N0, the FA content increased, and in other treatments, a stable trend in FA content was observed. Fulvic acids decompose easily but recover relatively quickly in a continuous process of humification.
Conversely, they accumulate under conditions of reduced biological activity [64]. In our case, N-fertilization appeared to be a stabilizing moment for stabilizing HS, including HA as well as FA, in the soil after biochar application. An increase of soil microorganisms is stimulated by biochar application, which promoted the production of HA and FA, as reported in Zhao et al. [65]. Over time, parts of HA and FA are used by microorganisms as a result of the decline in the slightly mineralized sources of carbon.
The HA:FA ratio and the stability of humus substances after biochar application did not change significantly (Figure 2F). However, the Mann–Kendall test showed that if N-fertilization was not applied, only the application of biochar at both rates during vegetation in 2017–2018 reduced the ratio of HA:FA, i.e., humus quality was significantly reduced in these treatments. This result may be related to impairment of the humus stability itself in the soil. Humus is relatively stable in the soil [66], but due to external influences, such as the use of biochar, its stability may be impaired and humus in the soil may be impaired [67] by a reduction of HS [68] as a result of microbial activity. Much depends on the biochar properties which are modified by the biomass type and technology used to produce this material [55]. For example, Zhao et al. [65] stated that the different effect of biochars on the content of HA and FA depended on different pyrolysis temperatures during biochar production.
Overall, the stability of HS expressed by Q4/6HS and Q4/6HA over the investigated period did not change significantly after either biochar applied alone or in combination with N-fertilization (Figure 3A, B). However, during the vegetation period 2017–2018, the stability of HA decreased (increasing trend means decrease in HA stability) in treatments where biochar without N was applied and at a higher biochar rate with both levels of N-fertilization, as indicated by the Mann–Kendall test results (Table 4).

3.2. Crop Yields

The results of selected yield parameters for crops grown during the third and fourth year of biochar application are reported in Table 5. Although no significant differences were observed for spring barley in 2018, significant differences were observed for several selected yield parameters of maize in 2017. Generally, biochar had a neutral effect or slightly decreased the amount of aboveground biomass at all fertilization levels in the third and fourth year of application. Application of biochar at 20 t ha−1 increased the amount of total aboveground biomass when combined with 160 kg N ha−1 (B20N1) in 2017 and with 80 kg N ha−1 in 2018 (B20N2), however this increase was not significant. Lesser amount of plants was observed for treatments with biochar application at 10 t ha−1 in 2017 (by 24% at B10N0 and by 17% at B10N1). However, double dosage of biochar at the first N-fertilization level led to a significant increase (p ≤ 0.05) of the amount of plants in comparison to treatment B10N1. In 2018, the amount of plants per m2 increased in the order B10N1 < B10N0 < B20N0 < B20N2 by 5%, 19%, 43% and 60% respectively, in comparison to individual controls (B0N0, B0N1 and B0N2).
Generally, biochar application resulted in a decrease of ears per plant (in case of B10N2 in 2017, a significant decrease by 31%), but other parameters were improved. The amount of grains per ear increased in the case of fertilized treatments B10N1, B20N1, B10N2 and B20N2 in 2017. Moreover, the differences for treatments B10N2 (+42%) and B20N2 (+54%) were significant in comparison to control (B0N2). In 2018, a neutral effect or decrease in the amount of grains per ear was generally observed with the exception of B20N1 (increase by 7% when compared to control); however, none of these results were statistically significant. Biochar application at 10 t ha−1 increased the weight of grains for B10N0 and B10N1 in 2017. However, for biochar treatments with applied 240 kg N ha−1, the weight of grains significantly decreased on average by 33% for treatments B10N2 and B20N2. While some positive effects of biochar application on crop yield parameters were observed for treatments with both biochar application rates in 2017, the effect was more evident for treatments with the application rate of 20 t ha−1 in 2018.
Observed grain yield data in 2017 and 2018 (Figure 4) were compared to the average grain yields obtained for specific crops during the studied seasons in Slovakia. The average gained yield of maize in 2017 and spring barley in 2018 in Slovakia was reported to be 5.68–5.88 t ha−1 [69,70] and 3.63–3.83 t ha−1, respectively [69,71]. Considering the limitation of tillage operations on the site (only disking) since the biochar application in 2014, the observed crop yields in the field experiment were compared to the lower values referring to the country’s average.
In the 2017 cropping season, the majority of treatments resulted in the grain yield above the country’s average (including B0N0 without application of any soil amendment). Interestingly, the increasing level of fertilizers in general did not result in the expected increase of crop yield, especially in combination with biochar application. The lowest grain yield in 2017 was observed for treatment B10N1, when 160 kg N ha−1 and 10 t ha−1 of biochar were applied. At this biochar application rate, lower yields were also observed for other fertilization levels in comparison to relevant control treatments. The grain yield at treatment B20N1 was significantly higher than at treatment B10N1 by 46%. Moreover, it was also the only biochar treatment where a higher yield was observed in comparison to control (B0N1). Biochar at the non-fertilized treatments (B10N0 and B20N0) resulted in a similar grain yield that was lower than control (B0N0), however these results were not significant. A similar trend was observed at the second level of N-fertilization, although grain yield at B20N2 was slightly higher than at B10N2. In contrast to results from the maize cropping season in 2017, spring barley grain yields observed in 2018 were generally below the threshold of the country’s average (3.63 t ha−1) in all treatments. The trends in the effect of biochar application at various fertilization levels were very similar to the year 2017. However, these results were not significant and therefore it can be concluded that biochar application had no effect on spring barley yield. Biochar amendment at both application rates without fertilizer resulted in a similar grain yield that was lower than control (B0N0). Grain yield at the first fertilization level increased in the following order: B10N1 < B20N1 < B0N1. Also, at the second N-fertilization level, the lowest crop yield was observed for treatment with 10 t ha−1 of biochar (B10N2). Application of 20 t ha−1 of biochar (B20N2) showed the highest crop yields in 2018, quite high above the country’s average. The B0N2 treatment was also slightly above this average.
When attempting to evaluate the extent of the applied soil amendments on the crop yields, relevant climatic conditions must also be considered. The mean air temperature was higher by 8% during the vegetation season of maize (2017) and higher by 21% during the vegetation season of spring barley (2018) in comparison to CN. The site also received less precipitation during the individual growing seasons by 19% in 2017 and by 53% in 2018 when compared to CN (Supplementary Materials Figure S1). Monthly data of mean air temperature and precipitation amount in 2017 and 2018 at the experimental site were compared to the climatic normal (CN) 1960–1991 [35] and the deviation of the meteorological parameters was evaluated according to methodology of Kožnarová and Klabzuba [72] (Supplementary Materials Table S1). When considering the whole year period, both 2017 and 2018 were very dry in comparison to CN. The mean air temperature in year 2017 was similar to CN. However, year 2018 was extremely warm, which is in agreement to the worldwide discussed trend of climate warming [73,74,75]. We assume that crop yields were negatively affected by weather conditions at the experimental site, especially when the “very warm” up to “extremely warm” weather was accompanied by a lack of precipitation. Moreover, the precipitation was distributed very unevenly during the individual months. For example, the daily total on 24 July 2017 was 40% (24 mm) of the whole of July’s precipitation. An even higher extreme was recorded in 2018, when 92% (41 mm) of June’s total precipitation fell on 24 June 2018. Water stress is more critical at certain crop development stages. Stress from temperature and water impacts nutrient availability and susceptibility to pests, which affects the final crop yield [76]. Moreover, different treatments also influenced the start of individual growth stages [37], thus timing of precipitation could contribute to creation of future crop yield differently. As Liu et al. [24] pointed out, a general disadvantage of long-term field trials is that they are usually adversely impacted by environmental variability.

3.3. Relation of Crop Yield of Maize and Spring Barley to Changes of Soil Properties

Correlation analysis between studied soil properties revealed several significant relationships at various confidence levels (Supplementary Materials Tables S2–S5). During the studied period of 2017–2018, Corg correlated positively with pH, SBC and CEC, while negative relationships were observed between Corg and HS, HA and FA (p ≤ 0.001). There was a positive correlation between pH and SBC, CEC and BS, while pH and Ha correlated negatively. Regarding the crop yield parameters, number of ears per maize plant in 2017 positively correlated with the total number of ears (p ≤ 0.001). The more ears the plant had, the smaller the number of kernels in the ear. Number of ears in 2018 (spring barley) significantly (p ≤ 0.05) rose with increasing number of plants and aboveground biomass and positively influenced the spring barley grain yield. In 2017, average grain weight of maize positively correlated with HS, HA and FA, however with the amount of Corg, it correlated negatively, which means that from a qualitative yield parameter point of view, content of Corg was not important but specific humus substances played a significant role. Far less statistically significant relationships between crop yield parameters and soil properties were found for the vegetation season in 2018, which might be related to a stronger influence of weather conditions on crop yields.
Integration of biochar and mineral fertilizers or manures generally results in better nutrient management and crop yield in most types of soils. The impact of biochar on the mineralization of native soil organic carbon varies among ecosystems. Application of biochar may enhance (positive priming) [77] or suppress (negative priming) [78] native soil organic carbon mineralization [26,79]. Our observation confirmed our hypothesis (H1) that biochar addition will increase the soils pH and increase the CEC (Figure 1A, D). These increases were statistically significant, and together with the increase of Corg (Figure 2A), we expected higher nutrient uptake resulting in the increase of crop yield. The initial soil pHKCl at the experimental site was 5.71 after biochar application rose up to 6.18 (for B10N1 in 2017). The recommended optimum pH for growing maize is 6.6–7.5 and for spring barley, 6.5–7 [80]. Biochar-mediated shift in pH and a related increase in the bioavailability of P, Ca and Mg, resulting in a balanced nutrient supply in rhizosphere reported in many works [23], did not enhance crop yields in our study. However, our results are in agreement with the study by Karer et al. [34] that was conducted in relatively similar climatic but different soil conditions. They observed that besides the significant increase of pH in the first year of biochar application and Corg increase, there was no significant increase of nutrient intake and correlation with crop yields observed on Cambisol, nor Chernozem. In our study, we actually observed a negative relationship between pH and average grain weight in 2017 and ears per plant in 2018. We suspect that some other factor was influencing crop yields in the studied years more strongly than pH. Adequate availability of nitrogen is a crucial factor for optimal N uptake by plants. Higher N uptake by the crop implies that the organic amended soil maintained a higher concentration of this nutrient in the soil solution. For most annual crops, N-uptake from soil at optimum fertilizer rates occurs for only 8–12 weeks. Nitrogen in applied organic amendments may be prone to immobilization, and, as a result, plants usually recover low amounts of organic amendment N in the short-term [81]. Lack of precipitation during the nutrient-demanding crop stages might lead to water insufficiency, which is necessary to solute nutrients.
Although biochar can improve degraded soils, it is not a one-size-fits-all solution. Soil- and crop-specific biochar are needed in order to ensure optimum crop yield and agricultural sustainability [26].

3.4. The Effect of Soil Amendments on Crop Yield of Maize and Spring Barley

According to previously published results of the established field experiment [11,82], spring barley crop yield increased for treatments with biochar application at 10 t ha−1 during the first crop season, just after biochar application in 2014. The differences in comparison to control rose in the order of B10N1 < B10N2 < B10N0 by 5%, 8% and 42%, respectively. In contrary, the lowest spring barley yields were observed for these treatments in year 2018, four years after biochar application (Supplementary Materials Figure S3), despite higher amounts of plants per m2 (Table 5). We suspect that water stress (Supplementary Materials Table S1) could play a role during formation of the grain yield that could explain the grain yields below average (Figure 4). The second level of N-fertilization in combination with biochar application (treatments B10N2 and B20N2) was not an efficient combination in increasing maize yield in 2017. Higher maize yields were observed for the same treatments in 2015 [80]. The positive effect of increasing grain yield at non-fertilized treatments was observed only during the first and second year after biochar application. Considering the observed grain yields in 2017 and 2018 cropping seasons, we can conclude that the combination of 20 t ha−1 of biochar with N fertilizer (B20N1 and B20N2) has the highest grain yield increase potential. We hypothesized that biochar in combination with N-fertilization will increase crop yields (H2). According to our observed results, this hypothesis was correct, especially regarding the biochar application at a rate of 20 t ha−1. Our observations are in agreement with Gathorne-Hardy [83], who also found that the combined application of biochar and nitrogen fertilizer significantly increased barley crop yields and nitrogen use efficiency on sandy loam soil up to two years after their application. The same author also reported that there was no clear interaction between the quantity of biochar and spring barley yield. Agegnehu et al. [81] reported an improvement of fertilizer use efficiency after application of organic amendments (biochar with or without combination with compost), especially when combined with mineral fertilizer. Moreover, when used together with organic amendments, less N fertilizer was required to achieve a given yield than when N is applied alone, which could have a positive effect on profitability and enhancement of long-term sustainability of the production system, while simultaneously mitigating environmental pollution.
Similar to our study, Baronti et al. [20] studied the positive effect of biochar application at the rate of 10 t ha−1. They used commercially produced biochar made from coppiced woodlands that increased yield of aboveground biomass and maize grains by 26% and 6% respectively, in comparison to control in the first year after biochar application. The authors assumed that increased reduction in N leaching (higher retention of NH4+; N immobilization in microbial biomass) or a reduction of denitrification, as described by Yanai et al. [84], could be the main mechanism explaining the observed yield increase. Major et al. [85] also observed an increase in maize yield four years after biochar application. Karer et al. [34] reported results of their two-year field experiment with beech wood biochar on Cambisol and Chernozem in Austria (temperate climate zone). Although their experimental biochar application rates were much higher (24 and 72 t ha−1) than usually recommended ones, they did not observe any adverse impacts on yield performance of spring barley, maize (first year) and sunflower, winter wheat (second year), and with sufficient N supply provision. However, they observed distinct yield decreases, especially for maize and winter wheat on the Cambisol, when biochar was applied without N supplement. This also confirmed the well-known effect of N availability, being the most limiting factor for crop yield. Although more N was contained in the biochar additive than in the mineral fertilizer, the crops could not take advantage of this biochar pool, at least not in the short term. In general, there are more studies that report the positive effects of biochar application on crop yields. In contrast, especially in the last decade, more studies occurred that reported a neutral or negative effect. Factors responsible for yield response to biochar are specific biochar/soil/crop/fertilizer combination, application rate, elapsed incorporation time, experiment type and environmental conditions, as summarized in the review paper by Subedi et al. [22].
The positive effect of biochar application on the alternation of crop yields in the third and fourth year after biochar application was visible only for higher application rate of biochar in combination with N fertilizer (B20N1 in 2017 and B20N2 in 2018) when compared to grain yields at control treatments (Supplementary Materials Figure S3). Interestingly, the positive effect for B20N1 treatment was not observed during the first year after biochar application (in 2014). With more time elapsing from the biochar application date, the positive effect of the biochar application seems to be decreasing. However, as it was already mentioned, the effect of changing weather conditions at the experimental site must be considered too while evaluating the results. Further research should also focus on the water retention ability of biochar and its relation to water availability to grown crops in biochar-amended soils during dry and hot periods.

4. Conclusions

Through the application of biochar, the soil pH and soil organic carbon content both increased, and were improved together with the sorption parameters. The hydrolytic acidity decreased, while the sum of basic cations and cation exchange capacity increased because of the application of biochar. N-fertilization was an important stabilizing element for soil characteristics 3 and 4 years after the application of biochar.
Even though the properties of the soil were improved as a result of the application of biochar, the yield parameters and the overall grain yield depended significantly on the climatic conditions in the individual years. However, our results at 3 and 4 years after the application of biochar showed the potential of increasing the grain yield, especially at the dose of 20 tha−1 of biochar in combination with N-fertilization. Average grain weight of maize positively correlated with HS, HA and FA, however it correlated negatively with the Corg content. This means that specific humus substances played a significant role during formation of crop yield. Far less statistically significant relationships between crop yield parameters and soil properties were found for the vegetation season in 2018, which might be related to a stronger influence of weather conditions on crop yields.
As a conclusion, the results of this study supported our hypotheses only partly. The application of biochar to loamy Haplic Luvisol in the climatic conditions of Central Europe influenced the soil characteristics, leading to an increase in soil pH, improvement of sorption parameters and soil organic matter. Crop yields depended on climatic conditions during vegetation season rather than applied biochar and N fertilizer. The positive effect of biochar application on the alternation of crop yields in the third and fourth year after biochar application was visible only for a higher application rate of biochar with a combination with N fertilizer. Biochar application did not affect all crop parameters in the same direction. In 2017, a significant positive effect of biochar application was observed for number of grains per ear at the second fertilization level (B10N2 and B20N2). However, the same treatments had a significant negative effect on the weight of 1000 grains and a neutral effect on the final grain yield. In 2018, no significant effects (positive or negative) on crop yield parameters were observed regarding biochar application, thus it had a neutral effect. Further research should focus on the water retention ability of biochar and its relation to water availability to grown crops in biochar-amended soils during dry and hot periods, as the lack of precipitation during the nutrient-demanding crop stages can lead to water insufficiency.

Supplementary Materials

The following are available online at https://www.mdpi.com/2073-4395/10/6/889/s1, Figure S1: Monthly precipitation and mean air temperature in crop vegetation period 2017 and 2018 and according to climatic normal (1961–1990) [35], Figure S2: Experimental site in Dolná Malanta, Slovakia with grown crops: maize in 2017 and spring barley in 2018, Figure S3: Differences in observed grain yield after biochar and N fertilizer application at the experimental site, Dolná Malanta, based on comparison to the relevant control treatments. Table S1: Evaluation of monthly precipitation and mean air temperature normality in 2017 and 2018 as compared to climatic normal for 1961–1990 [35], according to the methodology of Kožnarová and Klabzuba [72], Table S2: Matrix of Pearson product-moment correlation coefficients and their significance for soil properties studied during vegetation season in 2017 (df = 52), Table S3: Matrix of Pearson product-moment correlation coefficients and their significance for soil properties studied during vegetation season in 2018 (df = 34), Table S4: Matrix of Pearson product-moment correlation coefficients and their significance for soil properties and crop yield parameters studied during vegetation season in 2017 (df = 7), Table S5: Matrix of Pearson product-moment correlation coefficients and their significance for soil properties and crop yield parameters studied during vegetation season in 2018 (df = 7).

Author Contributions

Conceptualization, E.A. and V.Š.; methodology, E.A. and V.Š.; investigation, E.A., V.Š., J.H. and D.I.; resources, E.A. and V.Š.; data curation, E.A. and V.Š.; formal analysis, E.A. and V.Š.; writing—original draft preparation, E.A. and V.Š.; writing—review and editing, J.H. and D.I.; validation, E.A., V.Š., J.H. and D.I.; visualization, E.A. and V.Š.; project administration, E.A., V.Š. and J.H.; funding acquisition, E.A.; J.H. and D.I. All authors have read and agreed to the published version of the manuscript.

Funding

This research was funded by the SCIENTIFIC GRANT AGENCY, grant number VEGA 1/0747/20 and VEGA 1/0064/19, the SLOVAK RESEARCH AND DEVELOPMENT AGENCY under the contract No. APVV-15-0160 and CULTURAL AND EDUCATIONAL GRANT AGENCY, grant number KEGA 019SPU-4/2020. Further, this publication is the result of the project implementation: “Scientific support of climate change adaptation in agriculture and mitigation of soil degradation” (ITMS2014+ 313011W580) supported by the Integrated Infrastructure Operational Programme funded by the ERDF.

Conflicts of Interest

The authors declare no conflict of interest. The funders had no role in the design of the study; in the collection, analyses, or interpretation of data; in the writing of the manuscript, or in the decision to publish the results.

References

  1. Scherr, S.J.; Yadav, S. Land Degradation in the Developming World: Implications for Food, Agriculture, and the Environment to 2020. In Food, Agriculture, And The Environment, Discussion Paper 14; IFPRI: Washington, DC, USA, 1996; pp. 1–3. [Google Scholar]
  2. Wani, S.P.; Chander, G.; Pardhasaradhi, G. Soil Amendments for Sustainable Intensification. In Soil Amendments for Sustainability, Challenges and Perspectives; Taylor and Francis Group: Boca Raton, FL, USA, 2019; pp. 3–17. [Google Scholar]
  3. Curaqueo, G.; Meier, S.; Khan, N.; Cea, M.; Navia, R. Use of biochar on two volcanic soils: Effects on soil properties and barley yield. J. Soil Sci. Plant Nutr. 2014, 14, 911–924. [Google Scholar] [CrossRef] [Green Version]
  4. Glaser, B.; Birk, J.J. State of the scientific knowledge on properties and genesis of Anthropogenic Dark Earths in Central Amazonia (terra preta de ’ındio). Geochim. Cosmochim. Acta 2012, 82, 39–51. [Google Scholar] [CrossRef]
  5. Sohi, S.P.; Krull, E.; Lopez-Capel, E.; Bol, R. A review of biochar and its use and function in soil. Adv. Agron. 2010, 105, 47–82. [Google Scholar] [CrossRef]
  6. Atkinson, C.J.; Fitzgerald, J.D.; Hipps, N.A. Potential mechanisms for achieving agricultural benefits from biochar application to temperate soils: A review. Plant Soil 2010, 337, 1–18. [Google Scholar] [CrossRef]
  7. Barrow, C.J. Biochar: Potential for countering land degradation and for improving agriculture. Appl. Geogr. 2012, 34, 21–28. [Google Scholar] [CrossRef]
  8. Kuzyakov, Y.; Merino, A.; Pereira, P. Ash and fire, char, and biochar in the environment. Land Degrad. Dev. 2018, 29, 2040–2044. [Google Scholar] [CrossRef]
  9. De Jesus Duarte, S.; Glaser, B.; Pellegrino Cerri, C. Effect of biochar particle size on physical, hydrological and chemical properties of loamy and sandy tropical soils. Agronomy 2019, 9, 165. [Google Scholar] [CrossRef] [Green Version]
  10. Tammeorg, P.; Bastos, A.C.; Jeffery, S.; Rees, F.; Kern, J.; Graber, E.R.; Ventura, M.; Kibblewhite, M.; Amaro, A.; Budai, A.; et al. Biochars in soils: Towards the required level of scientific understanding. J. Environ. Eng. Landsc. Manag. 2017, 25, 192–207. [Google Scholar] [CrossRef] [Green Version]
  11. Horák, J.; Kondrlová, E.; Igaz, D.; Šimanský, V.; Felber, R.; Lukac, M.; Balashov, E.; Buchkina, N.; Rizhiya, E.Y.; Jankowski, M. Biochar and biochar with N–fertilizer affect soil N2O emission in Haplic Luvisol. Biologia 2017, 72, 9. [Google Scholar] [CrossRef]
  12. Igaz, D.; Šimanský, V.; Horák, J.; Kondrlová, E.; Domanová, J.; Rodný, M.; Buchkina, N.P. Can a single dose of biochar affect selected soil physical and chemical characteristics? J. Hydrol. Hydromech. 2018, 66, 421–428. [Google Scholar] [CrossRef] [Green Version]
  13. Hardy, B.; Cornelis, J.T.; Houben, D.; Leifeld, J.; Lambert, R.; Dufey, J.E. Evaluation of the long-term effect of biochar on properties of temperate agricultural soil at pre-industrial charcoal kiln sites in Wallonia, Belgium: Effect of pre-industrial charcoal kilns on agricultural soil properties. Eur. J. Soil Sci. 2017, 68, 80–89. [Google Scholar] [CrossRef] [Green Version]
  14. Lone, A.H.; Najar, G.R.; Ganie, M.A.; Sofi, J.A.; Ali, T. Biochar for sustainable soil health: A review of prospects and concerns. Pedosphere 2015, 25, 639–653. [Google Scholar] [CrossRef]
  15. El-Naggar, A.; Lee, S.S.; Rinkelebe, J.; Farooq, M.; Song, H.; Sarmah, A.K.; Zimmerman, A.R.; Ahmad, M.; Shaheen, S.M.; Ok, Y.S. Biochar application to low fertility soils: A review of current status, and future prospects. Geoderma 2019, 337, 536–554. [Google Scholar] [CrossRef]
  16. Horák, J.; Šimanský, V.; Igaz, D.; Juriga, M.; Aydin, E.; Lukac, M. Biochar: An important component ameliorating the productivity of intensively used soils—Review. Pol. J. Environ. Stud. 2020, 29, 2995–3001. [Google Scholar] [CrossRef]
  17. Wang, L.; Butterly, C.R.; Wang, Y.; Herath, H.M.S.K.; Xi, Y.G.; Xiao, X.J. Effect of crop residue biochar on soil acidity amelioration in strongly acidic tea garden soils. Soil Use Manag. 2014, 30, 119–128. [Google Scholar] [CrossRef]
  18. Šimanský, V.; Horák, J.; Igaz, D.; Jonczak, J.; Markiewicz, M.; Felber, R.; Rizhiya, E.Y.; Lukac, M. How dose of biochar and biochar with nitrogen can improve the parameters of soil organic matter and soil structure? Biologia 2016, 71, 989–995. [Google Scholar] [CrossRef]
  19. Lehmann, J.; Rillig, M.C.; Thies, J.; Masiello, C.A.; Hockaday, W.C.; Crowley, D. Biochar effects on soil biota—A review. Soil Biol. Biochem. 2011, 43, 1812–1836. [Google Scholar] [CrossRef]
  20. Baronti, S.; Alberti, G.; Vedove, G.D.; Gennaro, F.D.; Fellet, G.; Genesio, L.; Miglietta, F.; Peressotti, A.; Vaccari, F.P. The biochar option to improve plant yields: First results from some field and pot experiments in Italy. Ital. J. Agron. 2010, 5, 3–11. [Google Scholar] [CrossRef] [Green Version]
  21. Jeffery, S.; Verheijen, F.G.A.; van der Velde, M.; Bastos, A.C. A quantitative review of the effects of biochar application to soils on crop productivity using meta-analysis. Agric. Ecosyst. Environ. 2011, 144, 175–187. [Google Scholar] [CrossRef]
  22. Subedi, R.; Bertora, C.; Zavattaro, L.; Grignani, C. Crop response to soils amended with biochar: Expected benefits and unintended risks. Ital. J. Agron. 2017, 12, 161–173. [Google Scholar] [CrossRef] [Green Version]
  23. Yu, H.; Zou, W.; Chen, J.; Chen, H.; Yu, Z.; Huang, J.; Tang, H.; Wei, X.; Gao, B. Biochar amendment improves crop production in problem soils: A review. J. Environ. Manag. 2019, 232, 8–21. [Google Scholar] [CrossRef] [PubMed]
  24. Liu, X.; Zhang, A.; Ji, C.; Joseph, S.; Bian, R.; Li, L.; Pan, G.; Paz-Ferreiro, J. Biochar’s effect on crop productivity and the dependence on experimental conditions—A meta-analysis of literature data. Plant Soil 2013, 373, 583–594. [Google Scholar] [CrossRef]
  25. Blanco-Canqui, H. Biochar and soil physical properties. Soil Sci. Soc. Am. J. 2017, 81, 687–711. [Google Scholar] [CrossRef] [Green Version]
  26. Al-Wabel, M.I.; Hussain, Q.; Usman, A.R.A.; Ahmad, M.; Abduljabbar, A.; Sallam, A.S.; Ok, Y.S. Impact of biochar properties on soil conditions and agricultural sustainability: A review. Land Degrad. Dev. 2018, 29, 2124–2161. [Google Scholar] [CrossRef]
  27. Edeh, I.G.; Mašek, O.; Buss, W. A meta-analysis on biochar’s effects on soil water properties – New insights and future research challenges. Sci. Total Environ. 2020, 714, 136857. [Google Scholar] [CrossRef] [PubMed]
  28. Burrell, L.D.; Zehetner, F.; Rampazzo, N.; Wimmer, B.; Soja, G. Long-term effects of biochar on soil physical properties. Geoderma 2016, 282, 96–102. [Google Scholar] [CrossRef]
  29. Bai, N.; Zhang, H.; Li, S.; Zheng, X.; Zhang, J.; Zhang, H.; Zhou, S.; Sun, H.; Lv, W. Long-term effects of straw and straw-derived biochar on soil aggregation and fungal community in a rice—Wheat rotation system. PeerJ 2019, 6, 1–19. [Google Scholar] [CrossRef] [PubMed] [Green Version]
  30. Li, Y.; Feng, G.; Tewolde, H. Field Application of Biochar: Long Term Effect on the Physical and Hydraulic Properties of a Silty Loam Soil. In Proceedings of the ASA-CSSA-SSSA International Annual Meetings, San Antonio, TX, USA, 10–13 November 2019; Available online: https://scisoc.confex.com/scisoc/2019am/meetingapp.cgi/Paper/119406 (accessed on 29 April 2020).
  31. Brtnicky, M.; Dokulilova, T.; Holatko, J.; Pecina, V.; Kintl, A.; Latal, O.; Vyhnanek, T.; Prichystalova, J.; Datta, R. Long-term effects of biochar-based organic amendments on soil microbial parameters. Agronomy 2019, 9, 747. [Google Scholar] [CrossRef] [Green Version]
  32. Du, Z.; Chen, X.; Qi, X.; Li, Z.; Nan, J.; Deng, J. The effects of biochar and hoggery biogas slurry on fluvo-aquic soil physical and hydraulic properties: A field study of four consecutive wheat–maize rotations. J. Soils Sediments 2016, 16, 2050–2058. [Google Scholar] [CrossRef]
  33. Altdorff, D.; Galagedara, L.; Abedin, J.; Unc, A. Effect of biochar application rates on the hydraulic properties of an agricultural-use boreal podzol. Soil Syst. 2019, 3, 53. [Google Scholar] [CrossRef] [Green Version]
  34. Karer, J.; Wimmer, B.; Zehetner, F.; Kloss, S.; Soja, G. Biochar application to temperate soils: Effects on nutrient uptake and crop yield under field conditions. Agric. Food Sci. 2013, 22, 390–403. [Google Scholar] [CrossRef] [Green Version]
  35. Šiška, B.; Špánik, F.; Repa, Š.; Gálik, M. Praktická Biometeorológia [Practical Biometeorology]; Slovenská Poľnohospodárska Univerzita: Nitra, Slovakia, 2005. (In Slovak) [Google Scholar]
  36. FAO. World Reference Base for Soil Resources 2014: International Soil Classification System for Naming Soils and Creating Legends for Soil Maps; FAO: Rome, Italy, 2015. [Google Scholar]
  37. Kondrlova, E.; Horak, J.; Igaz, D. Effect of biochar and nutrient amendment on vegetative growth of spring barley (Hordeum vulgare L. var. Malz). Aust. J. Crop Sci. 2018, 12, 178–184. [Google Scholar] [CrossRef]
  38. Horák, J. Testing biochar as a possible way to ameliorate slightly acidic soil at the research field located in the danubian lowland. Acta Hortic. Reg. 2015, 18, 20–24. [Google Scholar] [CrossRef] [Green Version]
  39. Hrivňáková, K.; Makovníková, J.; Barančíková, G.; Bezák, P.; Bezáková, Z.; Dodok, R.; Grečo, V.; Chlpík, J.; Kobza, J.; Lištjak, M.; et al. Uniform Methods Of Soil Analyses; VÚPOP: Bratislava, Slovakia, 2011. [Google Scholar]
  40. Dziadowiec, H.; Gonet, S. Przewodnik Metodyczny do Badań Materii Organicznej Gleb [Methodological Guidebook For The Organic Matter Researches]; Prace Komisji Naukowych Polskiego Towarzystwa Naukowego 120: Warszawa, Poland, 1999; pp. 31–34. (In Polish) [Google Scholar]
  41. Walkley, A. An examination of methods for determining organic carbon and nitrogen in soils. With one text-figure. J. Agric. Sci. 1935, 25, 598–609. [Google Scholar] [CrossRef]
  42. Loginow, W.; Wisniewski, W.; Gonet, S.S.; Ciescinska, B. Fractionation of organic carbon based on susceptibility to oxidation. Pol. J. Soil Sci. 1987, 20, 47–52. [Google Scholar]
  43. AHDB. Barley Growth Guide. Available online: https://projectblue.blob.core.windows.net/media/Default/Imported%20Publication%20Docs/Barley%20growth%20guide%20130718.pdf (accessed on 27 April 2020).
  44. Ghosh, S.; Ow, L.F.; Yusof, M.L. Biochar Application for Sustainable Soil Quality. A Case sTudy in Tropical Urban Environment. In Soil Amendments For Sustainability, Challenges And Perspectives; Taylor and Francis Group: Boca Raton, FL, USA, 2019; pp. 313–319. [Google Scholar]
  45. Kováčik, P.; Ryant, P. Agrochémia, Princípy A Prax [Agrochemistry, Principles And Practice]; SPU: Nitra, Slovakia, 2019. (In Slovak) [Google Scholar]
  46. Roy, R.N.; Finck, A.; Blair, G.J.; Tandon, H.L.S. Plant Nutrition for Food Security. A Guide for Integrated Nutrient Management. Available online: http://www.fao.org/3/a-a0443e.pdf (accessed on 18 June 2020).
  47. Chodak, M.; Pietrzykowski, M.; Sroka, K. Physiological profiles of microbial communities in mine soils afforested with different tree species. Ecol. Eng. 2015, 81, 462–470. [Google Scholar] [CrossRef]
  48. Kim, H.S.; Kim, K.R.; Kim, H.J.; Kim, K.H.; Yang, J.E.; Ok, Y.S.; Owens, G. Effect of biochar on heavy metal immobilization and uptake by lettuce (Lactuca sativa L.) in agricultural soil. Environ. Earth Sci. 2015, 74, 1–11. [Google Scholar] [CrossRef]
  49. Šimanský, V.; Horák, J.; Igaz, D.; Balashov, E.; Jonczak, J. Biochar and biochar with N fertilizer as a potential tool for improving soil sorption of nutrients. J. Soils Sediments 2018, 18, 1432–1440. [Google Scholar] [CrossRef]
  50. Rajkovich, S.; Enders, A.; Hanley, K.; Hyland, C.; Zimmerman, A.R.; Lehmann, J. Corn growth and nitrogen nutrition after additions of biochars with varying properties to a temperate soil. Biol. Fertil. Soils 2012, 48, 271–284. [Google Scholar] [CrossRef]
  51. Liang, B.; Lehmann, J.; Solomon, D.; Kinyangi, J.; Grossman, J.; O’Neill, B.; Skjemstad, J.O.; Thies, J.; Luizao, F.J.; Petersen, J.; et al. Black carbon increases cation exchange capacity in soils. Soil Sci. Soc. Am. J. 2006, 70, 1719–1730. [Google Scholar] [CrossRef] [Green Version]
  52. Heitkötter, J.; Marschner, B. Interactive effects of biochar ageing in soils related to feedstock, pyrolysis temperature, and historic charcoal production. Geoderma 2015, 245, 56–64. [Google Scholar]
  53. Fischer, D.; Glaser, B. Synergisms between Compost and Biochar for Sustainable Soil Amelioration. In Management of Organic Waste; Kumar, S., Bharti, A., Eds.; Tech Europe: Rijeka, Croatia, 2012; pp. 167–198. [Google Scholar]
  54. Whitman, T.; Singh, B.P.; Zimmerman, A.R. Priming Effects in Biochar-Amended Soils: Implications of Biochar-Soil Organic Matter Interactions for Carbon Storage. In Biochar for Environmental Management, Science, Technology and Implementation; Taylor and Francis Group: London, UK; New York, NY, USA, 2015; pp. 455–487. [Google Scholar]
  55. Singh, B.P.; Cowie, A.L. Long-term influence of biochar on native organic carbon mineralisation in carbon clayey soil. Sci. Rep. 2014, 4, 1–9. [Google Scholar] [CrossRef] [Green Version]
  56. Conteh, A.; Blair, G.J.; Lefroy, R.D.B.; Whitbread, A. Labile organic carbon determined by permangante oxidation and its relationships to other measurements of soil organic carbon. Humic Subst. Environ. 1999, 1, 3–15. [Google Scholar]
  57. Kuzyakov, Y.; Friedel, J.K.; Stahr, K. Review of mechanisms and quantification of priming effects. Soil Biol. Biochem. 2000, 32, 1485–1498. [Google Scholar] [CrossRef]
  58. Hütsch, B.W.; Augustin, J.; Merbach, W. Plant rhizodeposition – an important source for carbon turnover in soils. J. Plant Nutr. Soil Sci. 2002, 165, 397–407. [Google Scholar] [CrossRef]
  59. Janzen, H.H.; Campell, C.A.; Ellert, B.H.; Bremer, E. Soil Organic Matter Dynamics and Their Relationship to Soil Quality. In Soil Quality For Crop Production And Ecosystem Health; Elsevier: Amsterdam, The Netherlands, 1997; pp. 277–291. [Google Scholar]
  60. Spaccini, R.; Piccolo, A.; Conte, P.; Haberhauder, G.; Gerzabek, M.H. Increased soil organic carbon sequestration through hydrophobic production by humic substances. Soil Biol. Biochem. 2002, 34, 1839–1851. [Google Scholar] [CrossRef]
  61. Jindo, K.; Sonoki, T.; Matsumoto, K.; Canellas, L.; Roig, A.; Sanchez-Monedero, M.A. Influence of biochar addition on the humic substances of composting manures. Waste Manag. 2016, 49, 545–552. [Google Scholar] [CrossRef] [PubMed]
  62. Lopez-Capel, E.; Zwart, K.; Shackley, S.; Postma, R.; Stenstrom, J.; Rasse, D.P.; Budai, A.; Glaser, B. Biochar Properties. In Biochar in European Soils And Agriculture; Shackley, S., Ruysschaert, G., Zwart, K., Glaser, B., Eds.; Routledge: London, UK; New York, NY, USA, 2016; pp. 41–72. [Google Scholar]
  63. Li, H.; Yutong, W.; Tianpei, W.; Hungrui, M. Effect of biochar on organic matter conservation and metabolic quotient of soil. Environ. Prog. Sustain. Energy 2015, 34, 1467–1472. [Google Scholar] [CrossRef]
  64. Szombathová, N. The comparison of soil carbon susceptibility to oxidation by KMnO4 solutions in different farming systems. Humic Subst. Environ. 1999, 1, 35–39. [Google Scholar]
  65. Zhao, S.; Ta, N.; Li, Z.; Yang, Y.; Zhang, X.; Liu, D.; Zhang, A.; Wang, X. Varying pyrolysis temperature impacts application effects of biochar on soil labile organic carbon and humic substances. Appl. Soil Ecol. 2017, 116, 399–409. [Google Scholar]
  66. Haynes, R.J. Labile organic matter fractions as central components of the quality of agricultural soils: An overview. Adv. Agron. 2005, 85, 221–268. [Google Scholar]
  67. Adani, F.; Genevini, P.; Ricca, G.; Tambone, F.; Montoneri, E. Modyfication of soil humic matter after 4 years of compost application. Waste Manag. 2007, 27, 319–324. [Google Scholar] [CrossRef]
  68. Mierzwa-Hersztek, M.; Gondek, K.; Kopeć, M.; Ukalska-Jaruga, A. Biochar changes in soil based on quantitative and qualitative humus compounds parameters. Soil Sci. Ann. 2018, 69, 234–242. [Google Scholar] [CrossRef] [Green Version]
  69. STATdat. Branch Statistics > Agriculture, Forestry, Fisheries > Yields of Selected Agricultural Crops > Select Data > Hectare Yields (Tons). Available online: http://statdat.statistics.sk (accessed on 12 April 2020).
  70. NPCC; Skalský, R.; Slivková, M.; Kusý, D.; Sviček, M. Odhad Úrody a Produkcie Kukurice na Zrno, Cukrovej Repy Technickej, Slnečnice Ročnej a Zemiakov [Estimation of Harvest and Production of Maize, Sugar Beet, Sunflower and Potatoes]. 2018. Available online: http://www.podnemapy.sk/portal/verejnost/akt_poln_sezona/_vystupy/Odhad_200818.pdf (accessed on 12 April 2020).
  71. NPPC; Hašana, R.; Bušo, R.; Polakovič, J.; Zeleňáková, K.; Brezinová, M.; Vráblová, E.; Urbanová, E.; Palkovičová, D. Prognóza Úrody Pšenice Letnej f. Ozimnej a Jačmeňa Siateho Jarného v Roku 2019 [Yield Forecast of Winter Wheat and Spring Barley in 2019]. 2019. Available online: http://www.nppc.sk/pdf/SummerwheatcropPrognoza_urody_psenice_ozimnej_v_roku_2019.pdf (accessed on 12 April 2020).
  72. Kožnarová, V.; Klabzuba, J. Recommendation of world meteorological organization to describing meteorological or climatological conditions—Information. Plant Soil Environ. 2011, 48, 190–192. [Google Scholar] [CrossRef] [Green Version]
  73. Bárek, V.; Halaj, P.; Igaz, D. The Influence of Climate Change on Water Demands for Irrigation of Special Plants and Vegetables in Slovakia. In Bioclimatology and Natural Hazards; Springer: Dordrecht, NL, USA, 2009; pp. 271–282. [Google Scholar]
  74. Igaz, D.; Bárek, V.; Halaj, P.; Takáč, J.; Čimo, J. A comparison of measured soil moisture with simulated results obtained by selected models for Danubian lowland. Cereal Res. Commun. 2008, 36, 1619–1622. [Google Scholar]
  75. Cimo, J.; Malencikova, T.; Szomorova, L. Agroclimatic Indicators Review in Danubian Lowland for Period 1961–2000. In Proceedings of the 15th International Multidisciplinary Scientific GeoConference SGEM 2015, Albena, Bulgaria, 18–24 June 2015; Volume 2, pp. 433–440. [Google Scholar]
  76. Nleya, T.; Kleinja, J. Corn Growth and Development. Available online: https://extension.sdstate.edu/sites/default/files/2019-09/S-0003-05-Corn.pdf (accessed on 2 May 2020).
  77. Wardle, D.A.; Nilsson, M.C.; Zackrisson, O. Fire-derived charcoal causes loss of forest humus. Science 2018, 320, 629. [Google Scholar] [CrossRef] [PubMed]
  78. Keith, A.; Singh, B.; Singh, B.P. Interactive priming of biochar and labile organic matter mineralization in a smectite-rich soil. Environ. Sci. Technol. 2011, 45, 9611–9618. [Google Scholar] [CrossRef]
  79. Whitman, T.; Pal Singh, B.; Zimmerman, A.R. Priming Effects in Biochar-Amended Soils: Implications of Biochar-Soil Organic Matter Interactions for Carbon Storage. In Biochar For Environmental Management, 2nd ed.; Lehmann, J., Joseph, S., Eds.; Routledge: London, UK, 2015; pp. 455–488. [Google Scholar]
  80. Monostori, T. Crop Production. Available online: http://publicatio.bibl.u-szeged.hu/5833/1/CROP%20PRODUCTION%20-%20Tam%C3%A1s%20Monostori.pdf (accessed on 17 June 2020).
  81. Agegnehu, G.; Nelson, P.N.; Bird, M.I. The effects of biochar, compost and their mixture and nitrogen fertilizer on yield and nitrogen use efficiency of barley grown on a Nitisol in the highlands of Ethiopia. Sci. Total Environ. 2016, 569, 869–879. [Google Scholar] [CrossRef] [PubMed]
  82. Horák, J.; Šimanský, V.; Aydin, E. Benefits of biochar and its combination with nitrogen fertilization for soil quality and grain yields of barley, wheat and corn. J. Elem. 2020, 25, 16. [Google Scholar] [CrossRef]
  83. Gathorne-Hardy, A.E. The Role of Biochar in English Agriculture—Agronomy, Biodiversity, Economics and Climate Change. Ph.D. Thesis, Centre for Environmental Policy, Imperial College, London, UK, 2012. [Google Scholar]
  84. Yanai, Y.; Toyota, K.; Okazaki, M. Effects of charcoal addition on N2O emissions from soil resulting from rewetting air-dried soil in short-term laboratory experiments. Soil Sci. Plant Nutr. 2007, 53, 181–188. [Google Scholar] [CrossRef]
  85. Major, J.; Rondon, M.; Molina, D.; Riha, S.J.; Lehmann, J. Maize yield and nutrition during 4 years after biochar application to a Colombian savanna oxisol. Plant Soil 2010, 333, 117–128. [Google Scholar] [CrossRef]
Figure 1. Dynamics of soil pH and sorption parameters during vegetation season in 2017–2018: (A) soil pH, (B) hydrolytic acidity, (C) sum of basic cations, (D) cation exchange capacity, (E) base saturation. Treatments are mentioned in the Material and Methods Section. Vegetation season in 2017 represents April to September and in 2018 from April to July. (4: April, 5: May, 6: June, 7: July, 8: August, 9: September). Different letters (a, b, c) indicate that treatment means are significantly different at p ≤ 0.05 according to the LSD multiple-range test.
Agronomy 10 00889 g001
Figure 2. Dynamics of soil organic matter and humus parameters during the vegetation season in 2017–2018: (A) soil organic carbon, (B) labile carbon, (C) humus substances, (D) humic acids, (E) fulvic acids, (F) humic acids to fulvic acids ration. Treatments are mentioned in the Material and Methods Section. The vegetation season in 2017 represents April to September and in 2018, from April to July (4: April, 5: May, 6: June, 7: July, 8: August, 9: September). Different letters (a, b, c) indicate that treatment means are significantly different at p ≤ 0.05 according to the LSD multiple-range test.
Agronomy 10 00889 g002
Figure 3. Dynamics of humus parameters during the vegetation season in 2017–2018: (A) color quotient of humus substances. (B) color quotient of humic acids. Treatments are mentioned in the Material and Methods Section. The vegetation season in 2017 represents April to September and in 2018, from April to July (4: April, 5: May, 6: June, 7: July, 8: August, 9: September). Different letters (a, b, c) indicate that treatment means are significantly different at p ≤ 0.05 according to the LSD multiple-range test.
Agronomy 10 00889 g003
Figure 4. Effect of biochar and fertilizer application on the grain yield of maize in 2017 (fourth year after biochar application) and spring barley in 2018 (fifth year after biochar application) (means ± standard error; n = 3), in comparison to average crop yield (dashed line). Different letters indicate significant difference between treatments at the same fertilization level (N0, N1, N2) at p ≤ 0.05 according to the LSD multiple-range test.
Agronomy 10 00889 g004
Table 1. Characteristics of a Haplic Luvisol at Dolná Malanta before the experiment.
Soil PropertiesValues
Clay (g kg−1)249
Silt (g kg−1)599
Sand (g kg−1)152
Soil organic carbon (g kg−1)9.13
CEC (mmol kg−1)85
Base saturation (%)142
pH (in 1 mol dm−3 KCl)5.71
Note: CEC–cation exchange capacity.
Table 2. List of investigated treatments and overview of individual amounts of applied biochar and inorganic fertilizer of the field experiment.
TreatmentDescription
B0N0no biochar, no N fertilization
B10N0biochar at rate of 10 t ha−1, no N fertilization
B20N0biochar at rate of 20 t ha−1, no N fertilization
B0N1no biochar combined with first level of N fertilization: doses of N were 160 and 40 kg N ha−1 in 2017 and 2018, respectively
B10N1biochar at rate of 10 t ha−1 with N: doses of N were 160 and 40 kg N ha−1 in 2017 and 2018, respectively
B20N1biochar at rate of 20 t ha−1 with N: doses of N were 160 and 40 kg N ha−1 in 2017 and 2018, respectively
B0N2no biochar combined with second level of N fertilization: doses of N were 240 and 80 kg N ha−1 in 2017 and 2018, respectively
B10N2biochar at rate of 10 t ha−1 with N: doses of N were 240 and 80 kg N ha−1 in 2017 and 2018, respectively
B20N2biochar at rate of 20 t ha−1 with N: doses of N were 240 and 80 kg N ha−1 in 2017 and 2018, respectively
Table 3. Dynamics of soil pH and sorptive parameters according to the results of the Mann–Kendall test.
TreatmentspHKClHaSBCCECBs
Mann–Kendall Trends
B0N0Stable/No TrendStable/No TrendIncreasingIncreasingStable/No Trend
B10N0Stable/No TrendStable/No TrendStable/No TrendStable/No TrendStable/No Trend
B20N0Stable/No TrendStable/No TrendStable/No TrendStable/No Trend gStable/No Trend
B0N1DecreasingIncreasingStable/No TrendStable/No TrendDecreasing
B10N1Stable/No TrendStable/No TrendStable/No TrendStable/No TrendStable/No Trend
B20N1Stable/No TrendStable/No TrendStable/No TrendStable/No TrendStable/No Trend
B0N2DecreasingIncreasingStable/No TrendStable/No TrendDecreasing
B10N2Stable/No TrendIncreasingStable/No TrendStable/No TrendDecreasing
B20N2IncreasingStable/No TrendIncreasingIncreasingStable/No Trend
Ha—hydrolytic acidity, SBC—sum of basic cations, CEC—cation exchange capacity, Bs—base saturation.
Table 4. Dynamics of soil organic matter and humus parameters according to the results of the Mann–Kendall test.
TreatmentsCorgCLHSHAFAHA:FAQ4/6HSQ4/6HA
Mann–Kendall Trends
B0N0Stable/No TrendStable/No TrendStable/No TrendStable/No TrendIncreasingStable/No TrendStable/No TrendStable/No Trend
B10N0DecreasingStable/No TrendStable/No TrendStable/No TrendIncreasingDecreasingStable/No TrendIncreasing
B20N0DecreasingIncreasingStable/No TrendStable/No TrendStable/No TrendDecreasingStable/No TrendIncreasing
B0N1Stable/No TrendStable/No TrendStable/No TrendStable/No TrendStable/No TrendStable/No TrendStable/No TrendStable/No Trend
B10N1Stable/No TrendStable/No TrendStable/No TrendStable/No TrendStable/No TrendStable/No TrendStable/No TrendStable/No Trend
B20N1Stable/No TrendStable/No TrendStable/No TrendStable/No TrendStable/No TrendStable/No TrendStable/No TrendIncreasing
B0N2Stable/No TrendStable/No TrendStable/No TrendStable/No TrendStable/No TrendStable/No TrendStable/No TrendStable/No Trend
B10N2Stable/No TrendStable/No TrendStable/No TrendStable/No TrendStable/No TrendStable/No TrendStable/No TrendStable/No Trend
B20N2Stable/No TrendStable/No TrendStable/No TrendStable/No TrendStable/No TrendStable/No TrendStable/No TrendIncreasing
Corg—soil organic carbon, CL—labile carbon, HS—humus substances, HA—humic acids, FA—fulvic acids, HA:FA—humic acids to fulvic acids ratio, Q4/6HS—color quotient of humus substances, Q4/6HA—color quotient of humic acids. Treatments are mentioned in the Material and Methods Section.
Table 5. The selected yield parameters of maize and spring barley in the third and fourth year after biochar application, respectively (means ± standard error; n = 3).
TreatmentsAboveground Biomass (t ha−1)No. of Plants (m2)Ears per PlantGrains per EarWeight of 1000 Grains (g)
No fertilization: N0Year 2017, crop: maize
B0N012.9 ± 0.8 a10.5 ± 0.9 a1.0 ± 0.0 ab325 ± 26.6 a216.3 ± 24.3 a
B10N011.2 ± 0.2 a7.5 ± 0.9 a1.2 ± 0.1 b294 ± 13.4 a227.3 ± 6.7 a
B20N010.9 ± 3.4 a10.0 ± 1.0 a0.9 ± 0.1 a307 ± 72.9 a190.7 ± 8.1 a
Fertilization: N1
B0N112.7 ± 1.6 a9.0 ± 0.0 ab1.8 ± 0.8 a261 ± 78.8 a211.0 ± 14.7 a
B10N19.8 ± 1.4 a7.5 ± 0.0 a1.0 ± 0.0 a323 ± 32.9 a216.0 ± 7.1 a
B20N114.1 ± 0.8 a10.5 ± 1.5 b1.0 ± 0.0 a369 ± 25.0 a204.9 ± 12.7 a
Fertilization: N2
B0N215.3 ± 3.8 a9.0 ± 0.9a1.3 ± 0.2 b255 ± 31.9 a266.1 ± 9.4 b
B10N211.5 ± 1.8 a9.0 ± 1.5 a1.0 ± 0.0 ab362 ± 41.7 b200.9 ± 16.2 a
B20N213.1 ± 1.1 a9.5 ± 0.5 a0.9 ± 0.1 a393 ± 8.1 b199.6 ± 9.4 a
No fertilization: N0Year 2018, crop: spring barley
B0N08.6 ± 0.8 a250.7 ± 46.3 a2.6 ± 0.2 a13 ± 0.5 a38.9 ± 1.0 a
B10N07.5 ± 2.0 a298.7 ± 32.4 a2.0 ± 0.2 a12 ± 1.0 a38.5 ± 1.7 a
B20N07.9 ± 1.0 a357.3 ± 17.5 a1.7 ± 0.3 a13 ± 2.3 a34.5 ± 2.6 a
Fertilization: N1
B0N19.3 ± 2.4 a296.0 ± 32.3 a2.0 ± 0.4 a14 ± 0.7 a40.3 ± 1.2 a
B10N18.2 ± 0.1 a312.0 ± 21.2 a1.7 ± 0.0 a12 ± 1.3 a40.6 ± 1.9 a
B20N19.2 ± 0.3 a237.3 ± 18.7 a2.2 ± 0.5 a15 ± 0.7 a43.2 ± 1.5 a
Fertilization: N2
B0N211.3 ± 1.3 a258.7 ± 53.1 a2.5 ± 0.2 a15 ± 0.8 a42.0 ± 0.8 a
B10N29.7 ± 2.1 a248.0 ± 37.8 a2.4 ± 0.4 a14 ± 4.6 a40.5 ± 2.5 a
B20N212.8 ± 3.6 a413.3 ± 131.4 a2.1 ± 0.1 a14 ± 1.4 a38.9 ± 2.3 a
Different letters indicate significant difference between treatments at the same fertilization level at p ≤ 0.05 according to the LSD multiple-range test.

