Article

RiceSAP: An Efficient Satellite-Based AquaCrop Platform for Rice Crop Monitoring and Yield Prediction on a Farm- to Regional-Scale

by
Watcharee Veerakachen
1,* and
Mongkol Raksapatcharawong
2
1
Department of Electrical Engineering, Engineering Faculty, Kasetsart University, Bangkok 10900, Thailand
2
Chulabhorn Satellite Receiving Station, Engineering Faculty, Kasetsart University, Bangkok 10900, Thailand
*
Author to whom correspondence should be addressed.
Agronomy 2020, 10(6), 858; https://doi.org/10.3390/agronomy10060858
Submission received: 2 June 2020 / Accepted: 13 June 2020 / Published: 17 June 2020
(This article belongs to the Special Issue Remote Sensing of Agricultural Monitoring)

Abstract

:
Advanced technologies in the agricultural sector have been adopted as global trends in response to the impact of climate change on food sustainability. An ability to monitor and predict crop yields is imperative for effective agronomic decision making and better crop management. This work proposes RiceSAP, a satellite-based AquaCrop processing system for rice whose climatic input is derived from TERRA/MODIS-LST and FY-2/IR-rainfall products to provide crop monitoring and yield prediction services at regional-scale with no need for weather station. The yield prediction accuracy is significantly improved by our proposed recalibration algorithm on the simulated canopy cover (CC) using Sentinel-2 NDVI product. A developed mobile app provides an intuitive interface for collecting farm-scale inputs and providing timely feedbacks to farmers to make informed decisions. We show that RiceSAP could predict yields 2 months before harvest with a mean absolute percentage error (MAPE) of 14.8%, in the experimental field. Further experiments on randomly selected 20 plots with various soil series showed comparable results with an average MAPE of 16.7%. Thus, this work is potentially applicable countrywide; and can be beneficial to all stakeholders in the entire rice supply chain for effective adaptation to climate change.

1. Introduction

Global climate change has driven adaptations in the agricultural sector to promote sustainable food and agricultural practices for the future [1]. To ensure food security and effective adaptation to climate change, timely crop monitoring and accurate yield prediction are necessary. Advanced technologies have been applied to smart agriculture towards better crop management [2]. Among emerging technologies, remote sensing has a very high potential in agriculture, because it can draw inferences about climate and vegetation conditions in a non-destructive manner. Satellite remote sensing provides effective approaches for timely crop monitoring and yield forecasting by gathering information over large areas with a high revisit frequency [3]. Various models have been used to monitor crop growth and predict yields from satellite data. Meteorological models used for yield prediction are based mainly on two variables, temperature and precipitation, which can be easily obtained from meteorological satellites. Simple regression models are used to predict crop yields. However, the use of these models may lead to inaccurate yield prediction because they do not account for rainfall distribution, runoff, drainage, or access to underground water [4]. Agrometeorological models consider the daily effects of temperature, soil moisture, the crop energy balance, or other yield-related components to successfully forecast yields. Nevertheless, they cannot fully simulate the various crop growing conditions at regional levels due to insufficient field data [5].
It is common to integrate satellite data with agrometeorological models because it can provide a near realtime assessment of the relevant parameters necessary to monitor crop conditions and estimate production at the country or state level [6]. Several satellite-derived indices are related to agronomic variables, for example, canopy cover (CC), leaf area index (LAI), biomass, grain yield, etc. Canopy cover is frequently correlated with vegetation indices (VI) from multispectral images such as normalized difference vegetation index (NDVI), the soil-adjusted vegetation index (SAVI), the simple ratio (SR), and the triangular vegetation index (TVI) [7]. Yield estimation is usually obtained by two approaches: direct and indirect methods. The first method, based on empirical or statistical models, normally derives the estimated yield directly from remote sensing data via regression analysis [8]. A good relationship between the satellite-derived VI and yield is shown to be at the grain filling stage [9]. However, these models do not provide crop response information and are only useful for identifying key relationships in the environment with available historical data sets [10]. The second method incorporates remotely-sensed data into crop simulation models (CSMs) for calibration checks of the model outputs (LAI, Biomass) [11] or adjustment of the model initial conditions [12]. CSMs are tools for simulating crop growth and estimating crop production through mathematical models by taking into account weather, crop and soil condition, and management practices as inputs [13]. These process-based models simulate crop progression using differential equations to describe crop development which require a large number of input parameters [14]. The availability of input data affects the model accuracy. Combining remotely-sensed data with CSMs could improve yield predictions by providing the missing temporal weather data of each field and enabling spatial information for simulating at regional-scale [15]. Such spatial information is imperative for CSMs to represent crop development beyond a single experimental site by adjusting model parameters for each specific fields simultaneously [16].
There are various CSMs designed for different scales of analysis, from field- to regional-scale models [17]. Decision Support System of AgroTechnology Transfer (DSSAT) simulates crop growth and yield as a function of the soil-plant-atmosphere-management dynamics. The DSSAT software package comprises crop modules for over 42 crops and offers options for new crops, products, and practices for adoption [18,19]. The World Food Studies crop growth model (WOFOST) simulates the crop growth underlying processes of photosynthesis and respiration using a carbon-driven approach and fraction of intercepted radiation [18,20]. CropSyst is designed based on water- and radiation-driven modules to predict the performance of multiple cropping systems across various genotype, soil, weather and management combinations [18,20]. However, these models, especially DSSAT, require an extensive number of variables and parameter inputs limiting their uses within the well-equipped crop fields, which is not applicable in developing countries [20]. The AquaCrop model is developed by the FAO, designed to optimally balance between simplicity, accuracy and robustness based on water-driven approach [21,22]. AquaCrop distinguishes itself from other models with its relatively small number of explicit and mostly intuitive parameters, particularly suited for perspective studies (e.g., future water policy, market prices and climatic scenarios) [23]. Assessment of the AquaCrop, CropSyst and WOFOST models in sunflower growth showed that AquaCrop offers comparable performance in simulating both biomass and yield at harvesting while requiring much less input information [20].
The integration of satellite data into CSMs has rapidly increased in recent years, due to the availability of products with higher spatial and temporal resolutions. In Southern Italy, the canopy cover estimated by Sentinel-2 NDVI product is used to adjust the AquaCrop input parameters, e.g., initial and maximum canopy cover (CCX) for effectively monitoring canopy growth and predicting irrigation water requirements during the mid-season stage of a tomato crop [24]. In Thailand [25], field measurements (LAI and weather data) were collected to generate the LAI-CC relationships for the entire crop season. Then HJ-1A/B NDVI product is calibrated with the CC values to adjust CCX parameter in AquaCrop model to predict the rice yields on small farms. This approach is not scalable as the LAI-CC relationship needs be adopted specifically for different crop characteristics and field management.
To our best knowledge, there is no work describing on how to effectively use AquaCrop for crop monitoring and rice yield prediction at farm- to regional-scale. This work contributes to such requirements as follow. First, we propose to utilize satellite products, FY-2 IR rainfall and TERRA/MODIS-LST, to adjust the initial condition and provide dekadal (10-day) climatic parameters for AquaCrop, to broaden the model’s usage to any paddy fields without weather stations. A mobile app is developed to collect crop and field managements from farmers to enable AquaCrop simulation at farm-scale. Second, we develop Alpha-I, a default set of initial condition parameters for AquaCrop, acquired from state agencies, academic works, and our experimental results, to be applicable nationwide. This is an integral part of this work to achieving regional-scale simulations. Since we endeavor to predict the yield in advance, the 5-year average historical satellite-derived climatic parameters during 2013–2017 are also integrated into Alpha-I. Consequently, AquaCrop can simulate the entire crop and predict yield even before crop starts, a distinguished feature to suggest a suitable planting date to farmers or give them time to adapt for unfortunate scenarios. Third, Sentinel-2 NDVI product is used to readjust the initial condition of the model parameters (soil fertility and canopy growth coefficient), at full canopy stage. This process recalibrates the simulated canopy cover (CC) to be closed to that observed by Sentinel-2 NDVI, thus, improving yield prediction accuracy.
These techniques have been successfully implemented as a platform called RiceSAP which is already in operational. Farmers can access to these services via RiceSAP app (available on Google Play at https://play.google.com/store/apps/details?id=com.ricetech&hl=en). The RiceSAP app works as a tool for collecting farm and field practice information for AquaCrop processing while providing crop monitoring and yield prediction to farmers for better crop management. Therefore, this platform is helpful in promoting smart agriculture in Thailand and to facilitate adaptation to climate change.

2. Materials and Methods

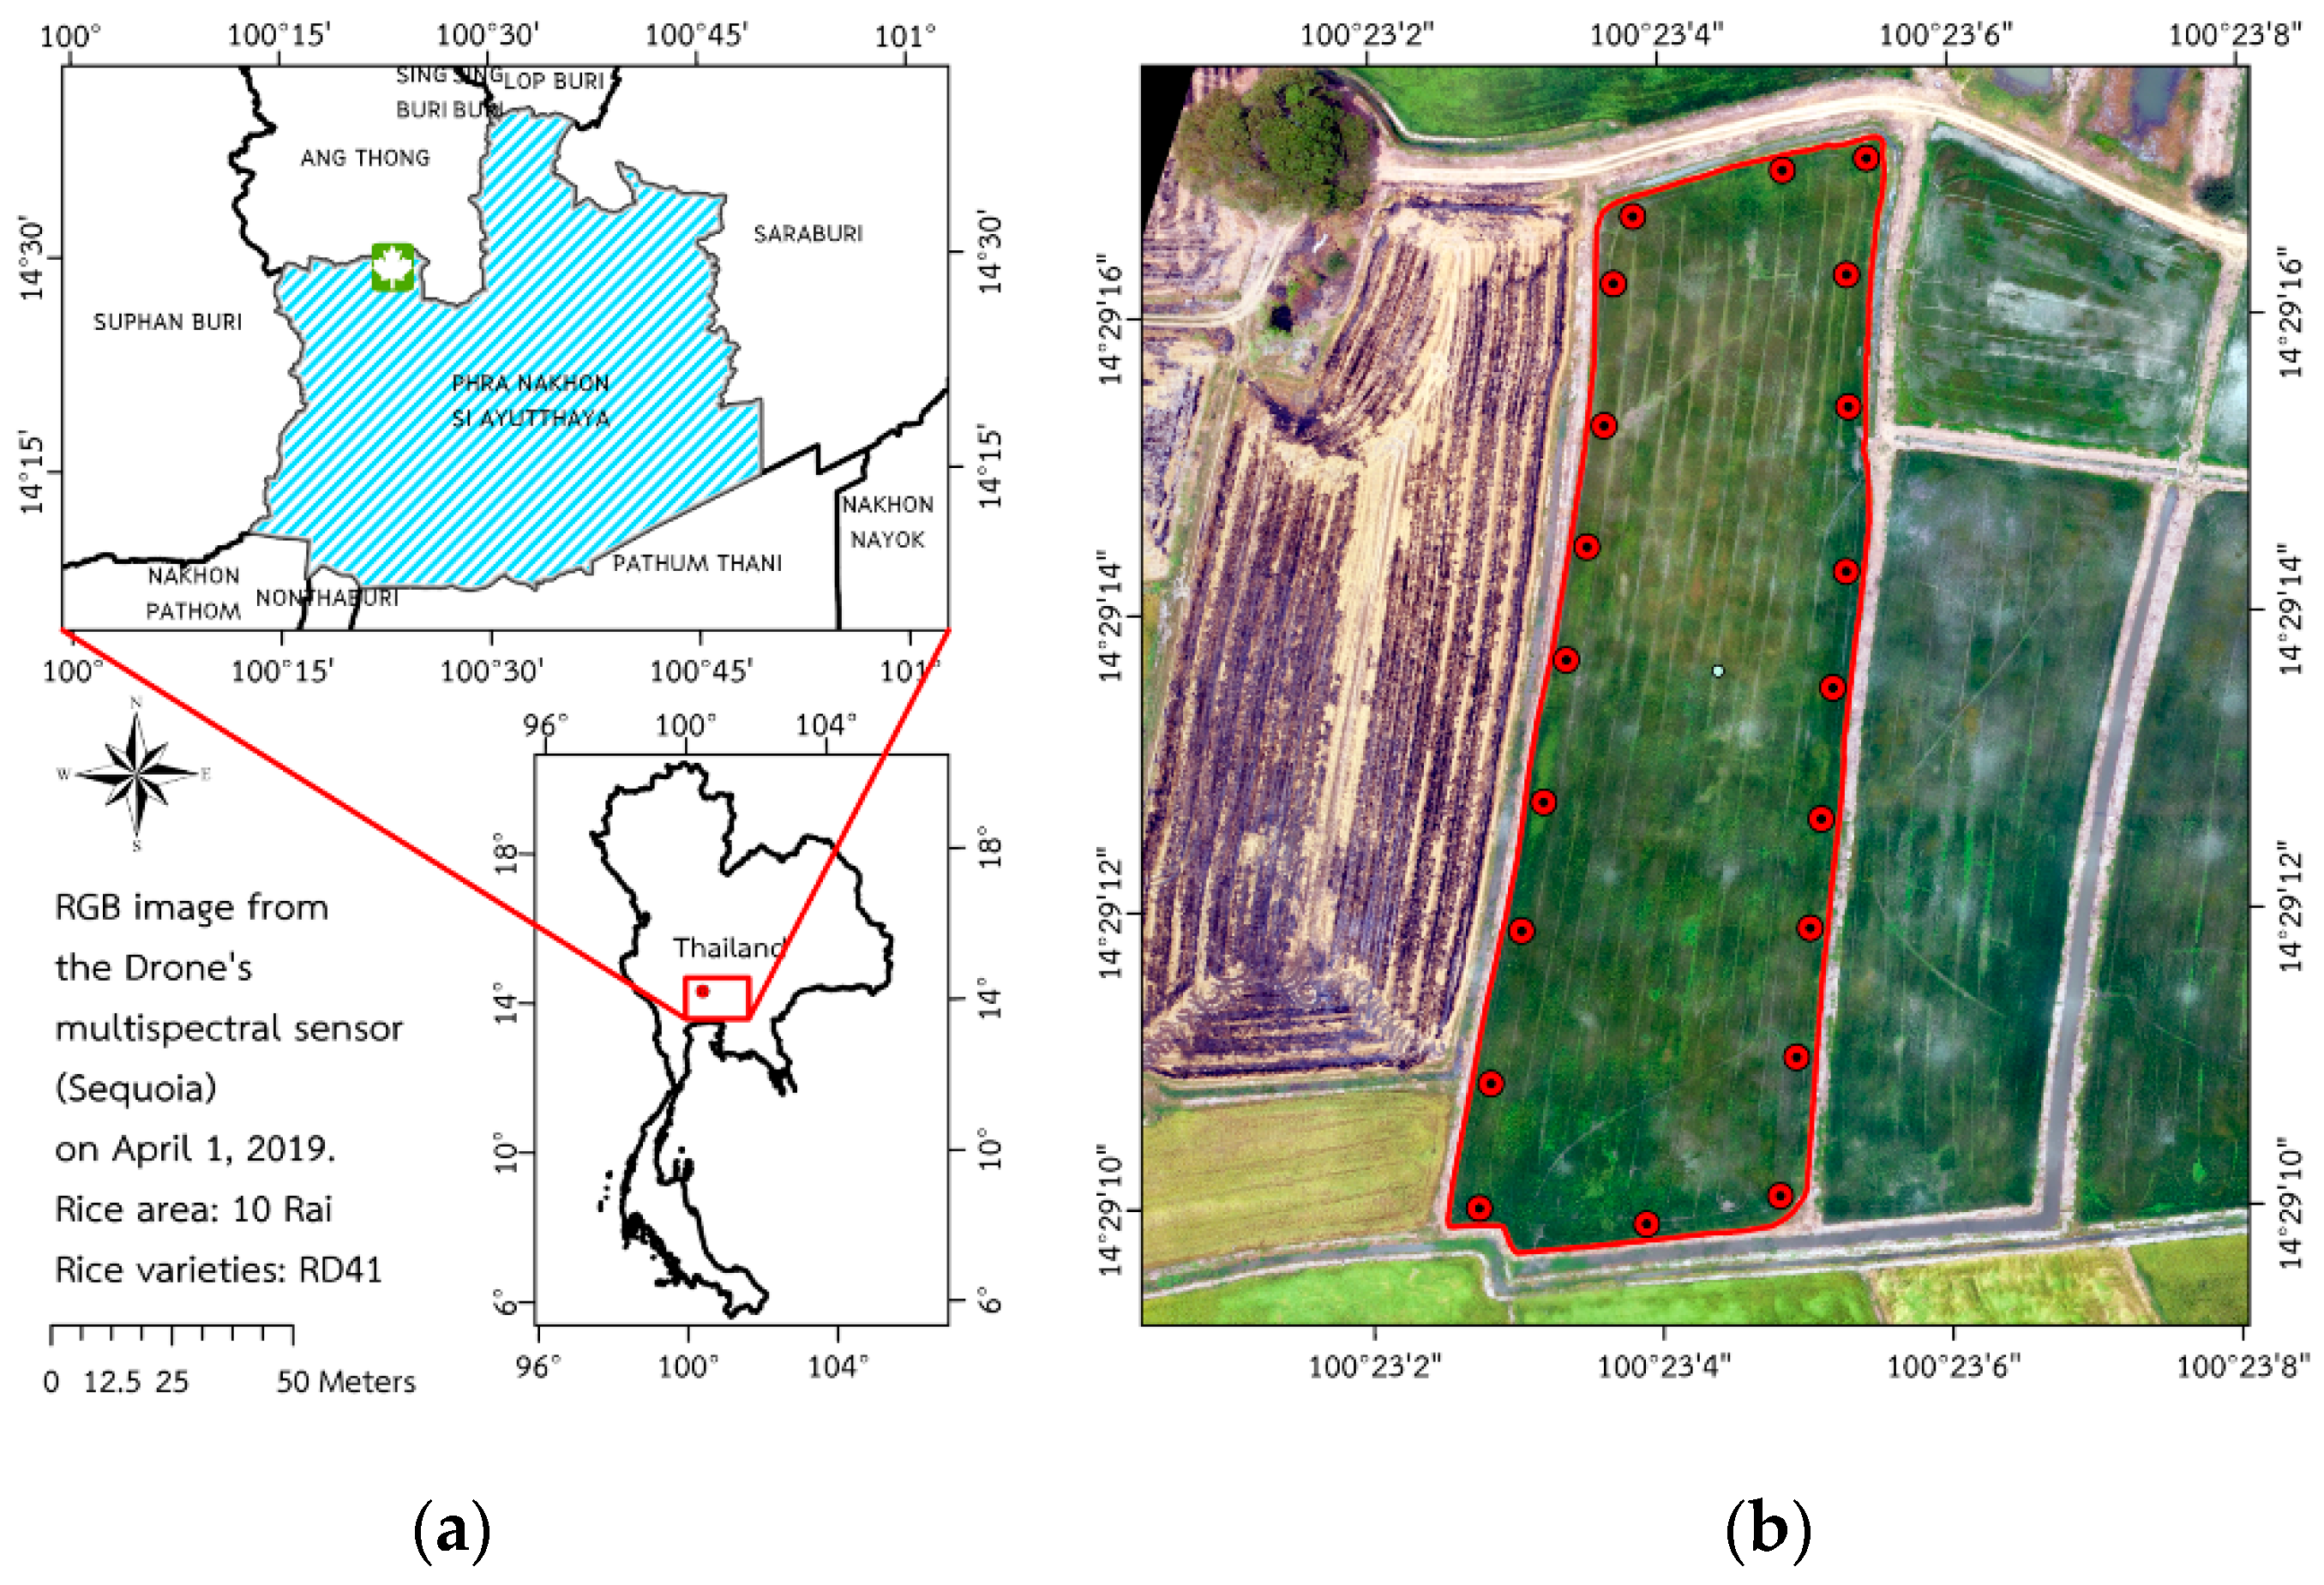
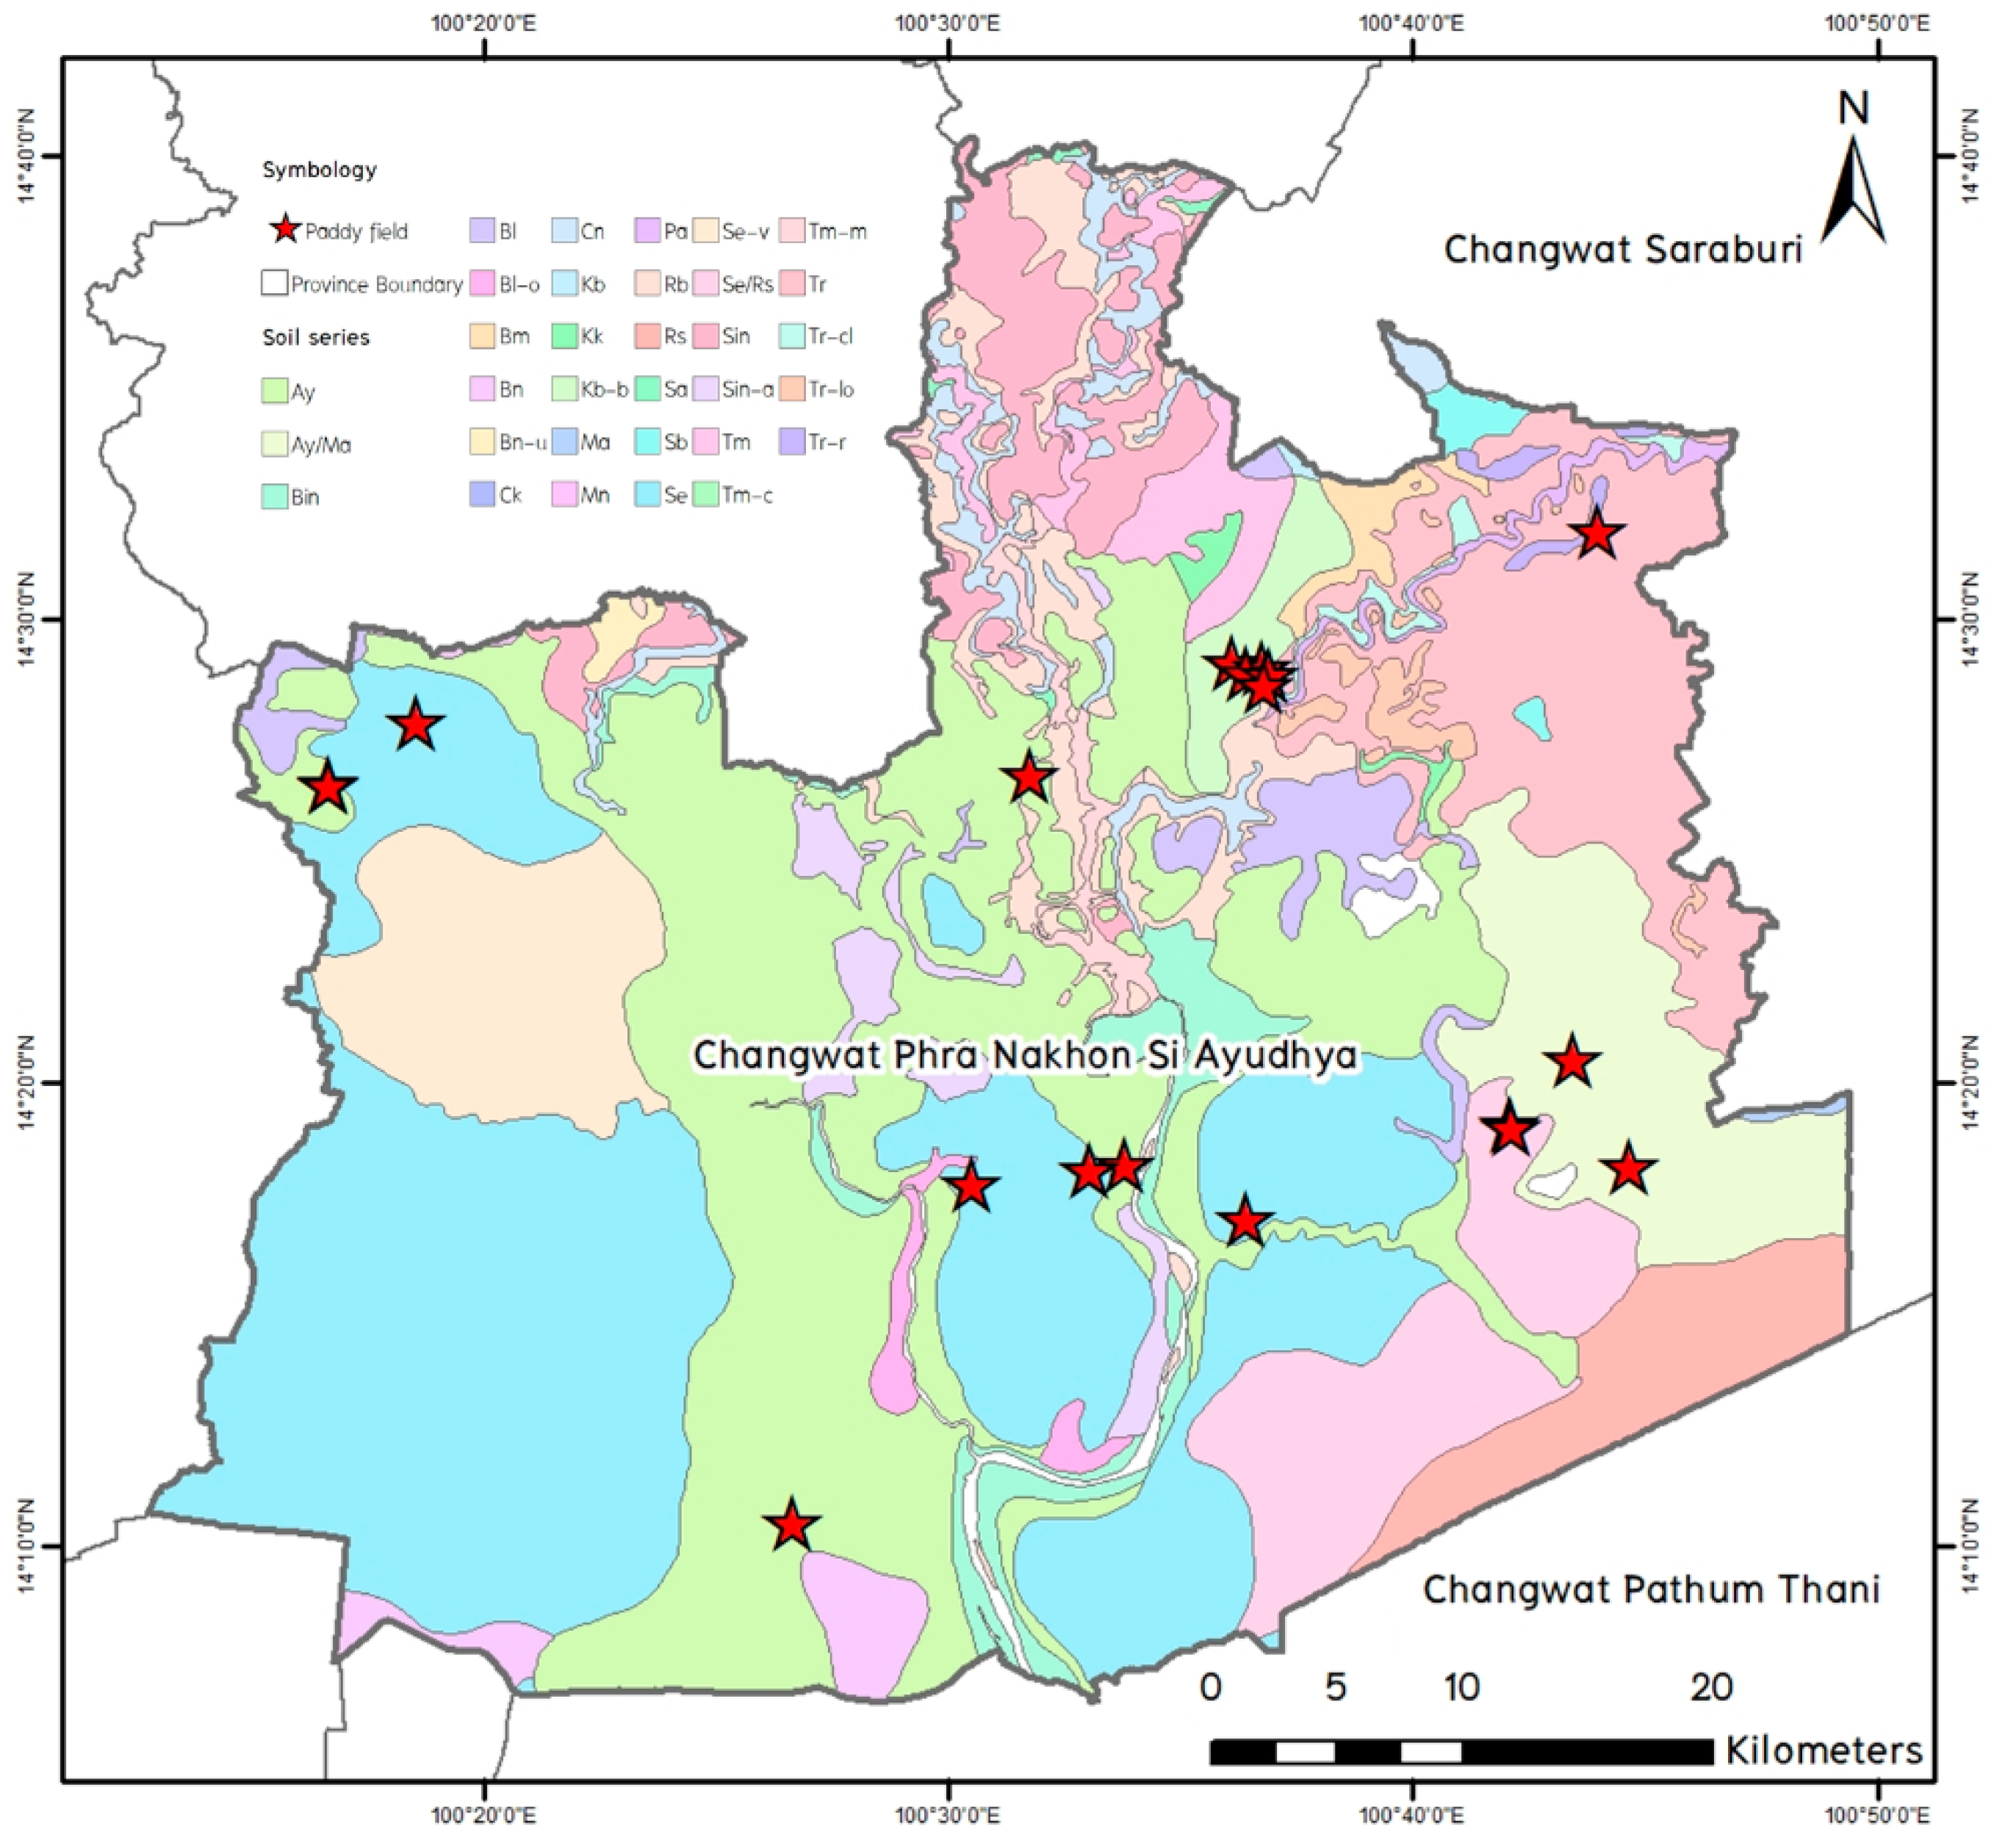
2.1. Study Area and Field Survey

The experimental site was a 1.6-hectare paddy field in Phakhai district, Phra Nakhon Si Ayutthaya province, central Thailand (14°29′13.596″ N, 100°23′4.416″ E), as illustrated in Figure 1. Rice is the main crop of this province, with more than half of the area used for irrigated paddy fields. Most farmers cultivate two crops a year, during the rainy season (May–October; rainfed) and the dry season (November–April; irrigated), with 99% sowing practice [26]. Rice variety was RD41 (105-day crop cycle) cultivated during 5 February–4 May 2019. A weather station was installed at the site since January 2019, to start collecting data for the dry season crop from February to May 2019. The collected dataset includes precipitation (mm), maximum and minimum temperature (°C), relative humidity (%), and wind speed (ms-1). Data from weather station were automatically sent to data server at Chulabhorn Satellite Receiving Station (CSRS), Kasetsart University, Bangkok. These weather data are utilized only for research purpose, as they will eventually be substituted by the equivalent satellite products.
Twenty sample plots of 1 × 1 m2 were assigned on the periphery to measure the EC (electrical conductivity), CC (canopy cover), yields, and mark the locations for comparison with the remote sensing data products. Data collection equipment were GPS Garmin Colorado 3000, DJI Phantom 3 advanced with Parrot Sequoia multispectral camera installed, EC-meter, EasyPCC (Available at https://www.quantitative-plant.org/software/easypcc) software, and other typical tools for crop cutting and grain moisture analysis. Field data collections were performed three times, at 20, 63, and 85 days after sowing, corresponding to the three distinct stages of rice cultivation: transplanting, flowering, and harvest, as shown in Table 1. The CC values were derived from the field images taken with a mobile phone and processed with EasyPCC software. A crop cutting technique was used to obtain the actual yield data at the harvest stage. The EC values is an initial condition in AquaCrop to describe soil salinity which affects the crop growth limit.
Yield data were collected at harvest time on all 20 plots. Grain and straw were separated and dried under sunlight until the moisture contents were reduced to 15%. These specimens were taken to a lab to be machine dried at 70 °C until the weights were stable (0% moisture content). The average weights at 0% moisture content for grain was 2.77 ton·ha−1.
Remote-sensing data from drone are extremely important to this study. As we aim to develop a methodology for calibrating simulated CC from AquaCrop based on Sentinel-2 data, drone data can fill the gap between point-based ground truth data and lower-spatial-resolution (≥10 m) pixel-based data from Sentinel-2. This work employed DJI Phantom 3 equipped with sensors whose characteristics resemble those installed aboard Sentinel-2 satellites. Thus, variabilities from different spatial and temporal resolutions of both field and satellite data can be studied and rational.

2.2. Satellite-Derived Products

Satellite data are an essential factor to enable AquaCrop simulation beyond farm-level. There are two points to be addressed; data availability and performance. Although, satellite data can cover large areas, its availability on a given area and at a given time cannot be guaranteed because of low quality images or other reasons. Therefore, we need to group satellite data into one temporal dataset and evaluate its performance on representing climatic parameters required by AquaCrop. In this section we develop relationships between the TERRA MODIS-LST and FY-2 IR rainfall satellite products with AquaCrop’s climatic parameters, including max/min temperature and rainfall. Three temporal resolutions including daily, dekadal, and monthly datasets were investigated. Dekadal and monthly data are the averages (for temperature) and accumulations (for rainfall) of 10 and 30 consecutive daily data. The satellite datasets were calibrated using linear regressions with co-located data from 129 weather stations nationwide, administered by the Thai Meteorological Department (TMD). Another parameter, ET0, is subsequently calculated from LST-derived temperatures. All climatic parameters derived from satellite products are resampled at 1-km resolution with 10-day (dekadal) temporal resolution (discussed shortly) and can be used by AquaCrop simulation nationwide. The relationship between Sentinel-2 NDVI product versus field measurements (CC and drone NDVI), taken from an experimental site were also investigated. All datasets used in this study are shown in Table 2.

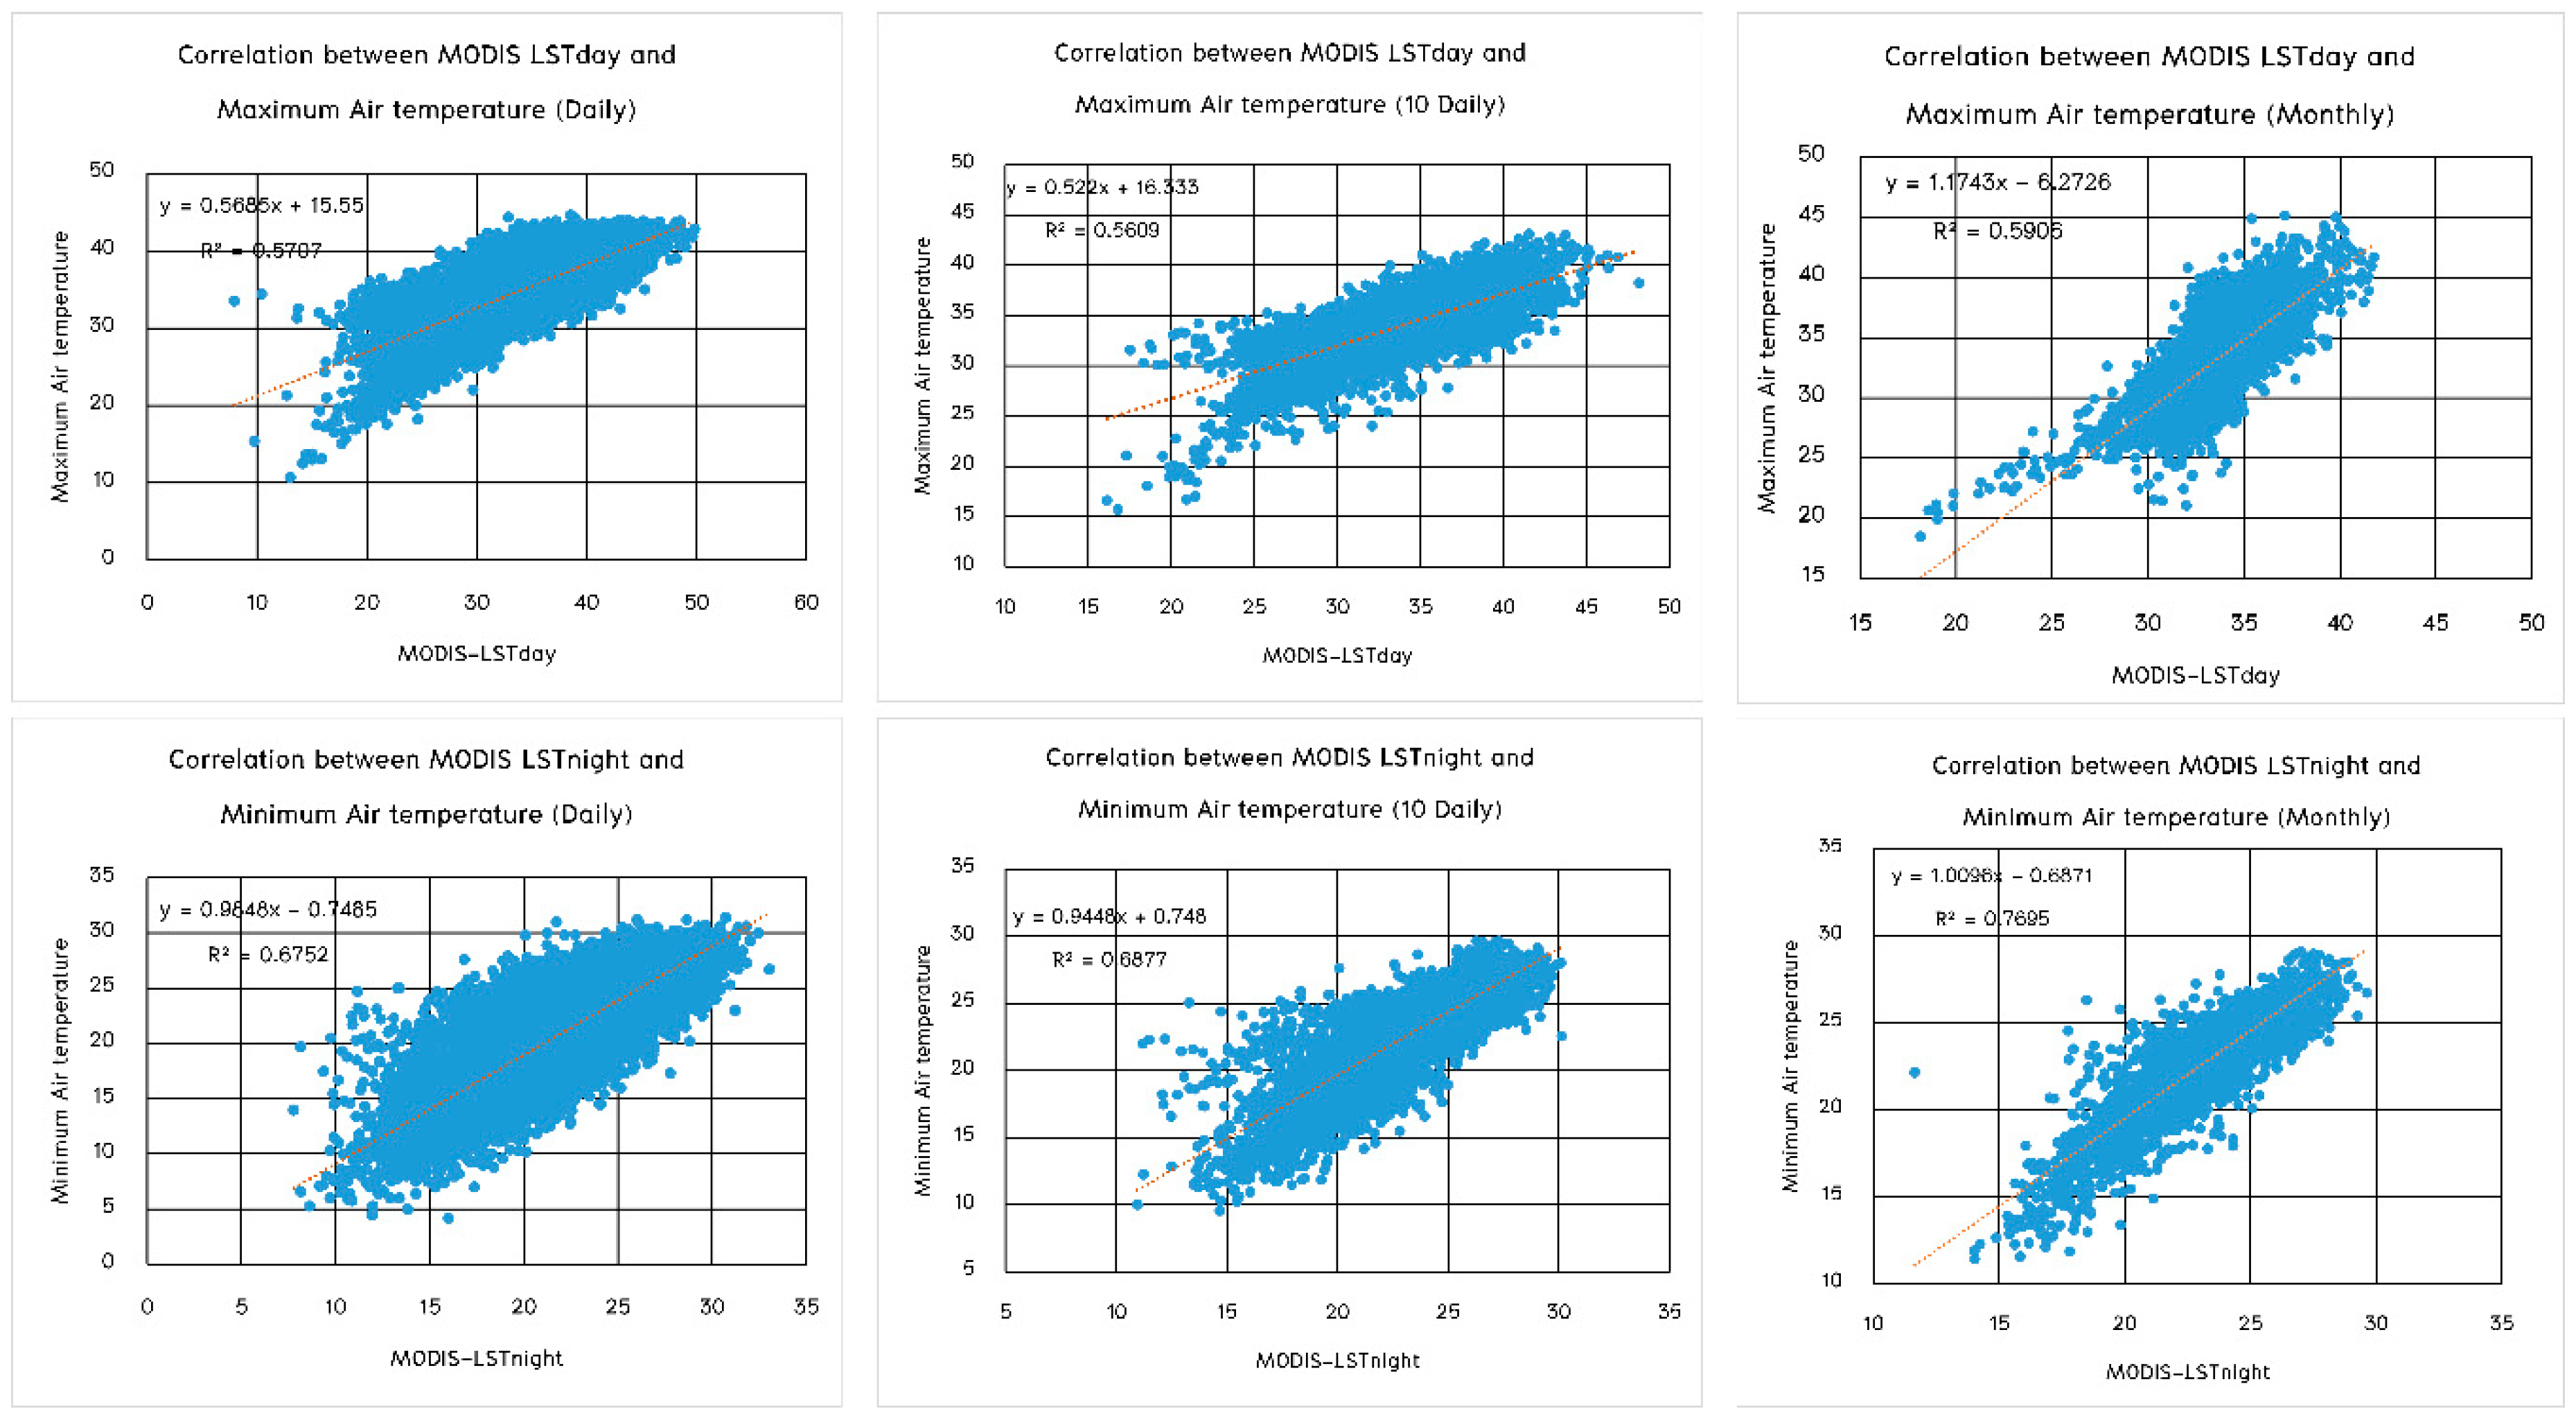
2.2.1. TERRA MODIS-LST to Derive Air Temperatures

MODIS-LST (called MOD11A1) is a daily product consisting of LST day and LST night data, representing the maximum and minimum temperatures of the day, at 1-km resolution. Figure 2 depicts linear regression performances between LST product and TMD air temperatures on three temporal resolutions. Although MODIS-LST monthly data yields the best performance with R2 values at 0.59 and 0.77 for max and min temperatures, but their temporal resolution is too coarse for AquaCrop to accurately simulate the crop response (note that AquaCrop will automatically average climatic parameters to daily values), thus, the models for MODIS-LST dekadal data are selected instead.
Then, ET0 can be calculated as follow [27,28]
ET 0 , Hargreaves = 0.0023 R a ( T c + 17.8 ) TD
where
Ra = extraterrestrial radiation (mm/day)
TC = average daily temperature (°C)
TD = temperature difference (Tmax Tmin) for the calculated time interval.

2.2.2. FY-2 IR Rainfall to Derive Accumulated Rainfall

FY-2 IR rainfall product [29], based on the IR-1 cloud top temperature, is available hourly at 5-km resolution. Table 3 shows linear regression performances which the dekadal model for FY-2 IR rainfall product was selected based on its correlation performance at 0.30.

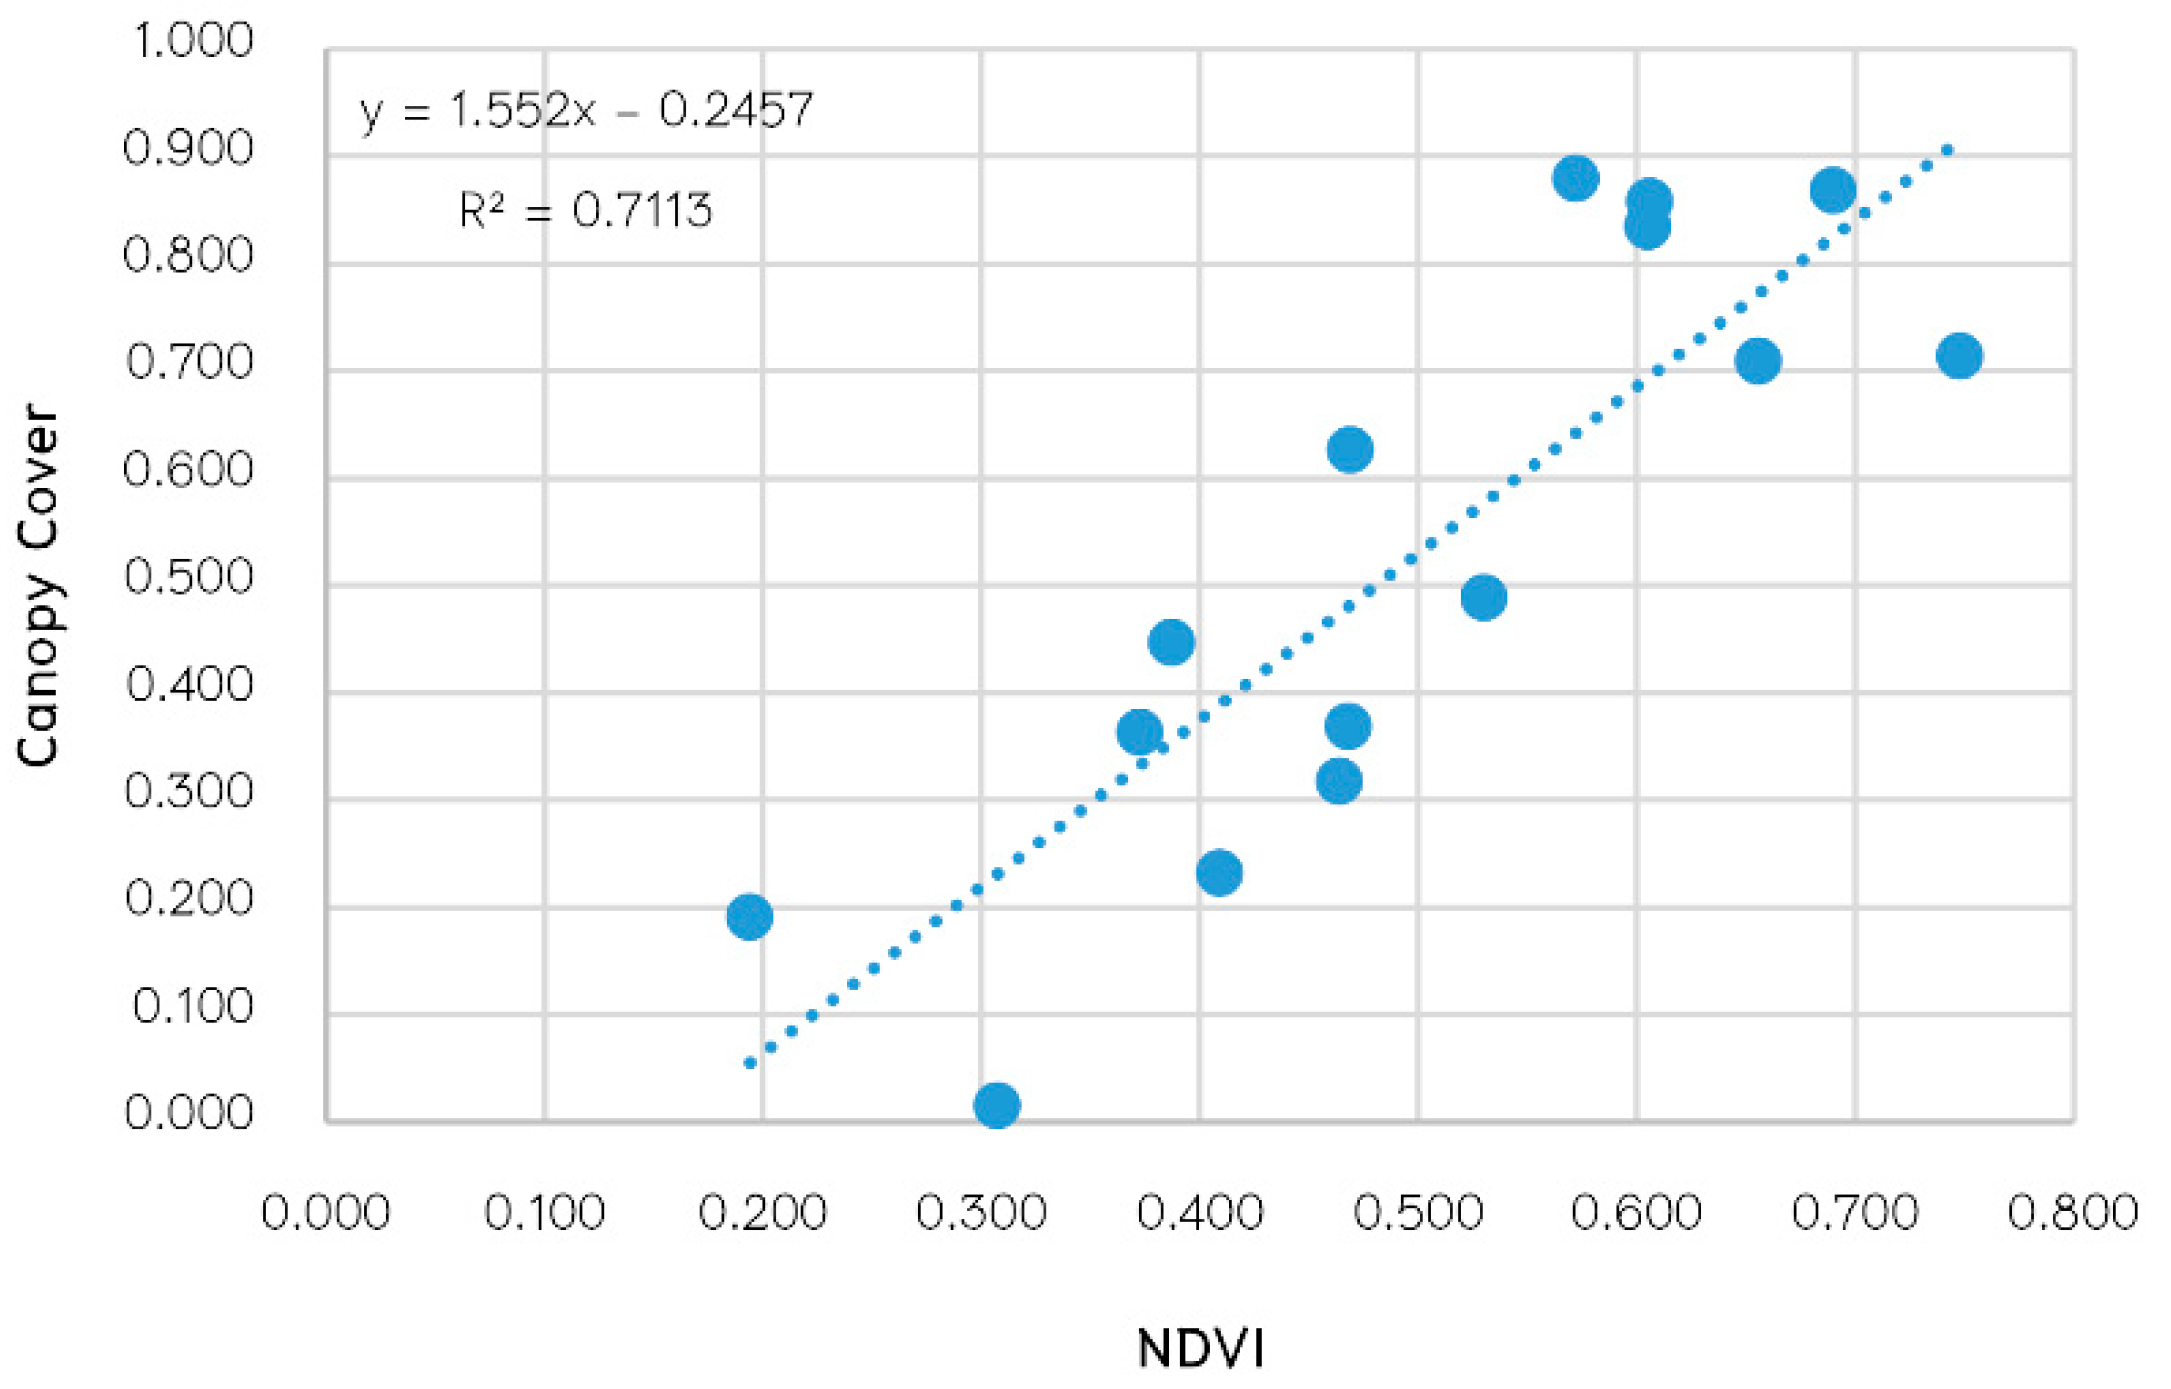
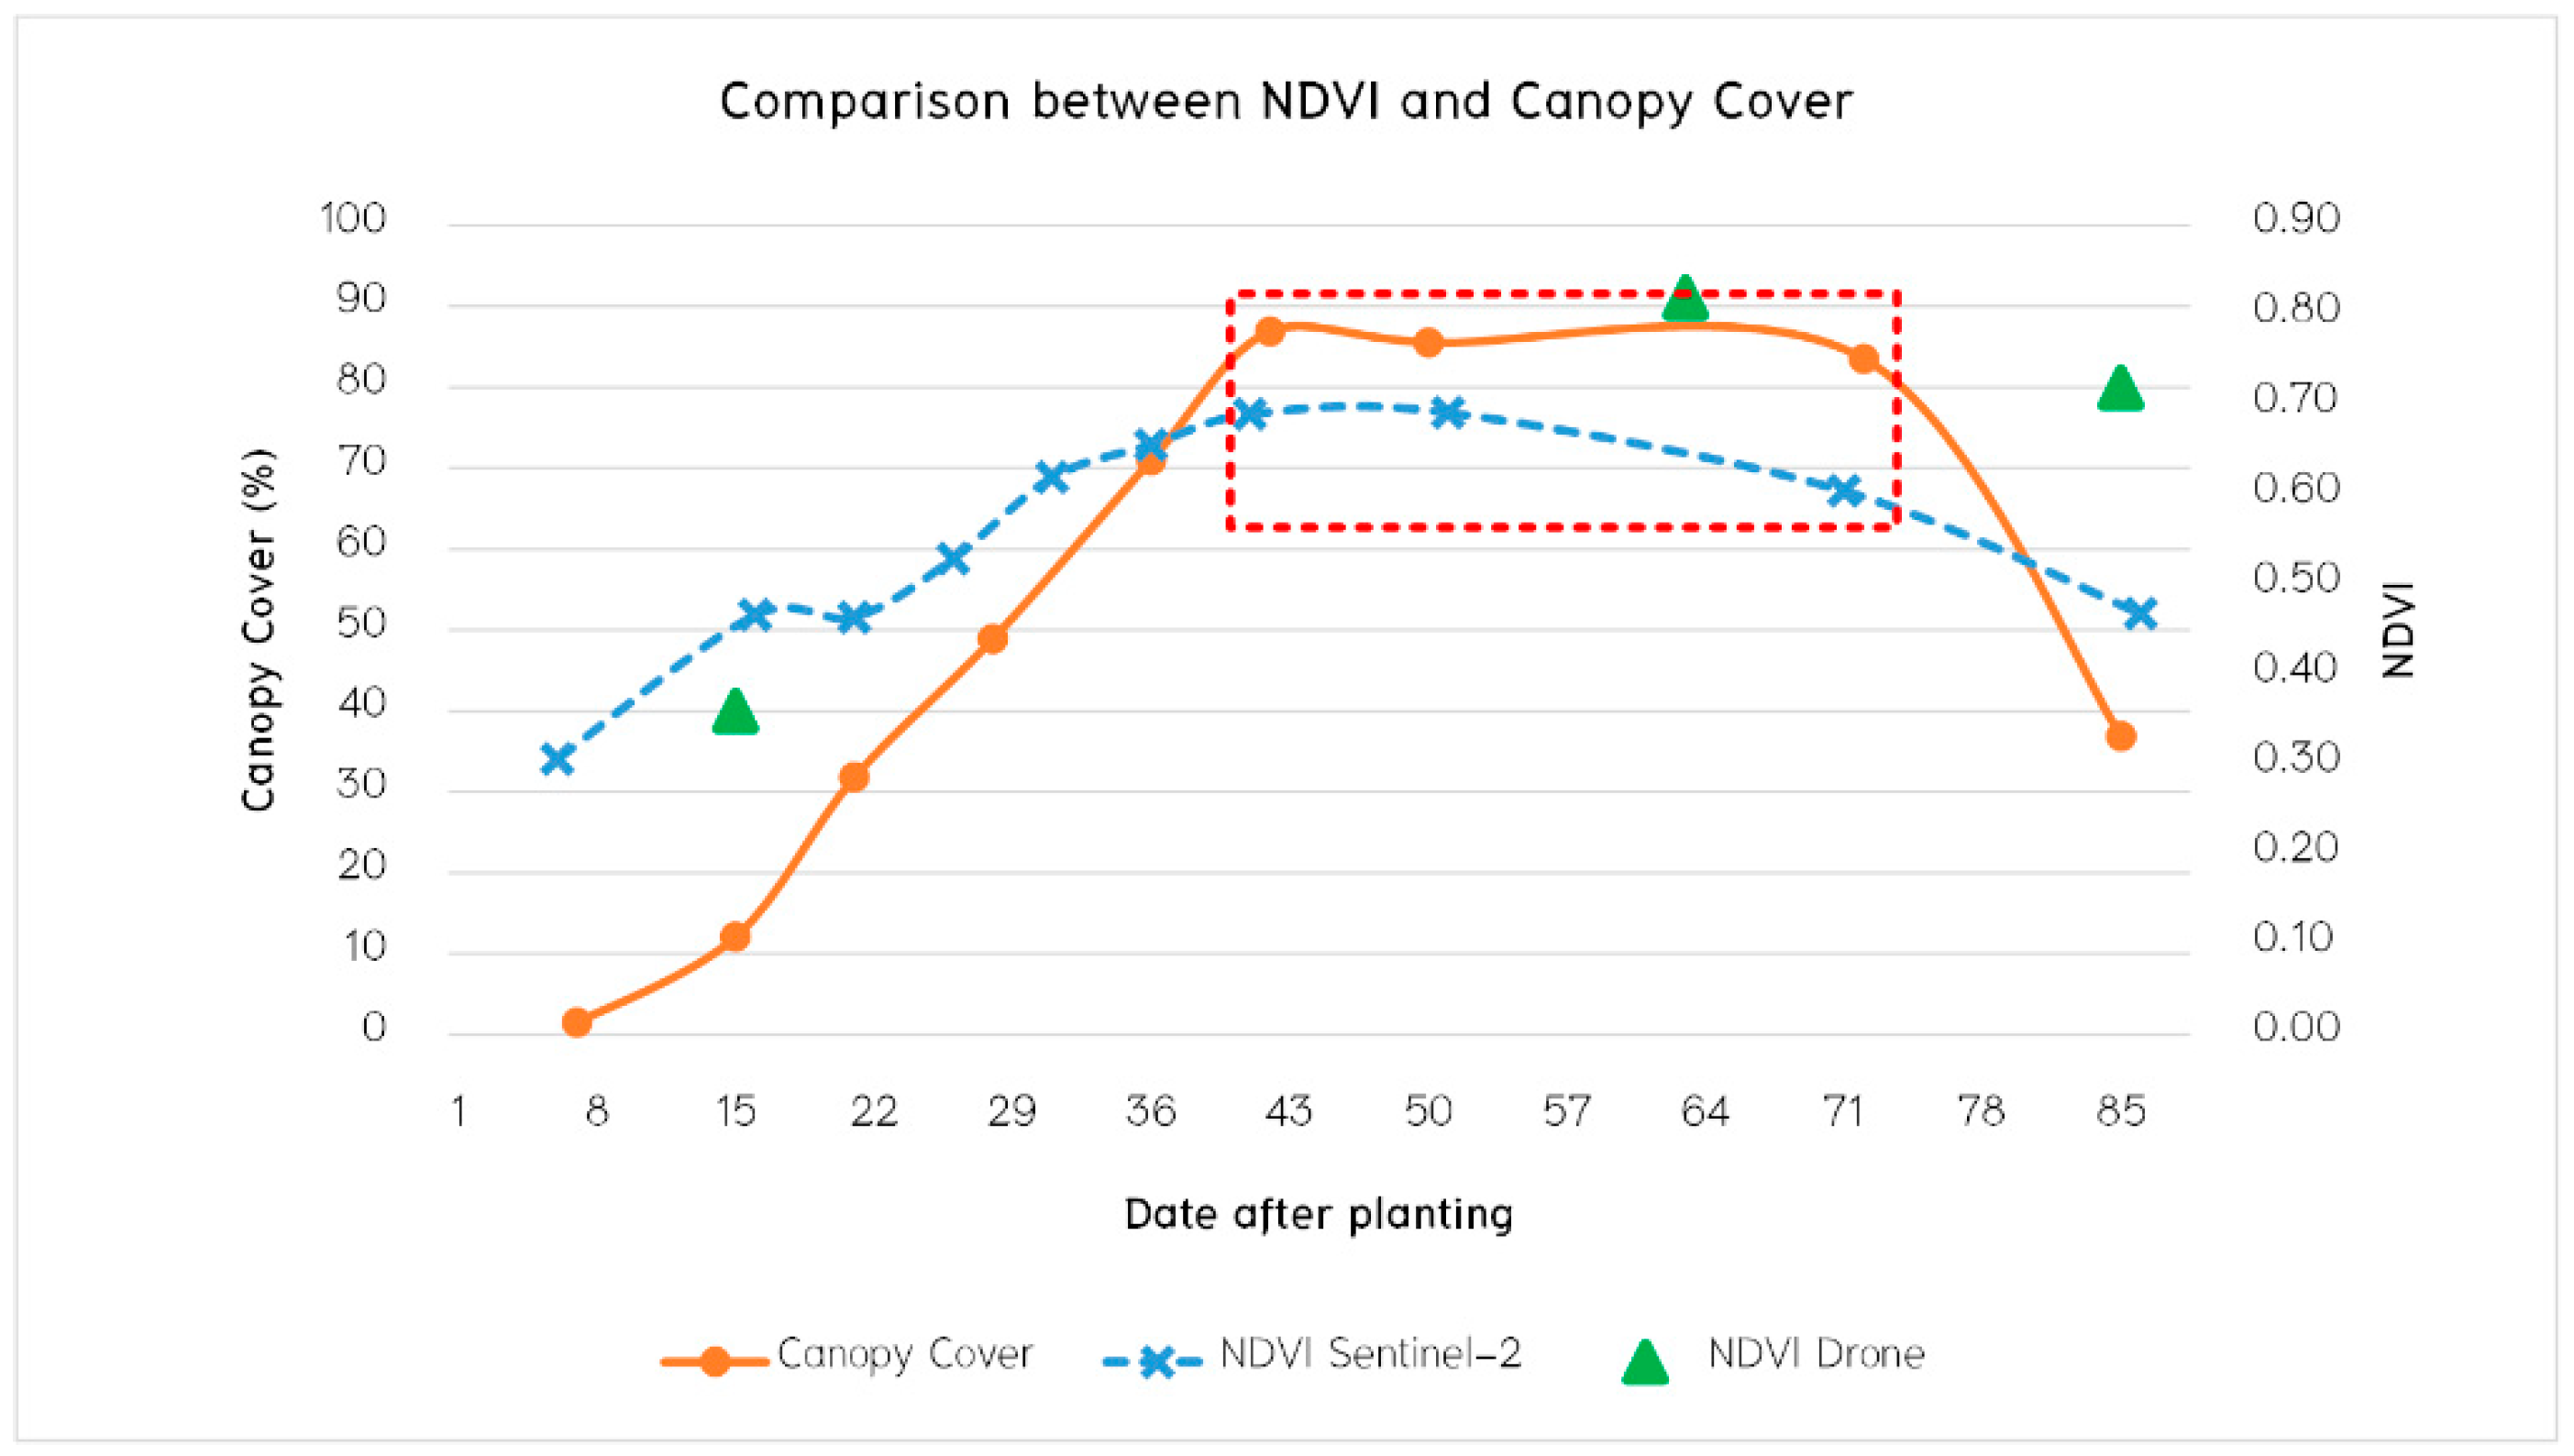
2.2.3. Sentinel-2 NDVI Product for CC Recalibration

The Normalized Difference Vegetation Index (NDVI) is a product derived from Multi-Spectral Instrument (MSI) on the Sentinel-2 satellite at 10-m resolution. The revisit time is normally 5 days. Sentinel-2 data are processed with a Sen2Cor tool and NDVI processor in the Sentinel Application Platform (SNAP) to generate a cloud-free NDVI product. This recurring process is used to create time-series NDVI data points called NDVI profile for the entire crop cycle. This profile suggests appropriate timings to recalibrate the simulated CC values at full canopy stage.
The linear relationship between NDVI and CC can be observed in Figure 3, where NDVI values from a drone were plotted against CC product from the field (processed by EasyPCC software). Figure 4 collectively illustrates NDVI values from a drone (at 20, 63, and 85 days after sowing) and Sentinel-2 NDVI (5 days on average) versus CC product (processed from images taken weekly by farmer). The most important dates are crop stage transitions of CC to and from its maxima (full canopy cover stage and senescence date), which are 43 and 71 days, to be used for recalibration process. During such intervals, both NDVI product from Sentinel-2 and CC product resemble to each other.

2.3. AquaCrop Processing

2.3.1. Input Parameters

The AquaCrop model consists of four input parameters: climatic data, crop characteristics, field management, and soil characteristics. Climatic parameters, commonly obtained from the weather stations in situ, are replaced by satellite products for the platform to provide regional service operation. Farm-level AquaCrop simulations are performed to monitor rice crops and predict rice yields with the climate dataset throughout crop cycle. Therefore, seasonal weather forecast, approximately four month in advance, is required for rice yield prediction from sowing stage.
In this regard, this work develops a default set of initial condition parameters for AquaCrop, called Alpha-I, which have been acquired from relevant state agencies (such as the Rice Department, the Department of Groundwater Resources, the Land Development Department, etc.), academic and research works, and our experimental results, to be applicable nationwide. It also incorporates a 5-year average historical satellite-derived climatic parameters during 2013–2017 for each field and crop duration as the initial climate inputs, which will be subsequently updated by recent satellite products once available. It is worth noting that these averages may seem non-realistic at first but we would like to capture the typical weather scenarios on predicting typical yields. The fact is rainy season in Thailand does not shift much each year, this approach can effectively predict the typical dekadal rainfall which is sufficient to simulate and predict the typical yields. All the extreme events such as droughts and floods are averaged. In fact, such events cannot be reasonably simulated by AquaCrop anyway.
The use of satellite-derived climatic parameters, i.e., max/min air temperatures, ET0, and rainfall is examined by comparison with the simulated yields using weather station data collected from the experimental site. The sentinel-2 NDVI profile is used to monitor canopy cover development, so that the initial conditions for crop response and soil fertility can be readjusted to increase the accuracy of rice crop monitoring and yield prediction. Satellite products used to recalibrate the model are shown in Table 4. Details of the recalibration algorithm are outlined in Section 2.3.3.

2.3.2. AquaCrop Simulaltion Scheme

The scheme of the AquaCrop model simulates the final yield from the biomass, the core of the AquaCrop process, which can be described by
B = WP · T r
where WP is the water productivity parameter and Tr is the crop transpiration (mm). The water productivity parameter is calculated from the CO2 concentration while the crop transpiration is calculated from CC. Hence the final yield is linked to the green canopy cover and its development.

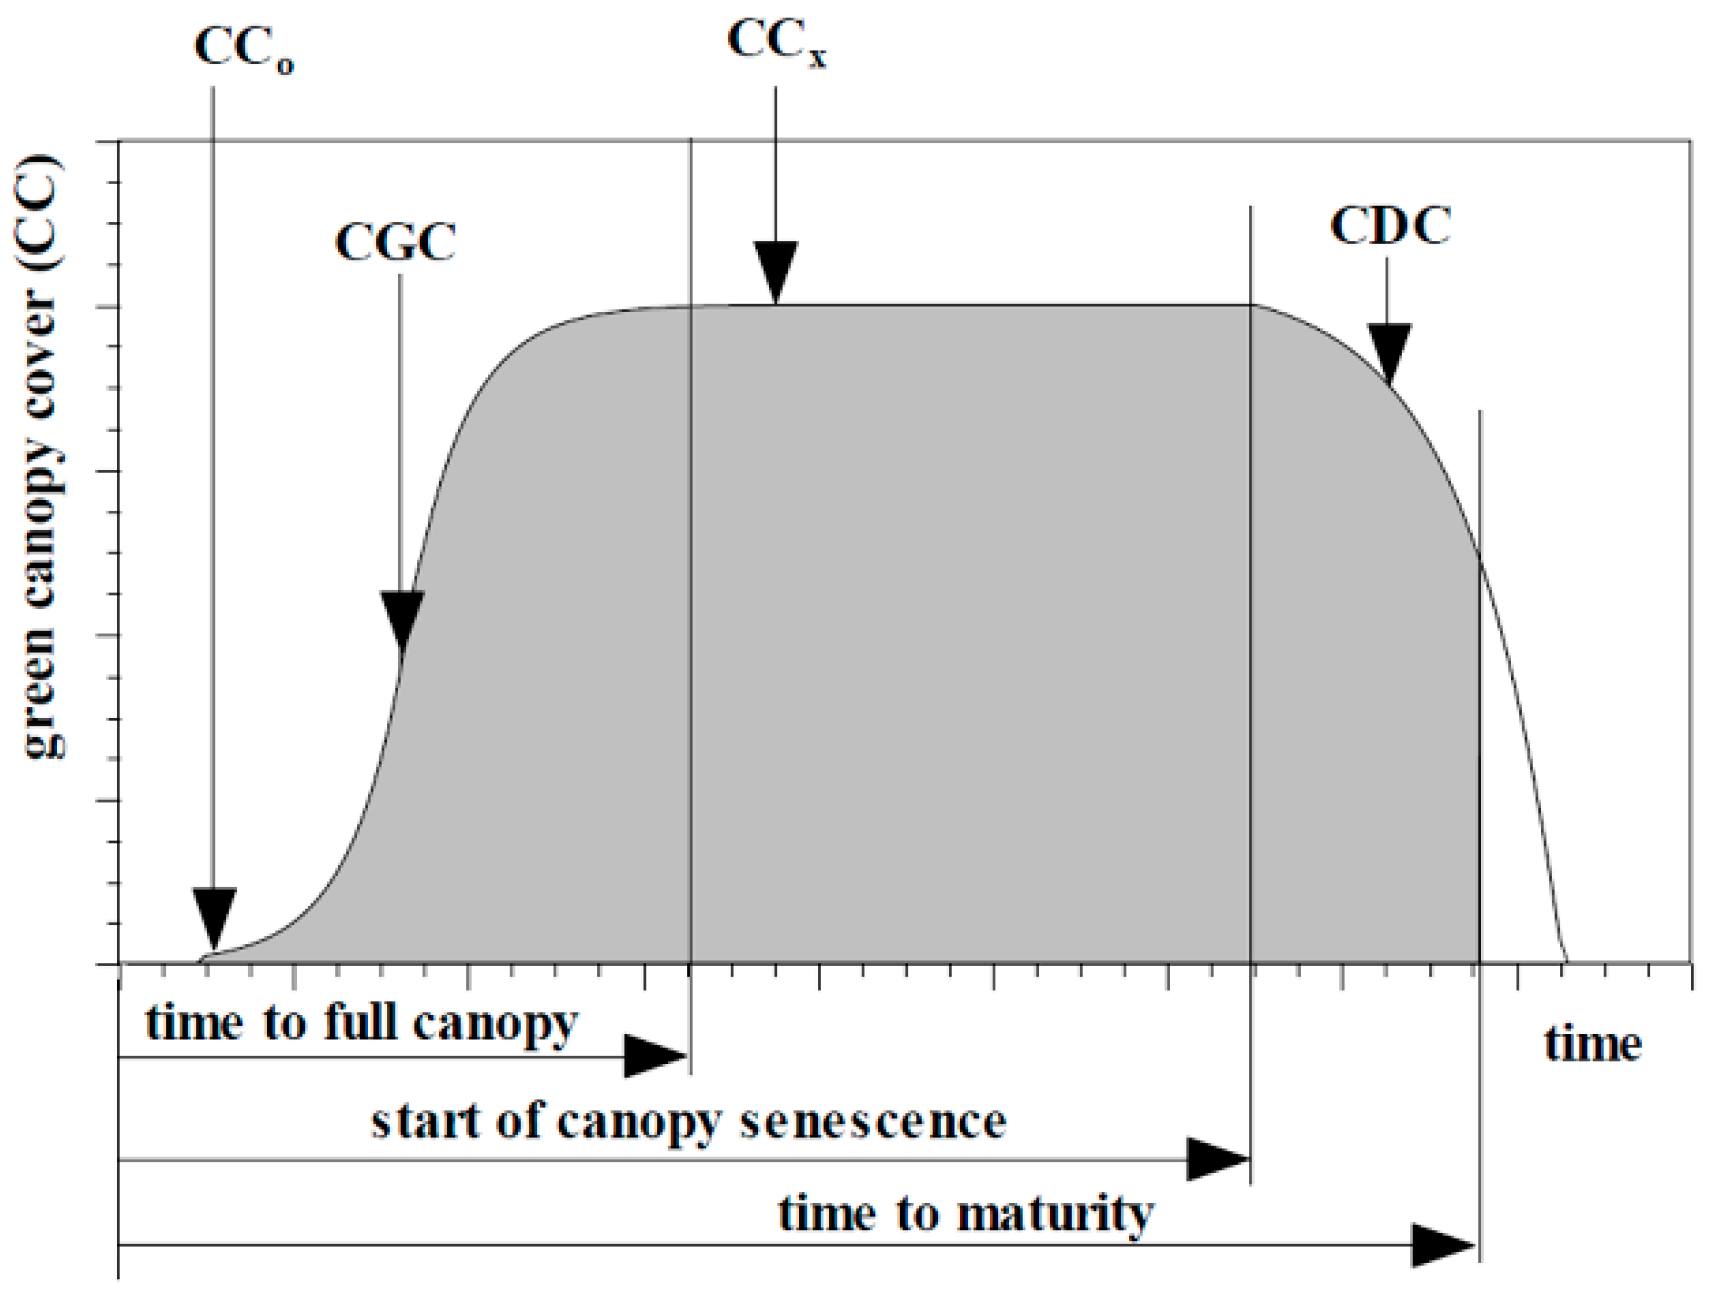
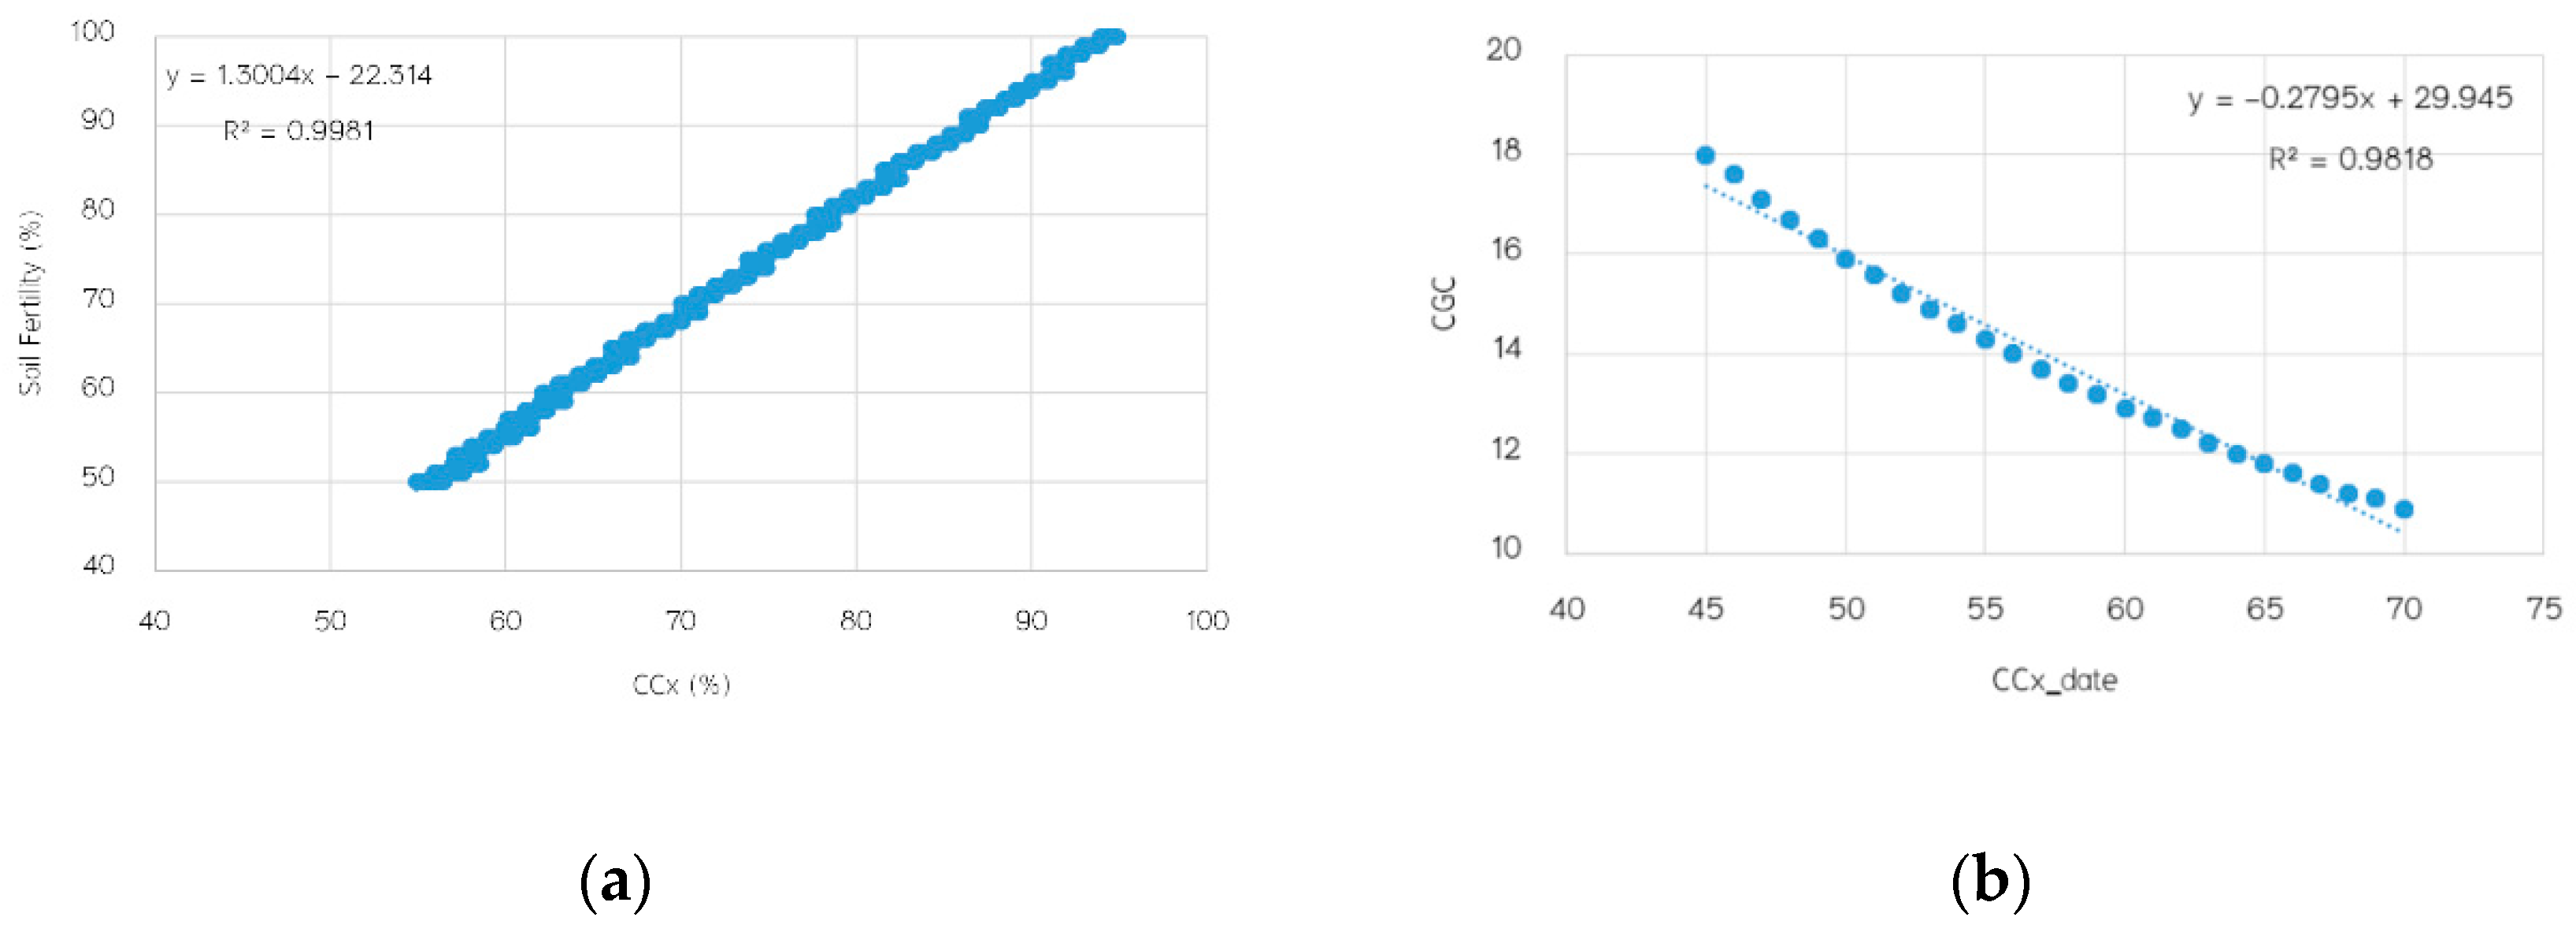
2.3.3. Canopy Cover Recalibration Methodology

The green canopy development and senescence under the optimal solution is described by four parameters (Figure 5). CC0 is the initial canopy cover at the time of 90% crop emergence, calculated from the product of plant density and the size of the canopy cover per seedling. CGC is the canopy growth coefficient, which determines the increase in fraction grown cover per day. CCx is the maximum canopy cover for a plant under optimal conditions. CDC is the canopy decline coefficient, which is the percentage ground cover decline per day [30]. Days after sowing until start of canopy senescence is called senescence date and harvesting date is the time that the crop reaches maturity. To improve yield prediction accuracy, it is required to calibrate this canopy cover curve to be close to that observed from the field.
Previous works [24,25] show how to use NDVI products from Sentinel-2 and HJ-1A/B satellites to completely create a relationship with multiple data collections from the field to readjust the maximum canopy cover (CCX) parameter in AquaCrop. These approaches cannot scale well as such relationships change with crop/soil characteristics and field management. Our work assumes that crop and field information is available from farmers via mobile app while other relevant parameters can be found in the Alpha-I default dataset. Therefore, AquaCrop has sufficient input information to start simulation and needs calibration only at full canopy stage using only Sentinel-2 NDVI product. Section 2.3.3 shows that Sentinel−2 NDVI profile can represent canopy cover of the field providing the maximum canopy cover (CCX) and time to reach that value (CCX date).
The canopy cover can be recalibrated by readjusting the soil fertility initial condition. The soil fertility stress decreases the maximum canopy cover (CCx) that can be reached at mid-season as well as canopy growth coefficient (CGC). The adjustment of CCx for soil fertility stress is given by [30]
CC x , adj = Ks CCx CC x
where KsCCx is the stress coefficient which depends on various factors and is difficult to determine. In this study, we find the relationship between soil fertility and CCx for rice crop through AquaCrop simulations on the experimental site by changing soil fertility from 50–100% as other parameters remained unchanged and noted the CCx values. The result is depicted in Figure 6a and the readjustment of soil fertility for CCx is given by
Soil   Fertility = 1.3004 ( CC x ) 22.314
The canopy growth coefficient (CGC) is another initial condition used to recalibrate the canopy development. The canopy development is simulated with exponential growth by Equation (5) when CC is less than or equal to 0.5CCx, and with exponential decay by Equation (6) when CC is more than 0.5CCx [30]
CC = CC 0 e CGC · t
CC = CC x 0.25 ( cc x ) 2 cc 0 e CGC · t
where t is the days after sowing. Using Equation (6), with CC0 calculated by AquaCrop and CCx recalibrated by soil fertility, we can readjust CGC by setting t as the CCx date. The relationship between the CCX date and CGC is depicted in Figure 6b. We note here that recalibration at full canopy can benefit not only improving accuracy of the predicted yield but also giving around two months time for adaptation to worst-case scenarios, if happens, such that losses can be optimized. This recalibration meets the main objective of this work.
However, we can optionally perform additional recalibration step for “rice yield estimation” at harvest. This is to replace conventional “crop cutting” method used in Thailand which has been neither effective nor efficient. In this case, the canopy decline coefficient (CDC) is readjusted at harvest using senescence (tsenescence) and maturity (tmaturity) dates to recalibrate the canopy devlopment to the observed CC. These dates can also be extracted from the Sentinel-2 NDVI profile. With this second step recalibration, we can expect more accurate results but there is no benefit of time.
The CDC initial condition can be described as [30]
CDC = 3.044522 * ( CC x + 2.29 3.33 t )
where t is the canopy decline interval in days (tsenescence − tmaturity) and the CCX is the maxmimum canopy cover after the first calibration.
The algorithm developed for AquaCrop processing to monitor crop growth and to predict the rice yield by calibrating the canopy cover can be summarized into three stages. First, at the planting stage, the Alpha-I default dataset are input to AquaCrop model including predicted weather data. Our study uses 5-years-averaged historical satellite-derived climate parameters (except CO2) as the initial weather dataset, and are updated every 10 days for crop monitoring. Simulated yield with climatic inputs from satellite data was compared with those from a weather station for evaluation purpose. Crop parameters (type of planting method, planting density, emergence provided by farmers) are used to generate the initial canopy cover (CC0) at this stage.
Second, at the full canopy stage, the observed CCx (based on Sentinel-2 NDVI profile) is used to readjust soil fertility, and the CCx date is used to readjust CGD. This process recalibrates canopy cover development for better monitoring of crop growth and prediction of the rice yield around mid-crop cycle.
Third, at the harvest stage, the senescence date (time that CC starts to decrease) and maturity date (harvesting date), extracted from Sentinel-2 NDVI profile, are used to readjust the CDC to recalibrate the canopy response for the entire crop cycle. The final simulated yield can be confirmed and be used for government officers to estimate rice production on a farm- or regional-scale.

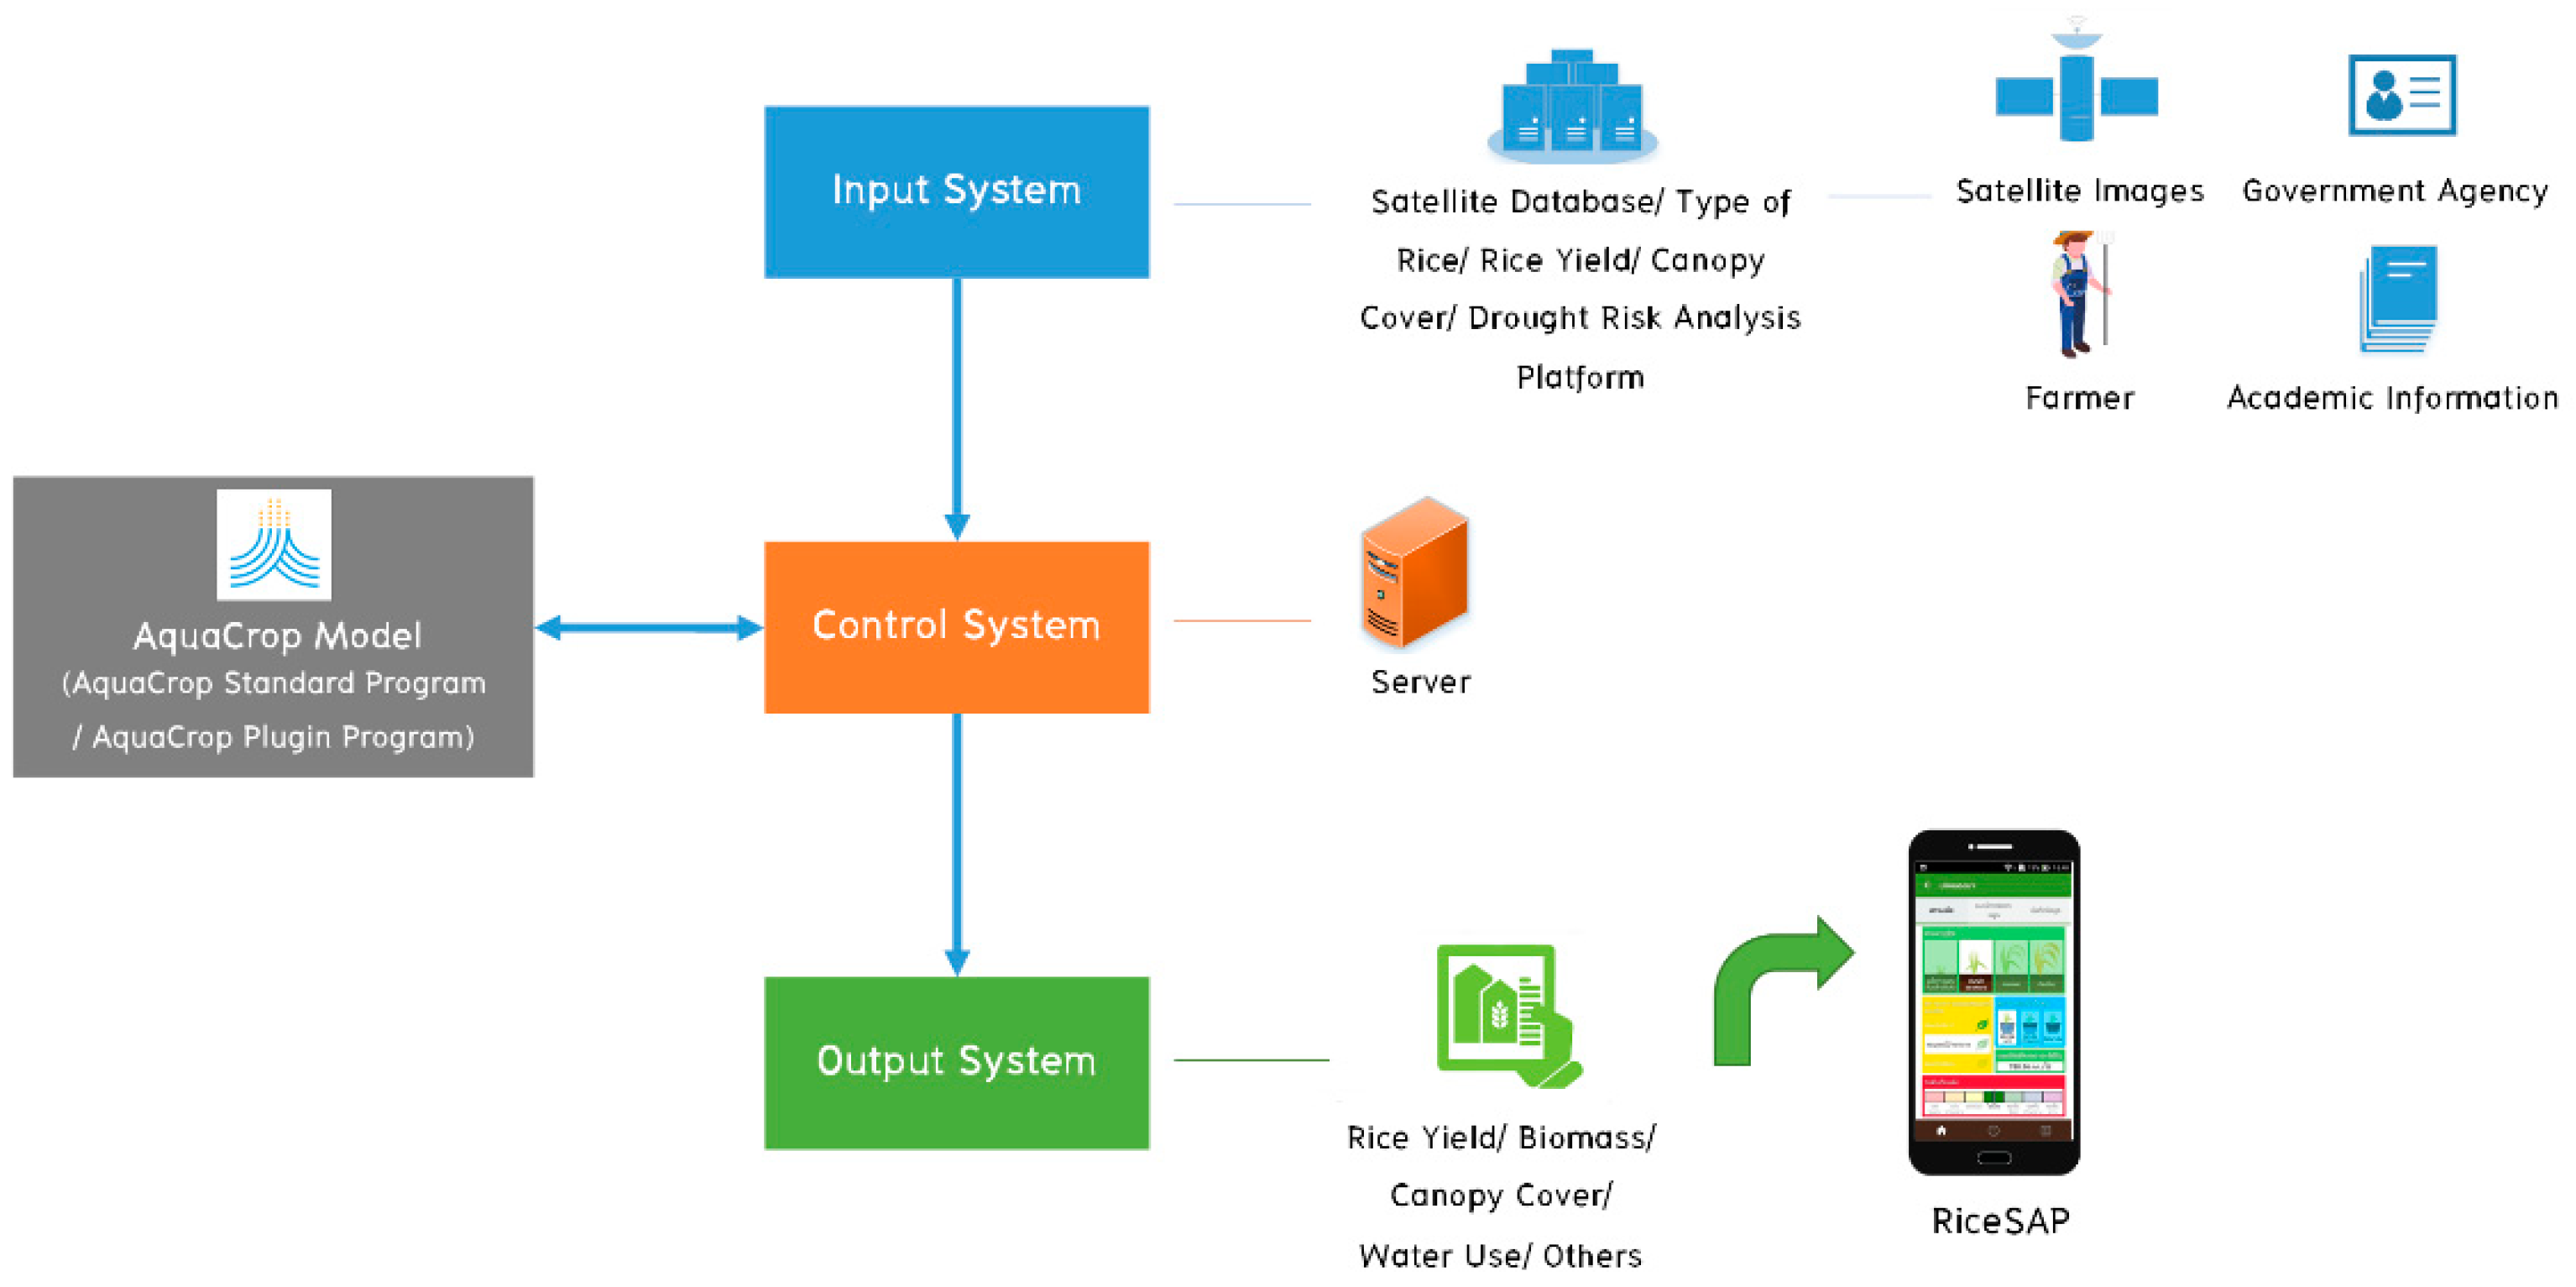
2.4. Rice Smart Agriculture Platform (RiceSAP)

RiceSAP (SAP pronounced “Sæb”, which means “delicious” in northeastern Thai dialect) is a platform designed to demonstrate a very low-cost solution for farmers to shift from conventional farming practices to climate-smart agriculture paradigm. RiceSAP provides relevant information for crop monitoring and crop yield prediction. Farmers can thus make informed decisions to optimize their profit. Based on the AquaCrop model and the streamlined algorithm developed in this work to utilize available satellite products on a cloud computing platform, RiceSAP can not only offer services to individual farmers but also to massive groups of farmers at a regional scale, with no need for equipment installation. The developed mobile app (similarly called RiceSAP) provides farmers a user-friendly interface and easy-to-navigate user experience to input crop and field parameters and to assimilate the information. In addition, to be beneficial to government agencies, the platform offers similar services to government officers via a web app at regional-scale (farmers can only access information pertaining to their farms via the mobile app).
The RiceSAP platform is a comprehensive collection of functional blocks, namely input, control, and output systems, as illustrated in Figure 7. The input system automatically gathers all relevant data, for example, GIS data products (land use, land cover, irrigation, weather, drought risk, statistical data, administration data, etc.) from government agencies, inputs from farmers via mobile app, and remote-sensing satellite data (from Sentinel-2, FY-2, and Terra/MODIS). These data are processed, geo-tagged, and entered into a database server to be ready for use. The control system is activated by user requests via mobile or web apps. It will retrieve the corresponding data and information records from the servers, and establish an instance of AquaCrop simulation. Once the simulation is finished, all outputs are recorded to the database server. The output system reads data from the database and converts them to JavaScript Object Notation (JSON) format subsequently and sends them to the web or mobile apps for display. The platform was developed with opensorce software licenses and standard data format, so that it can be scalable in terms of functions and number of users in the future (for example, pest and disease management). Performance evaluation under synthetic loads shows that the platform can support up to 2000 users simultaneously.
The RiceSAP platform can be advantageous in a broader perspective. Government agencies can monitor and utilize resources in an effective and efficient way to help farmers instead of via direct subsidies. Royal rainmaking has been a famous drought countermeasure in Thailand, RiceSAP can provide invaluable information to where and when to conduct the rainmaking with the most optimal benefit. Crop insurance can also make use of RiceSAP to predict the climate-impact on yields and to calculate appropriate premiums as well as compensation in a more scientific way. Finally, financial institutions can recommend their crop loan clients to use RiceSAP so that both parties can minimize loan default rates using an agreeable and flexible approach.

3. Results

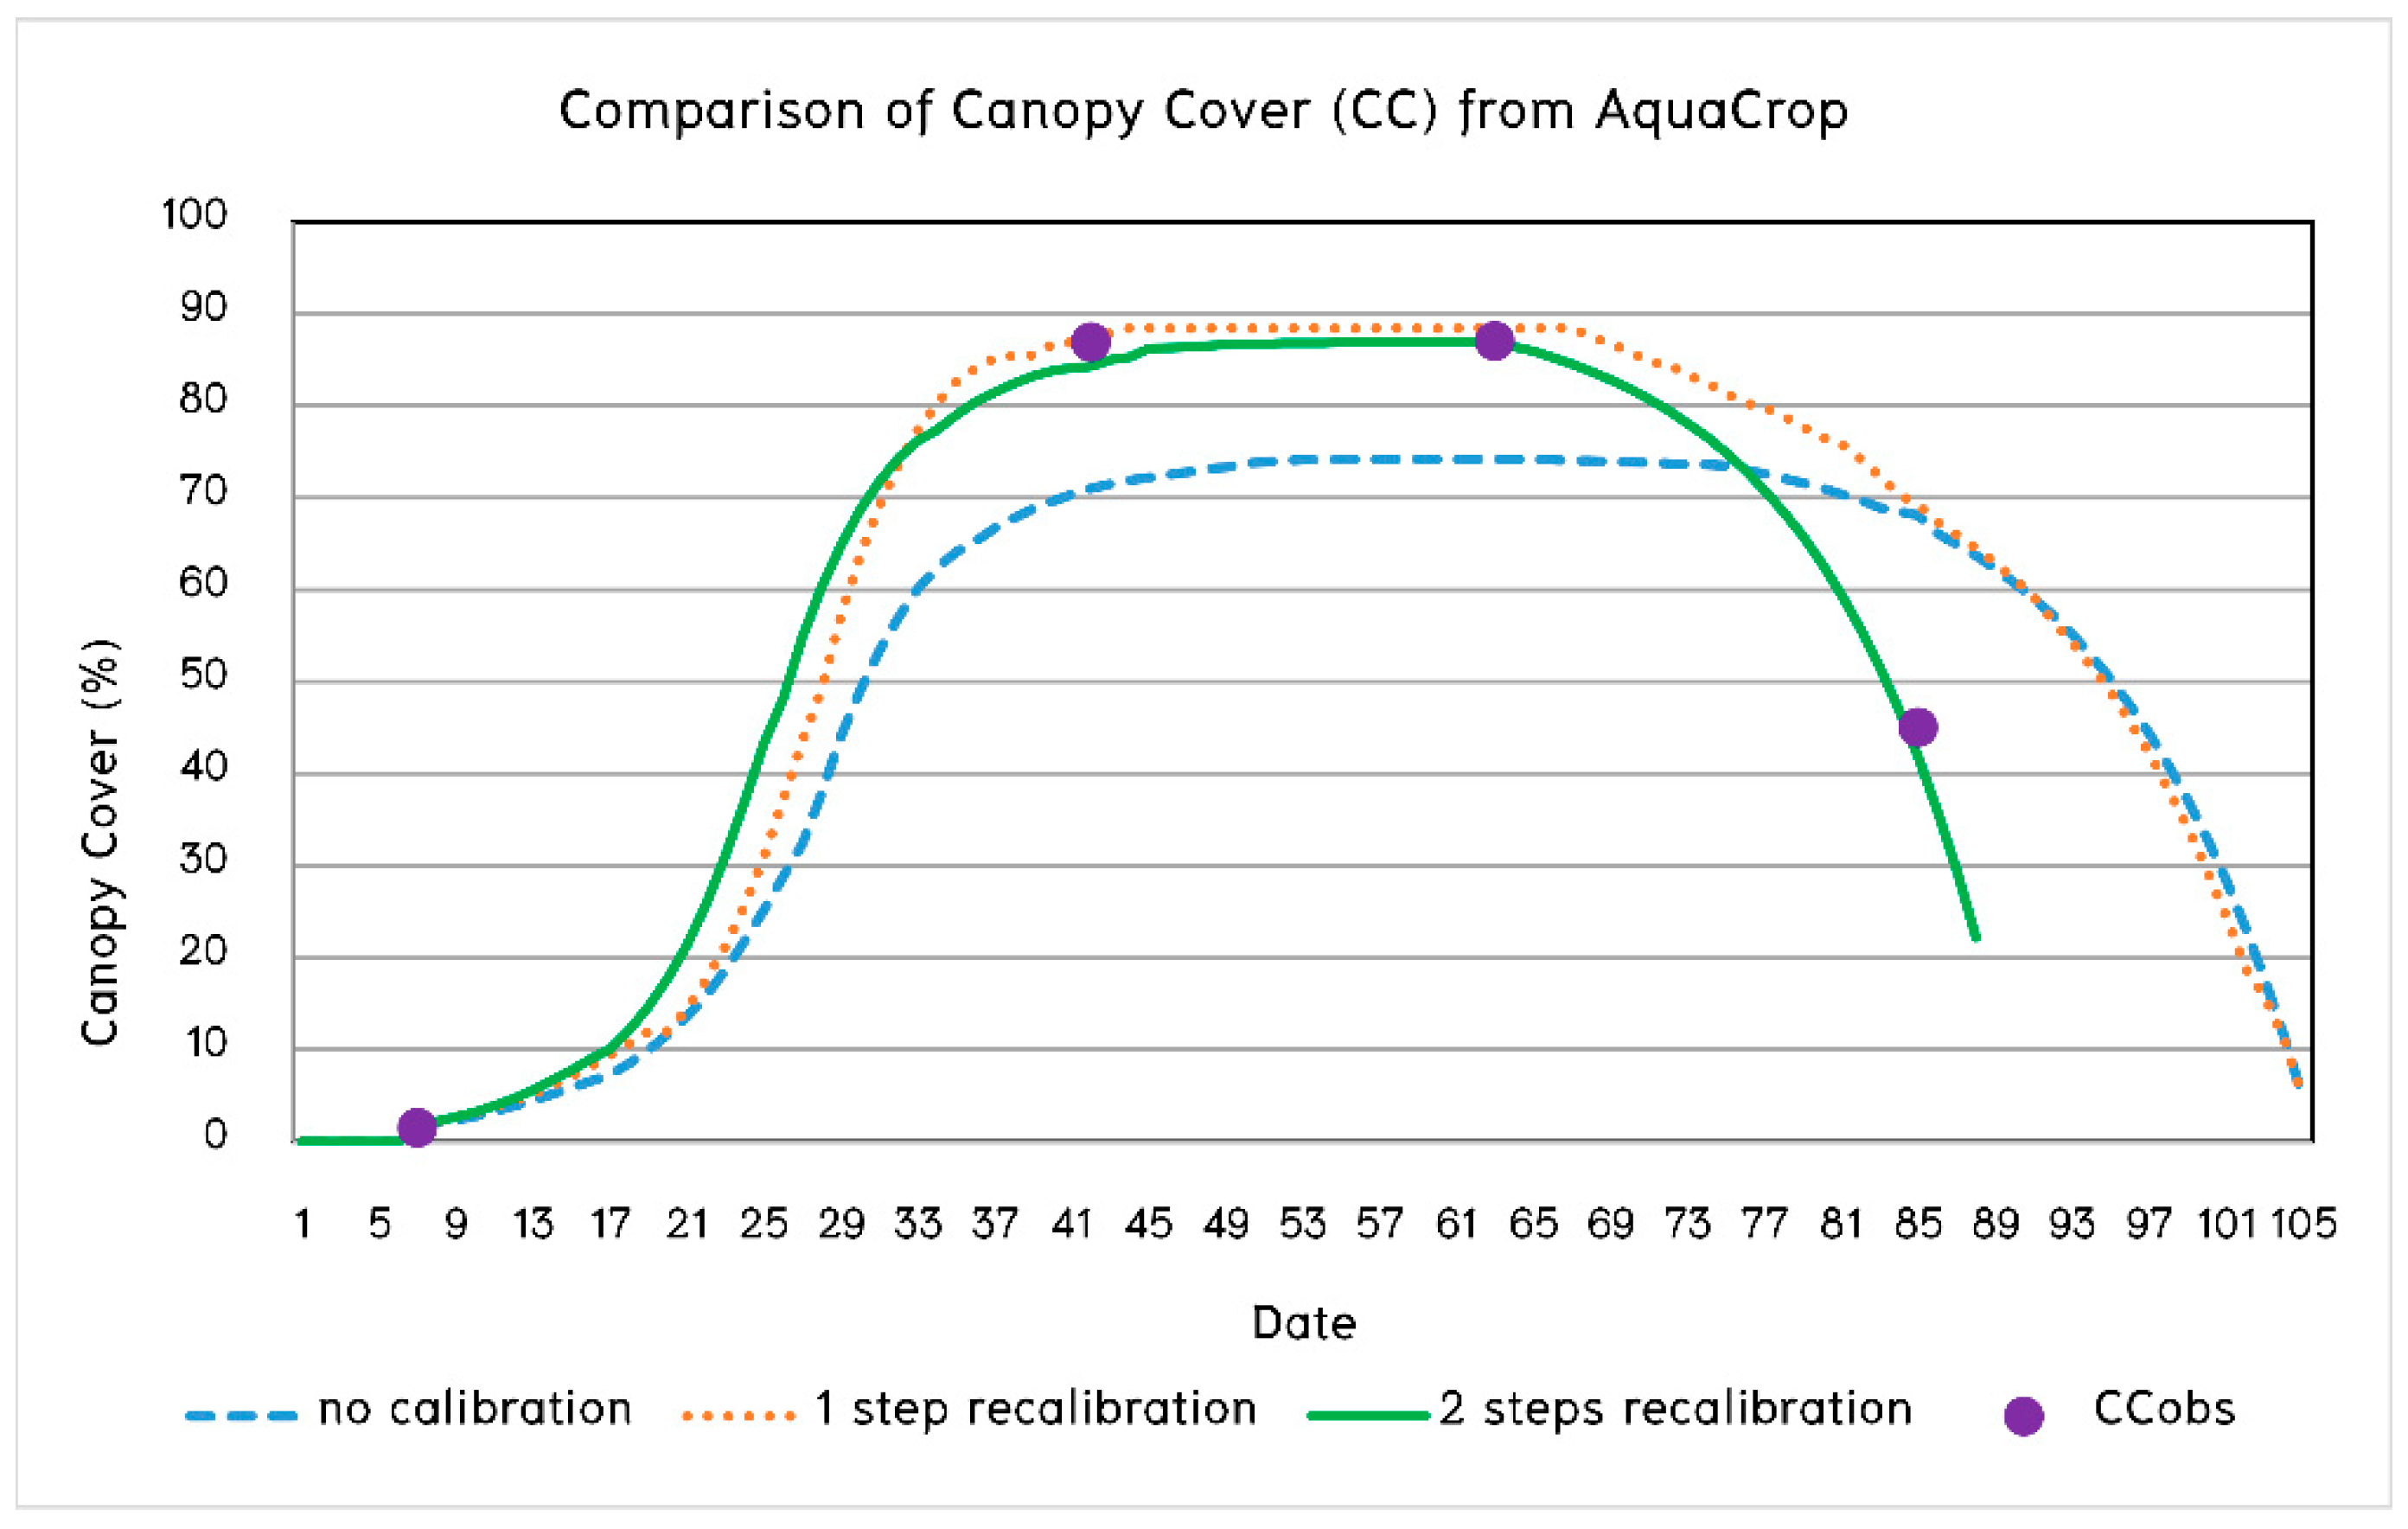
3.1. AquaCrop Processing Performance with the Proposed Algorithm

We evaluate our proposed algorithms by comparing the predicted yields from AquaCrop and the actual yield collected from the experimental site, for irrigated crop in 2019 (February–May). Three configurations of AquaCrop simulations were performed. First, the default datasets Alpha-I was applied as initial parameters and inputs. This configuration represents cases with no access to weather data, providing baseline simulation performance. It can be used to predict rice yields even before the planting date based on 5-year historical climate data from satellites. Second, if there exsits weather station data, AquaCrop will replace Alpha-I climatic inputs with daily data from weather station and update its simulated yields. This configuration represents the most accurate predicted yields among all. The last configuation, which is the proposed AquaCrop operation, updates Alpha-I climatic parameters with recent satellite-derived products every 10 days. Recalibration techniques were also applied to improve yield prediction accuracy on all simulations. Table 5 shows the result of simulated yields and corresponding prediction errors, called mean absolute percentage errors (MAPE), compared with actual yield at 2.77 ton·ha-1. Without recalibration, climatic inputs derived from a weather station and satellite products provide similar performance with MAPE at 27.81% and 27.92%, respectively. This offers a significant improvement over Alpha-I dataset with 63.89% MAPE.
AquaCrop processing can have a two-step parameter recalibration method to obtain the best fit between field observations and simulations of canopy cover (described in Section 2.3.3). The first step is at full canopy stage and the second is at the harvest stage. At full canopy, CC observed by Sentinel-2 NDVI is used to readjust soil fertility; and the time to reach this stage, observed from the NDVI profile, is used to readjust the CGC. Table 6 shows datasets for satellite-derived climatic parameters used in the simulation at each recalibration step. The Alpha-I datasets were replaced with updated weather information every 10 days up to the time of recalibration. A similar scheme was applied in the case of daily weather station data. Using only Step-1 recalibration, the results in Table 6 depicts that prediction errors for each datasets were significantly decreased, especially around two-thirds reduction in case of weather station data (27.81 to 9.28). With satellited-derived climatic parameters, the prediction error is reduced to 15.48% (about one-half of no recalibration), which is acceptable considering a weather station needs not be installed. Step-1 recalibration can offer rice yield prediction approximately two months in advance before harvest. This algorithm is very attractive in that it can provide a satisfactory yield prediction given that accurate 2-month weather forecast are not currently available.
At harvest, Step-2 recalibration can be applied to obtain a more accurate rice yield estimation. Observed by the Sentinel-2 NDVI profile, the senescence date and the maturity or harvest date were used to readjust the CDC parameter to fit the observed canopy cover profile. As shown in Table 6, the prediction error was reduced to 20.16% using Alpha I dataset which represents worst case scenario in absence of weather data. Using accurate weather station data with Step-2 recalibration, AquaCrop can achieve accurate yield estimation at 4.9% MAPE. With satellite-derived climatic parameters, AquaCrop can achieve reasonably accurate yield estimation at 12.67% MAPE. Note that, the second recalibration has less impact on the simulated yield compared with the first one at full canopy. Figure 8 also depicts that, without recalibration (dashed line), the simulated CC is lower than the CC observed (CCobs) by the Sentinel-2 NDVI. With Step-1 recalibration at full canopy (dotted line), CCx is adjusted to the observed CC. Step-2 recalibration applied at harvest stage can adjust the CC curve declining from the senescence date to the harvest date to best fit the observed CC profile.

3.2. RiceSAP Applicability and Field Variation Performance

To evalute the applicability and performance variability of our proposed algorithms and Alpha-I datasets, we conducted additonal experiments on a group of randomly selected 20 farmers whose paddy fields were located in Phra Nakhon Si Ayutthaya province during rainfed crop in 2019 (May–October). They participated the experiments and received services via RiceSAP mobile app. Most farmers cultivated the same rice variety which was RD41. All paddy fields were irrigated, with different soil series varying by soil texture, composition and conditions. The observed yields at harvest were collected by farmer interviews. Figure 9 depicts the paddy field locations on a soil map provided by the Land Development Department. AquaCrop simulations were initialized with Appha-I datasets and climatic inputs were updated with recent satellite products every ten days. The results of simulated yield and corresponding MAPE for each farmer at each calibration step are shown in Table 7 (all yields were measured at 15% grain moisture). These experiments confirmed that the recalibration process could significantly reduce the MAPE in every field. The average MAPE was reduced from 33.6 to 16.7 and 13.1 and its standard deviation is decreased from 30.6 to 14.4 and 14.7 with recalibration at full canopy and harvest, respectively.

4. Discussion

From the results, Alpha-I dataset is necessity to enable AquaCrop simulation nationwide. Although the simulated results may be somewhat inaccurate, which may reason from the use of 5-year average historical satellite-derived products for climatic inputs as shown in Table 6, it has capability to work very well with recalibration process achieving 20.16% MAPE at the experimental site. This leaves room for more advanced prediction of climatic inputs to be adopted. On the other hand, the recalibration algorithms work consistently well in all experiments and proof to be worthy of. In essence, Step-1 recalibration at full canopy can simulate the yield 2 months in advance with good MAPE in most cases. This information is essential for farmers to adapt themselves to some worst-case scenarios. Step-2 recalibration at harvest is equally important as the regional-scale final yield can be accurately estimated instead of the conventional crop-cutting method. This information is vital to all stakeholders in the rice supply chain. We notice that User No. 1, 3, 8 and 9 in the second experiments exhibit diverse results (MAPE > 20% after Step-2 recalibrations) from others and are subject to further investigations for the causes. The performance variations are probably caused by non-conservative crop parameters, e.g., specific cultivar, soil moisture and salinity, weed management, etc. Additionally, some paddy fields suffered loss from pests and diseases, which is not accounted for in the model.
Satellite-derived climatic inputs from TERRA/MODIS and FY-2 IR are effective replacement for data from weather station. At 1-km resolution with 10-day temporal resolution, our proposed algorithms balance between satellite data availability and performance, for which AquaCrop simulations can attain 12.67% MAPE at the experimental site and on the average 13.11% MAPE on randomly selected fields, with recalibrations. This number is acceptable for national-level statistics. The RiceSAP mobile app also proved to be working well with farmers with typical digital literacy.

5. Conclusions

To enable adaptation to climate change for a developing country such as Thailand, a cost-effective approach for timely crop monitoring and accurate yield prediction nationwide is needed. This work proposes RiceSAP, a cloud-based platform optimized for AquaCrop model for rice crop monitoring and yield prediction with satellite-derived climate inputs (TERRA/MODIS and FY-2 IR). A compilation of relevant initial conditions and historical climatic parameters from trusted data sources are integrated into the platform, called Alpha-I default datasets. This dataset can initialize AquaCrop simulation almost anywhere in Thailand. In addition, a mobile app called RiceSAP is developed for farmers to use our services. By providing their crop and farm specific parameters to our platform, a farm-scale simulation and information can be obtained. To improve AquaCrop performance, a novel recalibration technique based on Sentinel−2 NDVI is also presented. Collectively, the RiceSAP platform requires no field equipment installation to attain regional-scale services at farm-scale resolution in realtime.
The results from the experimental site confirmed that AquaCrop worked with Alpha-I static dataset yielding 63.89% MAPE. Its performance became better when either data from satellite- derived or weather station were available, reducing to around 28% MAPE. Applying recalibration technique even boosted up performance to 20.16% MAPE for Alpha-I dataset, and 4.9% MAPE for weather station. The suggested operating configuration is satellite-derived inputs and recalibration, whose performance was 12.67% MAPE. Field variation performance tests were also conducted on 20 randomly selected fields and soil types revealed consistent results with average MAPE at 33.62% and 13.11%, before and after recalibrations, respectively. Though impressive results, we look forward to enhancing the platform functionality by incorporating pests/diseases database with Sentinel−2 NDVI profile and expanding Alpha-I default datasets to cover other industrial crops. The prevalence of IoT devices also encourage us to include IoT data interface and processing for precision farming strategy as well.

Author Contributions

W.V. contributed in conceptualization and methodology. M.R. administered field data collection and curation and contributed to the platform development. Both authors contributed equally in performing data analysis and manuscript preparation. All authors have read and agreed to the published version of the manuscript.

Funding

This research was funded by the Broadcasting and Telecommunications Research and Development Fund for the Public Interest under the project “Prototype Development of SMART Agriculture Platform Integrating Remote Sensing Technology with AquaCrop Model”, grant number B2-028/1-61 and “The Development of Drought Risk Analysis Platform using Multiple Satellite Sensors and Yield Estimation by AquaCrop Model with Satellite Drought Indices” was funded by the Science and Technology Research Partnership for Sustainable Development (SATREPS), JST-JICA under the project “Advancing Co-design of Integrated Strategies with Adaptation to Climate Change in Thailand (ADAP-T)”.

Acknowledgments

The authors acknowledge CSRS staff for their efforts in field data collection and RiceSAP platform development. This work could not have been successful without their support.

Conflicts of Interest

The authors declare no conflict of interest.

References

  1. Food and Agriculture Organization of the United Nations. Available online: http://www.fao.org/3/a-i6398e.pdf (accessed on 21 March 2020).
  2. Rehman, A.; Shaikh, Z. Smart Agriculture. In Application of Modern High Performance Networks; Zubairi, J.A., Ed.; Bentham Science Publisher Ltd.: Sharjah, UAE, 2009; pp. 120–129. [Google Scholar]
  3. Atzberger, C. Advances in Remote Sensing of Agriculture: Context Description, Existing operational monitoring systems and major information needs. Remote Sens. 2013, 5, 949–981. [Google Scholar] [CrossRef] [Green Version]
  4. Robertson, M.J.; Kirkegaard, J.A. Water-use efficiency of dryland canola in an equi-seasonal rainfall environment. Aust. J. Agric. Res. 2005, 56, 1373–1386. [Google Scholar] [CrossRef]
  5. Rudorff, B.F.T.; Batista, G.T. Spectral response of wheat and its relationship to agronomic variables in the tropical region. Remote Sens. Environ. 1990, 31, 53–63. [Google Scholar] [CrossRef] [Green Version]
  6. Doraiswamy, P.C.; Moulin, S.; Cook, P.W.; Stern, A. Crop yield assessment from remote sensing. Photogramm. Eng. Rem. 2003, 69, 665–674. [Google Scholar] [CrossRef]
  7. Majd, A.S.; Bleiweiss, M.P.; Dubois, D.; Shukla, M.K. Estimation of the fractional canopy cover of pecan orchards using Landsat 5 satellite data, aerial imagery, and orchard floor photographs. Int. J. Remote Sens. 2013, 34, 5937–5952. [Google Scholar] [CrossRef]
  8. Ferencz, C.; Bognar, P.; Lichtenberger, J. Crop yield estimation by satellite remote sensing. Int. J. Remote Sens. 2004, 25, 4113–4149. [Google Scholar] [CrossRef]
  9. Yang, C.; Everitt, J.H.; Bradford, J.M.; Escobar, D.E. Mapping grain sorghum growth and yield variations using airborne multispectral digital imagery. Trans. ASAE 2000, 43, 1927–1938. [Google Scholar] [CrossRef]
  10. Di Paola, A.; Valentini, R.; Santini, M. An overview of available crop growth and yield models for studies and assessments in agriculture. J. Sci. Food Agric. 2016, 96, 709–714. [Google Scholar] [CrossRef]
  11. Homma, K.; Maki, M.; Hirooka, Y. Development of a rice simulation model for remote sensing (SIMRIW-RS). J. Agric. Meteorol. 2017, 73, 9–15. [Google Scholar] [CrossRef] [Green Version]
  12. Mass, S.J. Use of remotely-sensed information in agricultural crop growth model. Ecol. Modell. 1988, 41, 247–268. [Google Scholar] [CrossRef]
  13. Hoogenboom, G.J.; White, J.W.; Messina, C.D. From genome to crop: Integration through simulation modelling. Field Crops Res. 2004, 90, 145–163. [Google Scholar] [CrossRef]
  14. Rauff, K.O.; Bello, R. A review of crop growth simulation models as tools for agricultural meteorology. Agric. Sci. 2015, 6, 8. [Google Scholar] [CrossRef]
  15. Kasampalis, D.A.; Alexandridis, T.K.; Deva, C.; Challinor, A.; Moshou, D.; Zalidis, G. Contribution of remote sensing on crop models: A review. J Imaging 2018, 4, 52. [Google Scholar] [CrossRef] [Green Version]
  16. Food and Agriculture Organization of the United Nations. Review of the Available Remote Sensing Tools, Products, Methodologies and Data to Improve Crop Production Forecasts; FAO: Rome, Italy, 2017; pp. 14–19. [Google Scholar]
  17. Ramirez-Villegas, J.; Watson, J.; Challinor, A.J. Identifying traits for genotypic adaptation using crop models. J. Exp. Got. 2015, 66, 3451–3462. [Google Scholar] [CrossRef]
  18. Food and Agriculture Organization of the United Nations. AquaCrop or FAO. Available online: http://www.fao.org/aquacrop/overview/whatisaquacrop/en/ (accessed on 21 March 2020).
  19. Sarangi, A. Crop Yield Simulation Using AquaCrop Model under Rainfed and Irrigated Conditions; Water Technology Centre, Indian Agricultural Research Institute Library Avenue: New Delhi, Indian, 2012; pp. 50–60. [Google Scholar]
  20. Todorovic, M.; Albrizio, R.; Zivotic, L.; Abi Saab, M.; Stöckle, C.; Steduto, P. Assessment of AquaCrop, CropSyst, and WOFOST Models in the Simulation of Sunflower Growth under Different Water Regimes. J. Agron. 2009, 101, 509–521. [Google Scholar] [CrossRef]
  21. Food and Agriculture Organization of the United Nations or FAO. Available online: http://www.fao.org/land-water/land/land-governance/land-resources-planning-toolbox/category/details/en/c/1027490/ (accessed on 21 March 2020).
  22. Vanuytrecht, E.; Raes, D.; Steduto, P.; Hsiao, T.C.; Fereres, C.H.; Lee, K.H.; Vila, M.G.; Moreno, P.M. AquaCrop: FAO’s crop water productivity and yield response model. Environ. Modell. Softw. 2014, 62, 351–360. [Google Scholar] [CrossRef]
  23. Food and Agriculture Organization of the United Nations. AquaCrop. Available online: https://digital.csic.es/bitstream/10261/180239/1/IntroAquaCrop_20190304.pdf (accessed on 21 March 2020).
  24. Marta, A.D.; Chirico, G.B.; Bolognesi, S.F.; Mancini, M.; D’Urso, G.; Orlandini, S.; De Michele, C.; Altobelli, F. Integrating Sentinel-2 imagery with AquaCrop for dynamic assessment of tomato water requirements in Southern Italy. Agronomy 2019, 9, 404. [Google Scholar] [CrossRef] [Green Version]
  25. Prathumchai, K.; Nagai, M.; Tripathi, N.K.; Sasaki, N. Forecasting Transplanted Rice Yield at the Farm Scale Using Moderate-Resolution Satellite Imagery and the AquaCrop Model: A Case Study of a Rice Seed Production Community in Thailand. Int. J. Geo-Inf. 2018, 7, 73. [Google Scholar] [CrossRef] [Green Version]
  26. Office of Agricultural Economics. Available online: http://www.oae.go.th/view/1/Home/EN-US (accessed on 21 March 2020).
  27. Allen, G.R.; Pereira, L.S.; Raes, D.; Smith, M. Crop Evapotranspiration-Guidelines for computing crop water requirements. FAO Irrig. Drain. Pap. 1998, 56, 78–86. [Google Scholar]
  28. Hargreaves, G.H.; Samani, Z.A. Reference crop evapotranspiration from temperature. Appl. Eng. Agric. 1985, 1, 96–99. [Google Scholar] [CrossRef]
  29. Veerakachen, W.; Raksapatcharawong, M. Daily monitoring of soil moisture in Thailand by FY-2E satellite. Kasetsart J. (Nat. Sci.) 2014, 48, 254–262. [Google Scholar]
  30. Raes, D.; Steduto, P.; Hsiao, T.C.; Fereres, E. Calculation Procedures. In AquaCrop Reference Manual, version 6.0–6.1; Food and Agriculture Organization of the United Nations: Rome, Italy, 2018. [Google Scholar]
Figure 1. Location of study area: (a) location of the experimental site; (b) True color image of the site taken by DJI Phantom-3 advanced equipped with Sequoia multispectral camera on 1 April 2019. Red dots represent 20 sample plots for field measurements.
Agronomy 10 00858 g001
Figure 2. Linear regressions of MODIS LST products versus max (upper) and min (lower) temperatures from TMD stations (nationwide), for daily (left), dekadal (middle), and monthly (right) temporal resolutions.
Agronomy 10 00858 g002
Figure 3. Linear relationship between NDVI versus CC product from drone and ground images.
Agronomy 10 00858 g003
Figure 4. Comparison of Sentinel-2 NDVI product versus CC product from field images, dotted box indicates the interval that both are similar.
Agronomy 10 00858 g004
Figure 5. Variation of green canopy cover throughout the growing cycle under non-stress conditions [30].
Agronomy 10 00858 g005
Figure 6. Relationship used for recalibration process: (a) CCX and Soil fertility; (b) CCX date and CGC.
Agronomy 10 00858 g006
Figure 7. Conceptual block diagram of RiceSAP platform.
Agronomy 10 00858 g007
Figure 8. Comparison of AquaCrop simulated canopy cover profile with different recalibration schemes.
Agronomy 10 00858 g008
Figure 9. Locations of RiceSAP user’s paddy fields mapped on different soil series in Ayutthaya.
Agronomy 10 00858 g009
Table 1. Field measurement activities at the experimental site in 2019.
Rice StagePhotos Taken from the SiteField Measurement
DroneECCCYield
Transplanting
(25 February, 25 days after sowing)
Agronomy 10 00858 i001-
Flowering
(9 April, 63 days after sowing)
Agronomy 10 00858 i002-
Harvest
(1 May, 85 days after sowing)
Agronomy 10 00858 i003
Table 2. Satellite products and ground data used for deriving climatic parameters and for recalibrations.
Data SourcesProductsResolutionAcquired Period
TERRA/MODISLST1 km2014–2017
FY-2 IR1Rainfall5 km2014–2017
TMD stationsRainfall/temperture-2014–2017
SENTINEL-2 MSINDVI10 mFebruary–May 2019
Table 3. Linear models of FY-2 IR rainfall product (x) versus and TMD rainfall (y).
Temporal ResolutionModelsR2
Dailyy = 0.567x0.11
Dekadaly = 0.3738x0.30
Monthlyy = 0.7148x0.26
Table 4. AquaCrop input parameters adjusted for simulations with the proposed algorithm.
InputsParametersSatellite Products
Climatemax/min air temperature and ET0TERRA/MODIS LST
RainfallFY-2 IR Rainfall
Cropinitial values for crop responseSentinel-2 NDVI
Managementsoil fertilitySentinel-2 NDVI
Table 5. AquaCrop simulated yields and corresponding mean absolute percentage errors (MAPE) for different climatic parameters and recalibration processes.
DatasetsNo Recalibration1st Step Recalibration2nd Step Recalibration
Simulated
Yield
(ton/ha)
Prediction
MAPE
(%)
Simulated
Yield
(ton/ha)
Prediction
MAPE
(%)
Simulated
Yield
(ton/ha)
Estimation
MAPE
(%)
Alpha I4.5463.893.7133.912.2120.16
Weather Station3.5427.812.519.282.644.9
Satellite derived3.5527.922.3415.483.1212.67
Table 6. Datasets of satellite-derived climatic parameters used for each recalibration step.
DatasetClimatic DataYearParameters
PlantingHRS5Y 12013–2017Alpha I
Full CanopyRS1Y 2 + HRS5Y 12013–2017 & 2019Update Climatic data to RS1Y 2 from planting date to CCx date.
Readjust CCx date, CGC and Soil Fertility
HarvestingRS1Y 22019Update Climatic data to RS1Y 2
Readjust Senescence date, and Harvesting date.
1 HRS5Y is the average historical satellite climate data in 2013–2017. 2 RS1Y is the satellite-derived climate data in 2019.
Table 7. Field variation performance for each RiceSAP user in experiments.
User
No.
Area
(ha)
Observed Yield
(ton/ha)
PlantingFull CanopyHarvest
Simulated
Yield
(ton/ha)
Prediction MAPE
(%)
Simulated
Yield
(ton/ha)
Prediction MAPE
(%)
Simulated
Yield
(ton/ha)
Estimation MAPE
(%)
12.563.205.8683.253.6835.254.2231.94
24.83.756.1664.273.365.323.691.49
31.62.505.82132.753.5566.964.1264.94
40.645.005.8416.824.7110.825.224.35
55.125.105.8514.754.8010.874.5710.28
6165.385.9610.795.029.745.115.05
73.23.755.3843.563.9323.174.5019.91
80.83.445.1249.083.7427.934.2523.76
91.63.445.2251.853.6324.064.1620.98
100.864.355.3021.764.2815.654.9012.62
110.94.905.6715.774.549.005.257.15
121.185.175.7010.224.706.904.934.71
131.575.446.2915.523.9314.964.7911.96
140.564.635.2914.314.042.694.752.79
153.24.015.0325.223.749.544.173.85
1644.015.0625.923.7810.773.990.72
171.65.664.8015.145.3511.265.424.29
181.926.255.1417.824.5813.865.4812.26
199.65.196.1518.574.136.435.091.85
203.524.836.0324.943.3318.853.9917.39
Average 33.62 16.70 13.11
SD 30.60 14.38 14.91

