Recovery of 15N Labeled Nitrogen Fertilizer by Fertigated and Drip Irrigated Greenhouse Vegetable Crops

 ,
, 
Abstract
1. Introduction
2. Materials and Methods
2.1. Location and Greenhouses
2.2. Crops and Crop Management
2.3. Experimental Design
2.4. Treatments–N and Irrigation Management
2.5. 15N Applications
2.6. Determinations of Plant/Soil Parameters
2.6.1. Field Sampling and Handling of 15N-Labeled Plant Material
2.6.2. Calculation of 15N Recovery
2.6.3. Fruit Production, Dry Matter Production, and Crop N Uptake of Unlabeled Plants
2.6.4. Soil Mineral N
2.6.5. Soil Solution NO3−
2.7. Statistical Analyses
3. Results
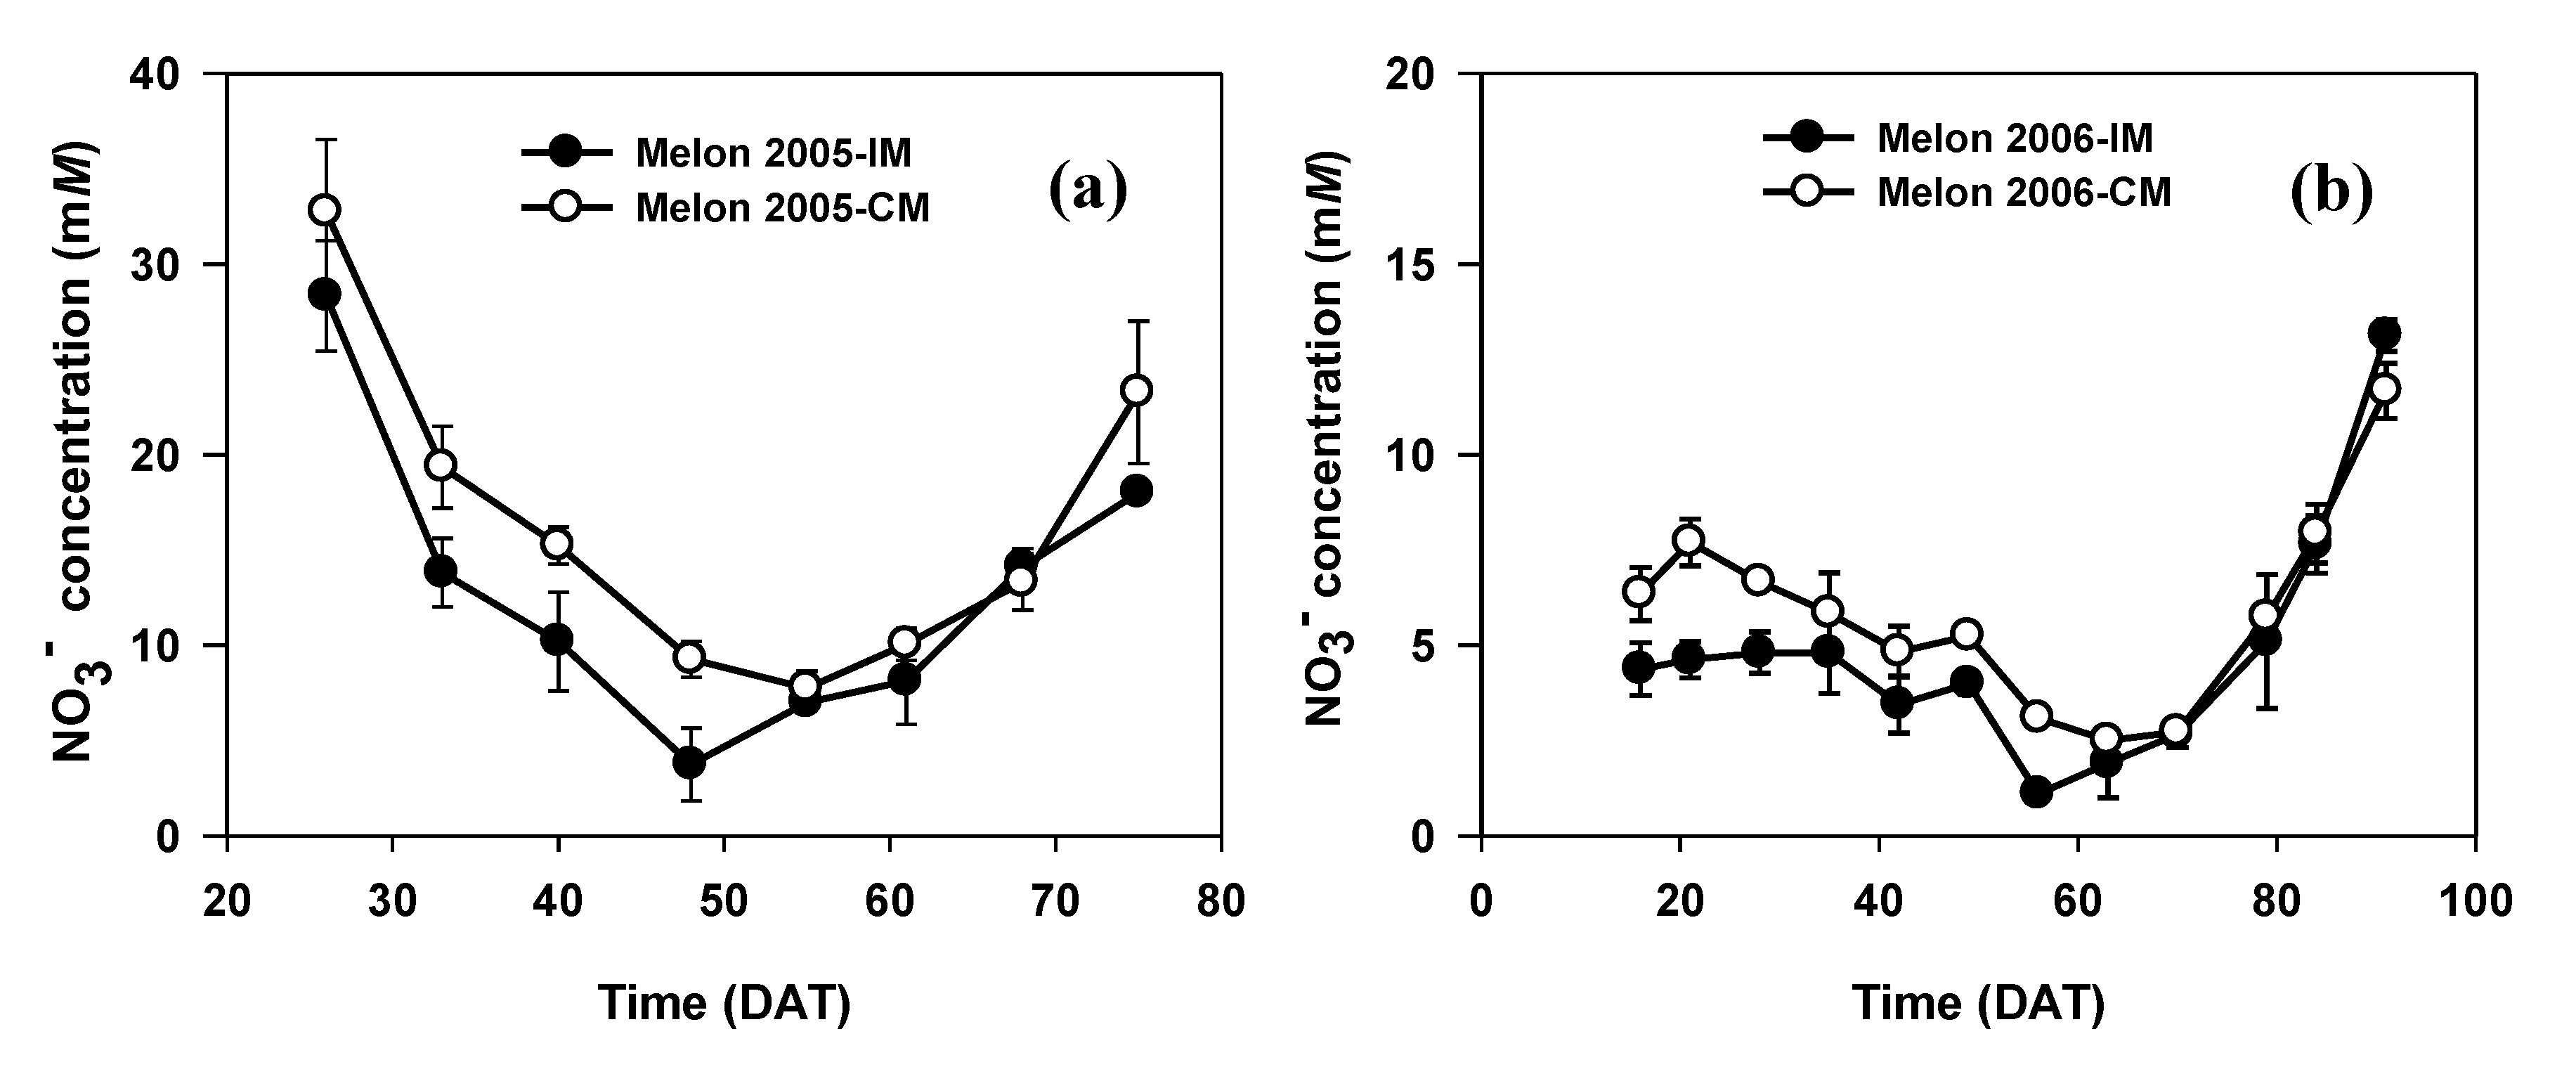
3.1. Muskmelon
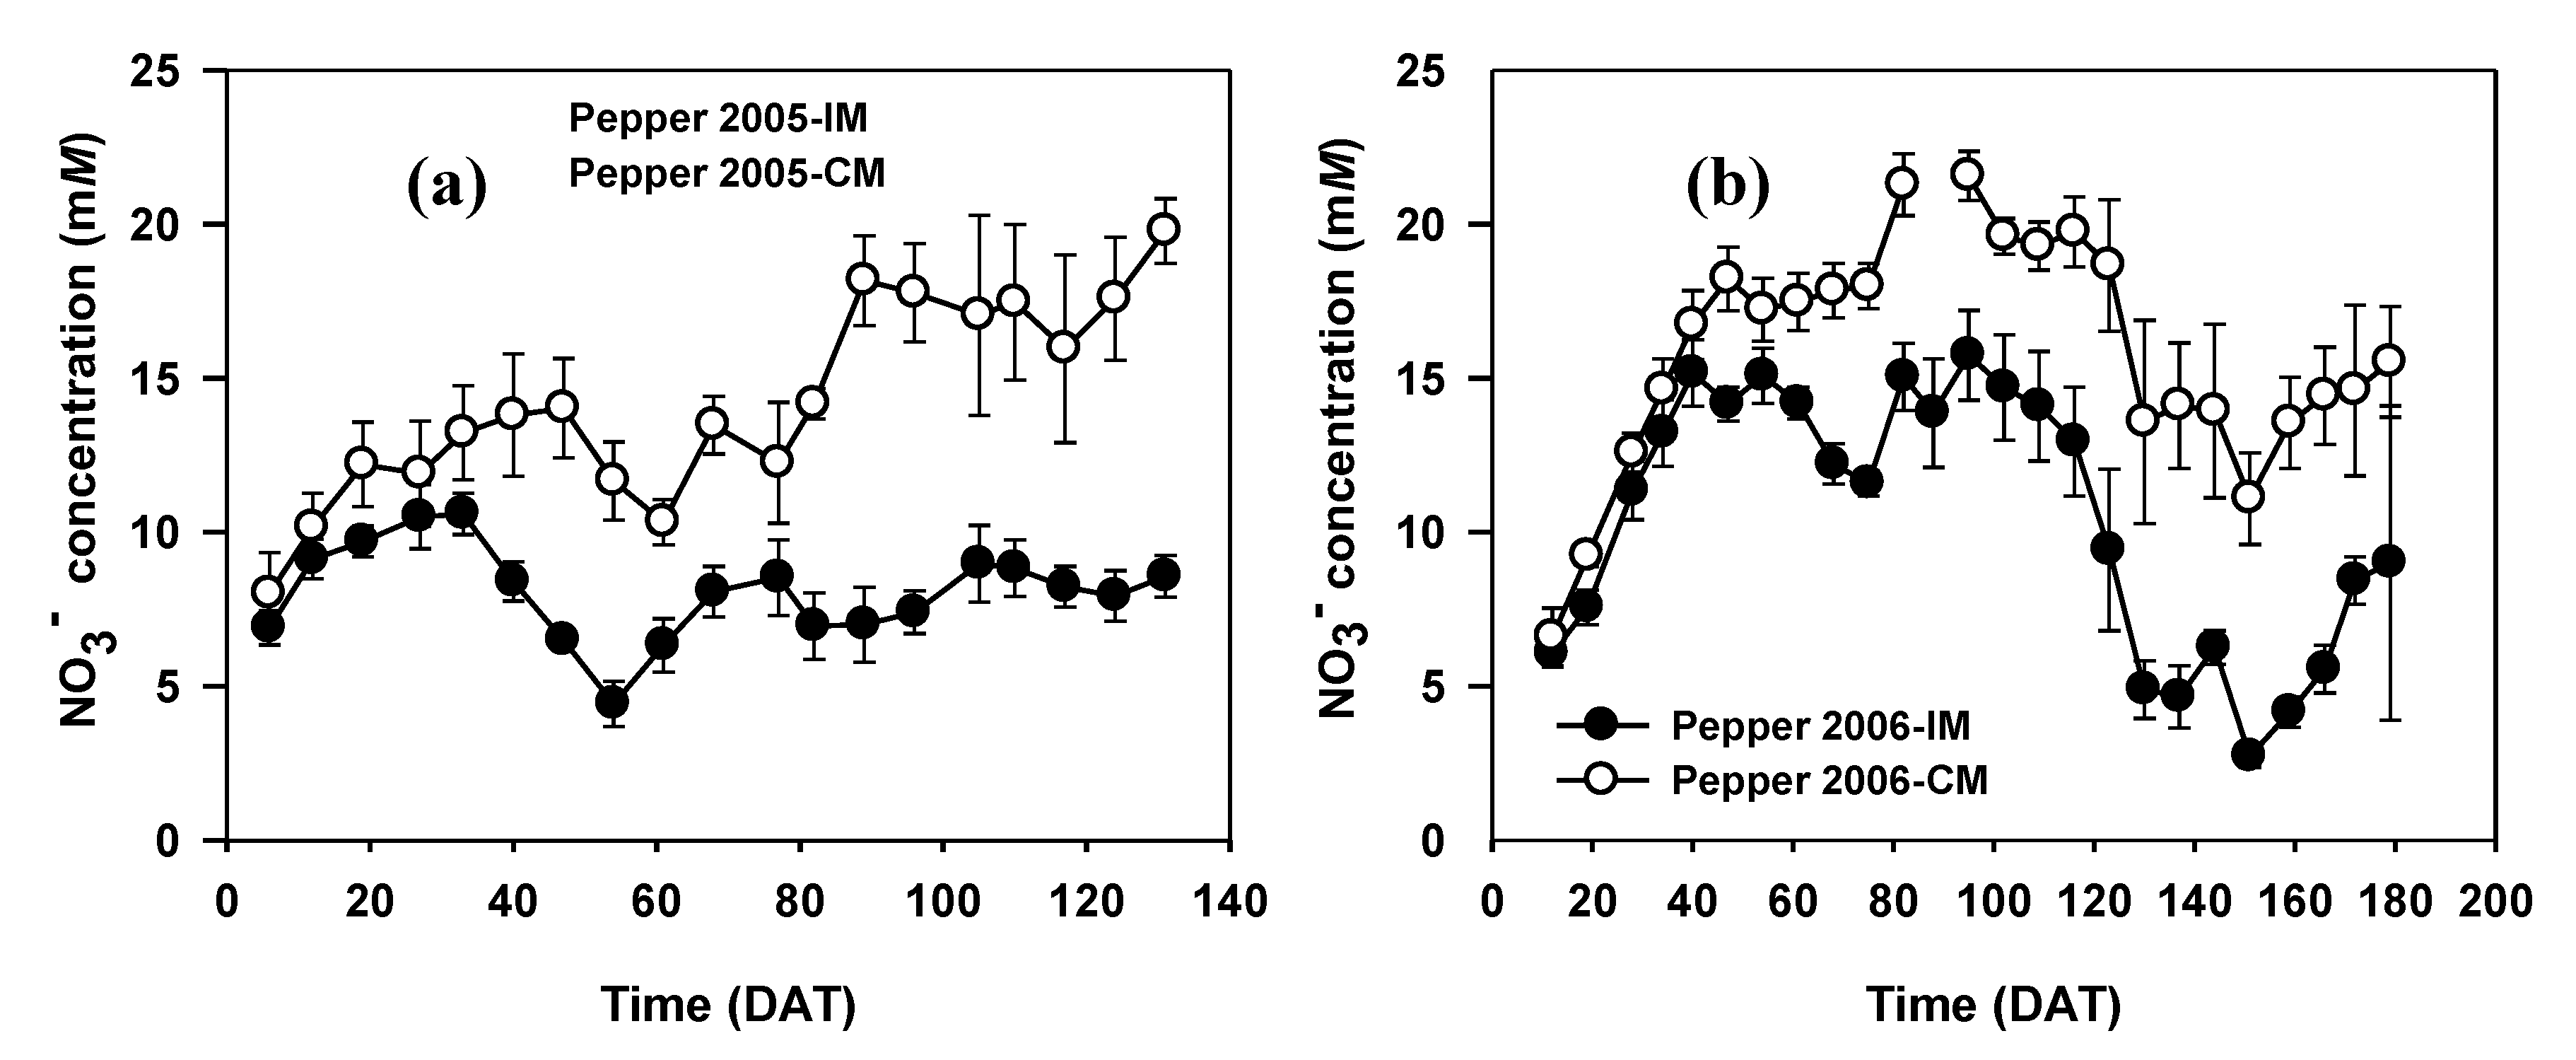
3.2. Sweet Pepper
4. Discussion
Supplementary Materials
Author Contributions
Funding
Acknowledgments
Conflicts of Interest
References
- Pardossi, A.; Tognoni, F.; Incrocci, L. Mediterranean greenhouse technology. Chron. Hortic. 2004, 44, 28–34. [Google Scholar]
- Castilla, N.; Hernández, J. The plastic greenhouse industry of Spain. Chron. Hortic. 2005, 45, 15–20. [Google Scholar]
- Consejería de Agricultura, Pesca y Desarrollo Sostenible. Cartografía de Invernaderos en Almería, Granada y Málaga; Secretaria General de Agricultura y Alimentación, Junta de Andalucía: Sevilla, Spain, 2019; p. 26. [Google Scholar]
- Instituto de Fomento de la Región de Murcia. El Sector Agroalimentario en la Región de Murcia; Instituto de Fomento de la Región de Murcia: Murcia, Spain, 2012; p. 7. [Google Scholar]
- Castilla, N.; Hernández, J.; Abou-Hadid, A.F. Strategic crop and greenhouse management in mild winter climate areas. Acta Hort. 2004, 633, 183–196. [Google Scholar] [CrossRef]
- USDA-FAS. Mexico, Greenhouse and Shade House Production to Continue Increasing. GAIN Report No.MX0024, Date 22 April 2010. USDA Foreign Agricultural Service. 2010. Available online: http://gain.fas.usda.gov/Recent%20GAIN%20Publications/Greenhouse%20and%20Shade%20House%20Production%20to%20Continue%20Increasing_Mexico_Mexico_4-22-2010.pdf. (accessed on 27 April 2020).
- Pratt, P.F. Nitrogen use and nitrate leaching in irrigated agriculture. In Nitrogen in Crop Production; Hauck, R.D., Ed.; American Society of Agronomy: Madison, WI, USA, 1984; pp. 319–333. [Google Scholar]
- Kraft, G.J.; Stites, W. Nitrate impacts on groundwater from irrigated-vegetable systems in a humid north-central US sand plain. Agric. Ecosyst. Environ. 2003, 100, 63–74. [Google Scholar] [CrossRef]
- Ramos, C.; Agut, A.; Lidon, A.L. Nitrate leaching in important horticultural crops of the Valencian Community region (Spain). Environ. Pollut. 2002, 118, 215–223. [Google Scholar] [CrossRef]
- Ju, X.T.; Kou, C.L.; Zhang, F.S.; Christie, P. Nitrogen balance and groundwater nitrate contamination: Comparison among three intensive cropping systems on the North China Plain. Environ. Pollut. 2002, 143, 117–125. [Google Scholar] [CrossRef]
- Vázquez, N.; Pardo, A.; Suso, M.L.; Quemada, M. Drainage and nitrate leaching under processing tomato growth with drip irrigation and plastic mulching. Agric. Ecosyst Environ. 2006, 112, 313–323. [Google Scholar] [CrossRef]
- Thompson, R.B.; Tremblay, N.; Fink, M.; Gallardo, M.; Padilla, F.M. Tools and strategies for sustainable nitrogen fertilisation of vegetable crops. In Advances in Research on Fertilization Management of Vegetable Crops; Advances in Olericulture; Tei, F., Nicola, S., Benincasa, P., Eds.; Springer: Cham, Switzerland, 2017; pp. 11–63. [Google Scholar]
- Fereres, E.; Goldhamer, D.A.; Parsons, L.R. Irrigation water management of horticultural crops. Hortscience 2003, 38, 1036–1142. [Google Scholar] [CrossRef]
- Thompson, R.B.; Incrocci, L.; Voogt, W.; Pardossi, A.; Magán, J.J. Sustainable irrigation and nitrogen management of fertigated vegetable crops. Acta Hortic. 2017, 1150, 363–378. [Google Scholar] [CrossRef]
- Pulido-Bosch, A. Recarga en la Sierra de Gádor e Hidrogeoquímica de los Aquíferos del Campo de Dalías; Escobar Impresores SL: El Ejido, Almería, Spain, 2005; p. 330. [Google Scholar]
- Domínguez, P. Estado Actual de los Acuíferos del Sur de la Sierra de Gádor-Campo de Dalías; IGME: Madrid, Spain, 2016; Available online: http://info.igme.es/ConsultaSID/presentacion.asp?Id=166757 (accessed on 5 February 2019).
- European Economic Community, Council directive 91/676/EEC concerning the protection of waters against pollution caused by nitrates from agricultural sources. Off. J. Eur. Communities 1991, L135, 1–8.
- Thompson, R.B.; Martínez-Gaitán, C.; Gallardo, M.; Giménez, C.; Fernández, M.D. Identification of irrigation and N management practices that contribute to nitrate leaching loss from an intensive vegetable production system by use of a comprehensive survey. Agric. Water Manag. 2007, 89, 261–274. [Google Scholar] [CrossRef]
- Céspedes, A.J.; García, M.C.; Pérez-Parra, J.J.; Cuadrado, I.M. Caracterización de la Explotación Hortícola Protegida Almeriense; Fundación para la Investigación Agraria en la Provincia de Almería: Almería, Spain, 2009; p. 178. [Google Scholar]
- Gallardo, M.; Giménez, C.; Martínez-Gaitán, C.; Stöckle, C.O.; Thompson, R.B.; Granados, M.R. Evaluation of the VegSyst model with muskmelon to simulate crop growth, nitrogen uptake and evapotranspiration. Agric. Water Manag. 2011, 101, 107–211. [Google Scholar] [CrossRef]
- Gallardo, M.; Fernández, M.D.; Giménez, C.; Padilla, F.M.; Thompson, R.B. Revised VegSyst model to calculate dry matter production, critical N uptake and ETc of several vegetable species grown in Mediterranean greenhouses. Agric. Syst. 2016, 146, 30–43. [Google Scholar] [CrossRef]
- Granados, M.R.; Thompson, R.B.; Fernández, M.D.; Martínez-Gaitán, C.; Gallardo, M. Prescriptive-corrective nitrogen and irrigation management of fertigated and drip-irrigated vegetable crops using modeling and monitoring approaches. Agric. Water Manag. 2013, 119, 121–134. [Google Scholar] [CrossRef]
- Gallardo, M.; Thompson, R.B.; Giménez, C.; Padilla, F.M.; Stöckle, C.O. Prototype decision support system based on the VegSyst simulation model to calculate crop N and water requirements for tomato under plastic cover. Irrig. Sci. 2014, 32, 237–253. [Google Scholar] [CrossRef]
- Carranca, C.; Soares da Silva, A.; Fernández, M.; Varela, J. 15N fertilizer use efficiency by spinach grown under Portuguese field conditions. Acta Hort. 2001, 563, 67–72. [Google Scholar] [CrossRef]
- Miller, R.J.; Rolston, D.E.; Rauschkolb, R.S.; Wolfe, D.W. Labeled nitrogen uptake by drip-irrigated tomatoes. Agron. J. 1981, 73, 265–270. [Google Scholar] [CrossRef]
- Mohammad, M.J. Utilization of applied fertilizer nitrogen and irrigation water by drip-fertigated squash as determined by nuclear and traditional techniques. Nutr. Cycl. Agroecos. 2004, 68, 1–11. [Google Scholar] [CrossRef]
- Pessarakli, M.; Tucker, T.C. Nitrogen-15 uptake by eggplant under sodium chloride stress. Soil Sci. Soc. Am. J. 1988, 52, 1673–1676. [Google Scholar] [CrossRef]
- Wittwer, S.H.; Castilla, N. Protected cultivation of horticultural crops worldwide. HortTech 1995, 3, 6–19. [Google Scholar] [CrossRef]
- Fernández, M.D.; González, A.M.; Carreño, J.; Pérez, C.; Bonachela, S. Analysis of on-farm irrigation performance in Mediterranean greenhouses. Agric. Water Manag. 2007, 89, 251–260. [Google Scholar] [CrossRef]
- Fernández, M.D.; Baeza, E.; Céspedes, A.; Pérez-Parra, J.; Gázquez, J.C. Validation of on-farm crop water requirements (PrHo) model for horticultural crops in an unheated plastic greenhouse. Acta Hort. 2009, 807, 295–300. [Google Scholar] [CrossRef]
- Orgaz, F.; Fernández, M.D.; Bonachela, S.; Gallardo, M.; Fereres, E. Evapotranspiration of horticultural crops in an unheated plastic greenhouse. Agric. Water Manag. 2005, 72, 81–96. [Google Scholar] [CrossRef]
- Gallardo, M.; Thompson, B.; Fernández, M.D. Water requirements and irrigation management in Mediterranean greenhouses: The case of the southeast coast of Spain. In Good Agricultural Practices for Greenhouse Vegetable Crops. Principle for Mediterranean Climate Areas; FAO: Rome, Italy, 2013; pp. 109–136. [Google Scholar]
- Giller, K.E.; Chalk, P.; Dobermann, A.; Hammond, L.; Heffer, P.; Ladha, J.K.; Nyamudeza, P.; Maene, L.; Ssali, H.; Freney, J. Emerging technologies to increase the efficiency of use of fertilizer nitrogen. In Agriculture and the Nitrogen Cycle: Assessing the Impacts of Fertilizer Use on Food Production and the Environment; Mosier, A.R., Syers, K.J., Freney, J.R., Eds.; Island Press: Washington, DC, USA, 2004; pp. 35–51. [Google Scholar]
- Granados, M.R. Nitrate Leaching from Soil-Grown Vegetable Crops under Greenhouse Conditions in Almería: Magnitude, Determining Factors and Development of an Improved Management System. Ph.D. Thesis, University of Almería, Almería, Spain, 2011. [Google Scholar]
- Mosier, A.R.; Syers, J.K.; Freney, J.R. Nitrogen fertilizer an essential component of increased food, feed and fibre production. In Agriculture and the Nitrogen Cycle; Mosier, A.R., Syers, J.K., Freney, J.R., Eds.; Island Press: Washington, DC, USA, 2004; pp. 3–15. [Google Scholar]
- Fernández-Rodríguez, E.J.; Camacho-Ferre, F. Manual Práctico de Fertirrigación en Riego por Goteo; Ediciones Agrotécnicas: Madrid, Spain, 2008; p. 168. [Google Scholar]
- Thompson, R.B.; Gallardo, M.; Rodríguez, J.S.; Magán, J.J.; Sánchez, J.A. Effect of N uptake concentration on crop N uptake and nitrate leaching from tomato grown in free-draining soilless culture under Mediterranean conditions. Sci. Hortic. 2013, 150, 387–398. [Google Scholar] [CrossRef]
- Dasberg, S.; Or, D. Drip Irrigation; Springer: Berlin, Germany, 1999; p. 162. [Google Scholar]
- Li, J.; Zhang, J.; Rao, M. Wetting patterns and nitrogen distributions as affected by fertigation strategies from a surface point source. Agric. Water Manag. 2004, 27, 89–104. [Google Scholar] [CrossRef]
- Thompson, R.B.; Gallardo, M.; Giménez, C. Assessing risk of nitrate leaching from the horticultural industry of Almeria, Spain. Acta Hort. 2000, 571, 243–245. [Google Scholar] [CrossRef]


| Soil Property | Depth (cm) | ||||
|---|---|---|---|---|---|
| 0–10 | 10–20 | 20–30 | 30–40 | 40–60 | |
| Clay content (%) | 49 | 51 | 53 | 32 | 13 |
| Silt content (%) | 36 | 35 | 34 | 33 | 15 |
| Sand content (%) | 15 | 14 | 13 | 35 | 72 |
| Texture classification (USDA) | clay | clay | clay | clay-loam | sandy loam |
| Bulk density (Mg m−3) | 1.4 | 1.4 | 1.6 | 1.5 | 1.6 |
| pH (soil:water; 1:1) | 8.4 | 8.4 | 8.3 | 8.3 | 8.3 |
| EC saturated extract (dS m−1) | 2.7 | 2.4 | 2.3 | 2.7 | 2.0 |
| Organic carbon (%) | 1.05 | 0.67 | 0.29 | 0.80 | 0.15 |
| Total N (%) | 0.12 | 0.08 | 0.06 | 0.08 | 0.02 |
| Total carbonates (%) | 20.4 | 20.0 | 19.6 | 19.2 | 24.9 |
| Parameter | CM-2005 | IM-2005 | CM-2006 | IM-2006 |
|---|---|---|---|---|
| Irrigation applied (mm) | 220 | 186 | 199 | 178 |
| Nmin applied (kg N ha−1) | 364 | 298 | 326 | 235 |
| NO3− concentration in solution (mM) | 10.9 | 10.5 | 11.1 | 9.4 |
| NH4+ concentration in solution (mM) | 0.9 | 0.9 | 0.6 | 0.5 |
| Parameter | 2005-CM | 2005-IM | 2006-CM | 2006-IM |
|---|---|---|---|---|
| Irrigation applied (mm) | 307 | 254 | 344 | 290 |
| Nmin applied (kg N ha−1) | 475 | 275 | 493 | 317 |
| NO3− concentration in solution (mM) | 10.4 | 7.4 | 9.7 | 7.4 |
| NH4+ concentration in solution (mM) | 0.6 | 0.3 | 0.5 | 0.4 |
| 15N Treatments | Year of Application, Crop Management, Crop Growth Stage | |||
|---|---|---|---|---|
| 2005 | 2005 | 2006 | 2006 | |
| CM | IM | CM | IM | |
| VG | VG | FP | FP | |
| Total volume (mm) | 16.8 | 9.7 | 13.8 | 13.8 |
| NO3− concentration (mM) | 11.6 | 11.6 | 14.2 | 12.3 |
| 15N enrichment (atom% excess) | 17.1 | 17.1 | 16.0 | 16.5 |
| Total N amount (kg N ha−1) | 4.5 | 2.6 | 6.9 | 6.6 |
| Percentage of total Nmin applied (%) as 15N labeled fertilizer | 1.2 | 0.9 | 2.1 | 8.0 |
| 15N Treatments | Year of Application, Crop Management, Crop Growth Stage | |||
|---|---|---|---|---|
| 2005 | 2005 | 2006 | 2006 | |
| CM | IM | CM | IM | |
| VG | VG | FP | FP | |
| Total volume (mm) | 11.2 | 11.2 | 6.2 | 6.2 |
| NO3− concentration (mM) | 13.1 | 8.7 | 13.6 | 8.5 |
| 15N enrichment (atom% excess) | 18.0 | 18.4 | 18.1 | 17.9 |
| Total N amount (kg N ha−1) | 3.4 | 2.3 | 1.6 | 1.1 |
| Percentage of total Nmin applied (%) as 15N labeled fertilizer | 0.7 | 0.8 | 0.3 | 0.3 |
| Plant | Percentage Recovery of Applied 15N | |||||
|---|---|---|---|---|---|---|
| Applied during Vegetative Growth (2005) | Applied during Fruit Production (2006) | |||||
| CM (%) | IM (%) | ANOVA Results | CM (%) | IM (%) | ANOVA Results | |
| Directly labeled plant | 33.3 ± 4.2 | 44.7 ± 2.6 | n.s. | 32.3 ± 9.1 | 30.7 ± 2.1 | n.s. |
| Adjacent plants | 37.2 ± 0.1 | 23.2 ± 3.0 | n.s. | 10.0 ± 2.8 | 13.7 ± 2.2 | n.s. |
| Plant total recovery | 70.5 ± 4.1 | 67.9 ± 1.0 | n.s. | 42.2 ±11.9 | 44.4 ± 1.5 | n.s. |
| Period of 15N Application | Crop Management System | Relative Distribution of Recovered 15N in Plant Components (%) | |||
|---|---|---|---|---|---|
| Fruit | Leaves | Stem | Prunings | ||
| VG (2005) | CM | 37.4 ± 2.6 | 38.7 ± 2.9 | 16.2± 1.0 | 7.7 ± 1.5 |
| VG (2005) | IM | 13.0 ± 1.5 | 53.6 ± 1.6 | 21.9 ± 1.9 | 11.6 ± 3.3 |
| FP (2006) | CM | 47.2 ± 2.8 | 34.8 ± 1.9 | 18.0 ± 2.0 | 0 |
| FP (2006) | IM | 48.3 ± 4.5 | 36.2 ± 3.2 | 15.5 ± 1.3 | 0 |
| Year of Application, Crop, Crop Management, Growth Stage at Labeling | Fruit Production | Total Dry Matter Production | Crop N Uptake | |
|---|---|---|---|---|
| Total Fresh | Total Commercial | |||
| (kg m−2) | (kg m−2) | (t ha−1) | (kg N ha−1) | |
| 2005-M-CM-VG | 6.9 ± 0.4 | 6.7 ± 0.4 | 8.6 ± 0.2 | * 266 ± 10 |
| 2005-M-IM-VG | 6.8 ± 0.2 | 6.3 ± 0.2 | 8.1 ± 0.1 | 239 ± 4 |
| 2006-M-CM-FP | 7.8 ± 0.3 | 7.5 ± 0.2 | 9.3 ± 0.2 | 283 ± 6 |
| 2006-M-IM-FP | 7.1 ± 0.5 | 6.8 ± 0.5 | 8.7 ± 0.2 | 268 ± 3 |
| 2005-SP-CM-VG | 6.8 ±0.4 | 6.2 ± 0.4 | 9.4 ± 0.7 | 236 ± 16 |
| 2005-SP-IM-VG | 6.1 ±0.2 | 5.5 ± 0.1 | 8.8 ± 0.3 | 206 ± 8 |
| 2006-SP-CM-FP | 9.8 ±0.4 | 9.1 ± 0.4 | 11.7 ± 0.5 | 316 ± 14 |
| 2006-SP-IM-FP | 10.5 ± 0.3 | 9.9 ± 0.1 | * 13.2 ± 0.2 | 335 ± 8 |
| Crop | Conventional Management | Improved Management | ||
|---|---|---|---|---|
| Beginning (kg N ha−1) | End (kg N ha−1) | Beginning (kg N ha−1) | End (kg N ha−1) | |
| Melon 2005 | 648 ± 43 | 558 ± 36 | 606 ± 66 | 627 ± 94 |
| Melon 2006 | 511 ± 41 | 305 ± 65 | 449 ± 29 | 286 ± 55 |
| Plants | Percentage Recovery of Applied 15N | |||||
|---|---|---|---|---|---|---|
| Applied during Vegetative Growth (2005) | Applied during Fruit Production (2006) | |||||
| CM (%) | IM (%) | ANOVA Results | CM (%) | IM (%) | ANOVA Results | |
| Directly labeled plant | 51.2 ± 3.7 | 69.9 ± 3.1 | * | 49.2 ± 2.3 | 70.9 ± 2.5 | * |
| Adjacent plants | 14.7 ± 0.7 | 12.4 ± 1.4 | n.s. | 8.4 ± 2.3 | 6.1 ± 0.7 | n.s. |
| Plant total recovery | 66.0 ± 4.4 | 82.3 ± 1.8 | n.s. | 57.6 ± 3.3 | 77.0 ± 2.7 | n.s. |
| Period of 15Napplication | Crop Management System | Relative Distribution of Recovered 15N in Plant Components (%) | |||
|---|---|---|---|---|---|
| Fruit | Leaves | Stem | Prunings | ||
| VG (2005) | CM | 57.2 | 25.2 | 15.5 | 2.0 |
| VG (2005) | IM | 57.4 | 25.5 | 15.9 | 1.2 |
| FP (2006) | CM | 43.6 | 30.0 | 26.2 | 0.2 |
| FP (2006) | IM | 51.6 | 26.6 | 21.1 | 0.7 |
| Crop | Conventional Management | Improved Management | ||
|---|---|---|---|---|
| Beginning (kg N ha−1) | End (kg N ha−1) | Beginning (kg N ha−1) | End (kg N ha−1) | |
| Pepper 2005 | 487 ± 70 | 590 ± 74 | 418 ± 68 | 534 ± 46 |
| Pepper 2006 | 395 ± 12 | 429 ± 24 | 352 ± 9 | 405 ± 29 |
© 2020 by the authors. Licensee MDPI, Basel, Switzerland. This article is an open access article distributed under the terms and conditions of the Creative Commons Attribution (CC BY) license (http://creativecommons.org/licenses/by/4.0/).
Share and Cite
Martínez-Gaitán, C.; Granados, M.R.; Fernández, M.D.; Gallardo, M.; Thompson, R.B. Recovery of 15N Labeled Nitrogen Fertilizer by Fertigated and Drip Irrigated Greenhouse Vegetable Crops. Agronomy 2020, 10, 741. https://doi.org/10.3390/agronomy10050741
Martínez-Gaitán C, Granados MR, Fernández MD, Gallardo M, Thompson RB. Recovery of 15N Labeled Nitrogen Fertilizer by Fertigated and Drip Irrigated Greenhouse Vegetable Crops. Agronomy. 2020; 10(5):741. https://doi.org/10.3390/agronomy10050741
Chicago/Turabian StyleMartínez-Gaitán, Carolina, María Rosa Granados, María Dolores Fernández, Marisa Gallardo, and Rodney B. Thompson. 2020. "Recovery of 15N Labeled Nitrogen Fertilizer by Fertigated and Drip Irrigated Greenhouse Vegetable Crops" Agronomy 10, no. 5: 741. https://doi.org/10.3390/agronomy10050741
APA StyleMartínez-Gaitán, C., Granados, M. R., Fernández, M. D., Gallardo, M., & Thompson, R. B. (2020). Recovery of 15N Labeled Nitrogen Fertilizer by Fertigated and Drip Irrigated Greenhouse Vegetable Crops. Agronomy, 10(5), 741. https://doi.org/10.3390/agronomy10050741