Article

A Phenotypic Search on Graft Compatibility in Grapevine

1
Plant Cell Biotechnology Lab, Instituto de Tecnologia Química e Biológica António Xavier (Green-it Unit), Avenida da República, Estação Agronómica Nacional, 2780-157 Oeiras, Portugal
2
Max Planck Institut für Molekulare Pflanzenphysiologie, Wissenschaftspark Golm, Am Mühlenberg 1, 14476 Potsdam, Germany
3
Unidad de Hortofruticultura, Centro de Investigación y Tecnología Agroalimentaria de Aragón (CITA), Instituto Agroalimentario de Aragón-IA2 (CITA-Universidad de Zaragoza), Av. Montañana, 930, 50059 Zaragoza, Spain
4
InnovPlantProtect CoLab, Estrada de Gil Vaz Apartado 72, 7351-901 Elvas, Portugal
*
Author to whom correspondence should be addressed.
Agronomy 2020, 10(5), 706; https://doi.org/10.3390/agronomy10050706
Submission received: 19 April 2020 / Revised: 4 May 2020 / Accepted: 11 May 2020 / Published: 14 May 2020
(This article belongs to the Section Crop Breeding and Genetics)

Abstract

:
Grafting is the most used propagation method in viticulture and is the unique control strategy against Phylloxera. Nevertheless, its practice remains limited mainly due to inconsistent graft success and difficulties in predicting graft compatibility responses of proposed scion–rootstock combinations, slowing down the selection of elite rootstocks. Aiming to identify optimal phenotypic parameters related to graft (in)compatibility, we used four clones of two grapevine cultivars that show different compatibility behavior when grafted onto the same rootstock. Several physiological parameters, internal anatomy of the graft union, chlorophyll fluorescence, and pigment contents of homo- and heterografts were monitored in a nursery-grafting context. The measurements highlighted enhanced performance of the heterografts due to rooting difficulties of Vitis vinifera homografts. This suggests that in viticulture, homografts should only be used as compatibility controls regarding qualitative attributes. By observing the internal anatomy of the union, we found that grapevines might require longer times for graft healing than anticipated. While Affinity Coefficients were not informative to assess incompatibility, leaf chlorophyll concentration analysis proved to be a more sensitive indicator of stress than the analysis of chlorophyll fluorescence. Overall, we conclude that graft take correlated best with callus formation at the graft junction three weeks after grafting.

1. Introduction

Grafting is an ancient method for plant propagation and plant improvement. During recent decades, the use of grafting expanded to commercially propagate horticultural crops [1] and it is currently applied in orchards, greenhouses, and gardening. For grapevines, grafting represents the longest use of a biological control strategy ever applied, as it saved and keeps saving viticulture and the wine industry from the devastating effects of the soil-borne aphid Phylloxera (Daktulosphaira vitifoliae Fitch). Since American vines showed resistance to “Phylloxera”, Vitis vinifera scions started to be grafted onto American resistant rootstocks or their hybrids, and nowadays, more than 80% of all vineyards worldwide are composed of heterografted Vitis species [2]. Although the use of grafted crops is increasing, its practice remains limited mainly due to inconsistent graft success with variant scion and rootstock species [3]. It has been reported that 39% of bench grafted vines are deemed defective at the nursery [4]. Consequently, nurseries are frequently required to double the production of grafted vines to guarantee their contracts. Graft incompatibility can be defined as the failure to form a successful graft union between two plant parts when all other requirements, such as technique, timing, phytosanitary and environmental conditions are satisfied [5].
Both compatible and incompatible plants are defined in the graft research field in such that they can be grafted and form a vascular connection [6]. Nevertheless, incompatible grafted plants do not exhibit normal growth behavior and lifespans whereas compatible grafted plants demonstrate normal growth behavior. Measurements for the degree of (in)compatibility are often based on graft success rates or other sometimes not well defined physiological and morphological indicators. In general, compatibility measurements include indicators related to growth behavior and stress symptoms. All of these can be displayed immediately or delayed and in some cases, they can take as long as 20 years to manifest, as seen in conifers and oaks [7]. Although it is believed that the likelihood of graft success is higher when scion and rootstock are closely related or of the same species, graft compatibility between scion and rootstock can vary greatly even between related species and grapevine clones [5]. Inline, predictive and standardized measurements to evaluate compatibility levels would be useful for breeders when considering the use of a rootstock with a specific graft combination [3], particularly in the case of new genotypes under selection with unknown grafting properties [8,9,10]. Indeed, to release a new grapevine rootstock into the market, several traits need to be evaluated including “Phylloxera” and nematode resistance, salt and drought tolerance, and last but not least, graft compatibility with scion species need to be assessed [11].
Considering that grapevine breeding has generation cycles that may last 25 years [12], it is obvious how incompatibility could impede the effort of breeding programs, slowing-down the selection of elite genotypes. Despite the importance of grafting and high graft success rates for many crop plants and its unavoidability in grapevine propagation, surprisingly little is understood, even with over one hundred years of scientific research [3]. Intending to unveil graft biology and incompatibility, a number of reports exist on (i) the phenotypic traits and field performances of several graft combinations [13,14,15]; (ii) the anatomy of grafted grapevines [16,17]; (iii) the biochemistry of grapevine grafts with focus on phenolic compounds [18,19] and on isoenzymes [20]; (iv) the molecular aspects concerning the transcriptome of different graft combinations [5,21,22]; and (v) total protein profiles [20]. Although numerous detection methods have been employed, no simple indicator seems to accurately predict compatibility behavior of variant scion–rootstock combinations, which would be valuable to shorten breeding cycles and to limit the production losses of nurseries and growers.
To address the known limitations in graft success predictions, we evaluated several methods that have been described as predictive for graft (in)compatibility in different plant species. Aiming to screen for suitable indicators of successful grapevine grafts, we employed the rootstock Richter 110 (110R) that was reported to have different graft success rates when combined with clones of Touriga Nacional, one of the most important Portuguese cultivar [5,19], and of cv. Syrah [23]. In particular, Syrah clone 383, one of the most susceptible to the reported vine decline, is no longer available for the market [24]. To further address the parameters regarded as indicative for scion–rootstock incompatibility, we re-evaluated reported methods and monitored several physiological indicators at the early callusing stage, 3 weeks after grafting (21 DAG), and at the hardening stage, 5 months after grafting (152 DAG), of cv. Syrah and cv. Touriga Nacional grafted onto 110R rootstock, known to have a different degree of compatibility with these plants [5,18,19,23]. We compared also reported Affinity Coefficient calculations based on stem growth measurements as a measure for graft compatibility. Furthermore, we analyzed the internal anatomy of the graft union and the leaf chlorophyll and carotenoid content and chlorophyll fluorescence parameters serving as plant stress indicators.

2. Materials and Methods

2.1. Plant Material and Experimental Details

Cuttings of certified virus-free plants of four registered V. vinifera clones cv. “Syrah”, clone 383 and 470 (SY383 and SY470, ENTAV-INRA/FR clones) and cv. “Touriga National”, clone 21 and 112 (TN21 and TN112, ISA/PT and JBP/PT clones, respectively) and cuttings of the rootstock 110R (V. berlandieri X V. rupestris, JBP/PT clone) were used. Graft combinations were selected according to the incompatibility reported for SY383 grafted on 110R (SY383/110R) [18,23] and for TN112/110R [5,19]. One hundred grafts per combination were performed, as well as one hundred homografts (grafts of each genotype with themselves). All grafts were performed on 27 April 2018 by bench omega-grafting of dormant cuttings under commercial nursery conditions at the Plansel nursery located in Montemor-o-Novo, Portugal (291 m above sea level, 38°39′ N, and 8°13′ W). The nursery provided all plant material except SY383 cuttings which were collected from the Portuguese National Ampelografic Collection (PRT 051), INIA Dois Portos, INRB I.P. (Quinta da Almoinha). All procedures concerning the handling of plant material were carried out by the nursery under phytosanitary guidelines used for their commercial clients. Grafts were dipped in paraffin (containing 0.11% of Quinidol and 0.004% of 2,5-Dichlorobenzoic acid) and underwent 21 days of stratification (at 30 °C and 80%–90% relative humidity) to induce callusing at the graft interface. On 18 May 2018, the grafted plants were transferred to the field nursery in a randomized complete block design (RCBD) with 4 blocks (25 repetitions/block) for hardening under drip irrigation. The main climatic parameters for the field trial were monitored throughout the experiment (Figure S1) using daily meteorological data collected for Montemor-o-Novo at the Évora weather station, Portugal [25] (38°65′ N; 8°21 W; altitude: 247 m) for the period from 22 May to 1 October 2018.

2.2. Growth Parameters

Sprouting and rooting rates of the grafted plants were recorded at the end of the callusing stage—21 days after grafting (DAG) and at the hardening stage—152 DAG. The sprouting rate at 152 DAG is named “graft take” as, at this time point, sprouted grafts are considered successful. The two time points were chosen because callus formation is a prerequisite for a successful graft [7] and because 5 months is considered sufficient time to assess levels of incompatibility in the field [26]. Six biological repetitions per graft combination were randomly selected from each of the 4 blocks (n = 24) and the following growth parameters measured at 21 DAG: (i) Length of the main shoot (cm), (ii) root number, (iii) length of the major root (cm), (iv) stem diameters at the base of the sprouted shoot, at the graft union and 5 cm below the union (mm) and (v) score of callusing on a scale from 0 to 4 based on visual evaluation, where 0 = no callus, 1 = 25%, 2 = 50%, 3 = 75%, and 4 = 100% of callus formed around the graft union. At 152 DAG, the following data were collected on the survived grafts that were monitored at 21 DAG: (i) Length of the main shoot (cm), (ii) stem diameters 5 cm above and below the union (mm) and at the graft union. The stem diameters were measured with a digital compass (DigiMax, Swiss Precision, CA, USA).

2.3. Internal Characterization of the Union

At 152 DAG, the graft union of the same plants sampled for the growth parameters monitored, were longitudinally sectioned at the graft area. Anatomy on the surface of the union was recorded and evaluated for vascular continuity on both the right and the left part of the pith, adapting the method of Herrero [27]. According to this method, 5 categories (from A to E) were used for evaluation, where category A represents a perfect union in which the graft line is almost invisible. Category B shows few structural imperfections and/or slight discontinuities between wood and bark or cambial invaginations. Category C is characterized by bark discontinuities and D by wood discontinuities. Category E includes broken/unattached unions and/or unions with dead tissue in the proximity of the union line. Graft unions were scored as follows: unions showing at least one side scored as A or B categories (A/−, B/−) were considered compatible. C/C, C/D, C/E scored unions were considered intermediate while D/D, D/E, E/E unions were considered incompatible.

2.4. Affinity Coefficients (ACs)

The measured stem diameters at 152 DAG were used as data input on the four affinity coefficients (ACs) formulas developed by Branas, Perraudine, Spiegel-Roy and Lavee, and Onaran, which were already reviewed and applied in Vitis [14]. Below, the ACs formulae used in this work are listed:
Perraudine: good affinity when AC ≅ 12. If > 12, the rootstock is thicker.
AC = [C/A + (C + A)/2B] + 10AC
Branas: good affinity when AC ≅ 10. If > 10, the rootstock is thicker.
AC = [C/A × (C + A)/2B] × 10
Spiegel-Roy and Lavee: good affinity when AC ≅ 0.
AC = (C/A) − 1
Onaran: good affinity when AC ≅ 100.
AC = (C × 100)/A = %
where, A is scion diameter (mm), B is graft union diameter (mm), C is rootstock diameter (mm).

2.5. Chlorophyll Fluorescence and Pigments Content

Chlorophyll fluorescence parameters were measured at 152 DAG using the OS-30p+ Chlorophyll Fluorometer (Opti-Sciences, Hudson, NH, USA). After 20 min of dark adaptation, the first expanded leaf in 6 grafts/combination/block was measured according to the OJIP protocol described in the fluorometer’s manual. We ensured that a total of 6 measurements were recorded when fewer than 6 grafts had survived in a given block. Leaf samples for pigment quantification were the same as those used for chlorophyll fluorescence measurements. In total, 1.27 cm2 of leaf area was excised from the sampled leaf, submerged in 2 mL of 95% ethanol and stored at 4 °C for two weeks. Then, chlorophyll and carotenoids contents were determined using Ultraspec 4000 UV/Visible Spectrophotometer (Pharmacia Biotech, Piscataway, NJ, USA) according to the method of Lichtenthaler [28]. Pigments absorbances were measured between 0.3 and 0.85 [29]. In the case of absorbance values > 0.85, a dilution of the samples was made, and the dilution factor was considered in the quantification.

2.6. Statistical Analysis

Statistical analysis of the collected data for all graft combinations at each time point, except for the results from the internal characterization of the union, was performed in RStudio (RStudio Team, 2015. RStudio: Integrated Development for R. RStudio, Inc., Boston, MA, USA, http://www.rstudio.com/) by Kruskal–Wallis test and multiple comparisons of treatments, in the R-package “agricolae”, which uses the criterium Fisher’s least significant difference as a post hoc test [30]. For sprouting, graft take, and rooting rates a Fisher’s exact test was performed for all graft combinations at each time point. Pearson correlations were carried out between graft take rates and the parameters analyzed at 21 and 152 DAG. To compute the significant levels for Pearson correlation the “rcorr” function in the R-package “Hmisc” was used [31]. For visualization, the R package “corrplot” was used [32]. Data are shown as mean values of original data ± SE (standard error). Significant differences are reported at * p < 0.05, ** p < 0.01, *** p < 0.001.

3. Results

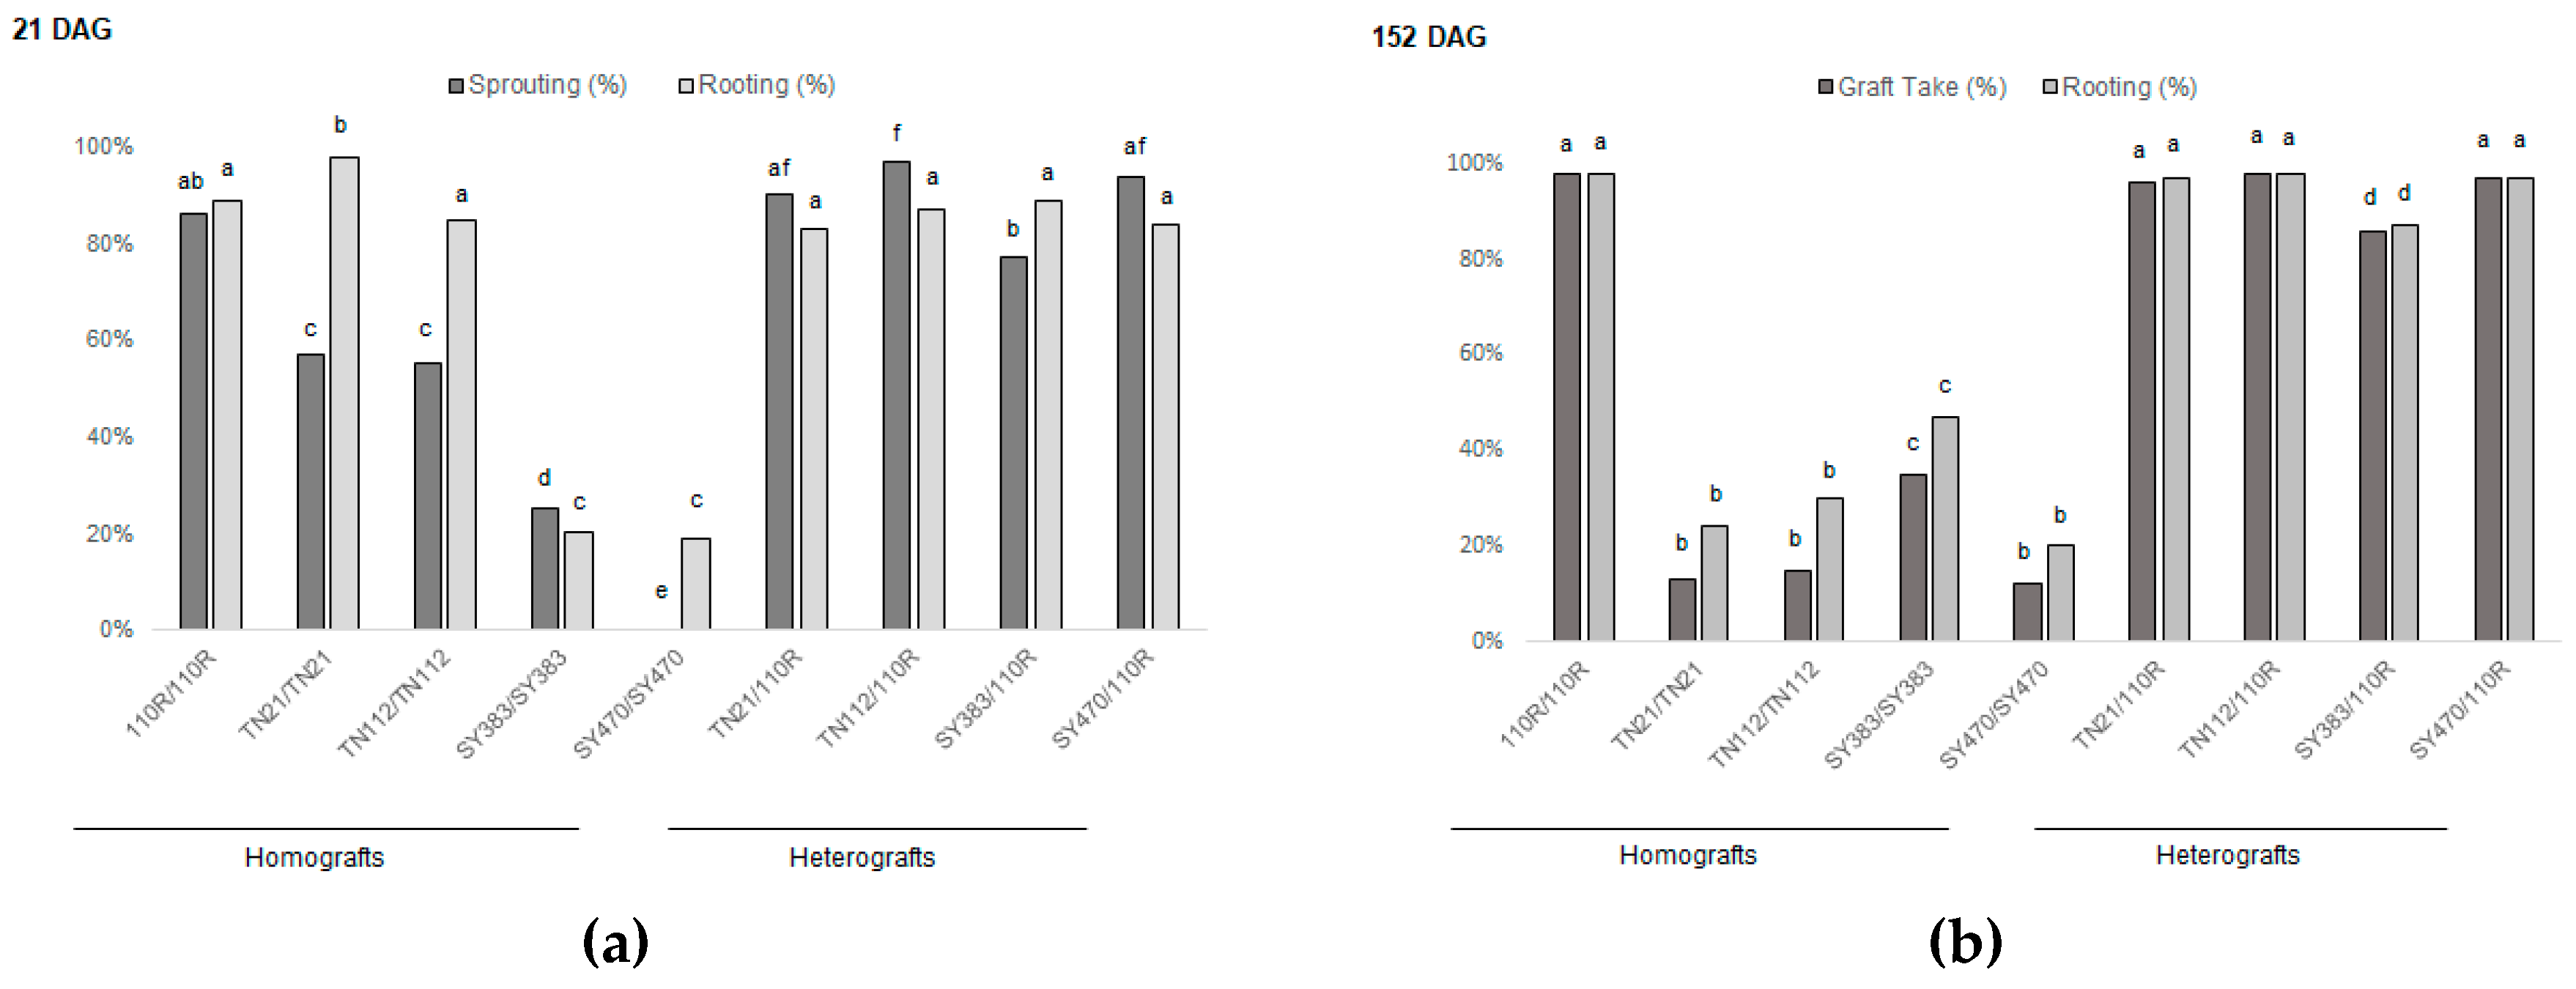
3.1. Grafting onto 110R Rootstock Leads to Higher Graft Take Rates

Several external symptoms have been associated with incompatible graft unions, including a high rate of graft take failures, leaves yellowing, early defoliation, a decline in the vegetative growth, marked differences in vigor and the seasonal biological clock, overgrowth of one of the partners or at the graft zone and the break of the union [7]. Our results showed that at 21 DAG a few homografts sprouted compared with their respective heterografts, suggesting that grafting onto 110R supports and induces early sprouting of the scion genotypes (Figure 1a), which is consistent with other studies [33,34].
Indeed, at 21 DAG, more than 80% of 110R homografts, approx. 50% of the Touriga Nacional homografts, and less than 25% of Syrah homografts sprouted, suggesting that 110R is an early sprouting genotype followed by Touriga Nacional and Syrah. Nevertheless, when Touriga Nacional and Syrah clones were grafted onto 110R, more than 90% of these heterografts sprouted at this time, while the sprouting rate of SY383/110R was just 77% (Figure 1a). At 152 DAG, graft take rates showed a marked difference between homo- and heterografts, which seems to depend on the 110R rootstock genotype rather than to the type of graft (homo- or heterograft). In line, the success of graft takes in V. vinifera homografts ranged from 13% (TN21/TN21) to 35% (SY383/SY383), whereas in heterografts, it ranged from 85% (SY383/110R) to 98% (TN112/110R). Among heterografts, just SY383/110R displayed a significantly lower graft take, while this was not observed for TN112/110R. Interestingly, the rootstock homograft (110R/110R) displayed a graft take success with 98 %, which is in the same order as detected with most heterografts (except SY383/110R) (Figure 1b). This led us to hypothesize that the low graft take of the V. vinifera homografts could be due to a lower rooting capacity of these genotypes in comparison with 110R, an American hybrid specifically selected to be used as rootstock [35]. Indeed, this hypothesis was supported by the Pearson correlation calculation between rooting and graft take at 152 DAG, indicating a correlation value of 0.89 (p < 0.05).
Concerning callus formation degree in the studied graft combinations, we detected a significantly higher callus formation in all heterografts (average grade of 4) when compared with the homografts (average grade of 3) (Table 1). Callus proliferation was expected not only because of the natural wound response but also because of the effect of 2,5-dichlorobenzoic acid added to the paraffin.
It is commonly thought that grapevine grafts will develop their final root system only when plotted in a field. However, the development of adventitious roots can be observed already at 21 DAG and might be indicative of the rooting capacity of the genotypes under study. Indeed, while the individual graft combination had a strong effect, the type of graft (homo- or heterograft) did not produce a statistically significant difference in root development at 21 DAG. The only significantly lower rooting performance was detected with Syrah homografts compared to all other combinations. Here the mean values were below 1 for SY383/SY383 and SY470/SY470 combinations with 0.5 ± 0.2 and 0.8 ± 0.3, respectively (Table 1). Nevertheless, no differences were detected comparing Syrah scions heterografts with other heterografts suggesting that the scion does not influence the rooting ability of the rootstock indicating that this is an autonomous trait of the rootstock.
The length of the main scion shoot depended on the graft type at both 21 and 152 DAG and suggests an influence of the used rootstock on scion’s growth. At 21 DAG, homografts displayed a significantly lower shoot length than heterografts (i.e., 1.5 vs. 3.2 cm) (Table 1). This difference is in accordance with the observed delayed sprouting of homografts. Interestingly, the situation inverted at 152 DAG, with the homografts displaying a significantly higher shoot length than heterografts (i.e., 97 vs. 72 cm) (Table 1). This suggests that the expansion growth rate of homografts was higher than that of heterografts, which is consistent with reports from other studies [36].
With respect to the stem diameters evaluated, a significant difference was detected between all different graft combinations above, below, and at the graft union at both time points (Table 2).
At 21 DAG, all heterografts showed larger stem diameters than homografts in all sections measured (i.e., 3.5 vs. 1.5 mm above the union; 13.8 vs. 11.6 mm at the graft union; and 9.6 vs. 9.1 mm below the union) (Table 2). Interestingly, the situation was different at 152 DAG, since homografts displayed larger stem diameters than heterografts above the union (7.2 vs. 5.7 mm) and below (12 vs. 10.2 mm). Notably, all heterografts showed significantly increased stem diameters (18.2 mm) compared with homografts (17 mm) at the graft union. Over time, the stem diameter growth of the homografts was 2.5 times greater than in heterografts above the graft union (i.e., 5.9 mm increase in homografts vs. 2.2 mm increase in heterografts) (Figure S2). Below the union, the increase was four times greater in the homografts compared to the heterografts (3 mm vs. 0.7 mm, respectively). However, heterografts showed a similar stem diameter growth to that of homografts at the graft interface (4.4 mm vs. 5.3 mm, respectively) (Figure S2).

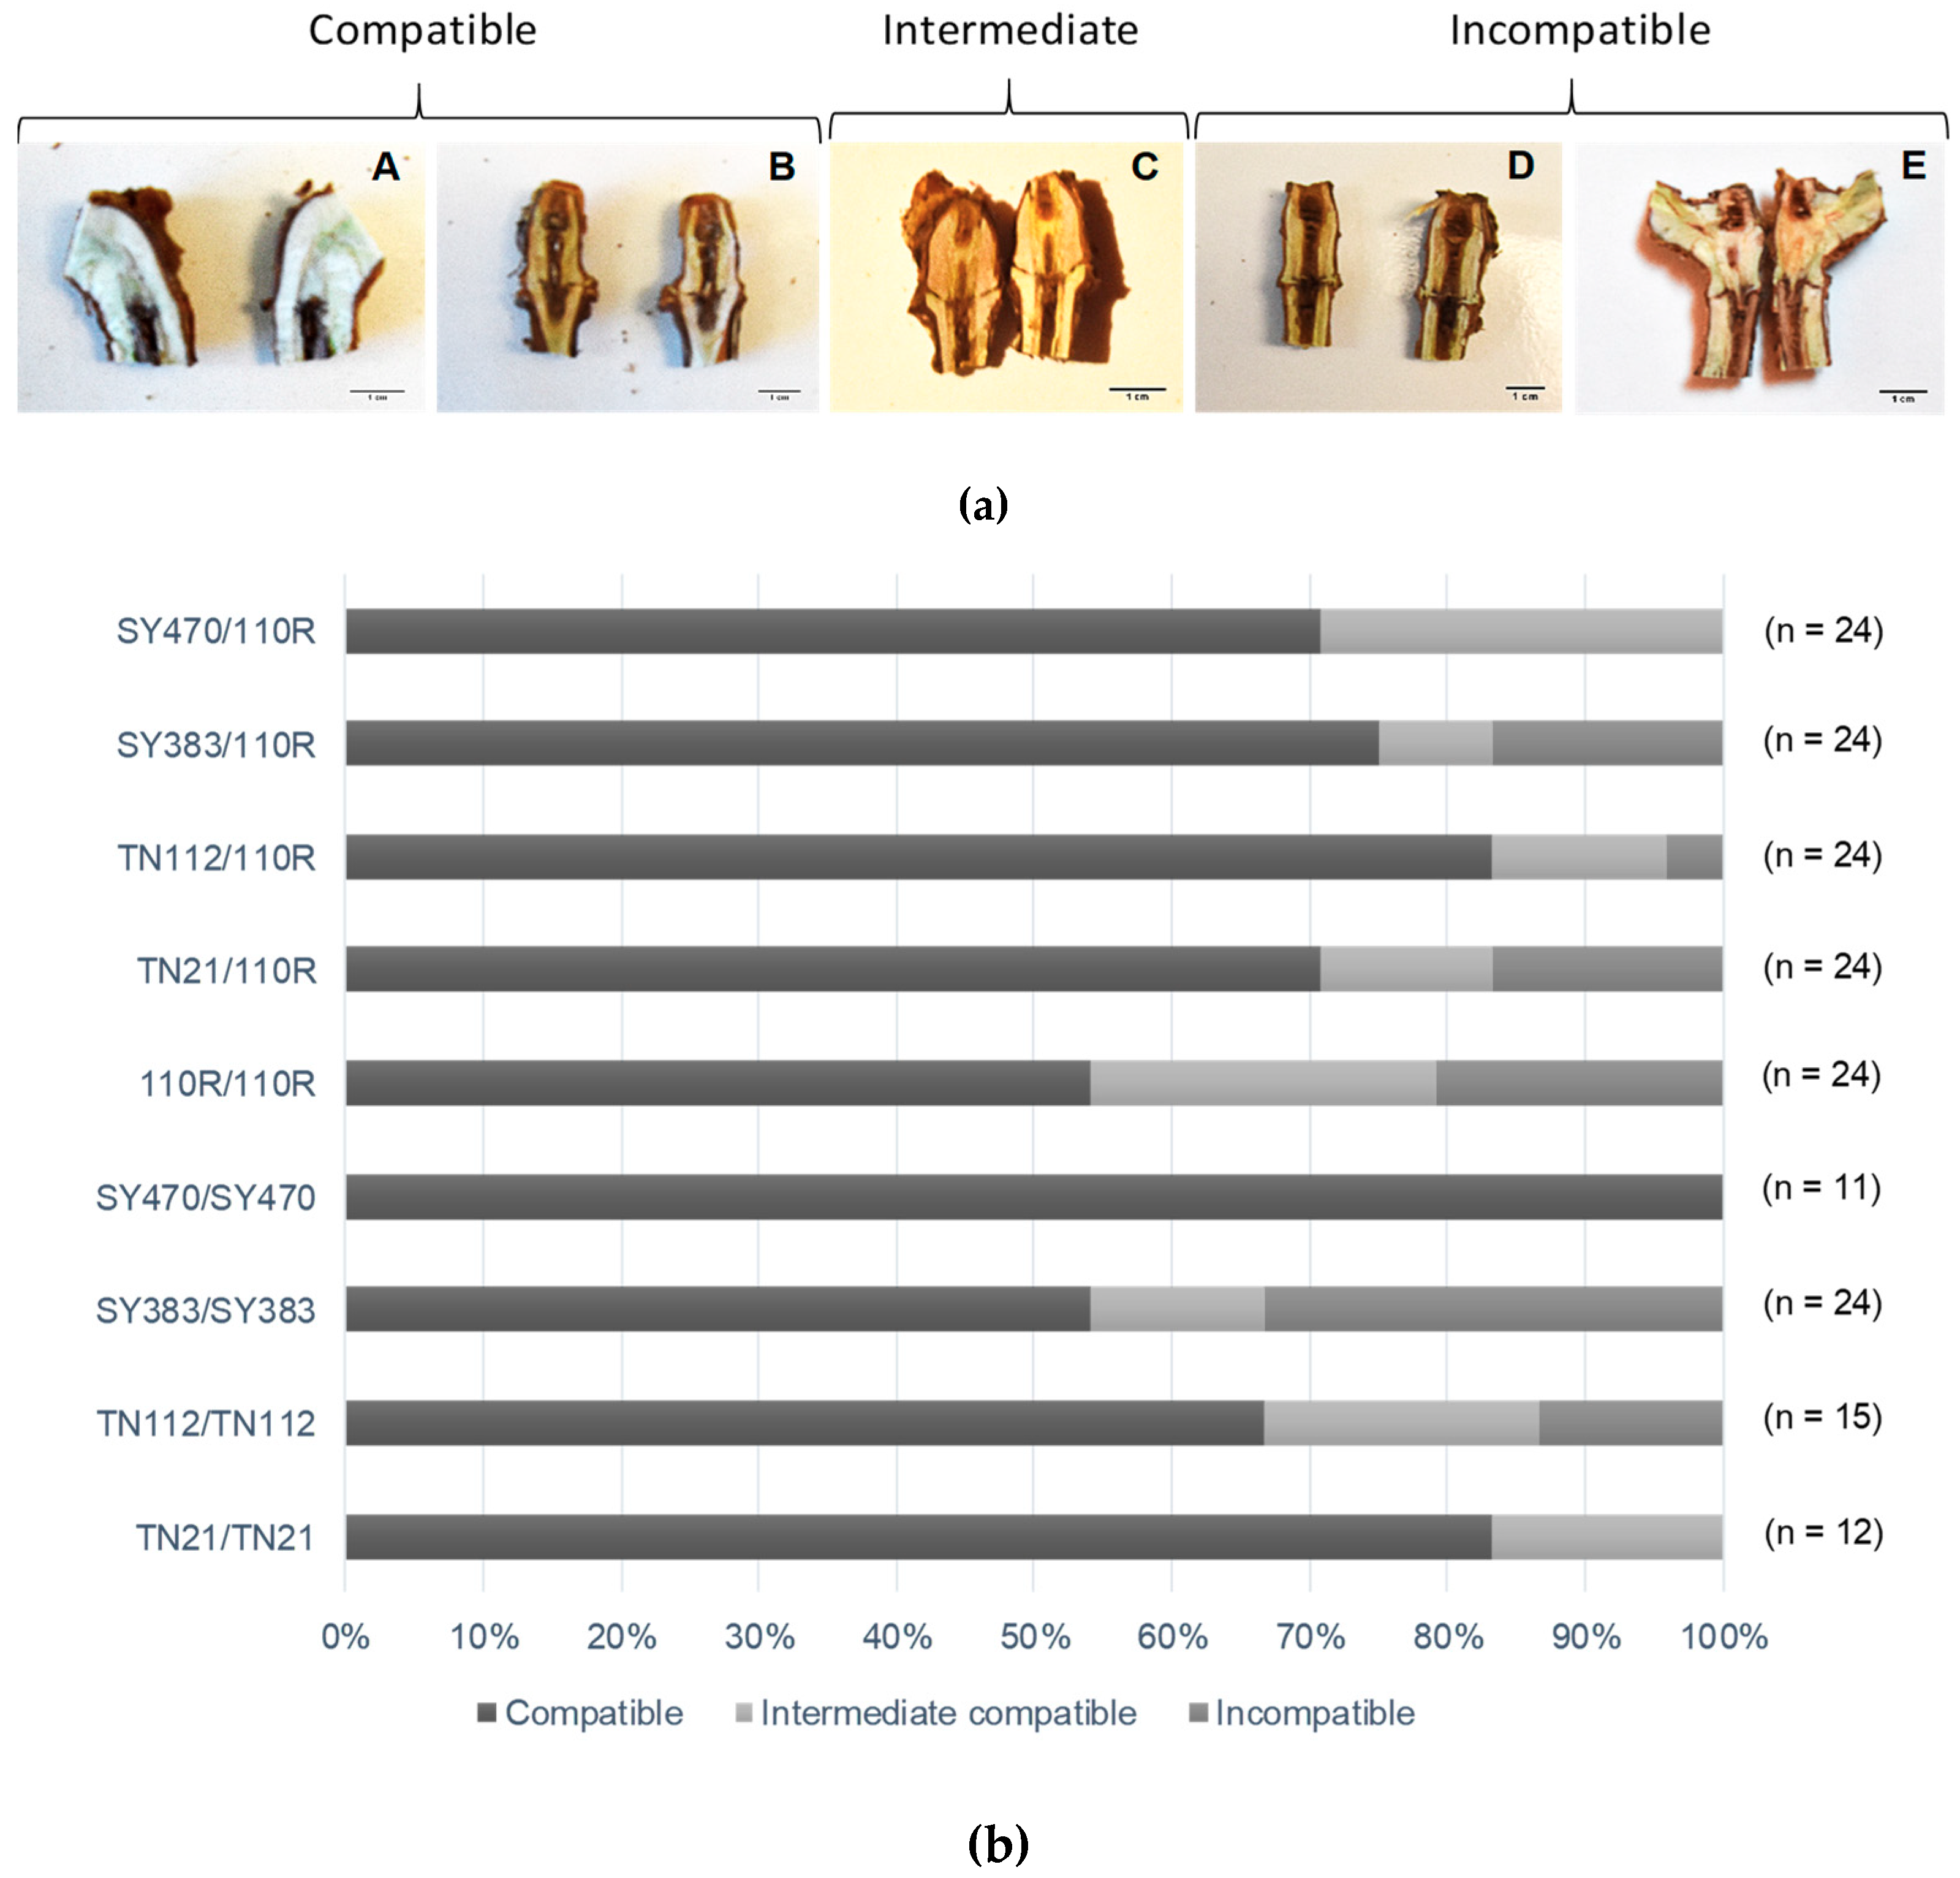
3.2. Graft Unions Are Frequently Incomplete at Five Months after Grafting

Anatomic studies are frequently performed to assess graft success in cherry [37], peach [38], apricot [36], pear, and quince [39]. In grapevine, grafting anatomy has also been investigated, mainly by non-destructive methods such as X-ray tomography and MRI [16,17]. Nevertheless, the five graft categories (A, B, C, D, and E) established by Herrero (1951), with “A” showing a perfect union and “E” showing unattached unions and/or unions with death tissue [27] have not been applied to Vitis so far (Figure 2a).
Using this approach, just SY470 homografts scored as compatible for all replicates. TN21/TN21 and SY470/110R graft unions scored as compatible and intermediate, while the unions of all the other graft combinations displayed all three classes from compatible unions to intermediate compatible and incompatible unions (Figure 2b). Thus, using this categorization, the most compatible combinations were SY470 and TN21 homografts, and TN112/110R heterografts, with 100%, 83%, and 83% of compatibility, respectively. On the other side, the graft combinations with a high degree of incompatibility were SY383 and 110R homografts (33% and 21% respectively), and TN21/110R and SY383/110R heterografts both with 17% of incompatible unions. Given that homografting should result in the highest graft compatibility value as the growth rate and vasculature pattern should be equal between rootstock and scion, it is surprising that there is enormous variability within the combinations, regardless of whether they are homo- or heterografts. Additionally, bark (category C) and wood (category D) discontinuities in the graft zone were frequently observed. These findings suggested that grafted grapevines might require long times to complete the healing of a union.

3.3. Affinity Coefficients (ACs) Calculated for the Same Graft Combination Vary According to the Formula Used

Looking for the early determinants of long-term graft success of different graft combinations, several AC formulas based solely on stem diameter measurements of scion and rootstock have been proposed and applied in vineyards [14,16] and orchards [40], since growth differences above and below the graft union are regarded as a sign of incompatibility [14].
ACs calculated using the Parraudine formula indicated good compatibility for all analyzed combinations, since all calculated values were close to 12 (Table S1). ACs calculated using Branas’ formula identified 110R and SY383 homografts as the more compatible combinations, while TN112/TN112 and SY470/110R were the combinations with the worse calculated affinity since their coefficients were far from the ideal value (10). Using Branas’ coefficient, significant differences were found among graft combinations and also between graft type, suggesting homografts as more compatible than heterografts (Table S1). No statistical significant difference was detected between homo- and heterografts when the formula of Parraudine, Spiegel-Roy and Lavee, and of Onaran were used, although differences were detected among graft combinations (Table S1). In summary, the ACs calculated for the same graft combination vary according to the formula used, and they are not reliable indicators of graft (in)compatibility for the used graft combinations.

3.4. Chlorophylls Analysis Is a More Sensitive Indicator of Stress than the Analysis of Chlorophyll Fluorescence

In this study, chlorophyll fluorescence parameters, fast chlorophyll fluorescence induction curve (OJIP curve), and the quantification of leaf pigments were tested to screen the graft combinations for their compatibility behavior. The main chlorophyll fluorescence parameters investigated were: Vj (variable fluorescence at the J step), PI (Performance Index), Fv/Fm and Fv/Fo (maximum quantum yield of photosystem II–PSII). Nevertheless, no significant differences were detected for any of the parameters, with the exception of Fv/Fo, for which a significant difference (p < 0.01) was found for SY470 homografts compared with 110R and SY383 homografts (data not shown). This combination stood out by having the lowest values of the maximum quantum efficiency of PSII (Fv/Fm = 0.72) and, in particular, a significantly lower Fv/Fo (2.74). Fv/Fo is considered a more sensitive parameter for plant stress, capable of amplifying small variations detected by Fv/Fm, since it is normalized over the minimal fluorescence (Fo) [41]. The optimal Fv/Fm value for stress-free plants is around 0.83 [42]. In our study, Fv/Fm values for all graft combinations varied from 0.72 to 0.77, suggesting that all graft combinations were subjected to stress at the moment of the measurements. It has been shown that some types of plant stress affect specific parts of the OJIP curve. For example, severe nitrogen stress displays a K strep at 300 µs [43]. To investigate whether grafting and/or incompatibility could have a similar effect, OJIP curves for all graft combinations were plotted. Nevertheless, the transients were almost overlapping, denoting that homografts’ OJIP curve does not differ from heterografts’ and no unusual step was observed on the OJIP traces (Figure S3) suggesting that, in our study, OJIP curves of grafted grapevines are not affected by the graft combination.
Methods to quantify chlorophylls in plants are used to estimate the effect of different stress factors on the efficiency of photosynthesis [44]. Furthermore, it was proposed that measurements of chlorophyll concentrations in scion leaves allow the identification of graft incompatibility in Prunus species [38]. To evaluate this on Vitis grafts, we measured chlorophyll a (Chl(a)), b (Chl(b)), total (Chl(a+b)), and carotenoids (Carot) concentrations in leaves formed on scions of the different graft combinations. The ratios Chl(a)/Chl(b) and Chl(a+b)/Carot were also calculated. In TN21, TN112, SY470 homografts and in SY470/110R heterografted plants, the detected Chl(a) concentrations were lower than in the other graft combinations. The same homografts also displayed a lower amount of Chl(b) and overall, homografts are significantly less enriched in Chl(b) than heterografts (Table 3).
With exception of SY383 genotypes showing no changes in chlorophyll content regardless of the rootstock, it seems that grafting onto 110R leads to higher amounts of Chl(a) and Chl(b) in the scion when compared with the respective homografts (Table 3). Although this effect is only significant for Chl(b), this implies increased root uptake and/or translocation of nitrogen or other micronutrients across the graft junction in plants grafted onto 110R rootstock. The decreased contents in both Chl(a) and Chl(b) in the SY470 homografts (Table 3) could also explain the detected reduced quantum yield of PSII in these plants. Indeed, a reduction in the quantum yield of PSII is generally associated with the stress-induced degradation of chlorophylls, which has been partially attributed to the sensitivity of the membranes to oxidative stress [41].
Carotenoids, necessary for photoprotection in photosynthesis, play an important role as precursors of signaling during plant development under abiotic/biotic stress [45]. However, no differences were detected in carotenoids contents with respect to the graft combinations (Table 3). Therefore, the statistical differences found among graft combinations for the Chl(a+b)/Carot ratio are more likely related to the differences in chlorophyll content. The analysis of pigment contents in leaves seems a more sensitive indicator of stress than the analysis of chlorophyll fluorescence, even if just Chl(b) contents were differentiating homo- from heterografts.

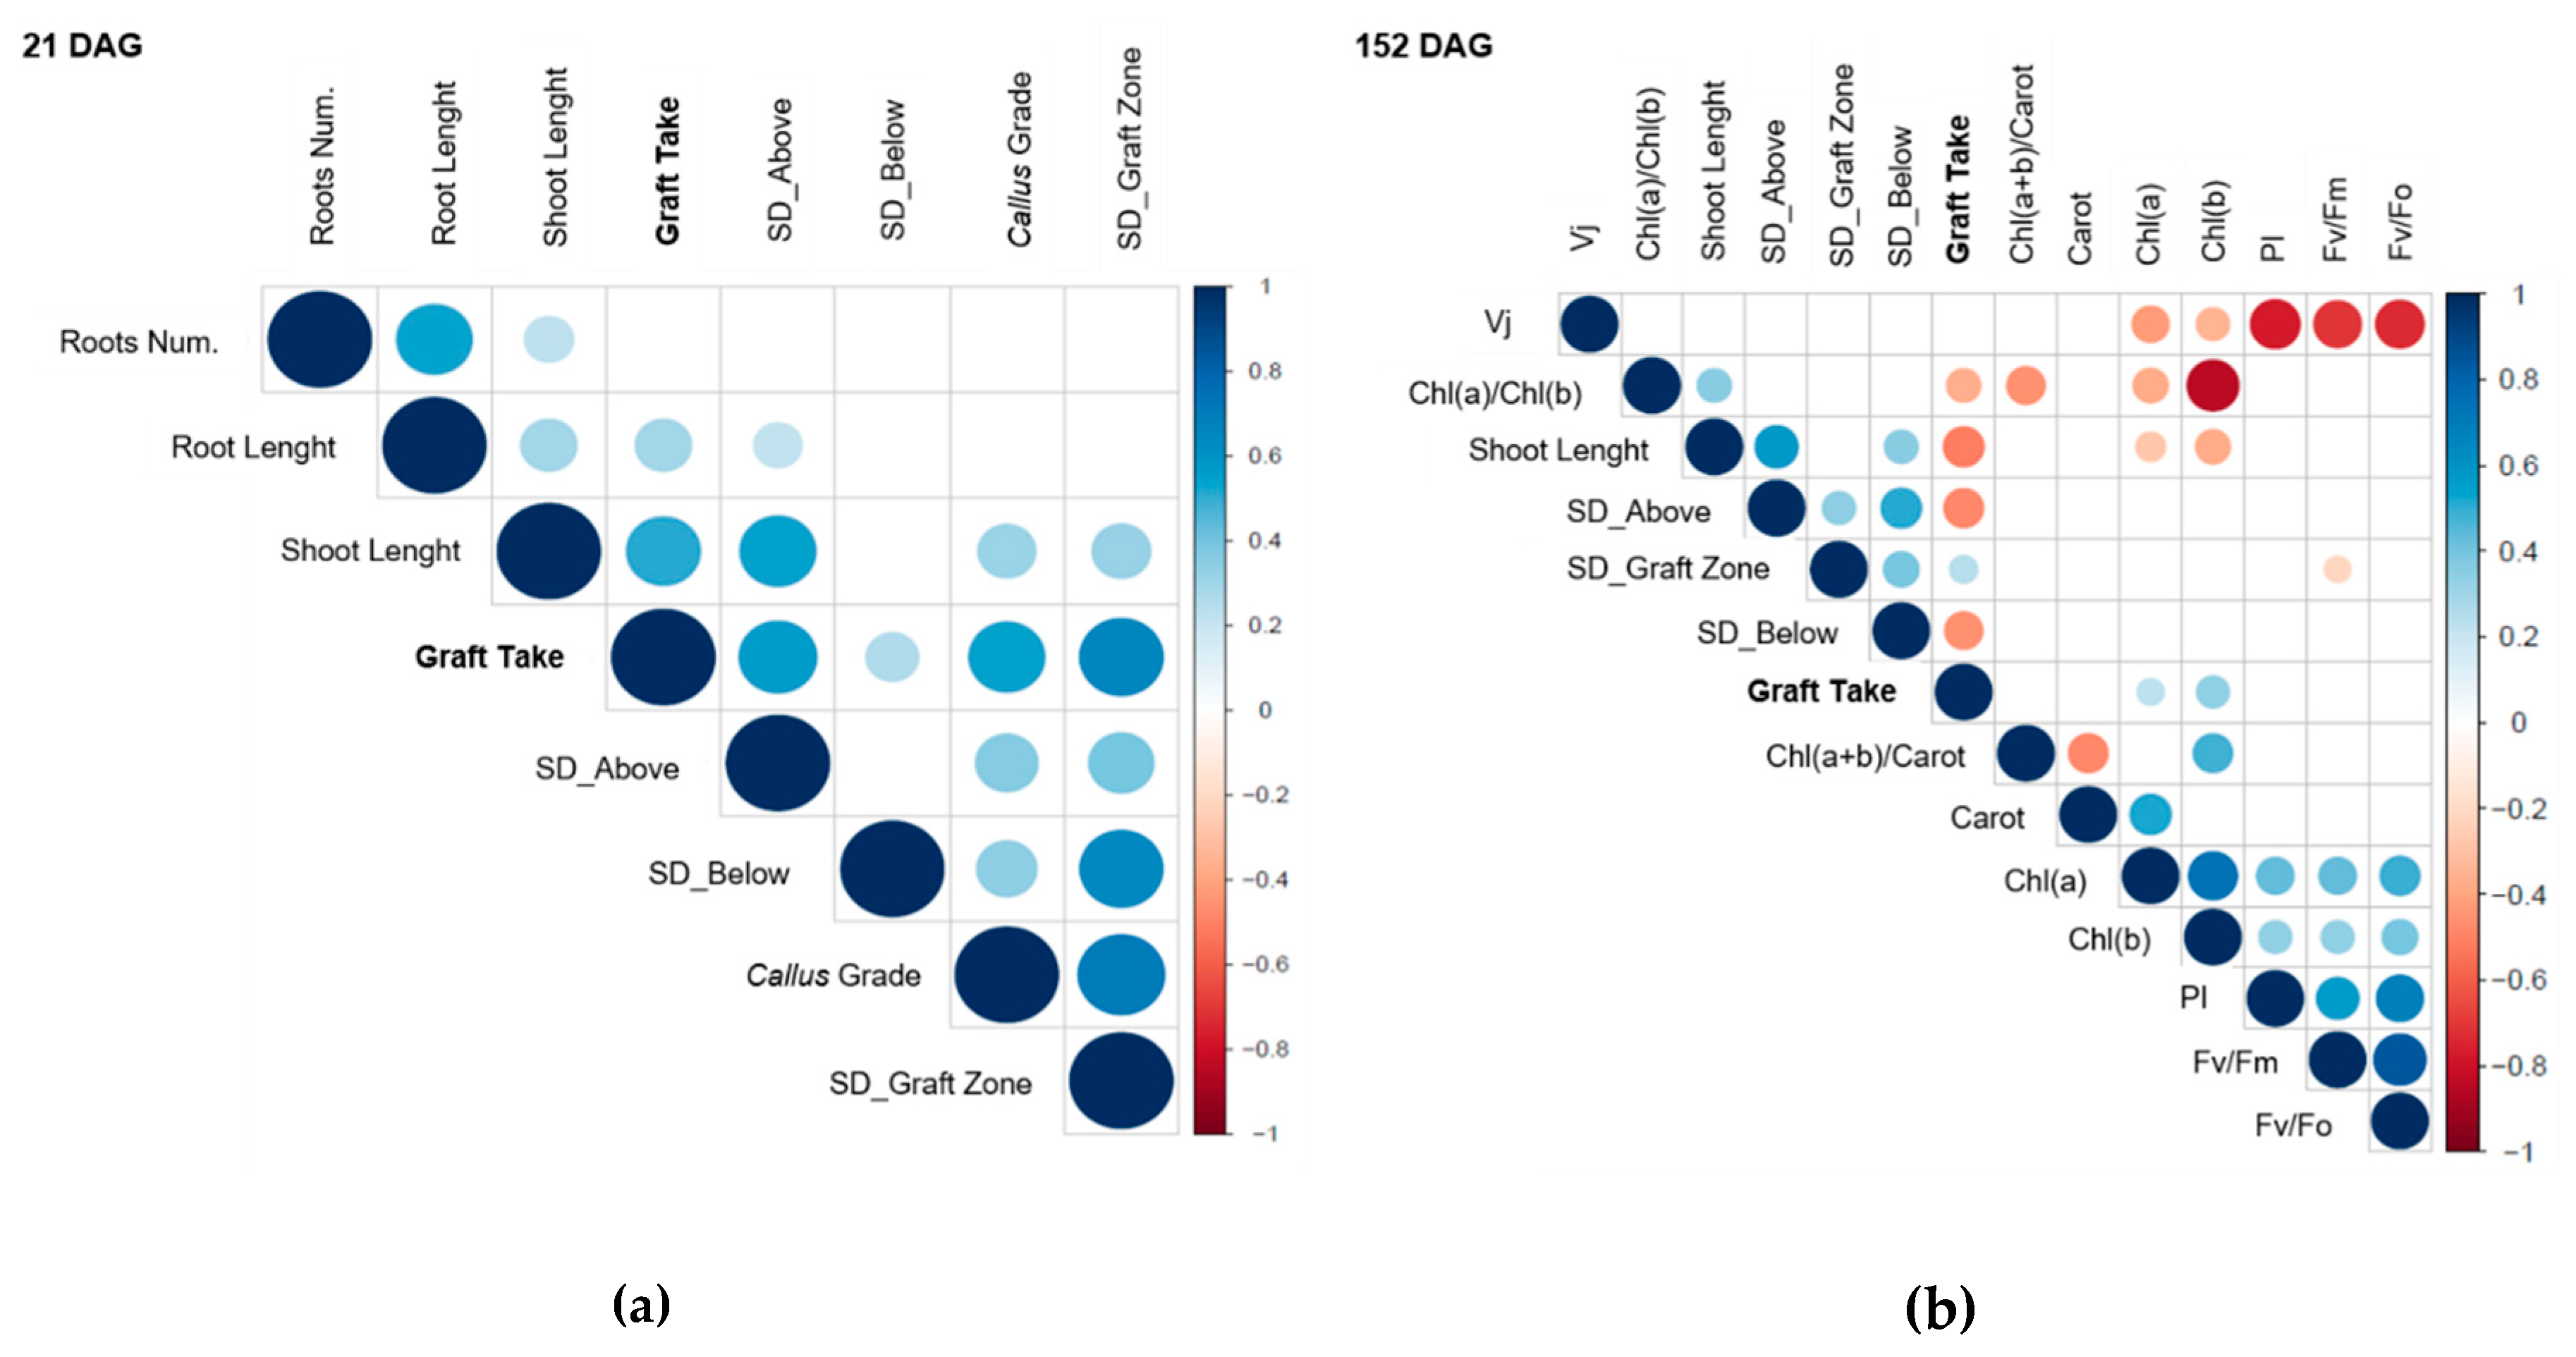
3.5. Graft Take Correlates with Callus Formation and with the Improvement of Scion–Rootstock Translocation

We next performed a statistical correlation analysis with respect to the graft take rates on the parameters recorded at 21 DAG and 152 DAG. Figure 3a shows that root and shoot length, the measurements of stem diameters, and the degree of callus development were all positively correlated with graft take at 21 DAG. However, root length and the stem diameter below the union displayed low correlation coefficients (r ≤ 0.3), while the highest correlations were obtained for stem diameter at the graft zone and above the union, the degree of callus development and shoot length (r = 0.65, 0.57, 0.54, and 0.52, respectively). Considering that the measurements of stem diameters above the unions were done only on sprouted scions at 21 DAG and that stem diameters at the graft zone increased with the degree of callusing, we conclude that overall graft take correlated best with scion growth and with the proliferation of callus tissue around the union.
Given that many grafts fail before scion sprouting, it is clear why shoot growth positively correlated with graft take at 21 DAG. Nevertheless, shoot length negatively correlated (r = −0.51) with graft take at 152 DAG (Figure 3b), with the stem diameters above and below the union (r = −0.49 and r = −0.45 respectively), and with the Chl(a)/Chl(b) ratio (r = −0.36). Positive correlations with graft take at 152 DAG were found for the stem diameters at the graft zone and Chl(a) and Chl(b) contents, although only the Chl(b) content disclosed a correlation coefficient higher than 0.3 (Figure 3b). Interestingly, correlation coefficients with graft take rates measured at 152 DAG seem higher at 21 DAG than at 152 DAG, suggesting that early predictions do not necessarily imply low confidence of the prediction.

4. Discussion

Much effort has been dedicated to the search of physiological [11,17], metabolic [18,19,46], and molecular [5,21,22] markers to predict in an early growth stage graft compatibility in grapevine with the aim of improving rootstock selection and propagation. To reveal grafting-related physiological symptoms that might enable nurseries to predict whether a graft combination is likely to succeed, we applied several methods at two time points (21 DAG and 152 DAG) to score graft compatibility of graft combinations known to show distinct compatibility behavior [5,18,19,23]. Surprisingly, at 5 months after grafting (152 DAG), graft take rates did not match our expectations since V. vinifera homografts had lower graft take rates than heterografts. Notably, the rootstock homograft (110R/110R) performed as well as heterografts that have the 110R rootstock. We noticed a correlation of the 110R rooting ability with graft success, which might explain the low take rates detected with the V. vinifera homografts (<40%). Here, it should be noted that all grafted plants were cultivated at the same field lot over the same growth period. Thus, we can exclude exogenous factors such as soil quality or local stresses. In addition, it can be excluded that insufficient water supply could have impacted the root formation as all grafted plants were grown under drip irrigation. Considering that exogenous factors were similar to all grafted plants and that we found a significant correlation between used rootstock and the rooting capacity of heterografts, we encourage the use of homografts as compatibility controls in viticulture just for studying qualitative attributes and not to quantify graft success.
It is widely known that rootstocks are selected for rooting and grafting capacity, abiotic and biotic stress tolerance, and their ability to impact the phenotype of the grafting scion [47]. In this work, 110R rootstock anticipates the sprouting of the heterografted scion and exerts control over scion growth. It is conceivable that the early dormancy break of the rootstock (110R) is responsible for the increased heterograft scion bud burst response. In our study, cuttings with only one bud were grafted onto the rootstock, implying dependence of bud break on rootstock reserves. Thus, it seems that the sooner the rootstock will break dormancy, activating carbon supply for the scion, the sooner they may sprout. The analysis of the internal anatomy of the graft union led us to realize that graft healing is not yet complete at five months after grafting. Milien et al. (2012) [17] compared the anatomy of “good“ and “bad” grafts eight months after grafting and observed that the omega-cut line was visible in both graft types and that, on “bad” grafts, connectivity was incomplete and necrotic tissue was present at the graft junction. The inspection of grapevine graft unions through MRI also revealed areas in the graft zone with no vascular connection even in 2 years-old grafts [16]. Our results are in agreement with other studies on woody species, in which graft incompatibility may not become apparent for several years [3]. Thus, graft (in-)compatibility studies in grapevines should include later time points than five months after grafting.
Concerning the methods applied to predict graft compatibility, several AC formulas based solely on stem diameter measurements of scion and rootstock have been proposed and applied in vineyards [14,16] and orchards [40], since growth differences above and below the graft union are regarded as a sign of incompatibility [14]. Nevertheless, in this work, the ACs were not suitable predictors to assess graft incompatibility levels of the used graft combinations as they resulted in contradicting conclusions.
An alternative approach is the use of methods to quantify chlorophylls in plants as an indicator of the effect of different stress factors on the efficiency of photosynthesis [44]. Grafting causes stress to the grafting partners, since the mechanical wound results in localized cell death, loss of water, solutes, and disruption of the vascular system [3]. Repair of graft junctions, callus formation, and lack of vascular continuity imply a high metabolic demand that has to be sustained by the photosynthetic activity of the scion [3]. Light energy absorbed by chlorophyll drives photosynthesis (photochemistry) but is also re-emitted (fluorescence) and dissipated by heat. Since these processes compete with each other, the yield of chlorophyll fluorescence gives information on the quantum efficiency of photochemistry [48]. For this reason, chlorophyll fluorescence imaging and the determination of leaf chlorophyll concentrations using the Soil Plant Analysis Development (SPAD) can be early diagnosis tools of graft incompatibility [38,49]. Notably, we found chlorophyll concentration measurements a more sensitive parameter to identify changes between different graft combinations than the measurements of chlorophyll fluorescence.
Overall, homografts were found less enriched in leaf chlorophylls than heterografts, although just Chl(b) was significantly different. The fact that both types of chlorophylls are reduced in the same graft combinations suggests that Chl(b) is not converted into Chl(a) in the context of the Chl(b)-to-Chl(a) pathway [50]. Rather, it might be indicative of a reduced root-to-shoot translocation of water and soil nutrients, particularly of nitrogen, since chlorophyll is one of the most important points of its accumulation [44]. Nevertheless, many mineral deficiencies are also known to produce specific pigment distribution within the same plant [51] and the selective mineral uptake of different rootstocks [8] might be equally implicated. Furthermore, a decrease in chlorophylls content is a common phenomenon under drought stress, and it is frequently associated to an increase in Chl(a)/Chl(b) ratio since the reduction of Chl(b) is greater than that of Chl(a) under drought stress [45]. Although, this is consistent with our results, since the graft combinations with the lowest values of chlorophylls (i.e., TN21, TN112, SY470 homografts and SY470/110R heterografts) also displayed the highest values of Chl(a)/Chl(b) ratio.
The growth parameters that best correlated with graft take rates were shoot length and the degree of callusing at 21 DAG, and a higher Chl(b) content and a lower swelling above and below the union at 152 DAG. As anticipated, this might imply that graft success correlates with the improvement of the scion–rootstock translocation via vasculature. However, it should be noted that positive correlations between graft take and scion growth at 21 DAG must be carefully evaluated, since grapevine scion sprouting relies on rootstock reserves. Excessive scion growth would deplete metabolite reserves before a functional root system can be established, which taken together would lead to a graft failure due to plant death.
The formation of a callus bridge between the grafted plant parts represents the beginning of the connectivity leading to the formation of a continuous vasculature between the grafting partners [3] and is suspected of predetermining the future compatibility or incompatibility response [52]. Additionally, callus formation is considered a prerequisite for the development of a successful graft junction [7]. Accordingly, the degree of callus formation was suggested as a valuable indicator of good graft take in grapevines [13,33]. Our results confirmed the reported positive correlations between the degree of callusing and the success of grafting in grapevines. Therefore, considering that grapevine grafts undergo callusing during a relatively short period (21 days), allowing only grafts with well-developed callus to proceed to the further hardening stage might be already of economic advantage at a nursery perspective.
Scion and rootstock stem diameters are frequently monitored in field studies to aid the assessment of compatibility levels as a measure of graft success [13,34,36]. Although the swellings often develop above unions with vascular discontinuities, it also can simply appear because of differences in relative scion and rootstocks’ growth rates [53]. Therefore, stem swelling of one of the grafting partners is not a reliable indicator of graft incompatibility in other species according to Hartman et al. (2011) [7]. Nevertheless, in this study, stem diameter correlation coefficients with graft take at both time points are among the highest ones and stem swelling above and/or below the graft union was suggested to lead to decreased water and nutrient flow through the union causing wilting [54]. Furthermore, swelling of the scion has been associated with a blockage of carbohydrates at the graft zone and with phloem degeneration [54]. Recently, it was reported that narrow stem size in Vitis rootstocks imposes a morphological constraint on the scion via reduced annual vascular formation reflected by the annual ring size, which consequently leads to reduced hydraulic conductivity, limiting physiological performance and yield [55] and, consequently, to limited shoot growth. Whether this would explain the association between incompatibility and the increase in one of the partners’ stem diameters still need to be investigated.
Comparison between homo- and heterografted plants with graft take success can be valuable to understand scion–rootstock interactions during graft formation. Our results pointed out a crucial role of the rootstock genotype in the vegetative growth and the Chl(b) content of the scion, although scions did not seem to influence the rooting ability of the rootstock. Heterografts exhibited a higher graft take rate, better callus development, and enrichment in Chl(b), which could be explained either by an increased root uptake rate or by a higher healing capacity of the graft union. Nevertheless, the internal anatomy of the union does not support the hypothesis that the healing of heterografts’ unions plays a role. In addition, the fact that scion growth was reduced in heterografts does not fit to an increased root-to-shoot translocation in these plants. Moreover, the detected rootstock effect on scion bud burst suggests that scion–rootstock communication takes place as soon as callus is formed between the partners and that this communication is able to impose developmental decisions and growth habits on the scion. Overall, it seems that the quality, rather than the quantity, of the scion–rootstock translocation system, is responsible for the detected alterations in plant performance when a different rootstock genotype is used. Finally, the correlations analysis between all these traits may reduce the number of parameters and plants needed to be screened for graft compatibility, which might be of interest for breeders considering the high number of graft replicates needed to assess each combination between different rootstocks and new cultivars from different breeding programs.

5. Conclusions

Standardized methods to detect graft incompatible grapevine combinations at early stages would be very valuable to improve rootstock breeding and nurseries selection. Nevertheless, phenotyping incompatibility in woody species is a challenge, since compatibility symptoms are often difficult to discriminate from the effect of environmental stresses and often unpredictably arise early or very late after grafting. By applying several methods described as indicative of incompatibility in several crops on grapevine grafts with known compatibility behavior, we found that graft take rates are not always indicative of compatibility and therefore they are not per se sufficient to assess compatibility levels in viticulture, where graft success is also dependent on the rooting ability of the rootstock. Moreover, the use of homograft compatibility controls should be carefully evaluated, as they did not show the highest graft take rates. Among the parameters investigated, the grade of callus development at 21 DAG as an indicator of graft success, might be most valuable for practical nursery’s applications. We encourage the analysis of leaf chlorophyll contents rather than the use of chlorophyll fluorescence measurements. Conversely, we discourage the use of Affinity Coefficients based on stem diameters, although stem diameters were found to strongly correlate with graft success, which could be misleading as swelling is also associated with incompatibility of grafts. In summary, our measurements and assessment of predictive graft success parameters might be useful for both researchers and breeders for evaluating graft (in)compatibilities.

Supplementary Materials

The following are available online at https://www.mdpi.com/2073-4395/10/5/706/s1. Figure S1: Time course of main climatic parameters (daily means) in the field trial throughout the experiment (May–September 2018). Figure S2: Mean values of Stem Diameter (SD) expansion from 21 to 152 DAG. Table S1: Mean values of the affinity coefficients calculated by the formulas of Parraudine, Branas, Spiegel-Roy and Lavee, and Onaran. Figure S3: OJIP curves of homo- and heterografts.

Author Contributions

Conceptualization, writing—review and editing S.T. supported by F.K., A.P., and P.F.; data curation S.T., A.P. and F.K.; project administration, resources P.F.; methodology S.T. and F.K. All authors have read and agreed to the published version of the manuscript.

Funding

This research was funded by Fundação para a Ciência e Tecnologia (FCT) for the Ph.D. grant with the reference PD/BD/128399/2017. The authors acknowledge the research unit GREEN-it “Bioresources for Sustainability” (UID/Multi/04551/2013).

Acknowledgments

The authors thank Jose Valadas and João Carvalho from Plansel Nursery for the acquisition and management of the plants. José Eduardo Eiras Dias, Jorge Cunha and João Brazão from the National Institute for Agricultural and Veterinary Research (INIAV-Dois Portos) for the provision of SY383 cuttings.

Conflicts of Interest

The authors declare no conflict of interest.

References

  1. Lee, J.; Kubota, C.; Tsao, S.J.; Bie, Z.; Echevarria, P.H.; Morra, L.; Oda, M. Scientia horticulturae current status of vegetable grafting: Diffusion, grafting techniques, automation. Sci. Hortic. (Amst.) 2010, 127, 93–105. [Google Scholar] [CrossRef]
  2. Ollat, N.; Bordenave, L.; Tandonnet, J.P.; Boursiquot, J.M.; Marguerit, E. Grapevine rootstocks: Origins and perspectives. Acta Hortic. 2016, 1136, 11–22. [Google Scholar] [CrossRef]
  3. Pina, A.; Cookson, S.; Calatayud, A.; Trinchera, A.; Errea, P. Chapter 5—Physiological and molecular mechanisms underlying graft compatibility. In Vegetable Grafting Principles and Practices; Colla, G., Perez-Alfocea, F., Schwarz, D., Eds.; CABI Oxfordshire: Wallingford, UK, 2017; pp. 132–154. ISBN 13 978 1 78639 058 5. [Google Scholar]
  4. Waite, H.; Whitelaw-Weckert, M.; Torley, P. Grapevine propagation: Principles and methods for the production of high-quality grapevine planting material. N. Zeal. J. Crop. Hortic. Sci. 2015, 43, 144–161. [Google Scholar] [CrossRef]
  5. Assunção, M.; Santos, C.; Brazão, J.; Eiras-Dias, J.E.; Fevereiro, P. Understanding the molecular mechanisms underlying graft success in grapevine. BMC Plant Biol. 2019, 19, 1–17. [Google Scholar] [CrossRef] [PubMed]
  6. Pina, A.; Errea, P. A review of new advances in mechanism of graft compatibility-incompatibility. Sci. Hortic. (Amst.) 2005, 106, 1–11. [Google Scholar] [CrossRef]
  7. Hartman, H.T.; Kester, D.E.; Davies, F.T.; Geneve, R.G. Principles of grafting and budding. In Hartmann and Kester’s Plant Propagation: Principles and Practices; Prentice Hall: Upper Saddle River, NJ, USA, 2011; pp. 415–463. [Google Scholar]
  8. Bianchi, D.; Grossi, D.; Simone Di Lorenzo, G.; Zi Ying, Y.; Rustioni, L.; Brancadoro, L. Phenotyping of the “G series” Vitis hybrids: First screening of the mineral composition. Sci. Hortic. (Amst.) 2020, 264, 109155. [Google Scholar] [CrossRef]
  9. Bianchi, D.; Grossi, D.; Tincani, D.T.G.; Simone Di Lorenzo, G.; Brancadoro, L.; Rustioni, L. Multi-parameter characterization of water stress tolerance in Vitis hybrids for new rootstock selection. Plant Physiol. Biochem. 2018, 132, 333–340. [Google Scholar] [CrossRef]
  10. Migliaro, D.; De Lorenzis, G.; Di Lorenzo, G.S.; De Nardi, B.; Gardiman, M.; Failla, O.; Brancadoro, L.; Crespan, M. Grapevine non-vinifera genetic diversity assessed by simple sequence repeat markers as a starting point for new rootstock breeding programs. Am. J. Enol. Vitic. 2019, 70, 390–397. [Google Scholar] [CrossRef]
  11. Vršič, S.; Pulko, B.; Kocsis, L. Effects of rootstock genotypes on compatibility, biomass, and the yield of Welschriesling. Hortic. Sci. 2016, 43, 92–99. [Google Scholar] [CrossRef] [Green Version]
  12. Töpfer, R.; Hausmann, L.; Harst, M.; Maul, E.; Zyprian, E.; Eibach, R. New horizons for grapevine breeding. In Methods in Temperate Fruit Breeding; Flachowsky, H., Hanke, M.V., Eds.; Vegetable and cereal science and biotechnology; Global Science Books Ltd., UK: Kagawa, Japan, 2011; pp. 79–100. ISBN 978-4-903313-75-7. [Google Scholar]
  13. Çelik, Ü. The effects of different grafting methods applied by manual grafting units on grafting success in grapevines. Turk. J. Agric. For. 2000, 24, 499–504. [Google Scholar]
  14. Gargin, S.; Altindisli, A. A Research on the affinity coefficients of Red Globe grape variety with 140 R, 41 B rootstocks. BIO Web Conf. 2014, 3. [Google Scholar] [CrossRef] [Green Version]
  15. Vršič, S.; Pulko, B.; Kocsis, L. Factors influencing grafting success and compatibility of grape rootstocks. Sci. Hortic. (Amst.) 2015, 181, 168–173. [Google Scholar] [CrossRef]
  16. Bahar, E.; Korkutal, I. Using magnetic resonance imaging technique (MRI) to investigate graft connection and its relation to reddening discoloration in grape leaves. JFAE 2010, 8, 293–297. [Google Scholar]
  17. Milien, M.; Renault-Spilmont, A.S.; Cookson, S.J.; Sarrazin, A.; Verdeil, J.L. Visualization of the 3D structure of the graft union of grapevine using X-ray tomography. Sci. Hortic. (Amst.) 2012, 144, 130–140. [Google Scholar] [CrossRef]
  18. Assunção, M.; Canas, S.; Cruz, S.; Brazão, J.; Zanol, G.C.; Eiras-Dias, J.E. Graft compatibility of Vitis spp.: The role of phenolic acids and flavanols. Sci. Hortic. (Amst.) 2016, 207, 140–145. [Google Scholar] [CrossRef]
  19. Assunção, M.; Pinheiro, J.; Cruz, S.; Brazão, J.; Queiroz, J.; Eduardo, J.; Dias, E.; Canas, S. Scientia Horticulturae Gallic acid, sinapic acid and catechin as potential chemical markers of Vitis graft success. Sci. Hortic. 2019, 246, 129–135. [Google Scholar] [CrossRef]
  20. Gökbayrak, Z.; Söylemezoǧlu, G.; Akkurt, M.; Çelik, H. Determination of grafting compatibility of grapevine with electrophoretic methods. Sci. Hortic. (Amst.) 2007, 113, 343–352. [Google Scholar] [CrossRef]
  21. Cookson, S.; Ollat, N. Grafting with rootstocks induces extensive transcriptional re-programming in the shoot apical meristem of grapevine. BMC Plant Biol. 2013, 13, 147. [Google Scholar] [CrossRef]
  22. Cookson, S.J.; Clemente Moreno, M.J.; Hevin, C.; Nyamba Mendome, L.Z.; Delrot, S.; Magnin, N.; Trossat-Magnin, C.; Ollat, N. Heterografting with nonself rootstocks induces genes involved in stress responses at the graft interface when compared with autografted controls. J. Exp. Bot. 2014, 65, 2473–2481. [Google Scholar] [CrossRef] [Green Version]
  23. Renault-Spilmont, A.S.; Grenan, S.; Bousiquot, J.M. Syrah decline. Progrés Agric. Vitic. 2005, 122, 15–16. [Google Scholar]
  24. Catalogue of Vines Grown in France. Available online: http://plantgrape.plantnet-project.org/en (accessed on 11 March 2020).
  25. Metereological Dafa for Évora Weather Station. Available online: https://www.meteoblue.com/pt/tempo/archive/export/montemor-o-novo_portugal_2265888 (accessed on 1 October 2018).
  26. Bouquet, A. Differences observed in the graft compatibility between some cultivars of Muscadine grape (Vitis rotundifolia Michx.) and European grape (Vitis vinifera L. cv. Cabernet Sauvignon). Vitis 1980, 19, 99–104. [Google Scholar]
  27. Herrero, J. Studies of compatible and incompatible graft combinations with special reference to hardy fruit trees. J. Hortic. Sci. 1951, 26, 186–237. [Google Scholar] [CrossRef] [Green Version]
  28. Lichtenthaler, H.K. ChlorolShylls and carotenoids: Pigments of photosynthetic biomembranes. Methods Enzymol. 1987. [Google Scholar] [CrossRef]
  29. Lichtenthaler, H.K.; Buschmann, C. Chlorophylls and carotenoids: Measurement and characterization by UV-VIS spectroscopy. Curr. Protoc. Food Anal. Chem. 2001, 1, 1–8. [Google Scholar] [CrossRef]
  30. De Mendiburu, F. Agricolae: Statistical Procedures for Agricultural Research, R package version 1.3–2; 2020; Available online: https://cran.r-project.org/web/packages/agricolae/agricolae.pdf (accessed on 13 May 2020).
  31. Harrell, F.E., Jr. Hmisc: Harrell Miscellaneous, R package version 4.4–0; 2020; Available online: https://cran.r-project.org/web/packages/Hmisc/Hmisc.pdf (accessed on 13 May 2020).
  32. Wei, T.; Simko, V. Visualization of a Correlation Matrix; R package “corrplot” Version 0.84; 2017; Available online: https://cran.r-project.org/web/packages/corrplot/corrplot.pdf (accessed on 13 May 2020).
  33. Basheer-Salimia, R.; Hamdan, A.J. Grapevine scion-rootstock combinations of palestinian local cultivars and rootstocks resistant to grape phylloxera daktulosphaira vitifoliae (fitch) [phylloxeridae: homoptera]. Dirasat Agric. Sci. 2009, 36, 19–28. [Google Scholar]
  34. Hamdan, A.S.; Basheer-Salimia, R. Preliminary compatibility between some table-grapevine scion and phylloxera-resistant rootstock cultivars. Jordan J. Agric. Sci. 2010, 6, 1–10. [Google Scholar]
  35. Robinson, J. The Oxford Companion to Wine, 4th ed.; Oxford University Press: Oxford, UK, 2015; ISBN 9780198705383. [Google Scholar]
  36. Irisarri, P.; Pina, A.; Errea, P. Evaluación del comportamiento vegetativo y compatibilidad de injerto de variedades de peral sobre los patrones ‘BA-29’ y ‘OHF-87’. ITEA Inf. Tec. Econ. Agrar. 2016, 112, 243–254. [Google Scholar] [CrossRef]
  37. Moreno, M.A.; Tabuenca, M.C.; Cambra, R.; Adara, A. Plum rootstock for cherries and other stone fruit species. HortScience 1995, 30, 1316–1317. [Google Scholar] [CrossRef] [Green Version]
  38. Zarrouk, O.; Gogorcena, Y.; Moreno, M.A.; Pinochet, J. Graft compatibility between peach cultivars and Prunus rootstocks. HortScience 2006, 41, 1389–1394. [Google Scholar] [CrossRef]
  39. Ermel, F.F.; Catesson, J.K.A.M.; Poëssel, J.L. Localized graft incompatibility in pear/quince (Pyrus communis/Cydonia oblonga) combinations: Multivariate analysis of histological data from 5-month-old grafts. Tree Physiol. 1999, 19, 645–654. [Google Scholar] [CrossRef]
  40. Pereira, I.S.I.A.L.; Picolotto, L.; Fachinello, J.C. Incompatibilidade de enxertia induz aumento da suscetibilidade de cultivares de pessegueiro à Xanthomonas arboricola pv. Pruni. Cienc. Rural 2015, 45, 1147–1153. [Google Scholar] [CrossRef] [Green Version]
  41. Pereira, I.D.S.; Antunes, L.E.C.; Picolotto, L.; Fachinello, J.C. Revista brasileira de engenharia agrícola e ambiental fluorescence of chlorophyll a and photosynthetic pigments in atriplex nummularia under abiotic stresses fluorescência da clorofila a e pigmentos fotossintéticos em atriplex nummularia sob estresses abi. Cienc. Rural 2017, 21, 232–237. [Google Scholar]
  42. Maxwell, K.; Johnson, G.N. Chlorophyll fluorescence—A practical guide. J. Exp. Bot. 2000, 51, 659–668. [Google Scholar] [CrossRef] [PubMed]
  43. Strasser, R.J.; Tsimilli-Michael, M.; Srivastava, A. Chapter 12—Analysis of the chlorophyll a fluorescence transient. In Chlorophyll A Fluorescence: A Signature of Photosynthesis; Springer: Dordrecht, The Netherlands, 2004; pp. 321–322. [Google Scholar]
  44. Pavlović, D.; Nikolić, B.; Đurović, S.; Waisi, H.; Anđelković, A. Chlorophyll as a measure of plant health: Agroecological aspects. Pestic. Phytomed. (Belgrade) 2014, 29, 21–34. [Google Scholar] [CrossRef]
  45. Ashraf, M.; Harris, P.J.C. Photosynthesis under stressful environments: An overview. Photosynthetica 2013, 51, 163–190. [Google Scholar] [CrossRef]
  46. Davis, A.R.; Perkins-veazie, P.; Box, P.O.; West, H.; Levi, A.; King, S.R. Grafting effects on vegetable quality. Hortscience 2008, 43, 1670–1672. [Google Scholar] [CrossRef] [Green Version]
  47. Warschefsky, E.J.; Klein, L.L.; Frank, M.H.; Chitwood, D.H.; Londo, J.P.; von Wettberg, E.J.B.; Miller, A.J. Rootstocks: Diversity, domestication, and impacts on shoot phenotypes. Trends Plant Sci. 2016, 21, 418–437. [Google Scholar] [CrossRef]
  48. Murchie, E.H.; Lawson, T. Chlorophyll fluorescence analysis: A guide to good practice and understanding some new applications. J. Exp. Bot. 2013, 64, 3983–3998. [Google Scholar] [CrossRef] [Green Version]
  49. Calatayud, Á.; San, A.; Pascual, B.; Vicente, J.; López-galarza, S. Scientia horticulturae use of chlorophyll fluorescence imaging as diagnostic technique to predict compatibility in melon graft. Sci. Hortic. (Amst.) 2013, 149, 13–18. [Google Scholar] [CrossRef]
  50. Ito, H.; Tatsuyuki, O.; Tanaka, A. Conversion of Chlorophyll b to Chlorophyll a via 7-Hydroxymethyl Chlorophyll. J. Biol. Chem. 1996, 271, 1475–1479. [Google Scholar] [CrossRef] [Green Version]
  51. Rustioni, L.; Grossi, D.; Brancadoro, L.; Failla, O. Iron, magnesium, nitrogen and potassium deficiency symptom discrimination by reflectance spectroscopy in grapevine leaves. Sci. Hortic. (Amst.) 2018, 241, 152–159. [Google Scholar] [CrossRef]
  52. Pina, A.; Errea, P.; Martens, H.J. Graft union formation and cell-to-cell communication via plasmodesmata in compatible and incompatible stem unions of Prunus spp. Sci. Hortic. (Amst.) 2012, 143, 144–150. [Google Scholar] [CrossRef]
  53. Andrews, P.K.; Serrano Marquez, C. Volume 15—Graft incompatibility. In Horticultural Reviews; Janick, J., Ed.; John Wiley & Sons, Inc.: Oxford, UK, 1993; pp. 183–232. ISBN 978-0-471-57338-8. [Google Scholar]
  54. Pereira, I.D.S.; Antunes, L.E.C.; Picolotto, L.; Fachinello, J.C. Incompatibilidade de enxertia em Prunus Graft incompatibility in Prunus. Cienc. Rural 2014, 449, 1519–1526. [Google Scholar] [CrossRef] [Green Version]
  55. Shtein, I.; Hayat, Y.; Munitz, S.; Harcavi, E.; Akerman, M.; Drori, E.; Schwartz, A.; Netzer, Y. From structural constraints to hydraulic function in three Vitis rootstocks. Trees-Struct. Funct. 2017, 31, 851–861. [Google Scholar] [CrossRef]
Figure 1. Percentage of graft take, sprouting, and rooting at 21 and 125 DAG in all graft combinations. (a) Sprouting and rooting percentages at 21 DAG; (b) graft take and rooting percentages at 152 DAG in the same population analyzed at 21 DAG. Different letters indicate significant differences between all graft combinations with p < 0.05 (n = 94–100 per graft combination) according to Fisher’s exact test.
Agronomy 10 00706 g001
Figure 2. Internal characterization of the graft union. (a) Example images of the category A to E charactering the internal graft unions. Category A represents a perfect union in which the graft line is almost invisible. Category B shows few structural imperfections and/or slight discontinuities between wood and bark or cambial invaginations. Category C is characterized by bark discontinuities and D by wood discontinuities. Category E includes broken/unattached unions and/or unions with dead tissue in proximity of the union line. (b) Proportion (%) of compatible, intermediate, and incompatible classes detected per graft combination.
Agronomy 10 00706 g002
Figure 3. Pearson correlation of the graft take value versus all the parameters investigated at 21 and 152 DAG. (a) at 21 DAG: roots number, length of the major root, shoot length, stem diameters (SD) above, below and at the graft zone and callus score. (b) Pearson correlation of the graft take values versus the parameters investigated at 152 DAG: shoot length, stem diameter (SD) above, below and at the graft zone, Chlorophyll a (Chl(a)), Chlorophyll b (Chl(b)), carotenoids (Carot), ratio Chl(a) and Chl(b), ratio total chlorophylls and Carot, and the following chlorophyll fluorescence values: Vj, PI, Fv/Fm, Fv/Fo. Positive correlations are displayed in blue and negative correlations in red colors. The size of the circles and color intensities are proportional to the correlation coefficients. Correlations with p value > 0.01 are considered insignificant and are left blank.
Agronomy 10 00706 g003
Table 1. Average of callus grade, root number, root length, and shoot length detected at 21 and 152 DAG.
21 DAG152 DAG
Callus Grade (0–4)Roots NumberRoot Length (cm)Shoot Length (cm)Shoot Length (cm)
Graft Combination***************
110R/110R3.9 ± 0.1 abc4.1 ± 0.6 a1.6 ± 0.3 a4.3 ± 0.6 a78 ± 6.2 cd
TN21/TN213.0 ± 0.3 d5.3 ± 0.9 a1.6 ± 0.2 a1.9 ± 0.5 bcd95 ± 7.4 bc
TN112/TN1121.5 ± 0.2 e5.7 ± 1.2 a1.1 ± 0.2 a0.9 ± 0.3 cde127 ± 8.2 ab
SY383/SY3833.4 ± 0.2 bcd0.5 ± 0.2 b0.2 ± 0.1 b0.4 ± 0.1 de78 ± 3.8 cd
SY470/SY4703.3 ± 0.3 cd0.8 ± 0.3 b0.3 ± 0.2 b0.0 ± 0.0 e139 ± 9.0 a
TN21/110R4.0 ± 0.0 a3.0 ± 0.5 a1.3 ± 0.3 a2.9 ± 0.4 ab80 ± 7.7 cd
TN112/110R4.0 ± 0.0 ab4.1 ± 0.8 a1.8 ± 0.4 a3.5 ± 0.4 a63 ± 4.1 d
SY383/110R3.9 ± 0.1 abc3.8 ± 0.7 a1.9 ± 0.3 a2.1 ± 0.4 abc66 ± 3.9 d
SY470/110R4.0 ± 0.0 a3.9 ± 0.6 a1.8 ± 0.3 a4.3 ± 0.5 a78 ± 4.6 cd
Graft Type***nsns******
Homograft3.0 ± 0.1 a3.3 ± 0.41.0 ± 0.11.5 ± 0.2 a97 ± 3.9 a
Heterograft4.0 ± 0.0 b3.7 ± 0.31.7 ± 0.13.2 ± 0.2 b72 ± 2.7 b
± SE standard error; 21 DAG n = 24; 152 DAG n = 11–24. Significant differences according to Kruskal–Wallis test are indicated by asterisks symbols *** p < 0.001; “ns” indicates non-significant differences.
Table 2. Mean values of the Stem Diameters (SD) detected at 21 and 152 DAG.
21 DAG152 DAG
SD AboveSD Graft UnionSD BelowSD AboveSD Graft UnionSD Below
Graft Combination*****************
110R/110R3.21 ± 0.18 ab14.26 ± 0.35 a9.47 ± 0.29 ab5.08 ± 0.37 c18.18 ± 0.88 ab10.86 ± 0.44 bc
TN21/TN211.55 ± 0.32 cd10.94 ± 0.38 cd8.82 ± 0.17 ab6.88 ± 0.48 abc15.67 ± 0.68 bc11.01 ± 0.46 abc
TN112/TN1121.46 ± 0.41 bcd9.38 ± 0.29 d8.42 ± 0.15 b6.77 ± 0.40 bc13.88 ± 1.04 c11.45 ± 0.47 abc
SY383/SY3831.46 ± 0.46 bcd12.01 ± 0.49 bc9.70 ± 0.29 a7.59 ± 0.40 ab17.80 ± 0.51 ab12.90 ± 0.44 ab
SY470/SY4700.00 ± 0.00 d11.20 ± 0.44 cd11.20 ± 0.44 ab10.61 ± 0.90 a18.98 ± 0.79 ab14.0 ± 0.72 a
TN21/110R3.55 ± 0.27 a13.9 ± 0.27 a13.90 ± 0.27 a5.33 ± 0.33 c17.99 ± 0.62 ab10.24 ± 0.37 c
TN112/110R4.25 ± 0.30 a13.85 ± 0.34 a13.85 ± 0.34 ab5.39 ± 0.33 c17.58 ± 0.63 abc10.14 ± 0.46 c
SY383/110R3.26 ± 0.48 a13.31 ± 0.29 ab13.31 ± 0.29 a5.91 ± 0.35 c18.05 ± 0.68 ab10.30 ± 0.30 c
SY470/110R2.85 ± 0.28 abc14.09 ± 0.29 a14.09 ± 0.29 ab6.20 ± 0.28 bc19.28 ± 0.52 a10.17 ± 0.39 c
Graft Type***************
Homograft1.54 ± 0.17 a11.56 ± 0.23 a9.05 ± 0.11 a7.18 ± 0.28 a16.99 ± 0.4 a12.04 ± 0.25 a
Heterograft3.47 ± 0.18 b13.79 ± 0.15 b9.56 ± 0.14 b5.7 ± 0.16 b18.23 ± 0.31 b10.21 ± 0.19 b
± SE standard error; SD above, below, and at the graft union measured at 21 (n = 24) and 152 DAG (n = 11–24) for all graft combinations and graft type. Significant differences according to Kruskal–Wallis test are indicated by asterisks * p < 0.05, ** p < 0.01, *** p < 0.001.
Table 3. Mean values of chlorophyll and carotenoid content per graft combination and graft type.
Chl(a) (mg/cm2)Chl(b) (mg/cm2)Carot (mg/cm2)Chl(a)/Chl(b)Chl(a+b)/Carot
Graft Combination*****ns******
110R/110R0.023 ± 0.001 a0.01 ± 0.001 ab0.004 ± 0.0002.6 ± 0.1 a9.5 ± 0.9 ab
TN21/TN210.019 ± 0.001 ab0.007 ± 0.001 bc0.005 ± 0.0002.7 ± 0.1 ab5.4 ± 0.2 cd
TN112/TN1120.019 ± 0.001 ab0.008 ± 0.001 bc0.004 ± 0.0002.6 ± 0.1 ab6.3 ± 0.5 bcd
SY383/SY3830.022 ± 0.001 a0.011 ± 0.001 ab0.004 ± 0.0002.4 ± 0.1 a10.2 ± 3.0 abc
SY470/SY4700.016 ± 0.001 b0.005 ± 0.000 c0.004 ± 0.0002.9 ± 0.1 b5.1 ± 0.1 d
TN21/110R0.022 ± 0.001 a0.011 ± 0.001 ab0.004 ± 0.0002.1 ± 0.1 a8.2 ± 1 abc
TN112/110R0.022 ± 0.001 a0.014 ± 0.001 a0.004 ± 0.0001.7 ± 0.1 a14.7 ± 4.0 a
SY383/110R0.022 ± 0.001 a0.011 ± 0.001 ab0.005 ± 0.0002.1 ± 0.1 a7.0 ± 0.7 bcd
SY470/110R0.020 ± 0.001 ab0.009 ± 0.001 ab0.004 ± 0.0002.3 ± 0.1 ab7.4 ± 0.6 abcd
Graft Typens***ns***ns
Homograft0.020 ± 0.0010.009 ± 0.000 a0.004 ± 0.0002.6 ± 0.1 a8.0 ± 0.9
Heterograft0.021 ± 0.0010.011 ± 0.000 b0.004 ± 0.0002.1 ± 0.1 b9.3 ± 1.1
± SE: standard error; significant differences according to Kruskal–Wallis test are indicated by asterisks ** p < 0.01 and *** p < 0.001; “ns” indicates non-significant differences (n = 24). Abbreviations: Chl(a) = chlorophyll a; Chl(b) = chlorophyll b; Carot = carotenoids.

