Article

Optimization of Light Interception, Leaf Area and Yield in “WA38”: Comparisons among Training Systems, Rootstocks and Pruning Techniques

Department of Horticulture, Tree Fruit and Research Extension Center (TFREC), Washington State University, 1100 N. Western Avenue, Wenatchee, WA 98801, USA
*
Author to whom correspondence should be addressed.
Agronomy 2020, 10(5), 689; https://doi.org/10.3390/agronomy10050689
Submission received: 31 March 2020 / Revised: 7 May 2020 / Accepted: 9 May 2020 / Published: 13 May 2020
(This article belongs to the Section Horticultural and Floricultural Crops)

Abstract

:
As apple orchards have transitioned to high-density plantings, proper training systems are required to manage increased leaf area. Leaf area index (LAI) is defined as the ratio between leaf area to ground area (m2/m2) and can infer orchard health, light relationships and productivity. New technologies enable rapid assessments of LAI and light interception (LI) in the orchard. In this study, LAI, LI, and productivity were assessed across two training systems (Spindle and V), two rootstocks (Geneva 41® (G41) and Malling 9—Nic29 (Nic29)) and two pruning techniques (“click” and bending) in 2016 and 2017. The objective of this study was to determine a management strategy for “WA38” to meet optimal levels for LAI (1.2–2.0) and light interception (65–75%). Higher light interception was measured in V compared to Spindle and in G41 compared to Nic29 in both years. Minimal differences in LAI and light interception were detected across pruning techniques. In “WA38” the “click” technique maintained more consistent yields than bending. In both years, the Spindle-Nic29-“click” combination maintained optimal thresholds for LAI (1.93 and 1.48), light interception (66% and 68%) and consistent yields. This sequence helps mitigate “blind wood” and alternate bearing, while optimizing leaf area and light in “WA38”.

1. Introduction

Different training systems present various light interception (LI) levels and light distribution across the canopy [1]. Further, tree training influences the development, position, and crotch angle of branches, and thus their ability to intercept light, which impacts yield and fruit quality [2]. Buler and Mika [3] stated that the goals of proper tree training should include: the simplification of tree architecture, the efficient use of orchard area, the promotion of high LI and the even distribution of that light across the canopy’s leaf area. Planting densities in pome and stone fruit orchards have increased in the last decade and it is crucial to properly manage and manipulate the canopy to maintain the trees’ efficiency [4,5,6]. Reduced spacing can lead to increased shading within the row, as well as in proximate rows if the height of trees is not regulated [7,8]. Jackson and Palmer [9] concluded that tree height should not exceed the alleyway spacing and should be oriented north–south for maximum illumination [10,11]. Training regulates tree shape, both in height and volume as to reduce the deleterious effects of shading on flower bud induction and fruit development [12]. Training systems need to be designed according to cultivar selection, planting density, and the light available in the growing region [3].
Leaf area index (LAI) is defined as the ratio between leaf area per unit ground area [13]. Scientists have used LAI quantification techniques to gain insight about foliage distribution, seasonal changes, and describing light climates based on horticultural manipulations [14]. Quantification of LAI has also grown in its importance in the perennial tree fruit production as the apple industry seeks to embrace more precision-based agricultural techniques [15]. Quantification of LAI can provide an understanding on the canopy-atmosphere interface [16], evapotranspiration estimations [17], photosynthesis activity [18], the distribution of radiation across a canopy [17], LI [19], production [20], flowering and fruit color [21], yield [14], and for evaluating horticultural practices like training systems, rootstocks, and pruning techniques [14,21,22].
In Washington, old training systems include the Vertical Axis and Open Vase systems, but in more recent years new training systems like the Spindle and V-trellis have been adopted [20]. Spindle systems have become the most common training system for medium to high density plantings (2000–3000 trees/ha) and work best with low to mild vigor trees [6]. Excessive vigor with this system in a high-density planting context can become a problem due to variability in canopy light penetration [3]. Some of the advantages of the Spindle system over older style orchards include: high early yields, optimal LI and photosynthetic activity, along with simplified management [6,23]. The V-system optimizes orchard space by increasing planting density (the number of trees planted on a per hectare basis), thus allowing a rapid filling of the canopy space to enable high LI and early yields [24]. The angled canopy allows less light to fall in the tractor alleyway, facilitating more efficient land and light use [24].
Training systems modify the shape and architecture of the tree, whereas rootstocks directly impact the size and vigor of the tree [25,26]. Dwarfing rootstocks have the capacity to reduce tree size [25]. Size-controlling rootstocks can allocate photosynthates towards fruit development earlier in the season (vs. vegetative sinks), allowing for significant impacts on yield and fruit quality [26]. This control of canopy size may negatively impact production, as reduced leaf area may penalize LI [19]. However, an excessively vigorous rootstock may lead to negative shading effects. Sufficiently illuminated leaf area across the orchard allows for maximum carbon assimilation, optimal floral initiation, and enhanced fruit quality [27]. Whereas, an unbalanced canopy with poor light distribution, inhibits flower induction and decreases yields [28].
Pruning aims to balance reproductive and vegetative sinks, by managing leaf area for adequate light penetration into the canopy, optimal carbohydrate production, flower bud induction, and high yields [29]. The strategic removal of plant material can open the canopy up for sufficient light distribution by eliminating branches that may be too large/high, unproductive or characterized by “blind wood” [30]. “Blind wood” refers to branches in the canopy without lateral branching, bud swelling, or fruit, and are therefore unproductive [31]. “Click” pruning is a technique that can be used to ameliorate these negative vegetative aspects, particularly in tip bearing (Type IV) [32] varieties that have a tendency for “blind wood,” like “WA38” [6]. “Click” pruning includes the heading of one-year-old shoots to remove auxins located in the apical meristem and their inhibitory effects on nearby basal bud swelling [6,29]. This allows for renewal branches and flower buds to initiate near the central axis of the tree, which is especially important in high density planting scenarios to avoid shading. Bending branches with narrow crotch angles (from the central leader) modifies the fruiting-vegetative gradient, reducing vigor and branch size, increasing carbohydrate content for developing buds, and stimulates flower bud formation [6,29,33,34]. Therefore, pruning plays a significant role in managing light distribution to ensure a proper balance of vegetative and reproductive organs required for consistent, high-quality yields.
The proper illumination of a canopy is a function of the canopy size (interception) and shape (distribution) [35]. A larger tree will have a larger LAI, which can enable high LI. However, the distribution of the intercepted light is just as important for high yields [36], which is why the shape of the canopy must be managed through horticultural techniques like training and pruning. LAI [35,37], planting densities [38], photosynthesis [39], flowering [12], fruit size, dry matter content [40], color development [39], and yield [12] have all been related or correlated to LI. Barritt [20] found strong regressions between LAI, LI and yield. Palmer [37] further supports that yield and LI are dependent upon leaf area and its arrangement.
Jackson [41] suggests optimal LAI values for apple production are between 1.2 and 2.0. When LAI and subsequent LI values are too low, solar energy is wasted on the tractor alleyways [41,42]. However, if LAI values are too high, excessive shading can occur, reducing floral induction and fruit coloration in the interior/basal part of the tree [43].
Minimal or excessive levels of LI can inhibit optimal production. Below 35% of LI, carbon is no longer exported from the shoot to fruit, as a result of shade avoidance strategy and floral bud initiation is reduced [39,44,45]. Below 20%, fruit growth ceases and abscission can occur [46]. Horticulturists should aim for 60–70% [47], although light and productivity only seem to increase linearly until about 50% [12]. Robinson et al., [48] suggested aiming for higher levels around 70–75%.
When each of these parameters reach excessive levels (LAI >3.15 and LI >75%), yields, fruit quality and flower bud counts may diminish [41,47]. Ultimately, the highest yields will result from an LAI value that enables high light interception and distribution, with minimal intra-tree shading [41]. Research is required to determine optimal LAI and LI values for particular cultivars, along with management strategies to achieve them.
Research has been conducted to determine optimal management of specific cultivars like, ‘Granny Smith’, ‘Macspur’, ‘Golden Delicious’, ‘Rome Beauty’, ‘Empire’, and ‘Honeycrisp’, to achieve maximum production and high fruit quality [11,20,49,50,51]. As growth habit, yield efficiency, and vigor are dependent upon each scion and rootstock combination, it is necessary to evaluate each cultivar individually to define the best management practice for optimum production. This is especially true for cultivars that have been recently released, like Washington State University’s, “WA38”, branded as ‘Cosmic Crisp®’. The goal of this study is to determine optimal horticultural practices to ensure LAI and LI thresholds that allow maximum and consistent production for this new cultivar.
This study evaluates the impact of training systems, rootstocks and pruning techniques on LAI, LI, and production in “WA38.” Our hypothesis is that higher density training systems (e.g., “V”), more vigorous rootstocks (e.g., Geneva 41® (G41) in this soil condition) and long pruning techniques (e.g., “bending”) will generate LAI and LI values that surpass optimal thresholds for consistent high production.

2. Materials and Methods

2.1. Experimental Design

In June 2013, an orchard of Washington State University’s new apple (Malus domestica Borkh), “WA38,” commercially traded as ‘Cosmic Crisp®,’ was planted in an experimental trial at the Sunrise Research Orchard in Wenatchee, WA, USA (47.309776 N, −120.064593 W). This orchard was oriented north–south, trees were trained to both a spindle system at a density of 0.9 × 3 m (3700 trees/hectare) and a V-trellis system at a density of 0.45 × 3 m (7400 trees/hectare). The trees were grafted on two different rootstocks, G41 and Malling 9-Nic29 (Nic29). Two pruning techniques were applied to the trees: “click” (heading cut) and bending (long pruning). “Click” pruning [6] entailed the simplifying of branches and heading back on one-year-old shoots to 5–10 cm stubs (Figure 1B). This practice inhibits excessive vegetative growth and “blind wood” by inducing bud swelling on the basal portion of the branch for renewal fruiting branches and a more condensed canopy. Bending consisted of manipulating branches below 90 degrees in an arching formation to induce flowering by reducing the vegetative vigor imposed with acute crotch angles, as well as the removal of upright shoots (Figure 1C). The orchard was irrigated through drip lines and micro-sprinklers, and managed for pests (e.g., codling moth, aphids, powdery mildew) and fire-blight prevention according to commercial standards and environmental conditions. “WA38” is a quite vigorous variety that does not need a lot of nitrogen input, so fertilization was minimal.
The orchard was a three-way factorial design with plots of trees grafted on the two rootstocks (Nic29 and G41) randomized in each row within the two training systems (spindle and V). Training systems and pruning techniques were assigned to specific rows and maintained for the course of the experiment. Therefore, there was a total of 8 experimental plots containing each treatment combination: V-G41-bending, V-G41-“click”, V-Nic29-bending, V-Nic29-“click”, Spindle-G41-bending, Spindle-G41-“click”, Spindle-Nic29-bending, Spindle-Nic29-“click”. Three representative trees per training system × rootstock × pruning technique combinations were selected for leaf area estimations and yield (8 combinations × 3 trees/combination = 24 experimental trees total). Each of the trees were selected within each sampling plot as the average representatives of each combination, with no disease nor architectural issue. In total, the 24 trees were measured three times throughout the summer in 2016 and 2017 (June, July, and August), with a non-destructive LAI estimation tool, the CID CI-110 Plant Canopy Imager (CI-110) (CID BioSciences, Camas, WA, USA). Additionally, these eight sampling plots (10 trees/plot in V, and 11 trees/plot in Spindle) were measured with the LICOR LI-191R Line Quantum Sensor (light bar) (LI-COR Biotechnology, Lincoln, NE, USA) for light interception across these eight sampling plots during these same summer months. In the Fall (20 and 21 September in 2016 and 9 and 10 October in 2017), the fruit was harvested, and production was evaluated for these treatment combinations.

2.2. Leaf Area Estimation—Image Acquisition

Non-destructive leaf area estimation was conducted according to the methodology developed in Knerl et al. [15] using the CI-110, in which the imager collects and processes an image of the canopy to predict LAI. This included the imaging of the tree’s canopy 20 cm from the orchard floor with the hemispherical camera oriented north and the lens pointed towards the sky with canopy above. Prior to imaging, a photosynthetically active radiation (PAR) measurement was taken to assess the incident light quantity using the CI-110’s integrated ceptometer that consists of 24 photodiodes.
Three representative trees in each plot were imaged at the same solar Zenith each month (from June to August) at 20 cm above the ground and 20 cm from the trunk of the tree. Each trial tree was imaged once per month during summer. The imaging route proceeded from east-west traveling parallel with the sun’s movement.
Measurements took place on 20 June, 18 July, and 16 August in 2016, and on 28 June, 25 July, and 23 August in 2017. The sampling day for estimation in each month was conducted under similar sky conditions with uniform overcast or clear skies, prior to sunrise, under low light intensities (PAR ranged from 90–308 µmol m−2 s−1 in 2016 and 61–100 µmol m−2 s−1 in 2017). These environmental conditions for optimal image acquisition are suggested throughout literature in order to reduce the camera’s direct exposure to sunlight, which creates “sunflecks” on the screen, washing out the edges of leaves leading to underestimations of LAI [14].

2.3. Leaf Area Estimation—Image Processing

Images were then assessed and processed using CID’s Plant Canopy Analysis Software (Version 6.1.4.1083) (CID Biosciences, Camas, WA, USA) to receive the prediction of LAI. The following parameters were set for each image throughout processing to standardize the methodology: zenith exclusion was set to 50, a chi value of 0.6 based on literature (Faust 1989) was used, and a preset automatic threshold, “Otsu,” was selected. The zenith setting allows for the exclusion of contributing leaf area from trees in proximate rows. The “Otsu” threshold selection was shown to demonstrate more accurate estimations of leaf area in Knerl et al. [15]. Other parameters that were inputted manually were the incident PAR (“light above canopy”—LAC PAR) for each plot, along with the utilization of the azimuth selection setting to exclude the tree’s trunk from contributing leaf area pixels. Color selection, brightness, and contrast were left unaltered to ensure limited user bias in processing.

2.4. Light Interception

Light interception across the plots was measured with the light bar. The light bar contains a 1 m long rod situated under a diffuser that directs non-uniform radiation across the entire 1 m length to one silicon photodiode.
Measurements were conducted 28 June, 26 July, 23 August, in 2016 and on 23 June, 20 July, and 30 August, in 2017. Sampling was done each month, approximately two hours prior to solar noon, under full sun, as recommended by Zhang et al. [52]. Prior to interception measurements, an LAC PAR measurement was taken using the Li-Cor LI-190R Quantum Sensor (Quantum Sensor) (Li-Cor Biotechnology, Lincoln, NE, USA) at the beginning of each plot. All light measurements were logged using the Li-Cor LI-1500 Light Sensor Logger (Data Logger) (Li-Cor Biotechnology, Lincoln, NE, USA).
The light bar was oriented parallel with the row and measurements were taken on the west side of the plot. Measurements began with the first tree at the north end and moved southward measuring at the base of each tree in the plot. For the V-training system, light interception was logged at the base of every other tree, so only the trees angled over the west side of the plot were targeted for measurement (10 total). For the Spindle training system, all 11 trees in the plot were measured. The bar was centered on a 50 cm mark (middle of the light bar) to the tree trunk and placed 20 cm from the trunk when measurements were logged. In 2017, given the increased size of the canopy, the measurement was shifted further into the interrow at 40 cm from the center of each tree trunk.
To achieve light interception percentages, the transmitted light logged by the light bar situated on the orchard floor is divided by the incident LAC PAR for each plot and then multiplied by 100.
Transmitted light % = (PAR measured by light bar under the tree/incident LAC PAR at the beginning of the plot) × 100
Light intercepted by canopy % = 100% light − transmitted light%
Total light interception (LI) values were averaged on a per plot basis across the 10 trees in the V-system and the 11 trees in the Spindle system for both years.

2.5. Production

Fruit from experimental plots were harvested on 20 and 21 September 2016 and 9 and 10 October 2017. Production was evaluated across these treatments in regard to the number of fruits per tree, the average mass (kg) per tree (yield), the average fruit weight (g), and metric tonnes per hectare (MT/ha).
Fruit was picked, counted and weighed for each tree. Weights were recorded in the field using a portable bench scale, PB-300 (CAS, East Rutherford, NJ, USA). After weights were recorded in 2016, fruit was sorted by size using an apple sizer (Turoni, Italy) using the following size categories in mm: <55.00, 55.00–59.99, 60.00–64.99, 65.00–69.99, 70.00–74.99, 75.00–79.99, 80.00–84.99, 85.00–89.99, >90.00 mm diameter. In 2017, fruit was sized by customizing categories to account for larger fruit: <65.00, 65.00–69.99, 70.00–74.99, 75.00–79.99, 80.00–84.99, 85.00–89.99, 90.00–94.99, 95.00–99.99, 100.00–104.99, 105.00–109.99, >110.00 mm diameter. Fruit quality analyses were conducted, but these data are not included as part of this trial. Further quality information on “WA38” is documented in Anthony et al. [31].
Bienniality was then quantified and assessed for each treatment combination according to the following formula [53]:
Intensity of Crop Fluctuation (I) = (Difference in fruit count per tree between years)/(Sum of fruit count per tree between years)
Biennial classifications were then prescribed to each treatment combination based on the fruit count per tree data from the 2016 and 2017 harvests. The classifications are quantified as: I (0.90–1.00) = Strongly Biennial, I (0.50–0.89) = Biennial, I (0.10–0.49) = Consistent, I (0.00–0.09) = Strongly Consistent.

2.6. Statistical Analyses

Statistical analyses were conducted using Statistical Analysis System software (SAS Enterprise Guide 7.1) (SAS Institute Inc., Cary, NC, USA). The effects of the horticultural factors (training systems, rootstocks, and pruning techniques) on leaf area index, light interception, and productivity were assessed for significance with an analysis of variance (ANOVA) using the Proc GLM, the model was considered significant at p < 0.05 with the type III sums of squares test. Normality was assessed using Proc Univariate and verified with the Anderson–Darling test. No transformations were conducted. Equal variance was tested using Levene’s test. Multiple comparison tests were assessed using Student–Newman–Keuls’ test for post-hoc means separation assigning differing letters where the model was significant. Significance levels were placed at a p-value of < 0.05.

3. Results

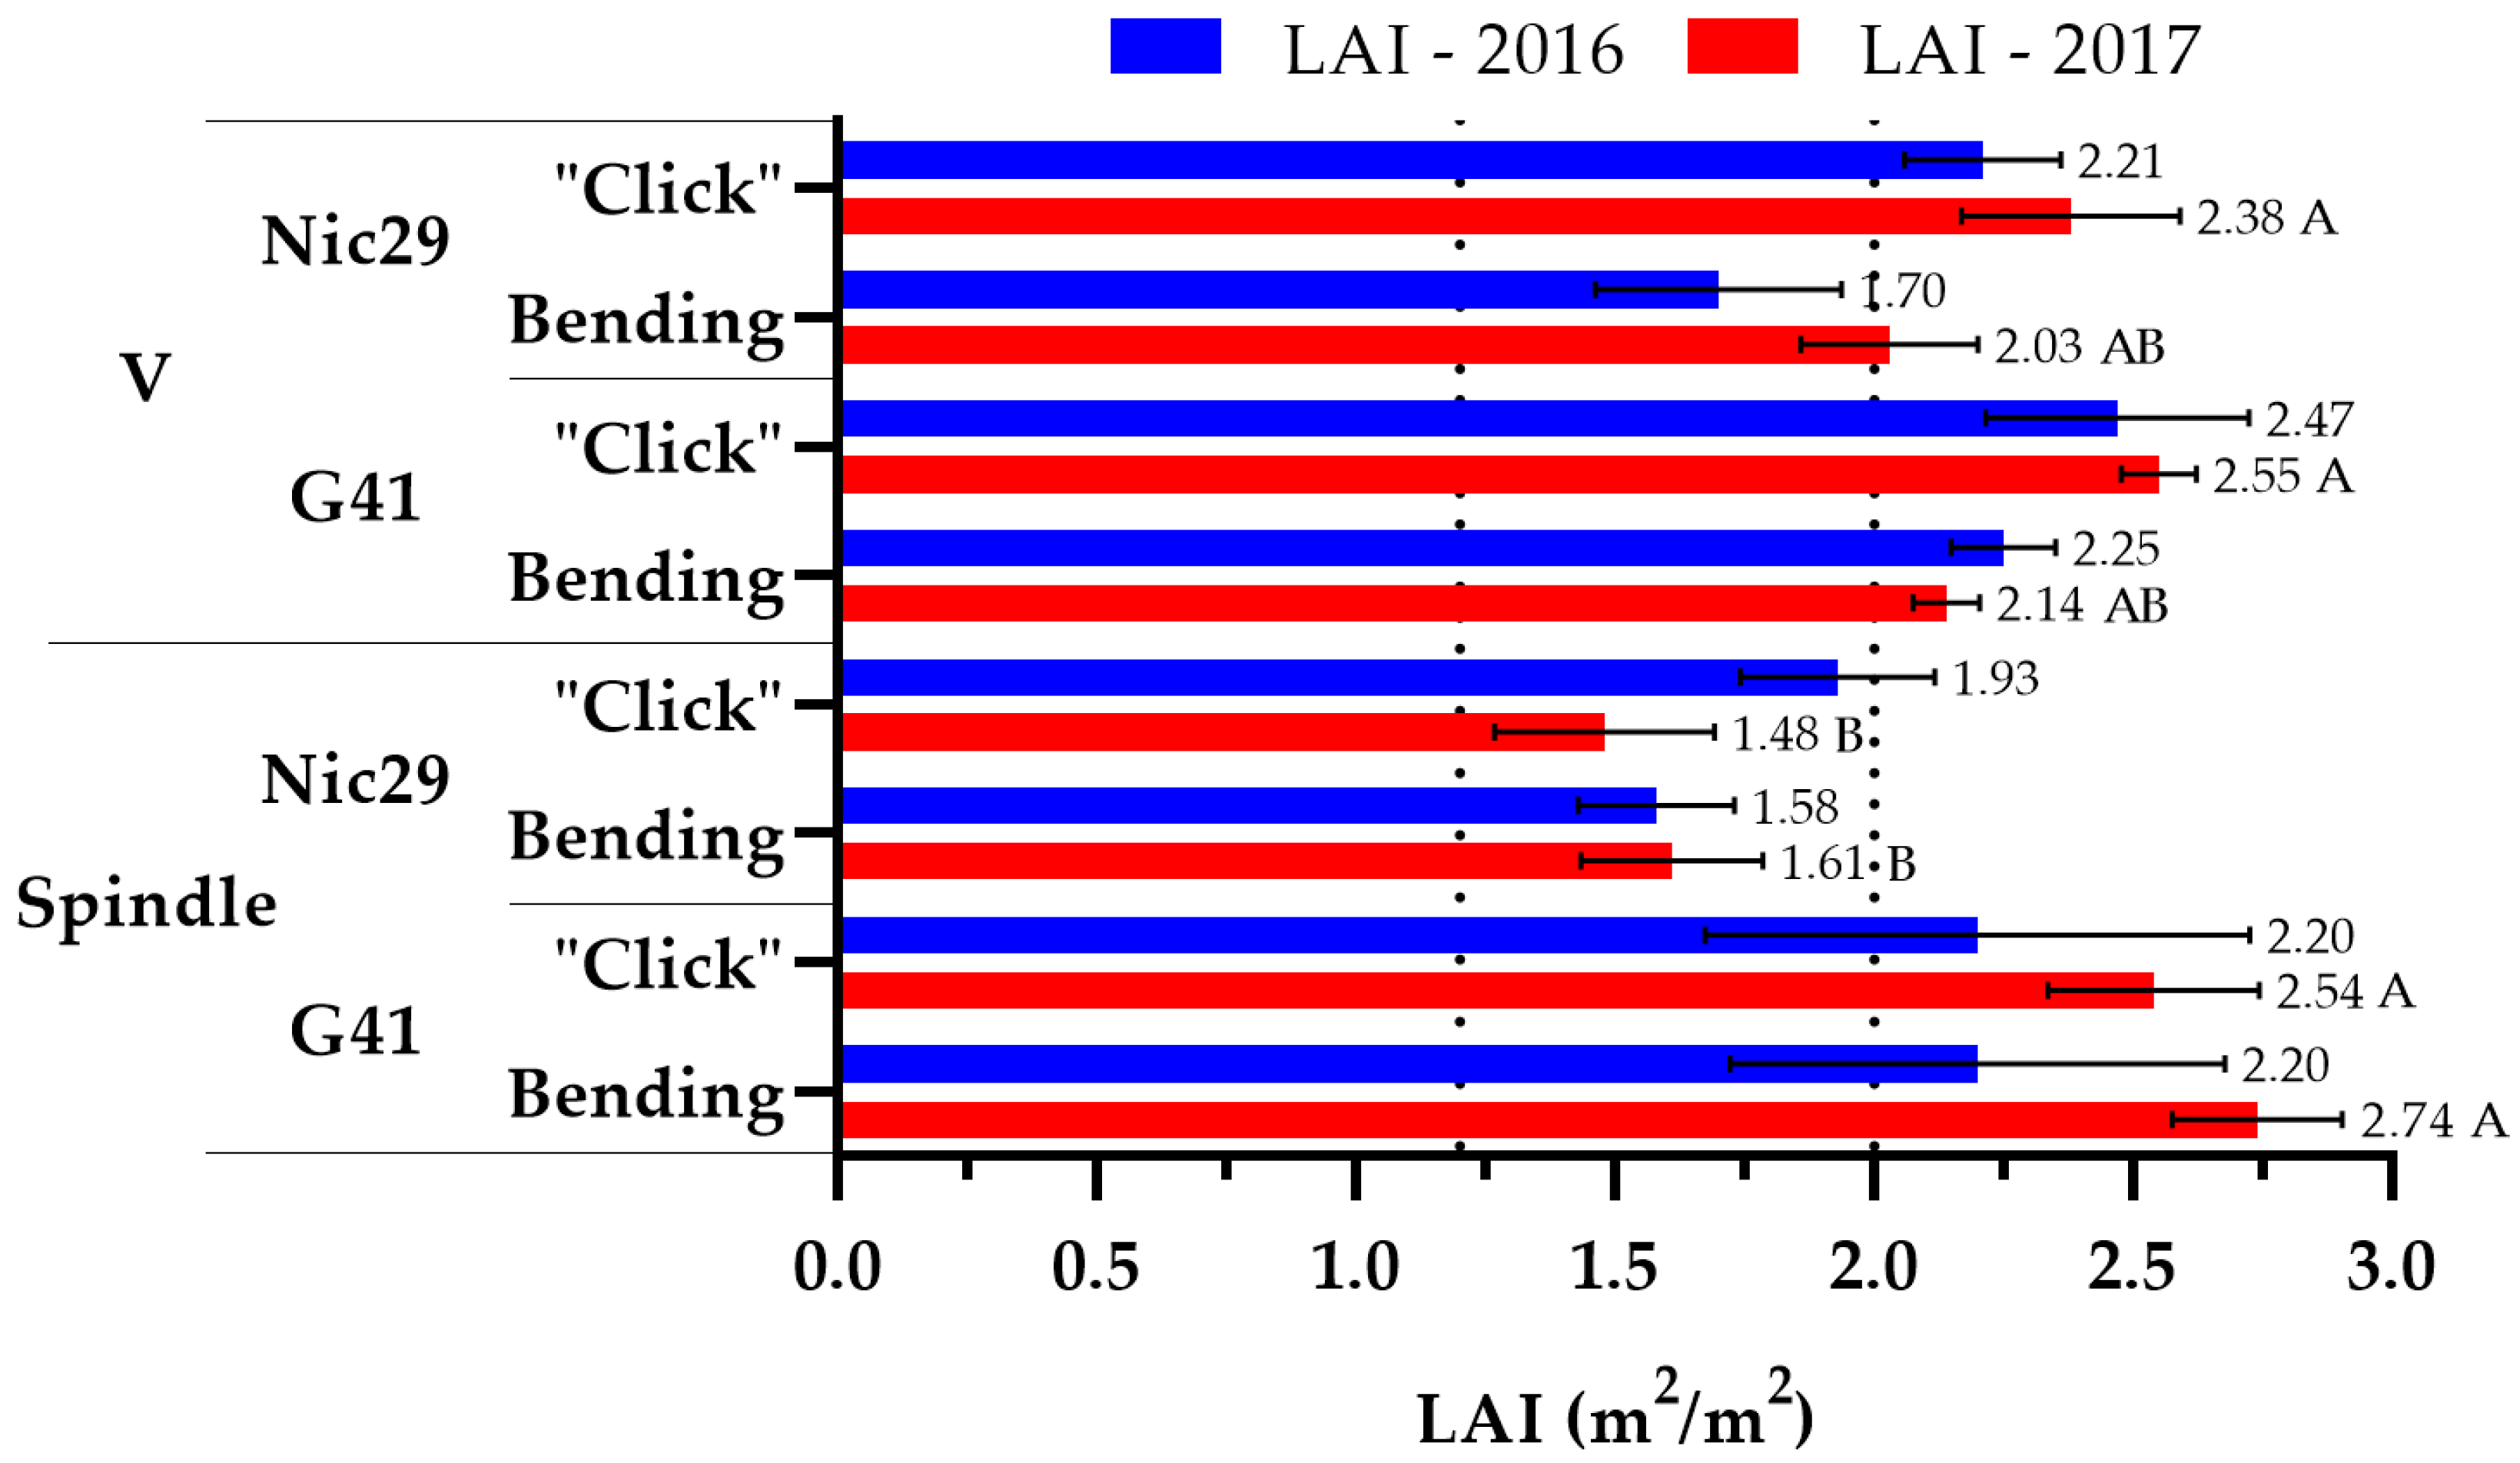
3.1. Leaf Area Estimation

In 2016 (fourth leaf), the average estimated LAI for the V-system and the Spindle system were not significantly different (Table 1). Also, G41 and Nic29 rootstocks were not significantly different in their mean LAI values either (Table 1), although leaf area in G41 trees were 23% larger than in Nic29 trees. There was no significant difference between pruning treatments with respect to LAI means (Table 1).
In 2017 (fifth leaf), leaf area was significantly impacted by rootstock, but not by training system or pruning technique. On average, G41 (2.49) induced a 33% higher LAI than Nic29 (1.87). V (2.28) generated a higher LAI than Spindle (2.09), while “click” (2.24) pruning and bending (2.13) were not statistically different from one another (Table 2). The training system × rootstock and training system × pruning interactions were significant in 2017 for LAI. The Spindle combinations that produced higher LAIs than the V system combinations were grafted on the G41 rootstock (Figure 2). The Spindle-Nic29 combinations, regardless of pruning technique, maintained lower LAIs than the other six treatment combinations in 2017 (Figure 2).
The combination that resulted in the highest LAI was the Spindle-G41-bending treatment combination with an average value of 2.74 in 2017 (Figure 2). The Spindle-Nic29-“click” treatment combination resulted in the lowest LAI value at 1.48 in 2017 (Figure 2).

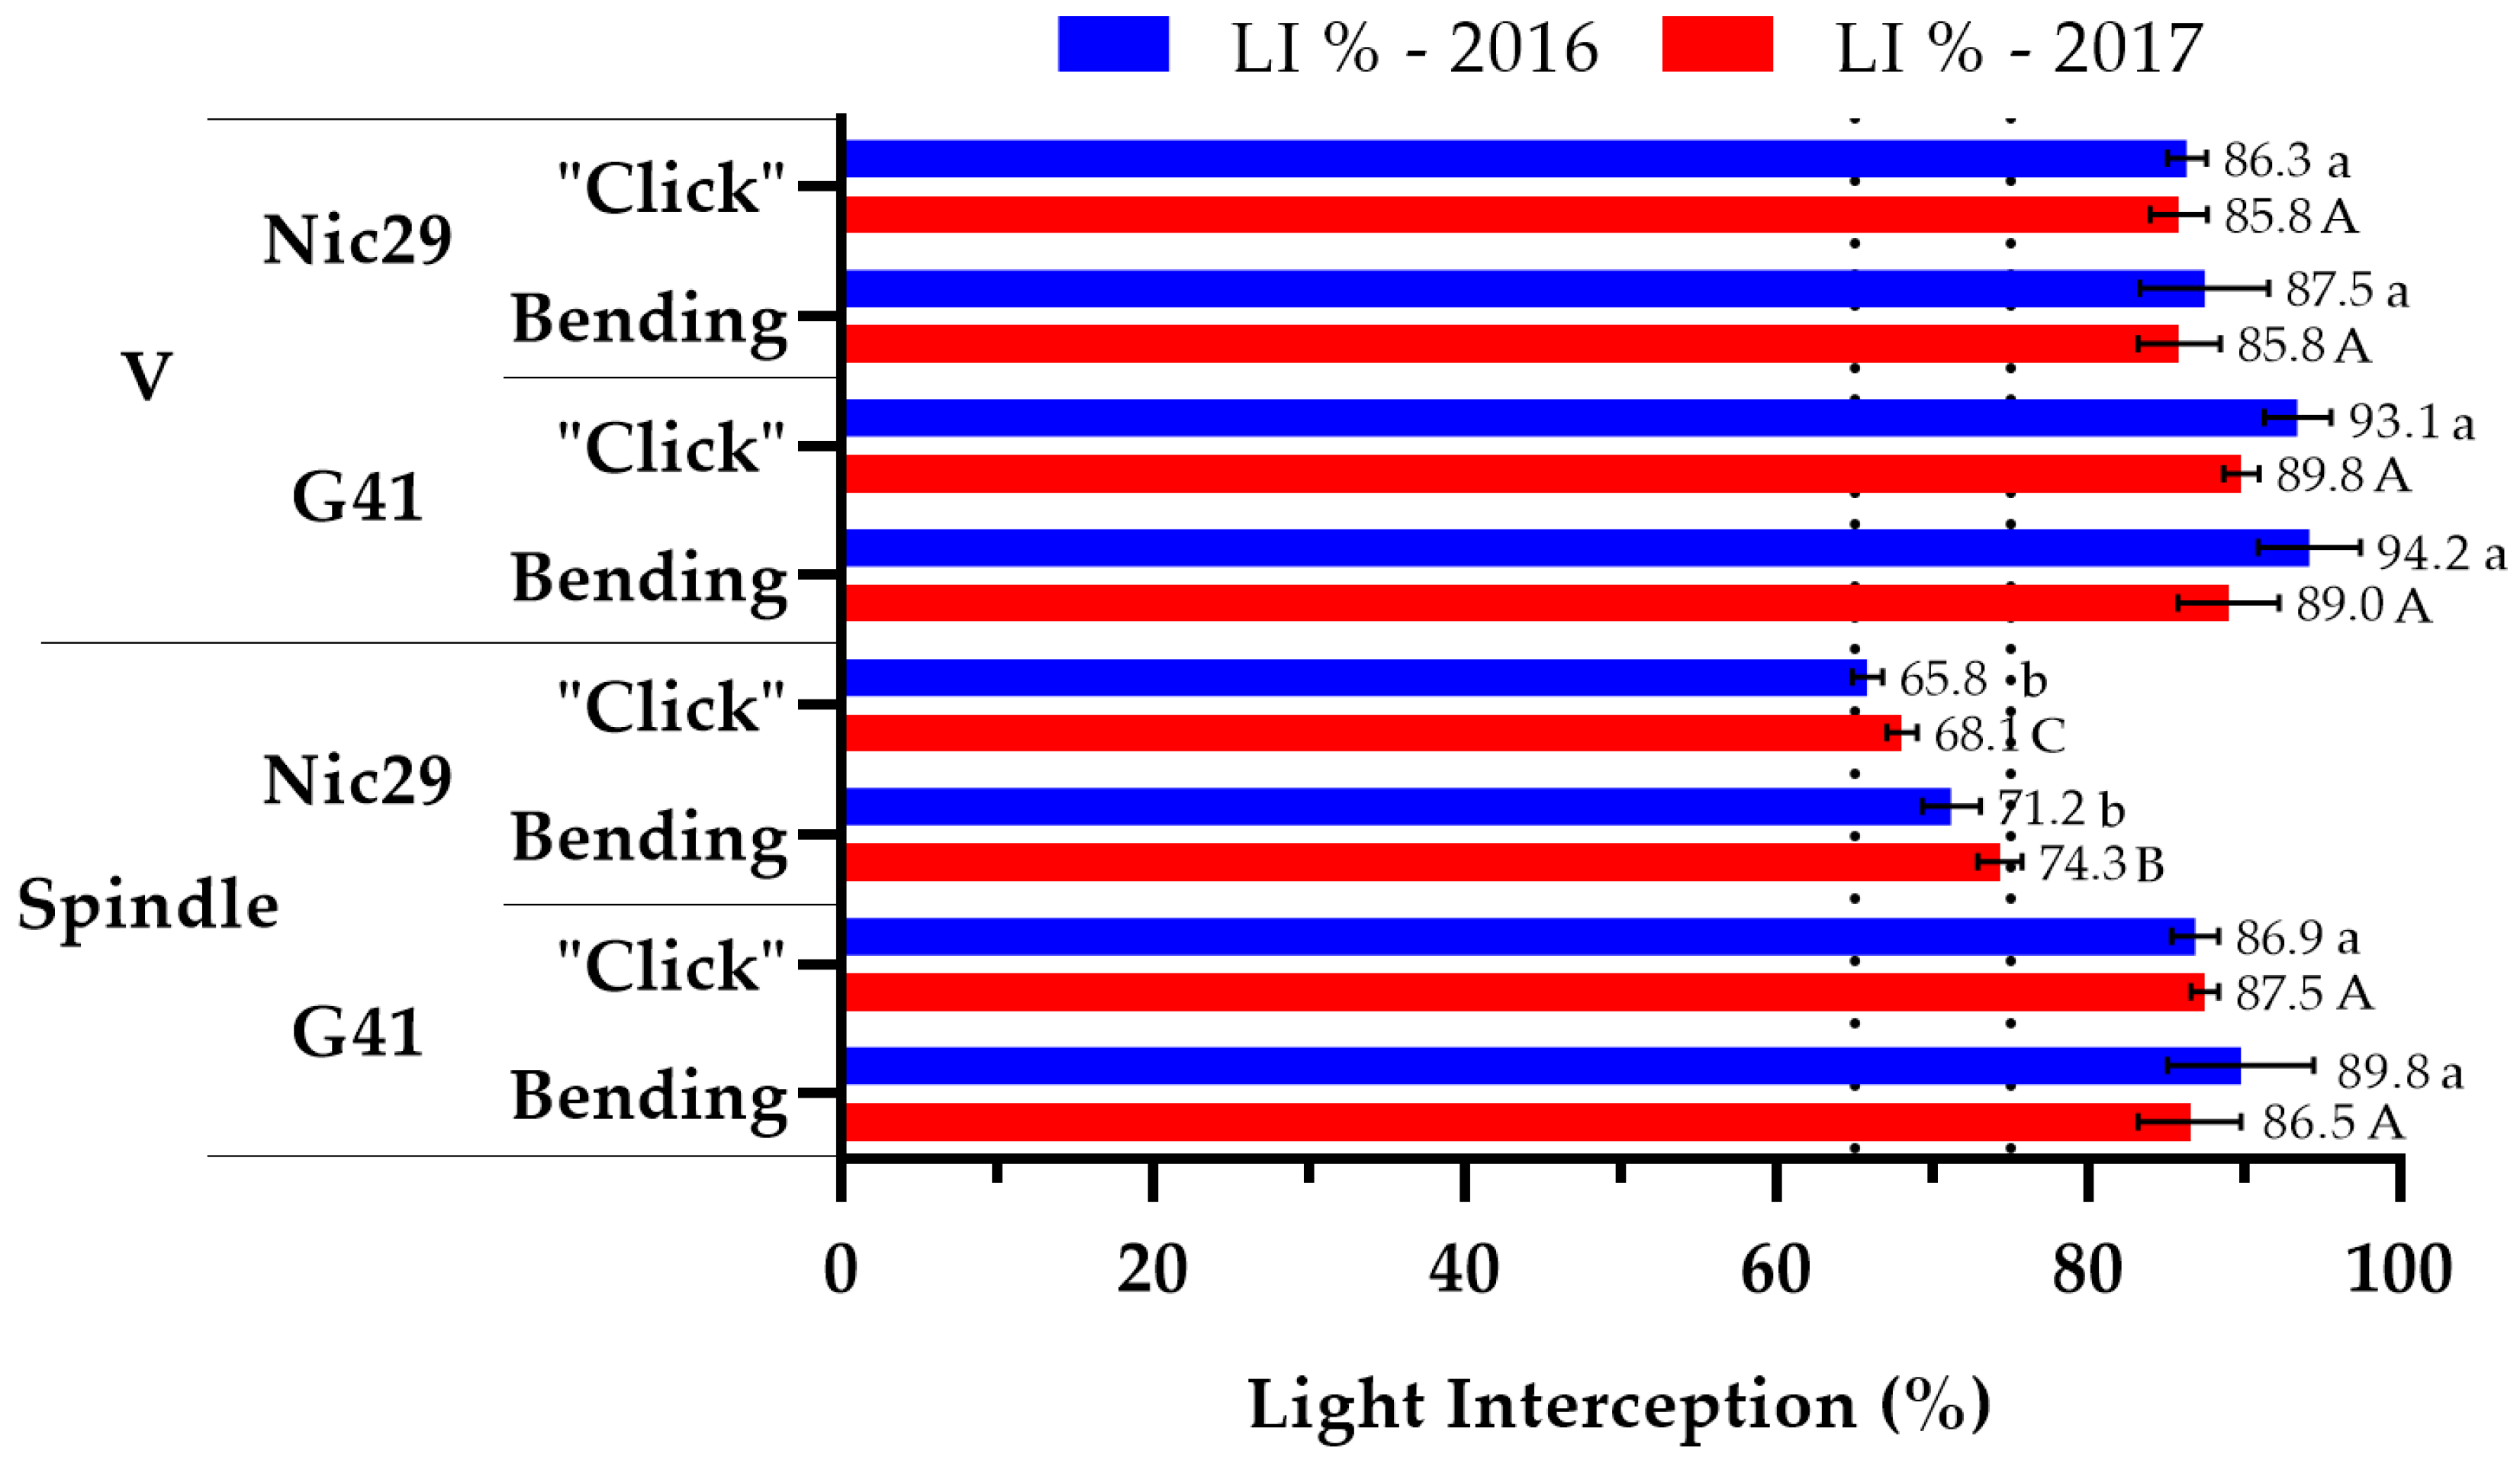
3.2. Light Interception
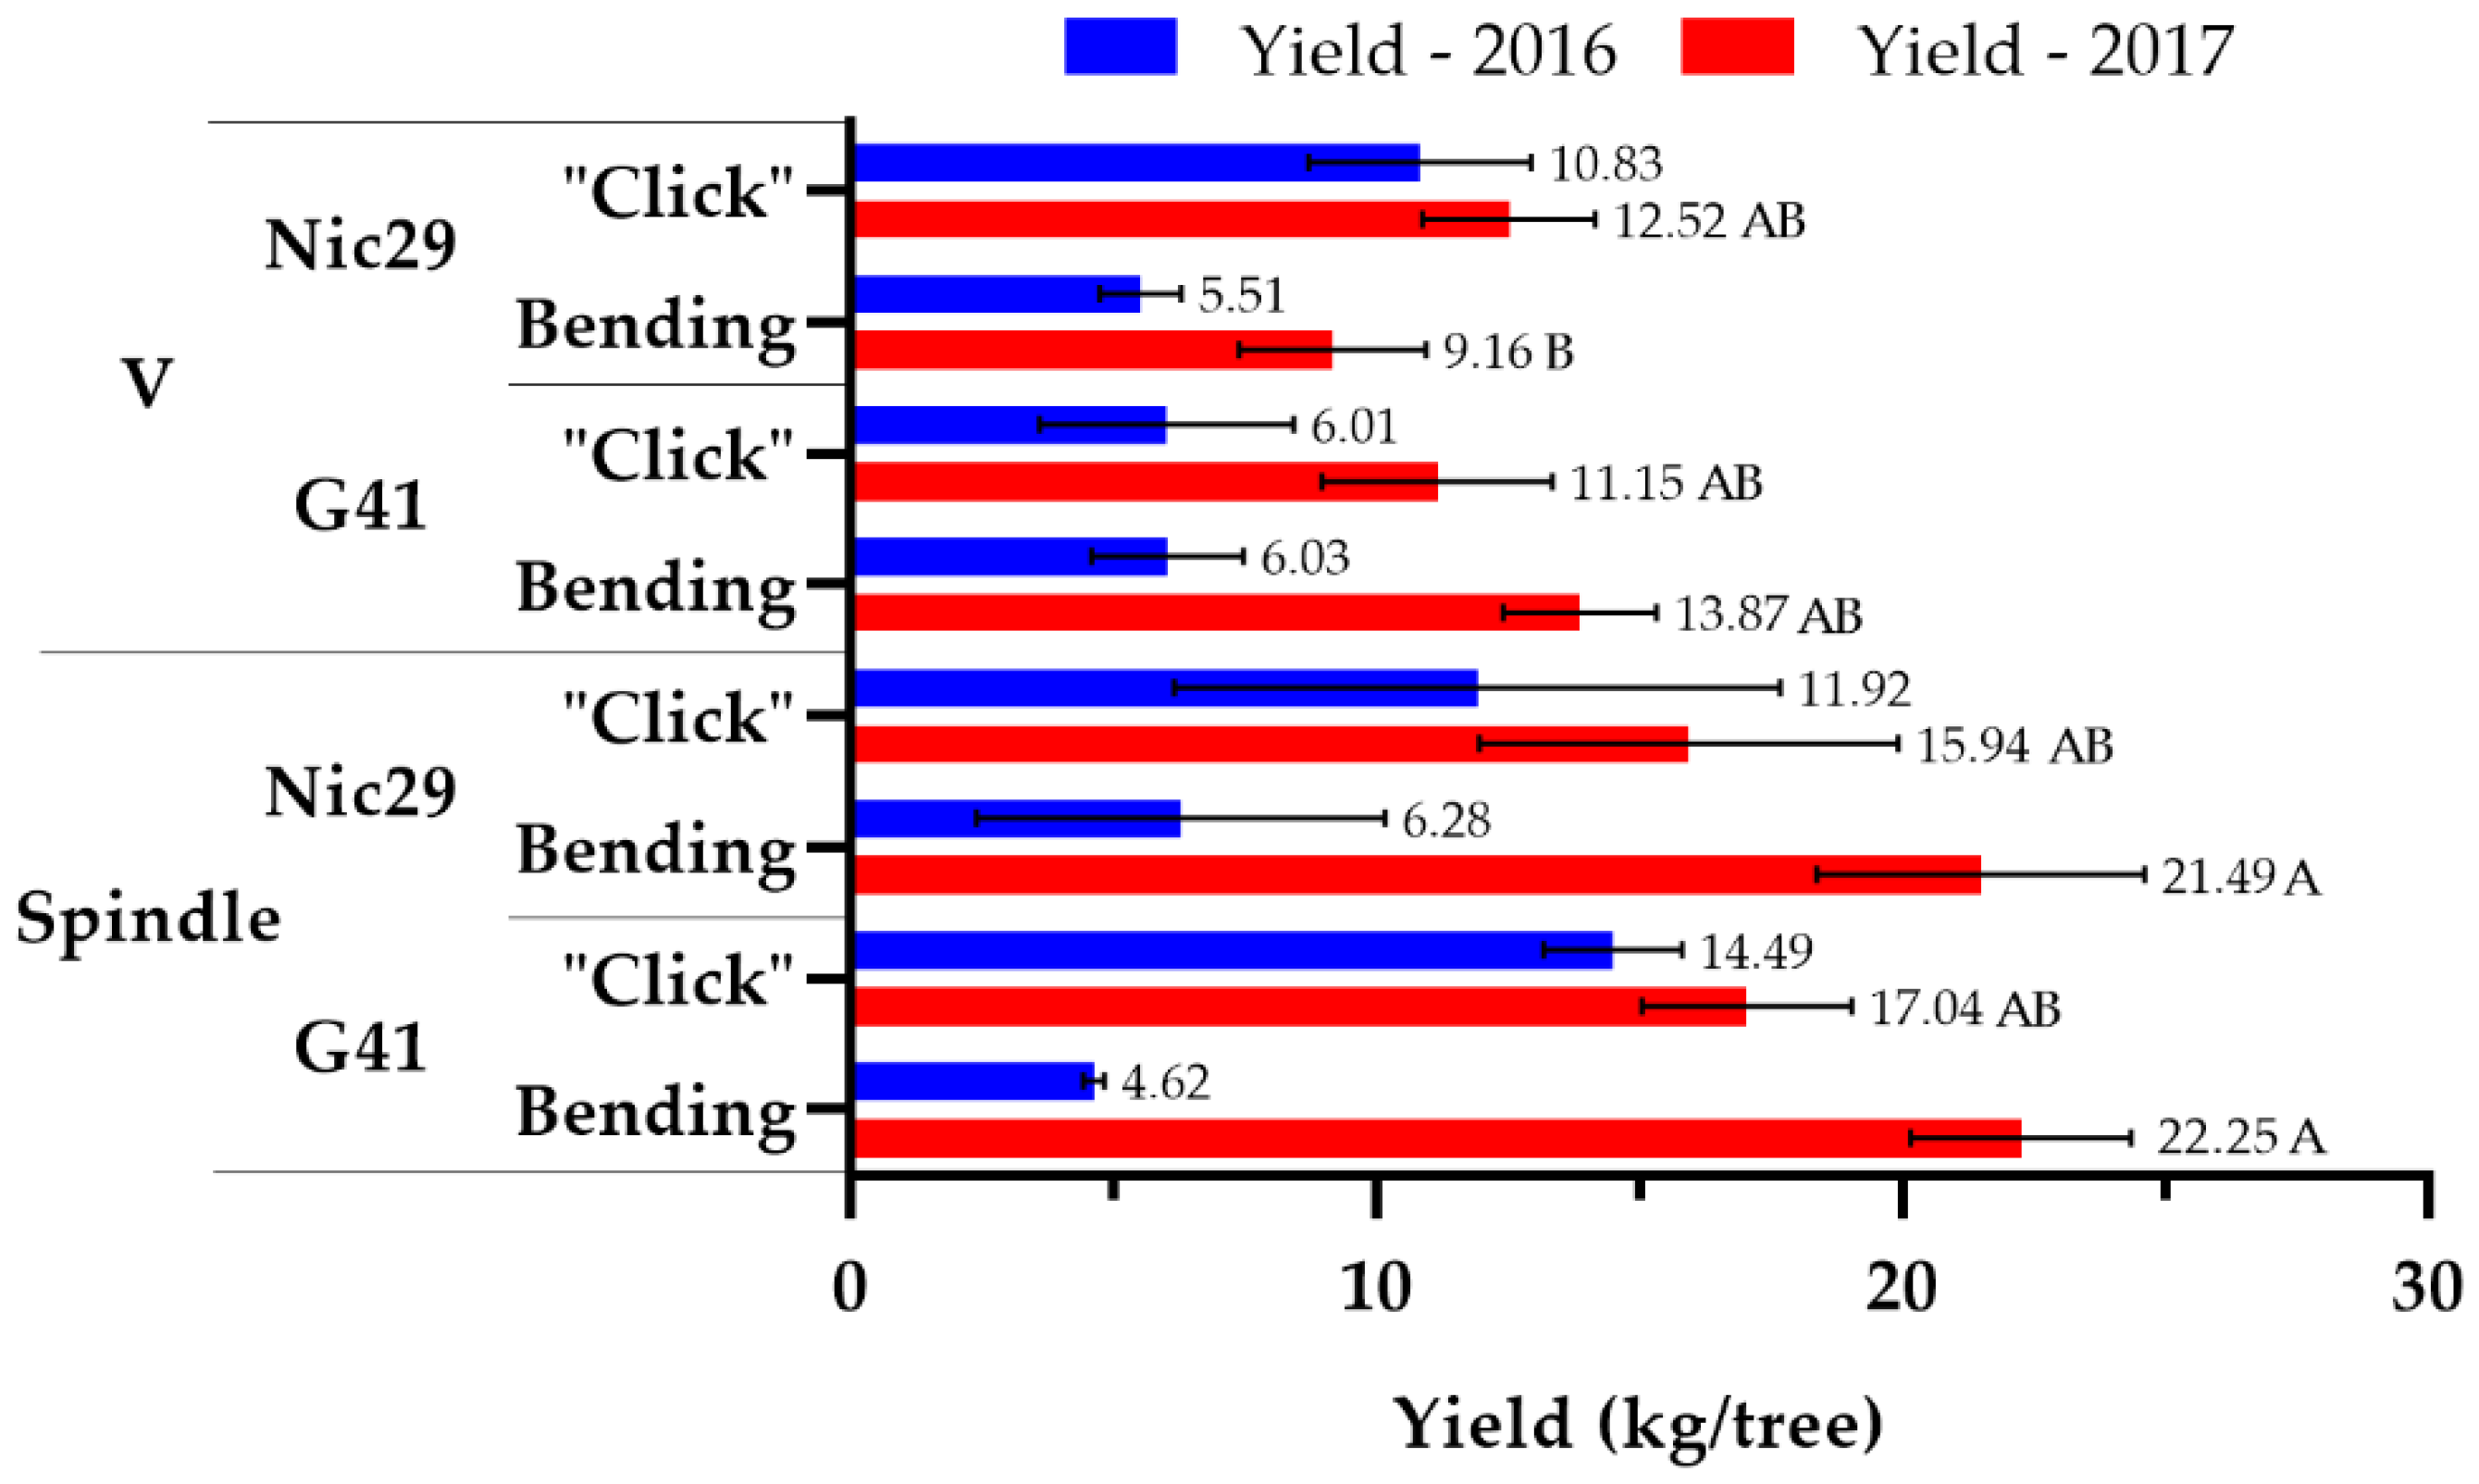
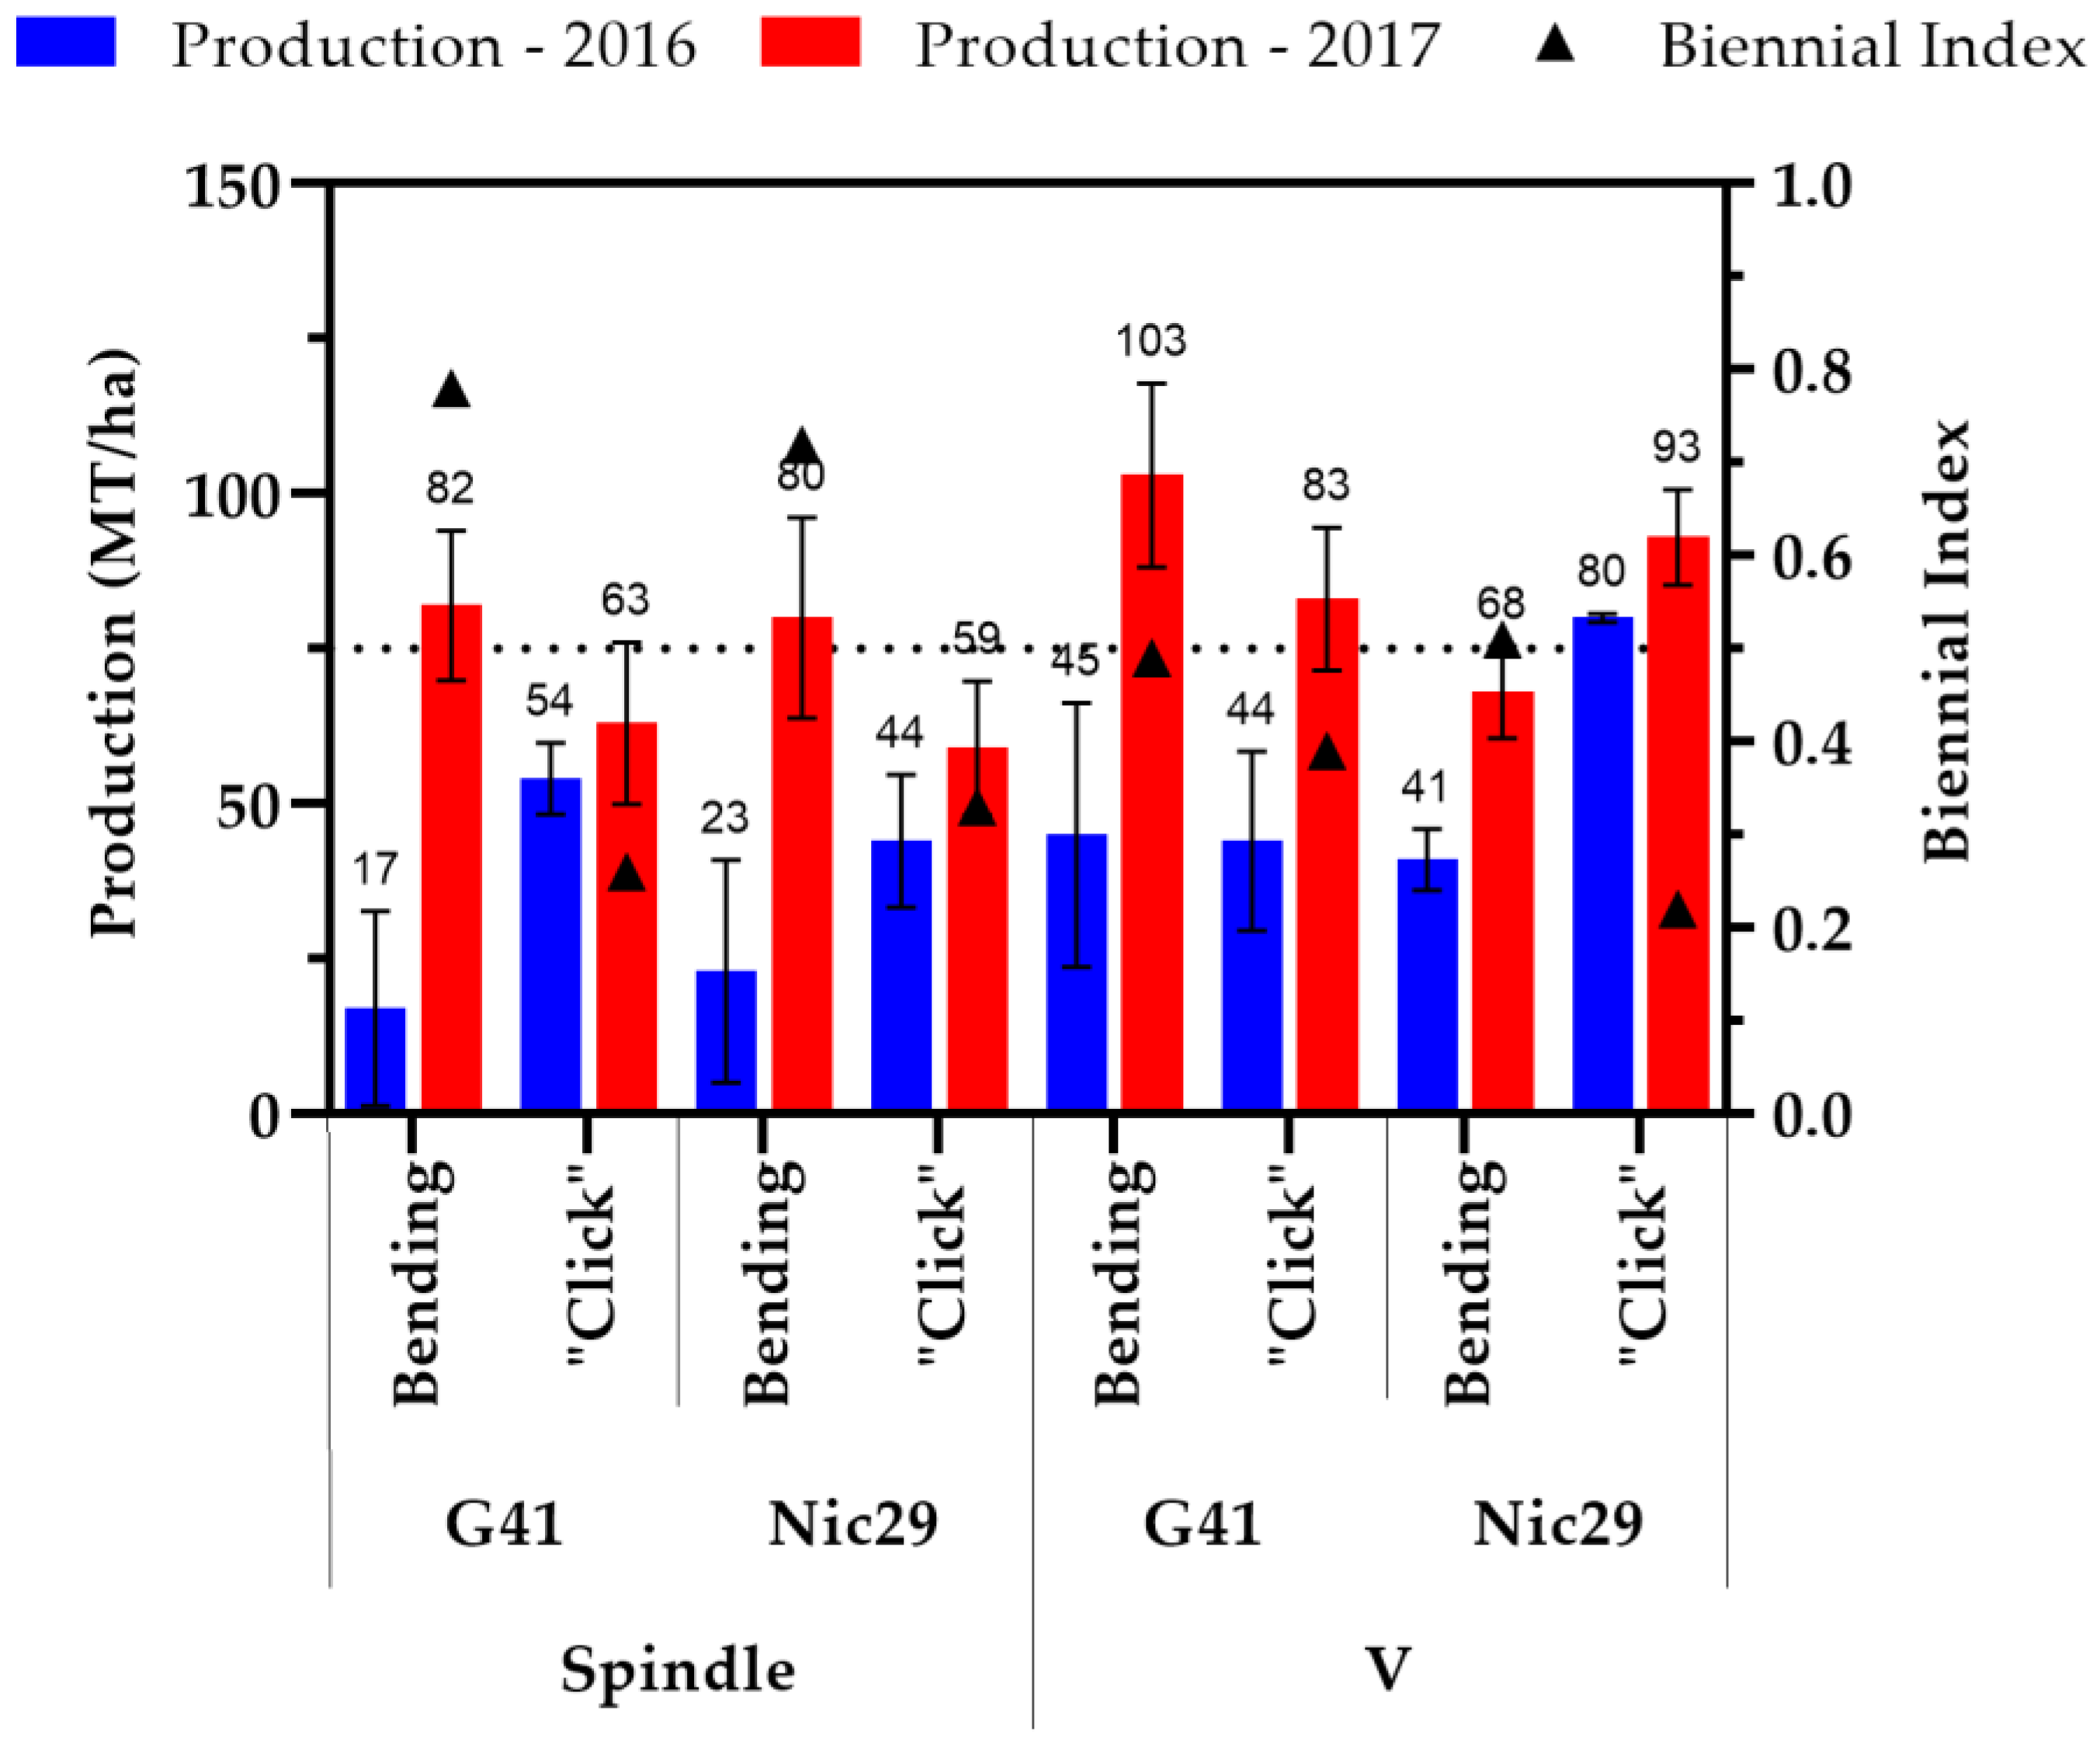
In 2016, both the training system and rootstock treatment effects on light interception were significantly different when comparing the V and Spindle, and the G41 and Nic29 means (Table 1). Where the V trees were measured, they intercepted 12% more incident light than Spindle trees. Trees grafted on G41 intercepted a significantly higher amount of light (~14%) when compared to the Nic29 (Table 1). With respect to pruning, light interception values did not differ significantly from one another (Table 1).
In 2017, Spindle and V were significantly different in their ability to intercept light, consistent with the previous year’s results (Table 2). The V-system showcased significantly higher light interception percentages when compared to Spindle. G41 trees intercepted a significantly higher amount of incident light when compared to Nic29 (Table 2). On average, trees grafted on G41 intercepted nearly 10% more incident light than Nic29 (Table 2). There were no differences in light interception across pruning treatments. A significant interaction occurred between the training system and rootstock treatments in 2017 for LI. The difference between G41 and Nic29 in Spindle was highly significant (p < 0.001) but there was no significant difference between rootstocks when compared in the V system.
The highest light interception values were all the V and the Spindle-G41-treatment combinations (Figure 3), with the least interception occurring in the Spindle-Nic29-“click” combination plot (66–68%) in 2016 and 2017, which also resulted in the lowest LAI in 2017 as well (Figure 1 and Figure 2). A significant interaction occurred between training system and rootstock. The difference between G41 and Nic29 in Spindle was significantly higher (p < 0.001) than when the rootstocks were compared in the V system (p < 0.01).

3.3. Production

In 2016, spindle trees tended to yield a slightly higher amount of apples on a kg per tree basis when compared to the V system, although there was no statistical difference. The same result was seen in fruit number per tree (Table 1). Although Spindle yielded a higher amount of fruit per tree, its production per hectare (34.5 MT/hectare (MT/ha)) was lower than the V-system (52.5 MT/ha) (Table 1). Rootstock variable did not significantly influence yield (kg/tree) when comparing G41 and Nic29, indeed they had minimal differences between their per hectare production (Table 1). Unlike the training system and rootstock effects, pruning had a significant impact on yield. “Click” pruning produced more fruit on a per tree basis with higher kg/tree amount when compared to bending (Table 1). On the other hand, the average fruit weight did not differ significantly comparing apples coming from “click” with the ones from bending (338 vs. 347 g). On a per hectare basis, “click” pruning yielding nearly two times as much as bending. “Click” pruning resulted in a significant increase in production in 2016 with 55.6 MT/ha, while bending resulted in 31.4 MT/ha (Table 1).
The Spindle-G41-“click” combination yielded the highest amount per tree with an average 43 apples at 14.5 kg/tree in 2016, whereas the minimal amount was on Spindle-G41-bending with 12 apples at 4.6 kg/tree (Figure 4). However, on a per hectare basis, V-Nic29-“click”, yielded 80 MT/ha in 2016 (fourth leaf) (Figure 5). Spindle-G41-bending maintained the lowest production on a per hectare basis as well, at 17 MT/ha (Figure 5). There were no significant interactions across treatment means with respect to production.
In 2017, spindle trees produced a significantly higher number of fruit per tree, as well as higher yields (kg/tree) than trees in the V system (Table 2). On a per hectare basis, V produced more than Spindle with 86 MT/ha versus 71 MT/ha, but with no significant difference (Table 2). Average fruit weight was not significantly different across training systems. Rootstock mean comparisons (Table 2) did not showcase any significant differences with respect to fruit count, yield (kg/tree), or production (MT/ha). However, G41 produced significantly heavier fruit (261 g) than Nic29 (213 g) (Table 2). Pruning affected fruit count/tree. “Click” trees on average produced 57 fruits per tree, whereas bending trees produced 80 fruits per tree. In contrast to 2016, “Click” and bending produced similar amounts on a per tree (kg) and per hectare (MT) basis in 2017 (Table 2). Cumulative production showcases a significant impact, with the V system outproducing Spindle (Table 2).
In 2017, the Spindle-G41/Nic29-bending treatment combinations yielded the highest production per tree with an average of 22.25 and 21.49 kg/tree, alternating drastically from 2016 with only 4.6 and 6.28 kg/tree (Figure 4). On a per hectare basis, V-G41-bending yielded the most at 103 MT, but reported a borderline biennial classification (Figure 5). Spindle-Nic29-“click” produced the lowest on a per hectare basis at 59 MT, but was highly consistent in production between 2016 and 2017 (Figure 5). There were no significant interactions across treatment means with respect to yield and production in 2017. In general, the combinations with bending pruning showed a higher tendency for biennality in comparison to “click”-pruned combinations that reported a more consistent cropping habit (Table 3 and Figure 5).

4. Discussion

4.1. Leaf Area Estimation

Robinson et al. [11] determined that LAI was correlated with LI and yield, when comparing different rootstock x training system combinations. Rootstocks contributed to the most significant differences in LAI, regarding treatments in this study. Spindle trees have the capacity to generate a higher amount of leaf area per tree to fill the canopy space, given their lower planting density. While V trees are usually smaller due to their higher planting density and requirement of vigor control to avoid inter-tree shading. The higher density in V increases the amount of leaf area per ground area, which leads to higher LAI values as tendency, even if not statistically significant (Table 1 and Table 2). So, although the Spindle trees may be larger on a per tree basis, the higher density of V trees increases LAI, and may explain the lack of difference in LAI values between Spindle and V. Increased planting density increasing LAI was demonstrated by Laužikė et al. [54].
The similarity between LAI values from the two training systems in our study may also be a result of the indirect method for LAI prediction by the canopy imager’s estimation [15]. If the trees were to be defoliated (destructive quantification=direct method), noticeable differences in LAI-Tree (m2/m3) could probably be detected, as the imager cannot detect overlapping leaves leading to underestimation [55]. However, as the LAI-Orchard (m2/m2) was estimated with the canopy imager, a general area was surveyed. Indirect estimations have been shown to be poorly suited for individual plants or trees [56]. However, the methodology adopted in this trial was validated and has demonstrated relative accuracy (± 0.19 LAI) in predicting the actual LAI [15]. With the increased spacing in Spindle, the imager is better at detecting individual trees with less interference from adjacent trees. The increased density in V results in the imager detecting leaf area from the trial tree, along with neighboring trees, leading to a potential artificially inflated LAI similar to the value reported for Spindle; this may also be the case with LI estimations.
With respect to the rootstock’s influence on leaf area production, G41 was notably more vigorous. The lack of differences in their LAI in 2016 could be attributed to the age of the tree and the sample size, because destructive defoliations that were conducted as part of a different study validated G41 having 1.41 m2 more leaf area per tree than Nic29 [57]. However, in 2017, G41 trees were estimated to have a significantly larger LAI than Nic29 ones (Table 2). The average LAI for G41 began to reach excessive levels in both years. At 2.28 (LAI) in 2016, the optimal 1.2–2.0 range was more than satisfied [40], but in 2017, at 2.50, the excessive threshold (> 2.45) was reached [58]. Exceeding these thresholds could potentially lead to diminished yields, although G41 did not demonstrate this in this study. With respect to external fruit quality, fruit developed under foliage exhibiting an LAI of more than 1.5 have been shown to be smaller and poorly colored [59]. In our study, G41 produced heavier fruit than Nic29 in both years, but this may be a result of a smaller crop load on average across G41 trees when compared to Nic29 [57]. Reduced crop load has been demonstrated to increase fruit size and weight in “WA38,” as well as other varieties [31,60]. The increased LAI in G41 may have led to increased shading and poorer colored apples in comparison to Nic29, as demonstrated in a previous trial [57]. Leaf area management will be especially important for “WA38” as it is a bi-colored apple and will need plentiful light for proper color development. Pruning plays a key role in increasing light penetration.
Pruning did not contribute to differences in LAI in both years. Again, this may be a result of the lack of detailed accuracy in the estimation method/process on individual trees. When assessing the differences in pruning, bending style tends to leave more branches unaltered and of a larger size. “Click” pruning performed at the dormancy stage, although it removes branch area, stimulates an increased leaf area response as latent buds are stimulated to grow; generating 2–3 new renewal branches/spurs where there was initially only one [6]. Therefore, the larger canopy sustained through bending may be appropriately similar (with respect to canopy size and leaf area) to the renewed canopy, stimulated through dormant winter pruning, when estimating with hemispherical photography. An additional explanation for similar LAI estimations across pruning treatments may be a result of the type IV fruiting habit [61] of “WA38.” Although branches in the bending technique may have had minimal foliage, they were terminally set with fruit. These fruiting branches, as a consequence of this type of pruning, have a tendency to excessively bend below horizontal towards the ground. The lens of the imager was then more proximate to the fruit-filled canopy, leading to an artificially inflated LAI. This is a special consideration when estimating LAI on trees that still contain fruit, which our study evaluated. Jackson [59] averaged a fruit area index (FAI) of 0.21 when attempting to estimate LAI accurately on large ‘Laxton’s Superb’ apple trees. When estimating under drooping branches, the proximity of the vegetation and/or fruit to the camera can raise the LAI value. This artificial inflation of LAI with proximity to the imager lens was documented in Knerl et al. [15].
In general, treatment combinations that included the G41 rootstocks generated higher LAIs. The only Nic29 treatment combination that resulted with a higher LAI, than the G41 combinations, was the V-Nic29-“click” treatment. This may be a result of the difficulty involved with “click” pruning in the center of the “V,” a consideration noted by Musacchi and Greene [6]. This lack of pruning and vegetative control in the center could have led to higher leaf area. This may also explain the significant interaction occurring between training systems x rootstocks for LAI.
Overall, the Spindle-Nic29-“click”, Spindle-Nic29-bending, and the V-Nic29-bending combinations were estimated with LAI values being closest to the optimal 1.2–2.0 range [41] in both years (Figure 2).

4.2. Light Interception

Light interception and distribution are equally important for high yields of premium quality fruit. LI is a function of orchard density, alley width, row orientation, canopy architecture, size, and LAI [12,62]. Whereas, light distribution modifications are achieved through dormant pruning with minimal heading cuts, summer pruning (thinning branches), and bending branches [12]. To increase LI, growers can increase planting density, reduce tractor alley spacing, orient rows north–south and increase the heights of trees [12]. With respect to LI, planting density seemed to be a primary factor in this experiment.
Planting density in V (7400 trees/hectare) is double than in Spindle (3700 trees/hectare). This led to significantly higher LI values in V when compared to Spindle in both years (Table 1 and Table 2). LI is proportional to the amount of ground area occupied by trees, reducing wasted light on the orchard floor [62]. Rom [62] stated that LI is more impacted by canopy width than height. Angled canopies, like the V system, extend over the inter-rows, increasing canopy width and maximizing orchard floor space with leaf area, which increases its’ LI capability [24]. Robinson et al. [11] demonstrated a 70% LI in a Y-trellis and only 50% in Spindle, however their planting densities were ~1250 trees and 2000 trees per hectare. Even with the lower density of the Y-trellis in their trial, the extension of the leaders over the alleyway contributed to higher LI values. Hampson et al. [47] agree that LI is largely attributed to orchard space being occupied by leaf area, which is primarily controlled by planting density. Given the increased planting densities (3700 trees/hectare in Spindle, and 7400 trees/hectare in V) in our trial, higher LI values were expected and observed (78–79% in Spindle, and 88–90% in V) although these values may be especially high due to the LI methodology adopted with the light bar positioned on the ground, in close proximity to the canopy.
Rootstock vigor can play a significant role in generating a canopy that can intercept more light. In both years, there was a significant interaction between training system x rootstock. In the V, there was not a difference in LI across rootstocks, but in the Spindle system, G41 intercepted more light than Nic29 (Figure 3). This may be explained by increased root competition and planting density in the V, limiting the vigor and decreasing leaf area development, subsequently reducing the LI ability. Spindle trees grafted on G41 have an increased ability to develop larger canopies, due to its reduced planting density and increased vigor in our soil conditions. This may be the reason for the significant difference across rootstocks in the Spindle context, and not in the V.
Treatments with larger LAIs led to higher LI values across the training system and rootstock mean comparisons. This is consistent with Barritt’s [20] study, where LAI and LI were linearly correlated (r2 = 0.91). However, this was not the case across the pruning factor.
Although bending generated, on average, a smaller LAI across canopies, these trees intercepted more light. This may be due either to the increased level of “blind wood” producing a larger canopy size occupied with less leaf area, or a result of terminally set fruit pulling branches down making it difficult for the canopy imager to estimate LAI accurately. The “click” pruning treatment mitigates “blind wood” by stubbing one-year-old shoots, generating small fruiting shoots and spurs the following year, while condensing the canopy closer towards the central axis [6]. Therefore, although LAI may be slightly larger in “click”, the canopy size and architecture may have been arranged in a way that intercepts less light, but arguably with more uniform light distribution across the canopy. Regardless of these differences, both LAI and LI across both years of pruning treatments were non-significant. The pruning treatments most significant impact on “WA38” management was with respect to yield.
“Click” pruning allows for a better distribution of light, while facilitating a high LI according to Musacchi and Greene [6]. For maximum production of high-quality fruit, both LI and penetration into the canopy must be optimized [62]. Jackson [59] stated that in order to achieve a high proportion of large, well-colored apples, canopies need to intercept high amounts of evenly distributed light. Consistent production has been attributed to optimal LI values ranging from 60% to 75% [47,48]. Wertheim et al. [63] claimed that apple production and LI are linearly correlated up to 90%, although cropping may become irregular and contain poor quality fruit at these higher levels (e.g., sunburnt fruit). When levels get above 70%, it typically indicates potential intra-tree shading in the interior and bottom of the canopy [48]. This is why pruning is a very important management task to ensure not just high LI, but evenly distributed light penetration across the canopy. Uniform light distribution allows for optimal fruit quality and flower bud development across the entirety of the canopy and orchard [64]. With optimal light levels for production and quality set in the 60% to 75% range [48,62], the treatment combinations that intercepted these optimal thresholds were the Spindle-Nic29-“click”/bending trees in both years (Figure 3). The remaining treatments with a G41 rootstock and/or in the V-system intercepted +85% light in both years. These treatment combinations, given this sample size and methodology, would then be deemed excessive and sub-optimal for consistent production of high-quality fruit.
Typically, orchard systems are not able to intercept available light above 80%, but this study’s results showcased LI values that were above 90%. This may be a result of the environmental conditions, rootstock vigor, and/or the methodology in which we sampled for LI. The light bar ceptometer measured transmitted PAR at 20 cm (in 2016) and 40 cm (in 2017) from the tree trunk (west side) at the same time (two hours prior to solar noon) throughout the summer (June–August). This distance was chosen as most of the canopy lies within the initial 50 cm of the interrow [58]. The distance was shifted further out in 2017, as the canopy expanded and would have completely shaded the light bar at 20 cm. The transmitted light can then only be described for this time (morning) and for the portion of the canopy that was intercepting light at that distance (20–40 cm) and not as the whole tree’s interception. An averaged LI measurement across the entirety of the canopy may have resulted in lowered overall values, as the canopy would have transmitted more light in the alleyway as the bar was moved further away from the tree trunk. Regardless of these methodology limitations, these LI comparisons demonstrated the relationship between excessive LI and reduced yields. This relationship was evident in the V-system, G41 rootstock, and bending treatments, indicating potential saturation levels with these horticultural selections.

4.3. Production

Yield within orchard management systems are impacted by three main factors: planting density, training and pruning, and rootstock selection [11]. If leaf area increases past optimal thresholds, shading can occur, negatively affecting production. When light is uniformly distributed across the canopy, the negative impacts of shading (reduced fruit set, flower bud initiation, fruit coloration, fruit development) can be ameliorated [12,62]. High leaf area may result in high LI, and although LI has been linearly correlated with yield, it is not always the case. Yield has been documented to increase with LI until about 50%, above this, production capability varies [12]. Barritt [20] experienced linear correlations between LI and yield (r2 = 0.80), but only monitored LI up to 50%. Furthermore, Barritt [20] observed a linear correlation between leaf area and yield (r2 = 0.86) as well, but only evaluated trees with a maximum LAI of 2.0 (below the excessive threshold). In this study, both LI and LAI were observed at thresholds higher than in Barritt’s [20] study; and at levels that have been considered excessive or unprofitable for production. This may be why weaker regressions were seen between these parameters in this study [57], as production seems to be impacted and/or reduced by other factors at these higher values.
In 2016 and 2017, yield on a per tree basis performed better in Spindle, potentially given the larger canopy of each tree. Production calculated on a per hectare basis, however, was better in the V system, given the greater density and increased number of trees per hectare. The national average of production for apple is 39 MT/ha [65]. Washington State’s average production is about ~47 MT/ha in traditional style orchards, although ~90+ MT/ha have been achieved in the state, given the higher density plantings [66]. With 34.5 MT/ha with Spindle in 2016, this would be below industry average in Washington State. However, 2016 was only the orchard’s fourth leaf, and the trees were still reaching production maturity. In 2014, the orchard had irrigation issues, which stunted the growth of trees for one year, so 2017 would be expected to be the orchard’s first year of “mature” productivity. Consequently, in 2017, Spindle, on average, yielded 71.0 MT/ha. The V-system, on average (52.5 MT/ha in 2016 and 86.4 MT/ha in 2017), surpassed Spindle in both years, but the quality of the fruit must also be taken into consideration, as heavy crop loads can negatively impact fruit quality [31,60]. The lowered production in Spindle may be a result of the orchard’s early production and/or a lack of full canopy occupancy prior to production. Additionally, it may be a result of the limited sample size of 12 trees per each training system handled in this study as to keep the sampling time window narrow, so that all trees were imaged within a similar time and light environment (two hours prior to solar noon). Further research with increased sample sizes is required to get a broader understanding of the productivity characteristics across these training systems.
Rootstock is an important factor when thinking about filling canopy space rapidly. Increased vigor can convert trees into production quickly (i.e., precocity) but, pruning and training may be a higher long-term priority in subsequent years to manage this. With the development of many similar dwarfing and semi-dwarfing genotypes, the real advantages and considerations for rootstocks tend to be for resistance to diseases and abiotic stresses [64], which is especially important in a high light environment, like Washington State [67]. The G41 rootstock was selected with this in mind, as it is tolerant to wooly apple aphid, fire blight and replant disease [6,68]. In the present study, the G41 rootstock had a lower yield efficiency (0.64 kg/cm2 TCSA) when compared to Nic29 (0.98 kg/cm2 TCSA) [57]. G41 was less efficient and produced less overall on a per hectare basis. This reduction of yield could be explained by the excessive LI and leaf area values, leading to increased shading and subsequently diminished flower buds, fruit set, and fruit weight [69].
Pruning technique had the greatest impact on yield in 2016. Bending branches has typically been done to control vigor and to increase flower bud incidence on a branch [33,61]. However, when matched with a type IV, tip bearing variety that generates “blind wood” and sets fruit terminally, the fruit excessively bends the branch. When this branch bends below horizontal, vegetative growth ceases, exhausting the branch, and vigorous suckers may occur towards the highest point of the bend [29]. It is suggested, especially in type IV varieties, that the bend of the branch does not surpass 60-degrees from the trunk insertion, and that crop load should be adjusted to reduce tip bearing on young branches [29]. Additionally, as flower buds are typically generated in the apical position on 1-year old wood in type IV trees, the bending technique leaves these terminal flower buds unregulated. This can lead to excessive yields and biennial tendencies, which were exemplified here in the results with biennial classifications (I = 0.62) for all the bending treatments (Table 3). This is where the “click” technique differs. “Click” pruning is able to reduce “blind wood” (Figure 1) by removing apical flower buds and stimulating multiple new distal fruiting shoots/sites each year as a strong reaction to the basal heading cut made and has been shown to mitigate bienniality [6]. “Click” pruning maintained a consistent bearing classification on average (I = 0.30), whereas bending resulted in an I-value of 0.62, indicating alternate bearing (Table 3). Bienniality was observed across all the bending treatment combinations (Figure 5). This study only spanned two growing seasons, so additional years of research may be required to confirm this tendency. However, in previous studies, “WA38” has shown the potential for alternate bearing when improper crop load management and pruning techniques are not customized and tailored to the variety [31]. So, although the high producing combinations V-G41-bending and Spindle-G41-bending seem promising for high yields, the implications for alternate bearing may suggest these are not optimal combinations for producing “WA38.” Treatment combinations that suggest consistent bearing and industry standard yields in “WA38” include all of the “click” pruning combinations (Figure 5).
The “click” pruning practice should occur every year during dormancy, where 20–25% of branches are renewed to ensure consistent high-quality fruit production [6] (Figure 1). However, this technique should be customized for specific cultivars. Mohammadi et al. [70] observed strong positive reactions on flowering from the “click” treatment, but it was much more effective in ‘Granny Smith’, a type IV variety, than in ‘Braeburn’, a type III variety [61]. Management techniques must always be contextualized to specific cultivars and tree habit types to meet production and quality goals. The even distribution of light, the renewed and stimulated fruiting branches/sizes, and the orientation of branches in the 40 to 45-degree position are all plausible explanations for the increased yields in the “click” treatment versus the bending (Figure 1). In addition to pruning, a phloem interruption technique, like “notching” [71], should be utilized with “WA38,” especially on the central axis to adequately fill the canopy. Notching helps mitigate “blind wood” by interrupting auxin transport in the phloem to allow lateral bud swelling and the initiation of new branches and fruiting sites [29,71]. When managing “WA38,” the “click” pruning treatment, in conjunction with notching, is suggested for “blind wood” reduction and consistent high yields, year after year.

5. Conclusions

Robinson et al. [48] enlisted five important principles for an optimal orchard system: canopies should intercept 70–75% of available light, with an even distribution of light across the entire tree (canopy width < 1 m), well-feathered nursery trees should be selected for early canopy expansion and yields, canopies trained to be compatible with mechanization, and finally that trees be planted in a density around 2700 trees/hectare (when using the Tall Spindle system). Lakso and Robinson [36] recommend canopies that maintain adequate exposure to spurs, and trees that have enough vigor to support good nutrition and water uptake, along with the strength to develop renewal branches. In observation of the results from this study, trees that are trained to a Spindle, grafted on a Nic29 rootstock (given these soil conditions; slightly sandy, 37% sand, 3% clay, 60% silt), and “click” pruned, facilitate the development of a canopy and management of an orchard that meets the aforementioned optimal criterion and principles.
The overly vigorous G41 rootstock (in this soil context) paired with the vigorous and tip-bearing “WA38,” produces a large amount of “blind wood,” saturating light interceptions levels, and potentially shades fruit and spurs. The “click” pruning technique mitigates “blind wood” and maintains a more exposed and narrower canopy, potentially facilitating higher amounts of light on spurs and developing fruit for optimal coloration and yield. On average, the Spindle-Nic29-“click” combination maintains industry standards and optimal thresholds for LAI (1.48–1.93), light interception (66–68%), and showcases consistent bearing tendencies (I = 0.33) (Figure 2, Figure 3 and Figure 5). This sequence of choices and orchard practices can represent a potential optimal management strategy for “WA38,” given these environmental and soil conditions of this apple growing area in Wenatchee (WA).

Author Contributions

Conceptualization, B.A., S.S., and S.M.; methodology, B.A.; software, B.A.; validation, B.A., S.S., and S.M.; formal analysis, B.A., S.S., and S.M.; investigation, B.A., S.S., and S.M.; resources, S.M.; data curation, B.A.; writing—original draft preparation, B.A.; writing—review and editing, B.A., S.S., and S.M.; visualization, B.A.; supervision, S.S. and S.M.; project administration, S.S. and S.M.; funding acquisition, S.M. All authors have read and agreed to the published version of the manuscript.

Funding

This research was funded by the USDA National Institute of Food and Agriculture Hatch project 1014919, titled “Crop Improvement and Sustainable Production Systems” (WSU reference 00011).

Acknowledgments

The authors would like to acknowledge Stefan Roeder and Angela Knerl for their help in data acquisition.

Conflicts of Interest

The authors declare no conflict of interest.

References

  1. Corelli-Grappadelli, L.; Lakso, A.N. Is maximizing orchard light interception always the best choice? In VIII International Symposium on Canopy, Rootstocks and Environmental Physiology in Orchard Systems. Acta Hortic. 2007, 732, 507–518. [Google Scholar] [CrossRef]
  2. Stephan, J.; Sinoquet, H.; Donès, N.; Haddad, N.; Talhouk, S.; Lauri, P.É. Light interception and partitioning between shoots in apple cultivars influenced by training. Tree Phys. 2008, 28, 331–342. [Google Scholar] [CrossRef] [PubMed] [Green Version]
  3. Buler, Z.; Mika, A. Evaluation of the ‘Mikado’ tree training system versus the spindle form in apple trees. J. Fruit Orn. Plant Res. 2004, 12, 49–60. [Google Scholar]
  4. Musacchi, S. Training system and management for a high density orchard of ‘Abbe Fetel’. Acta Hortic. 2011, 909, 225–240. [Google Scholar] [CrossRef]
  5. Musacchi, S.; Lugli, S. High density planting for sweet cherry orchards. Acta Hortic. 2014, 1020, 489–496. [Google Scholar] [CrossRef]
  6. Musacchi, S.; Greene, D. Innovations in Apple Tree Cultivation to Manage Crop Load and Ripening. In Achieving Sustainable Cultivation of Apples; Evans, K., Ed.; Burleigh Dodds Science Publishing: Cambridge, UK, 2017; pp. 195–237. [Google Scholar]
  7. Palmer, J.W. Computed Effects of Spacing on Light Interception and Distribution within Hedgerow Trees in Relation to Productivity. In Symposium on Research and Development on Orchard and Plantation Systems. Acta Hortic. 1980, 114, 80–88. [Google Scholar]
  8. Robinson, T.L.; Lakso, A.N. Bases of yield and production efficiency in apple orchard systems. J. Am. Soc. Hort. Sci. 1991, 116, 188–194. [Google Scholar] [CrossRef] [Green Version]
  9. Jackson, J.E.; Palmer, J.W. Interception of light by model hedgerow orchards in relation to latitude, time of year and hedgerow configuration and orientation. J. App. Ecol. 1972, 9, 341–357. [Google Scholar] [CrossRef]
  10. Palmer, J.W. The effects of row orientation, tree height, time of year and latitude on light interception and distribution in model apple hedgerow canopies. J. Hort. Sci. 1989, 64, 137–145. [Google Scholar] [CrossRef]
  11. Robinson, T.L.; Wünsche, J.; Lakso, A. The Influence of Orchard System and Pruning Severity on Yield, Light Interception, Conversion Efficiency, Partitioning Index and Leaf Area Index. In V International Symposium on Orchard and Plantation Systems. Acta Hortic. 1992, 349, 123–128. [Google Scholar]
  12. Wünsche, J.N.; Lakso, A.N. Apple tree physiology: Implications for orchard and tree management. Compact Fruit Tree 2000, 33, 82–88. [Google Scholar]
  13. Khosravi, S.; Namiranian, M.; Ghazanfariz, H.; Shirvani, A. Estimation of leaf area index and assessment of its allometric equations in oak forests: Northern Zagros, Iran. J. For. Sci. 2012, 58, 116–122. [Google Scholar] [CrossRef] [Green Version]
  14. Lakso, A.N. Characterizing apple tree canopies by fisheye photography. HortScience 1976, 11, 404–405. [Google Scholar]
  15. Knerl, A.; Anthony, B.; Serra, S.; Musacchi, S. Optimization of leaf area estimation in a high-density apple orchard using hemispherical photography. HortScience 2018, 53, 799–804. [Google Scholar] [CrossRef] [Green Version]
  16. Bréda, N.J. Ground-based measurements of leaf area index: A review of methods, instruments and current controversies. J. Exp. Bot. 2003, 54, 2403–2417. [Google Scholar] [CrossRef] [PubMed]
  17. Liu, C.; Kang, S.; Li, F.; Li, S.; Du, T. Canopy leaf area index for apple tree using hemispherical photography in arid region. Sci. Hort. 2013, 164, 610–615. [Google Scholar] [CrossRef]
  18. Chen, J.M.; Rich, P.M.; Gower, S.T.; Norman, J.M.; Plummer, S. Leaf area index of boreal forests: Theory, techniques, and measurements. J. Geophys. Res. Atmos. 1997, 102, 29429–29443. [Google Scholar] [CrossRef]
  19. Palmer, J.W.; Jackson, J.E. Seasonal light interception and canopy development in hedgerow and bed system apple orchards. J. App. Ecol. 1977, 14, 539–549. [Google Scholar] [CrossRef]
  20. Barritt, B.H. Influence of orchard system on canopy development, light interception and production of third-year Granny Smith apple trees. In IV International Symposium on Research and Development on Orchard and Plantation Systems. Acta Hortic. 1989, 243, 121–130. [Google Scholar] [CrossRef]
  21. Lakso, A.N. Correlations of fisheye photography to canopy structure, light climate, and biological responses to light in apple trees. J. Am. Soc. Hort. Sci. 1980, 105, 43–46. [Google Scholar]
  22. Lakso, A.N. Characterization of apple tree light climate with hemispherical photography. In Symposium on High Density Planting. Acta Hortic. 1978, 65, 71–72. [Google Scholar] [CrossRef]
  23. Wertheim, S.J. Pruning of slender spindle type trees. Acta Hortic. 1978, 65, 173–180. [Google Scholar] [CrossRef]
  24. Robinson, T.L. V-Shaped Apple Planting Systems. Acta Hortic. 1998, 513, 337–348. [Google Scholar] [CrossRef]
  25. Rom, C. Coordination of root and shoot growth: Rootstocks, roots, and rootstocks. In Tree Fruit Physiology: Growth and Development: A Comprehensive Manual for Regulating Deciduous Tree Fruit Growth and Development; Good Fruit Grower: Yakima, WA, USA, 1996; pp. 53–68. [Google Scholar]
  26. Warner, J. Rootstock affects primary scaffold branch crotch angle of apple trees. HortScience 1991, 26, 1266–1267. [Google Scholar] [CrossRef] [Green Version]
  27. Miller, S.S.; Hott, C.; Tworkoski, T. Shade effects on growth, flowering and fruit of apple. J. App. Hort. 2015, 17, 101–105. [Google Scholar] [CrossRef]
  28. Cain, J.C. Hedgerow orchard design for most efficient interception of solar radiation. Effects of tree size, shape, spacing, and row direction. N. Y. St. Agric. Exp. Stn. Search Agric. 1972, 2, 1–14. [Google Scholar]
  29. Ferree, D.C.; Schupp, J.R. Pruning and training physiology. In Apples: Botany, Production and Uses; CABI Publishing: Cambridge, UK, 2003; pp. 319–344. [Google Scholar]
  30. He, L.; Schupp, J. Sensing and automation in pruning of apple trees: A review. Agronomy 2018, 8, 211. [Google Scholar] [CrossRef] [Green Version]
  31. Anthony, B.; Serra, S.; Musacchi, S. Optimizing crop load for new apple cultivar: “WA38”. Agronomy 2019, 9, 107. [Google Scholar] [CrossRef] [Green Version]
  32. Lespinasse, J.M.; Chol, P.; Dupin, J.; Terenne, E. La conduite du Pommier: Types de Fructification, Incidence sur la conduite de l’arbre; Brochure INVUFLEC: Paris, France, 1977; p. 80. [Google Scholar]
  33. Giulivo, C. Basic considerations about pruning deciduous fruit trees. Adv. Hort. Sci. 2011, 25, 129–142. [Google Scholar]
  34. Forshey, C.G.; Elfving, D.C.; Stebbins, R.L. Training and Pruning Apple and Pear Trees; American Society for Horticultural Science: Alexandria, VA, USA, 1992; p. 166. [Google Scholar]
  35. Robinson, T. Advances in apple culture worldwide. Revista Brasileira de Fruticultura 2011, 33, 37–47. [Google Scholar] [CrossRef] [Green Version]
  36. Lakso, A.N.; Robinson, T.L. Sunlight, yield and productivity of apples. N. Y. Fruit Q. 2014, 22, 5–7. [Google Scholar]
  37. Palmer, J.W. Light, canopies, fruit and dollars. Compact Fruit Tree 1999, 32, 119–122. [Google Scholar]
  38. Robinson, T.L.; Lakso, A.N.; Ren, Z. Modifying apple tree canopies for improved production efficiency. HortScience 1991, 26, 1005–1012. [Google Scholar] [CrossRef] [Green Version]
  39. Corelli-Grappadelli, L.; Lakso, A.N.; Flore, J.A. Early season patterns of carbohydrate partitioning in exposed and shaded apple branches. J. Am. Soc. Hort. Sci. 1994, 119, 596–603. [Google Scholar] [CrossRef] [Green Version]
  40. Schechter, I.; Proctor, J.T.A.; Elfving, D.C. Reappraisal of seasonal apple fruit growth. Can. J. Plant Sci. 1993, 73, 549–556. [Google Scholar] [CrossRef]
  41. Jackson, J.E. Utilization of light resources by HDP systems, In Symposium on High Density Planting 65. Acta Hortic. 1978, 65, 61–70. [Google Scholar] [CrossRef]
  42. Faust, M. Physiology of Temperate Zone Fruit Trees; John Wiley & Sons, Inc.: Hoboken, NJ, USA, 1989. [Google Scholar]
  43. Heinecke, A.J. The microclimate of fruit trees III the effect of tree size on light penetration and leaf area in red Delicious apple trees. J. Am. Soc. Hort. Sci. 1964, 85, 33–41. [Google Scholar]
  44. McDonald, M.S. Photobiology of Higher Plants; John Wiley & Sons: Hoboken, NJ, USA, 2003. [Google Scholar]
  45. Mika, A. Treatments improving illumination of the fruiting zone of the tree. Reg. Photosynth. Fruit Trees 1986, 8, 42–45. [Google Scholar]
  46. Bepete, M.; Lakso, A.N. Differential effects of shade on early-season fruit and shoot growth rates in ‘Empire’ apple. HortScience 1998, 33, 823–825. [Google Scholar] [CrossRef] [Green Version]
  47. Hampson, C.; Quamme, H.; Brownlee, R. Tree density or training system-What is important in apple orchard design? Compact. Fruit Tree 2002, 35, 48–50. [Google Scholar]
  48. Robinson, T.; Hoying, S.; Sazo, M.M.; DeMarree, A.; Dominguez, L. A vision for apple orchard systems of the future. N. Y. Fruit Q. 2013, 21, 11–16. [Google Scholar]
  49. Olszewski, T.; Mika, A. Planting density effects on mineral composition of leaves and fruits of Macspur apples. Acta Hortic. 1986, 160, 259–260. [Google Scholar]
  50. Ferree, D.C. Early performance of two apple cultivars in three training systems. HortScience 1994, 29, 1004–1007. [Google Scholar] [CrossRef] [Green Version]
  51. Serra, S.; Leisso, R.; Giordani, L.; Kalcsits, L.; Musacchi, S. Crop load influences fruit quality, nutritional balance, and return bloom in ‘Honeycrisp’ apple. HortScience 2016, 51, 236–244. [Google Scholar] [CrossRef]
  52. Zhang, J.; Whiting, M.D.; Zhang, Q. Diurnal pattern in canopy light interception for tree fruit orchard trained to an upright fruiting offshoots (UFO) architecture. Biosyst. Eng. 2015, 129, 1–10. [Google Scholar] [CrossRef]
  53. Hoblyn, T. Studies in biennial bearing. J. Pomol. Hortic. Sci. 1936, 14, 39–76. [Google Scholar] [CrossRef]
  54. Laužikė, K.; Samuolienė, G.; Uselis, N. The impact of light penetration into canopy and seasonality on photosynthetic indices in apple tree leaves. AGROFOR Int. J. 2019, 4, 18. [Google Scholar]
  55. Peper, P.J.; McPherson, E.G. Comparison of five methods for estimating leaf area index of open-grown deciduous trees. J. Arbor. 1998, 24, 98–111. [Google Scholar]
  56. Chianucci, F.; Cutini, A. Digital hemispherical photography for estimating forest canopy properties: Current controversies and opportunities. IForest 2012, 5, 290–295. [Google Scholar] [CrossRef] [Green Version]
  57. Anthony, B.; Serra, S.; Musacchi, S. Optimizing “WA38” Management; Tree Fruit Research and Extension Center, Washington State University: Wenatchee, WA, USA, 2017; Unpublished data.
  58. Verheij, E.W.M.; Verwer, F.L.J.A.W. Light studies in a spacing trial with apple on a dwarfing and a semi-dwarfing rootstock. Sci. Hort. 1973, 1, 25–42. [Google Scholar] [CrossRef]
  59. Jackson, J.E. Aspects of light climate within apple orchards. J. App. Ecol. 1970, 7, 207–216. [Google Scholar] [CrossRef]
  60. Wünsche, J.N.; Ferguson, I.B. Crop load interactions in apple. Hort. Rev. 2005, 31, 231–290. [Google Scholar]
  61. Lespinasse, J.M.; Delort, J.F. Apple Tree Management in Vertical Axis: Appraisal after Ten Years of Experiments. In III International Symposium on Research and Development on Orchard and Plantation Systems. Acta Hortic. 1984, 160, 139–156. [Google Scholar]
  62. Rom, C.R. Light thresholds for apple tree canopy growth and development. HortScience 1991, 26, 989–992. [Google Scholar] [CrossRef] [Green Version]
  63. Wertheim, S.J.; Wagenmaker, P.S.; Bootsma, J.H.; Groot, M.J. Orchard systems for apple and pear; conditions for success. Acta Hortic. 2001, 557, 209–227. [Google Scholar] [CrossRef]
  64. Hrotkó, K. Development in fruit trees production systems. AgroLife Sci. J. 2013, 2, 28–35. [Google Scholar]
  65. USDA National Agricultural Statistics Service. NASS—Quick Stats. USDA National Agricultural Statistics Service. Available online: https://www.nass.usda.gov/Data_and_Statistics/index.php (accessed on 27 March 2020).
  66. Warner, G. Taking Yields to the Limit. Good Fruit Grower, 2015. Available online: http://www.goodfruit.com/taking-yields-to-the-limit/ (accessed on 9 September 2017).
  67. Mupambi, G.; Layne, D.R.; Kalcsits, L.A.; Musacchi, S.; Serra, S.; Schmidt, T.; Hanrahan, I. Use of Protective Netting in Washington State Apple Production; Washington State University Extension: Pullman, WA, USA, 2019. [Google Scholar]
  68. Fazio, G.; Aldwinckle, H.; Robinson, T. Unique characteristics of Geneva® apple rootstocks. N. Y. Fruit Q. 2013, 21, 25–28. [Google Scholar]
  69. Wünsche, J.N.; Palmer, J.W. Comparison of non-destructive methods of estimating leaf area in apple tree canopies. Acta Hortic. 1996, 451, 701–708. [Google Scholar] [CrossRef]
  70. Mohammadi, A.; Mahmoudi, M.J.; Rezaee, R. Vegetative and reproductive responses of some apple cultivars (Malus domestica Borkh.) to heading back pruning. Int. J. Agriscience 2013, 3, 628–635. [Google Scholar]
  71. Greene, D.W.; Autio, W.R. Notching techniques increase branching of young apple trees. J. Am. Soc. Hort. Sci. 1994, 119, 678–682. [Google Scholar] [CrossRef]
Figure 1. (A),(B) Pictures depict the “click” pruning method of shortening one-year-old wood and heading shoots with crotch angles around 45-degrees. This helps inhibit terminal fruiting, which bends the branch below 90-degrees and exhausts it. The “click” pruning in (A) and (B) also demonstrate the reduction of “blind wood” on the branches with a high incidence of flower buds across the totality of the branches. Whereas, the “bending” method (C) demonstrates the onset of “blind wood” (orange arrows) toward the basal portion of the shoots. Note that without the “click” pruning in (C), only the terminal tip flowers are predominantly present, as little lateral bud swelling has been stimulated.
Agronomy 10 00689 g001
Figure 2. Average leaf area index (LAI) non-destructive estimations across all treatment combinations in the summers (June–August) 2016 and 2017 for “WA38” trees grown in Washington State. ANOVA indicated non-significant differences in 2016 (no lower-cased letters displayed) and a significance of: ** < 0.01 in 2017 (upper-cased letters). Student–Newman–Keuls (SNK) test for mean comparisons across all 8 combinations within a given year. Means to the right of each bar in the chart with the same letter indicate non-significance at p-value < 0.05. No differences among combinations in 2016, so no letters appear. Dashed vertical black lines indicate minimum and maximum optimal LAI thresholds based on literature. Errors bars ± SE, N = 3 trees.
Agronomy 10 00689 g002
Figure 3. Average light interception (LI %) at 20 cm (2016) and 40 cm (2017) from each trial tree across all treatment combinations in the summer (June–August) for “WA38” trees grown in Washington State in 2016 and 2017. ANOVA indicated significance: *** (p < 0.001) for both 2016 (lower-cased letters) and 2017 (upper-cased letters). Student–Newman–Keuls (SNK) test for mean comparisons. Means to the right of each bar in the chart with the same letter indicate non-significance at p-value < 0.05. Dashed vertical black lines indicate minimum and maximum LI % optimal thresholds based on literature. Errors bars ± SE, N = 11 trees for Spindle plots, N = 10 trees for V plots.
Agronomy 10 00689 g003
Figure 4. Yield (kg/tree) across all treatment combinations at harvest for “WA38” trees grown in Washington State in 2016 and 2017. ANOVA indicated no significance in 2016 and a significance of: * < 0.05 in 2017 (upper-cased letters). Student–Newman–Keuls (SNK) test for mean comparisons across all treatments within a given year. Means to the right of each bar in the chart with the same letter indicate non-significance at p-value < 0.05. No treatment differences in 2016, so no letters appear. Errors bars ± SE, N = 3 trees.
Agronomy 10 00689 g004
Figure 5. Yield (MT/ha) and biennial index (I) across all treatment combinations at harvest for “WA38” trees grown in Washington State in 2016 and 2017. ANOVA indicated no significance in 2016 and 2017 for calculated production. Biennial index (black triangles) from Hoblyn et al. [53] comparing fruit count in 2016 and 2017. The classifications are quantified as: I = 0.90–1.00 = Strongly Biennial, 0.50–0.89 = Biennial, 0.10–0.49 = Consistent, 0.00–0.09 = Strongly Consistent. Black dashed line indicates the “biennial” classification threshold at 0.50. Errors bars ± SE, N = 3.
Agronomy 10 00689 g005
Table 1. The effects of the training system, rootstock, and pruning technique on leaf area index (LAI) (m2/m2), light interception (LI) fruit count (number of fruit/tree), yield (kg/tree), average fruit weight (g) and production (MT/ha) for “WA38” trees grown in Wenatchee area in Washington State in 2016.
TreatmentVariablesLAI (m2/m2)LI (%)Fruit Count/Tree
(No.)
2016
Yield (kg/Tree)
Average Fruit Weight (g)2016
Production (MT/ha)
Training system (T)Spindle1.9878.4 B289.3335734.5
V2.1690.4 A227.1032952.5
Significancens***nsnsnsns
Rootstock (R)Geneva® 412.2890.9 A237.7935240.0
M9 – Nic291.8577.3 B278.6433347.1
Significancens***nsnsnsns
Pruning technique (P)bending1.9385.416 B5.61 B34731.4 B
“click”2.2082.833 A10.81 A33855.6 A
Significancensns**ns*
ns, *, *** indicate no significance or significance at p-values of <0.05, 0.01, or 0.001. Student–Newman–Keuls (SNK) test for mean comparisons; means in columns with the same letter indicate non-significance at p-value < 0.05; LAI and LI values are averages of three measurements from June–August in 2016.
Table 2. The effects of the training system, rootstock, and pruning technique on leaf area index (LAI) (m2/m2), light interception (LI) (%), fruit count (number of fruit/tree), yield (kg/tree), average fruit weight (g), production (MT/ha) and total production (MT/ha, 2016 and 2017) for “WA38” trees grown in Wenatchee area in Washington State in 2017.
TreatmentVariablesLAI
(m2/m2)
LI
(%)
Fruit Count
(No.)
2017
Yield (kg/Tree)
Average Fruit Weight (g)2017
Production (MT/ha)
Total Production (MT/ha) 2016–2017
Training system (T)Spindle2.0979.1 B86 A19.18 A23671.0105.6 B
V2.2887.6 A51 B11.68 B23886.4139.0 A
Significancens*******nsns*
Rootstock (R)Geneva® 412.49 A88.1 A6316.08261 A82.7122.6
M9 – Nic291.87 B78.2 B7514.78213 B74.8121.9
Significance******nsns*nsns
Pruning technique (P)bending2.1383.780 A16.6922283.1114.5
“click”2.2482.557 B14.1625374.3130.0
Significancensns*nsnsnsns
ns, *, **, *** indicate no significance or significance at p-values of < 0.05, 0.01, or 0.001. Student–Newman–Keuls (SNK) test for mean comparisons. Means in columns with the same letter indicate non-significance at p-value < 0.05. LAI and LI values are averages of three measurements from June–August in 2017.
Table 3. The effects of the training system, rootstock, and pruning technique on the biennial index and classification as assessed by Hoblyn et al. [53] for “WA38” trees grown in Washington State across 2016–2017.
TreatmentVariablesBiennial Index (I)Biennial Classification z
Training system (T)Spindle0.52Biennial
V0.40Consistent
Significancens
Rootstock (R)Geneva® 410.48Consistent
M9 – Nic290.45Consistent
Significancens
Pruning technique (P)bending0.62 ABiennial
“click”0.30 BConsistent
Significance**
ns, ** indicate no significance or significance at p-values of < 0.05, 0.01, or 0.001. Student–Newman–Keuls (SNK) test for mean comparisons; means in columns with the same letter indicate non-significance at p-value < 0.05; no significant interactions between treatments (T × R, R × P, T × P, T × R × P) were present; z The classifications are quantified as: I = 0.90–1.00 = Strongly Biennial, 0.50–0.89 = Biennial, 0.10–0.49 = Consistent, 0.00–0.09 = Strongly Consistent [53].

