Article

Strategies for Improved Water Use Efficiency (WUE) of Field-Grown Lettuce (Lactuca sativa L.) under a Semi-Arid Climate

1
Research Centre in Urban Environment for Agriculture and Biodiversity (ResCUE-AB), Department of Agricultural and Food Sciences (DISTAL), Alma Mater Studiorum University of Bologna, Viale Fanin, 44, 40127 Bologna, Italy
2
Department of Soil and Water Management, Yezin Agriculture University of Myanmar, Pyinmana, Naypyidaw 15013, Myanmar
*
Author to whom correspondence should be addressed.
Agronomy 2020, 10(5), 668; https://doi.org/10.3390/agronomy10050668
Submission received: 7 April 2020 / Revised: 30 April 2020 / Accepted: 7 May 2020 / Published: 9 May 2020

Abstract

:
Water use efficiency is a main research target in agriculture, which consumes 70% of global freshwater. This study aimed at identifying sustainable water management strategies for the lettuce crop in a semi-arid climate. Three independent experiments were carried out on a commercial variety of lettuce (Lactuca sativa L.) by applying different irrigation levels based on crop evapotranspiration (ETc), estimated through both the Hargreaves–Samani and Penman–Monteith equations. In the first experiment, one treatment was also guided by soil moisture sensors. In the second and third experiments, a factorial combination was used, combining the different irrigation levels with two soil mulching treatments, namely soil without mulch, and soil mulched with dried rice straw residues. The application of different irrigation levels significantly affected plant growth, yield, and physiology. Both the adoption of sensors for guiding irrigation and the application of mulching with straw promoted higher yield. As the irrigation water level was reduced, the WUE (water use efficiency) increased. WUE was also increased by covering the soil with mulch. The experiments point out that accurate management of irrigation water using a drip irrigation system associated with soil mulching increases yield and improves the WUE of lettuce crops in the Central Dry Zone, Myanmar.

1. Introduction

Water is essential for agricultural production and the food security of the world population. In the coming decades, a growing number of regions will face increasing water scarcity [1] while, due to the expectation that the global population will reach more than 9 billion people by 2050, demand for food is expected to surge by more than 50% [2]. Considering that about 70% of global freshwater withdrawals are directly used in agriculture [3], accurate management of agricultural water resources to increase crop water use efficiency (WUE) is one of the main targets in research on plant–soil–water relations. Different strategies are available to predict soil water availability for plants and maximize crop WUE, including wireless soil moisture sensors [4]. However, novel irrigation technologies need to be adapted to local environmental conditions and available technical solutions, particularly in simplified growing systems that are generally found in developing countries [5]. Proper management of irrigation water can be beneficial for farmers since it enables both an improvement and stabilization of the yield in areas of water shortages [6]. Furthermore, it can lower the competition for water use among domestic, industrial, and agricultural sectors [2]. In this context, reference evapotranspiration (ET0) allows an effective definition of the precise water requirements for crops and irrigation scheduling [7]. Various models/approaches are available for estimating ET0, including the Class A Pan, FAO (Food and Agriculture Organization) Penman–Monteith (PM), and Hargreaves–Samani (HS) equations [7]. Different studies have focused on the definition of appropriate water management through the estimation of evapotranspiration [8,9,10,11], suggesting the superiority of the HS as compared with the PM, by analyzing data over a study period of 9 years [12]. Trajkovic [13] observed ET0 estimates by HS to be in close agreement with FAO PM forecasts in different experimental locations, with the average overestimation limited to about 1%. Traikovic’s study strongly supports the use of the HS when only temperature data are available [13].
In the Central Dry Zone (CDZ) of Myanmar, water is scarce, vegetation cover is thin, and soils are mostly luvisol, sandy, degraded, and infertile [14] with a low water holding capacity [15]. Annual rainfall ranges 300 to 800 mm per year, and is characterized by an uneven distribution and high variability across years. Moreover, rain events are recently showing a shorter duration and increased intensity [16]. In the coming decades, current trends of drought and water scarcity in the CDZ are expected to intensify in response to climate change [17]. The combination of relatively low and erratic rainfall with land features that include sloped fields with mainly infertile sandy and sandy loam soils have led to low agricultural productivity in the region [17]. Furthermore, the limited water resources are also poorly managed, especially regarding irrigated agriculture, despite the reported potential for creating small-, medium-, and large-scale irrigation systems [17]. For these reasons, both irrigated and dryland cropping areas in the region will have to be developed or improved in the future. In such conditions, raising the awareness of efficient agricultural water use and developing small-scale irrigation schemes at the family level is therefore crucial. Hence, given the limited water availability, the application of water-saving methods to improve WUE is urgent.
Lettuce (Lactuca sativa L.) is a major fresh vegetable extensively grown all over the world, particularly in temperate regions [18,19]. Despite lettuce being a C3 plant that requires adequate irrigation management to ensure satisfactory production, it is also widely cultivated in tropical areas due to its capacity to ensure adequate production and reasonable water use efficiency [20].
World lettuce production was extended over 1 million ha and estimated to reach approximately 24 million metric tons in 2009 [21], with about two-thirds of the total area devoted to lettuce production found in Asia [22]. From a nutritional perspective, lettuce belongs to the so-called green leafy vegetables, whose relevance in the diet is associated with their contributions in terms of fibers, vitamins, and minerals (including calcium, iron, and phosphorous) [23]. Under field conditions, Araújo et al. [18] assessed the effect of different water levels on the productive behavior of lettuce. The highest WUE values (12 g L−1) were obtained when 40% of ET0 was restored, as compared with other treatments respectively restoring 60%, 80%, 100%, and 120% of ET0. The experiment showed that WUE decreased linearly with the increase in the water level applied [18]. This may be achieved by minimizing leaf water loss while preserving crop productivity [19]. In the CDZ, the combination of drip irrigation techniques together with sustainable cropping practices is expected to increase in the near future in order to guarantee sustainable vegetable production and food security [14]. Among cropping practices, soil coverage (e.g., with plastic mulching) has been shown to preserve soil moisture content by reducing both water evaporation and drainage, avoid soil crusting [4], prevent soil erosion, and increase crop productivity [24]. Moreover, organic mulching contributes to the soil organic matter content, improving the nitrogen balance and soil biological activity [25]. Results obtained in Bangladesh by Asaduzzaman et al. (2010) indicate that soil organic mulching increases lettuce yield as compared with no-mulched lettuce [26]. In a difficult context, such as CDZ of Myanmar, adequate irrigation management must be matched with all crop practices able to enhance water use efficiency and allow high yield. Therefore, the present study aimed to investigate the effect of different irrigation strategies and the use of soil organic mulching on the water use efficiency and yield of lettuce grown in the semi-arid areas of CDZ, Myanmar.

2. Materials and Methods

2.1. Location

The experiments were conducted in open field conditions at Soil and Water Research Station of Yezin Agriculture University located in the University Campus, Central dry Zone of Myanmar, 16 km away from the capital NayPyiTaw. The geographic coordinates are 19°83′ N and 96°27′ E, with an altitude of 122 m a.s.l. The local climate, according to Köppen’s classification, is Aw type, which is tropical rainy with a dry summer and the rainy season concentrated between June and October.
The soil presented a loamy sand texture with 82% sand, 9.3% silt, and 8.7% clay; a wilting point of 6.1% v:v; and field capacity of 13.0% v:v. The soil chemical characteristics in the 0–0.20 m layer were as follows: pH (H2O) 6.2; EC 0.13 dS m−1; 0.38% organic matter; 54 mg kg−1 of total N; 10.9 mg kg−1 of available P; and 25 mg kg−1 of exchangeable K.

2.2. Treatments and Experimental Design

Three independent experiments were carried out on a commercial variety of lettuce (Lactuca sativa cv. Green wave, Evergreen seeds, Sunnyvale, CA, USA) commonly sold in the local market.
Experiment 1: Four irrigation strategies were applied, three based on crop evapotranspiration (ETc), respectively restoring 25%, 50%, and 100% of crop ETc (details on the ETc calculation are included in the following sections) measured by using the Hargreaves–Samani equation (HS), and one guided by soil moisture sensors. In the sensor-guided treatment, the irrigation schedule was based on the real soil moisture content, restoring water up to the field capacity whenever the soil moisture level fell below 50% of the available water (AW). The experimental design was a completely randomized block design with 4 treatments and three replicates.
Experiment 2: A factorial combination was carried out, combining four irrigation strategies, based on crop evapotranspiration (ETc) combined with two soil mulching (M) treatments, namely soil without mulch (bare soil, BS), and soil mulched with dried rice straw residues (straw mulching, SM). The irrigation strategies provided restoration of 75%, 100%, and 125% of ETc estimated by using the HS equation and 100% of crop ETc estimated by using the Penman–Monteith (PM) equation. In this experiment, for the calculation of ETo, the Penman–Monteith method was included with the main purpose of validating the more straightforward method, such as the Hargreaves–Samani formula.
Experiment 3: Six strategies of irrigation (based on crop evapotranspiration, ETc), respectively restoring 25%, 50%, and 100% of crop ETc measured by using either the HS or PM equations, were factorially combined with two soil mulching (M) treatments, namely soil without mulch (bare soil, BS), and soil mulched with dried rice straw residues (straw mulching, SM). Again, PM was included to check HS. However, as crops respond to the water supply and not to the method to estimate ET0, the HS and PM methods were not considered as different factors but as different levels of the same factor (irrigation strategy). The restitution of different percentage of ET0, estimated either with HS or PM, represents different irrigation depths. The experimental design was a completely randomized block, with 12 treatments and 3 replicates.
For the three experiments, the experimental unit consisted of a 5.4-m2 plot, including 72 plants.

2.3. Plant Material and Crop Management

In all experiments, lettuce was sown manually in 105-cell plastic seedling trays, and the seedlings were transplanted 21 days after sowing (DAS), on 28 December 2018 for the first experiment, on 7 January 2019 for the second experiment, and on 14 February 2019 for the third experiment. Plants spacing was 0.25 m between rows and 0.3 m within rows, resulting in a plant density of 13.3 plant m−2, according to the habits of the local farmers. Harvest was carried out 31 days after transplanting (DAT) in all experiments.
Before the first experiment, the soil was amended with 1.5 kg m−2 of mature cattle manure, mainly to improve the soil structure and water holding capacity. Soil fertilization was managed as normal for the area, supplying 0.025 kg m−2 of NPK fertilizer 15-15-15 (corresponding to 37.5 kg ha−1 of N, P2O5, and K2O), which was applied in each experiment 3 days before transplanting. Both organic and mineral fertilizers were broadcasted manually. No additional fertilizer was applied across the growing season. During the experiments, no diseases or pests were detected; therefore, no pest control products were applied.
In experiments 2 and 3, soil mulching treatments consisted in the application of around 0.75 kg m−2 of dry rice straw, assuring a mulching height of about 0.15 m.

2.4. Irrigation Management

The irrigation management, except for the sensor-guided treatment, was based on crop evapotranspiration (ETc), calculated by using the following equation (Equation (1)):
ETc = ET0 ∗ Kc,
where ETc (mm day−1) is the calculated crop evapotranspiration, ET0 (mm day−1) is the reference evapotranspiration, and Kc is the FAO crop coefficient for lettuce [13].
For the estimation of the reference evapotranspiration (ET0), two different methods were used. The first one utilized the Hargreaves–Samani (HS) equation (Equation (2)):
ET0 = 0.0023 (Tmean + 17.8) (Tmax − Tmin)0.5 Ra,
where ET0 (mm day−1) is the reference evapotranspiration rate; Ra (W m−2 day−1) is the extraterrestrial solar radiation; and Tmean, Tmax, and Tmin are the mean, maximum, and minimum temperature (°C) of the day, respectively [21].
The second method applied the Penman–Monteith (PM) equation (Equation (3)) [27]:
ET 0 = 0.408 Δ   ( R n G ) +   γ   900 T + 273   u 2   ( e s e a ) Δ + γ   ( 1 + 0.34 u 2 ) ,
where ET0 (mm day−1) is the reference evapotranspiration, Rn (MJ m−2 day−1) is the net radiation at the crop surface, G (MJ m−2 day−1) is the soil heat flux density, T (°C) is the mean daily air temperature at a 2 m height, u2 (m s−1) is the wind speed at a 2 m height, es (kPa) is the saturation vapor pressure, ea (kPa) is the actual vapor pressure, es − ea (kPa) is the saturation vapor pressure deficit, Δ (kPa °C−1) is the slope vapor pressure curve, and γ (kPa °C−1) is the psychrometric constant.
The meteorological data for the determination of the reference evapotranspiration were daily downloaded from the website of the Agro-Meteorological Department of Yezin Agriculture University (http://www.yau.edu.mm/), located inside the University Campus, excluding extraterrestrial radiation Ra for the HS equation, which was calculated according to Duffie and Beckman [28]. The ET0 estimated by the PM equation was obtained using the FAO CropWat 8.0 software.
The amount of water to be used for each irrigation was calculated based on the plant water balance in conjunction with the soil property, root depth, and climate data also considering the occurred rainfall, if any. Daily ETc was estimated considering the FAO crop coefficient for the lettuce crop growth stages. In all experiments, lettuce cycles were divided into three growth stages, and the Kc used was 0.7, 1.0, and 0.95, respectively. The time of irrigation was determined when readily available soil water (50% available soil water) was depleted.
In the sensor-guided treatment of experiment 1, CropX sensors (CropX, Tel Aviv-Yafo, Israel) were used. These sensors measured the soil water content at a 20-cm and 46-cm depth by estimating the soil bulk permittivity (or dielectric constant), which determines the velocity of an electromagnetic wave or pulse through the soil. The sensors have a wireless connection to a system that collects and analyses the data. The insights produced by the system share information (through a smartphone application) on when and how much irrigation is actually needed. In this treatment, the irrigation schedule was based on the real soil moisture content, restoring water to the field capacity whenever the soil moisture level reached 50% of the water actually available.
In all experiments, 16-mm-diameter drip pipes were used. Drippers had a flow rate of approximately 1.3 L h−1, and each plant was supplied with a single dripper. A flow rate test and calculation of distribution uniformity (DU) were carried out before transplanting. The DU was calculated following the indications from Baum et al. [29].
The irrigation management (time and rate) was performed manually, through individual records for each treatment.

2.5. Measurements

At harvest (31 DAT), plants were cut at the base of the head, which was weighed to determine the fresh weight (g plant−1). The marketable yield (kg m−2) was assessed, excluding the external leaves, which appeared damaged or wilted. Plants’ dry weight was quantified after drying the samples at 70 °C for 72 h. Dry matter was calculated as the ratio between the leaf dry weight and leaf fresh weight and expressed as a percent value. Leaf number and leaf size (length and width) were also recorded. Water use fficiency (WUE) was determined as the ratio between the fresh weight and the volume of water used and expressed as g FW L−1 H2O, as generally done for lettuce crops [30].
Stomatal conductance was measured using a handheld photosynthesis measurement system model CI-340 (Camas, WA, USA), equipped with 6.25-cm−2 cuvette. The infrared thermometer model FLUKE 61 (Fluke Corporation, Everett, WA, USA) was used to measure leaf temperature, and leaf greenness was estimated by using SPAD 502 (Minolta, Osaka, Japan). Measurements were made at 27 DAT on the upper surface of the canopy on 3 leaves for each plant from 10:00 a.m. to 14:00 p.m. h, taking approximately 1 h to complete each replication. All plants were measured on a single day. The cuvette conditions were as follows: PAR, 1258 ± 130 µm m−2 s−1, 1460 ± 150 µm m−2 s−1, 1533 ± 101 µm m−2 s−1; air temperature 39.8 ± 0.46 °C, 41.8 ± 0.47 °C, 39.4 ± 1.39 °C; relative humidity 27.4 ± 0.51%, 28.4 ± 0.97%, 26.4 ± 2.66% RH; CO2 concentration 337 ± 6.2 ppm, 332 ± 10.1 ppm, 271.8 ± 5.8 ppm (experiments 1, 2, and 3, respectively).

2.6. Statistical Analysis

The physiological measurements were taken on three plants per plot, while the harvest considered 12 plants collected from the central part of each plot. Data from experiment 1 were analyzed by using one-way ANOVA, while data from experiments 2 and 3 were analyzed by using two-way ANOVA (irrigation strategies x mulching). Means were separated using the Tukey HSD test [31] at p ≤ 0.05. Before the analysis, all data were checked for normality and homogeneity of the variance. Averages and standard errors (SE) were calculated. Statistical analysis was carried out using R statistical software (version 3.3.2, package “emmeans” and “car”).

3. Results

3.1. Climate and Irrigation Management during the Experiments

During the first experiment, maximum air temperatures ranged between 25.0 and 34.0 °C, with an average of 31.5 °C. Minimum temperatures ranged between 14.4 and 20.4 °C, with an average of 16.7 °C. The daily relative humidity (RH) ranged between a minimum of 48% and a maximum of 73%. No rainfall occurred during the first experiment (Table 1). During the second experiment, maximum air temperatures ranged between 20.4 and 36.5 °C, with an average of 32.3 °C. Minimum air temperatures ranged between 14.4 and 25.0 °C, with an average of 17.0 °C. The maximum relative humidity (RH) was 73%, and the minimum RH was 50%. The accumulated precipitation during the second experiment was 2 mm, a quantity irrelevant for the irrigation management (Table 1). During the third experiment, maximum air temperatures ranged between 30.7 and 38.6 °C, with an average maximum temperature of 35.6 °C. Minimum temperatures ranged between 16.0 and 23.0 °C, with an average minimum temperature of 19.5 °C. The maximum relative humidity (RH) was 59%, and the minimum RH was 30%. No rainfall occurred during the third experiment (Table 1). The growing degree days (GDDs) from transplanting to harvest ranged from 662 (experiment 1) to 731 °C (experiment 3).

3.2. Experiment 1

3.2.1. Physiological Parameter

Water treatments affected the stomatal conductance, which was the lowest in the plants grown in HS25, while no significant differences were detected among the other irrigation treatments (average value of 232 mmol m−2 s−1) (Table 2). The highest leaf temperature was observed in plants grown under the lowest amount of irrigation (HS25), with comparable values also obtained in plants irrigated by using moisture sensors (Table 2). Concerning SPAD values, the only difference was detected between plants grown under the sensor-based irrigation (22.3 SPAD value) and plants grown in HS50 (16.7 SPAD value) (Table 2).

3.2.2. Morphological and Productive Parameters

Irrigation affected the plant fresh weight (FW) and marketable yield, but significant differences were detected only between HS25 and the other irrigation treatments. In the HS25 treatment, plant FW and marketable yield were the lowest, with a reduction of 29% and 27%, respectively, as compared to the means among the other water strategies (141 g plant−1 and 1.74 kg m−2, respectively) (Table 3 and Figure 1a). The same trend was also observed for the dry weight (Table 3). Dry matter percentage was the highest in plants receiving the lowest amount of water (HS25), with comparable values also obtained in plants grown by using sensor-based irrigation management (Table 3). Finally, water use efficiency (WUE) was the highest in the HS25 treatment and progressively decreased with the increase of the amount of irrigation distributed to the plants (Figure 1b). Leaf number and leaf dimension were not affected by the irrigation strategy (data not shown).

3.3. Experiment 2

3.3.1. Physiological Parameter

Stomatal conductance was affected by the interaction between mulching and irrigation strategy (Table 4). Indeed, the use of straw mulching resulted in higher stomatal conductance as compared to plants cultivated on bare soil, but the interaction showed that the effect was significant only for the HS75 irrigation strategy (Table 5). The main factors (irrigation strategy and soil mulching) did not influence the plants’ leaf temperature, but the interaction was significant at p ≤ 0.001 (Table 4). Accordingly, while no effect of soil mulching was detected at HS100 and PM100, at HS75 and at HS125, plants grown on bare soil had a lower and higher leaf temperature as compared to plants grown using mulching, respectively (Table 5).
The SPAD values were not affected by the irrigation strategy and soil mulching treatments (Table 4), resulting in an SPAD index of 16.6 as the mean value (data not shown).

3.3.2. Morphological and Productive Parameters

Significant interaction effects were noticed for plant fresh weight, dry matter, marketable yield, and WUE (Table 6).
Plants grown using the mulching treatment showed higher plant FW as compared with plants grown on bare soil when the HS100 and HS75 irrigation strategies were adopted, while no differences were observed when straw mulching was used in the other water treatments. The highest plant FW was obtained in mulched plants under HS100, HS75, and HS125 (Table 7). A similar trend was observed for marketable yield, where the difference between mulched and no mulched plants was noticed only in HS100 and HS75 treatments (Figure 2a).
Plants’ dry weight was affected only by mulching (Table 6). Accordingly, plants mulched with rice straw had a greater dry yield as compared to plants grown on bare soil (12.3 and 9.6 g plant−1, respectively). The interaction effect between soil mulching and irrigation strategy on dry matter was evident only for HS125, where a significant increase of dry matter was observed in plants grown in mulched soil as compared to bare soil (Table 7).
Plants grown on mulched soil showed a higher WUE as compared with plants grown on bare soil when the HS100 and HS75 irrigation strategies were applied, while no differences were observed when straw mulching was provided in the other water treatments. The highest plant WUE was attained in mulched plants that received the HS75 and HS100 irrigation strategies (Figure 2b).
The irrigation strategy and soil mulching did not affect the number of leaves per plants, while both leaf length and width were influenced by soil mulching and a significant interaction (between irrigation strategy and soil mulching) was detected (data not shown). The leaf length and width was the highest in plants grown in mulched soil at HS100 (17.1 cm length, and 17.3 cm width), and the lowest in both HS100 and PM100 in plants grown on bare soil (13.7 cm and 14.1 cm length, and 14.2 and 14.2 cm width, respectively).

3.4. Experiment 3

3.4.1. Physiological Parameter

Stomatal conductance, leaf temperature, and SPAD readings were affected by the irrigation strategy, while soil mulching influenced only the SPAD unit, and interaction effects were not noticed (Table 8). Stomatal conductance was higher in PM100, HS100, and PM50 (Table 9). As far as leaf temperature is concerned, the highest values were shown in plants receiving the lower amount of water, HS25 and PM25, and the lowest in plants grown under the HS100 irrigation strategy (Table 9). Greater SPAD values were detected in plants grown in the HS50 and HS25 treatment as compared to plants grown in PM100 (Table 9). Moreover, higher SPAD values were observed when soil mulching was applied (a 20.6 SPAD value as compared to an 18.4 SPAD value measured in plants grown on bare soil).

3.4.2. Morphological and Productive Parameters

The irrigation strategy significantly affected plant FW, marketable yield, and WUE, whilst soil mulching had a significant effect on all the parameters considered, and an interaction effect between water level and mulching was observed for all these parameters excluding dry matter (Table 10).
When the PM equation was adopted, no significant differences occurred between the mulched and bare soil-grown plants for FW and DW (Table 11). Alternatively, when the irrigation was managed through the HS equation, in soil-mulched-grown plants, FW was not affected by the water level and was greater as compared to those grown on bare soil (Table 11). Contrarily, the lowest FW was achieved in plants grown on bare soil at HS25, with comparable values obtained also in BS plants at HS100 and PM25 (Table 11).
Plants grown on mulched soil showed a greater dry weight as compared to bare soil-grown plants. A significant difference was noted only between the irrigation treatment HS25 (Table 11).
While the irrigation strategy did not affect the marketable yield of plants grown on mulched soil, a significant difference was shown only between the treatments HS50 and PM25, which had a lower marketable yield among the mulched treatments. The lowest marketable yield values were found among plants grown on bare soil and associated with HS25 (Figure 3a).
As the irrigation volume was decreased, higher WUE values were observed (Figure 3b). Straw mulching had a positive effect in enhancing the WUE but only in the HS25 irrigation strategy (Figure 3b).
Dry matter was only influenced by the soil management, and plants grown on bare soil showed higher values as compared with plants grown on straw mulching (6.8 and 5.9 g plant−1, respectively, data not shown). No significant differences were observed regarding the number of leaves per plant and the leaf morphology (data not shown).

4. Discussion

The application of different irrigation strategies significantly affected the growth (including fresh and dry weight, leaf morphology), yield (marketable yield), and some physiological parameters (stomatal conductance, leaf temperature, SPAD units) of lettuce grown in Central Dry Zone, Myanmar.
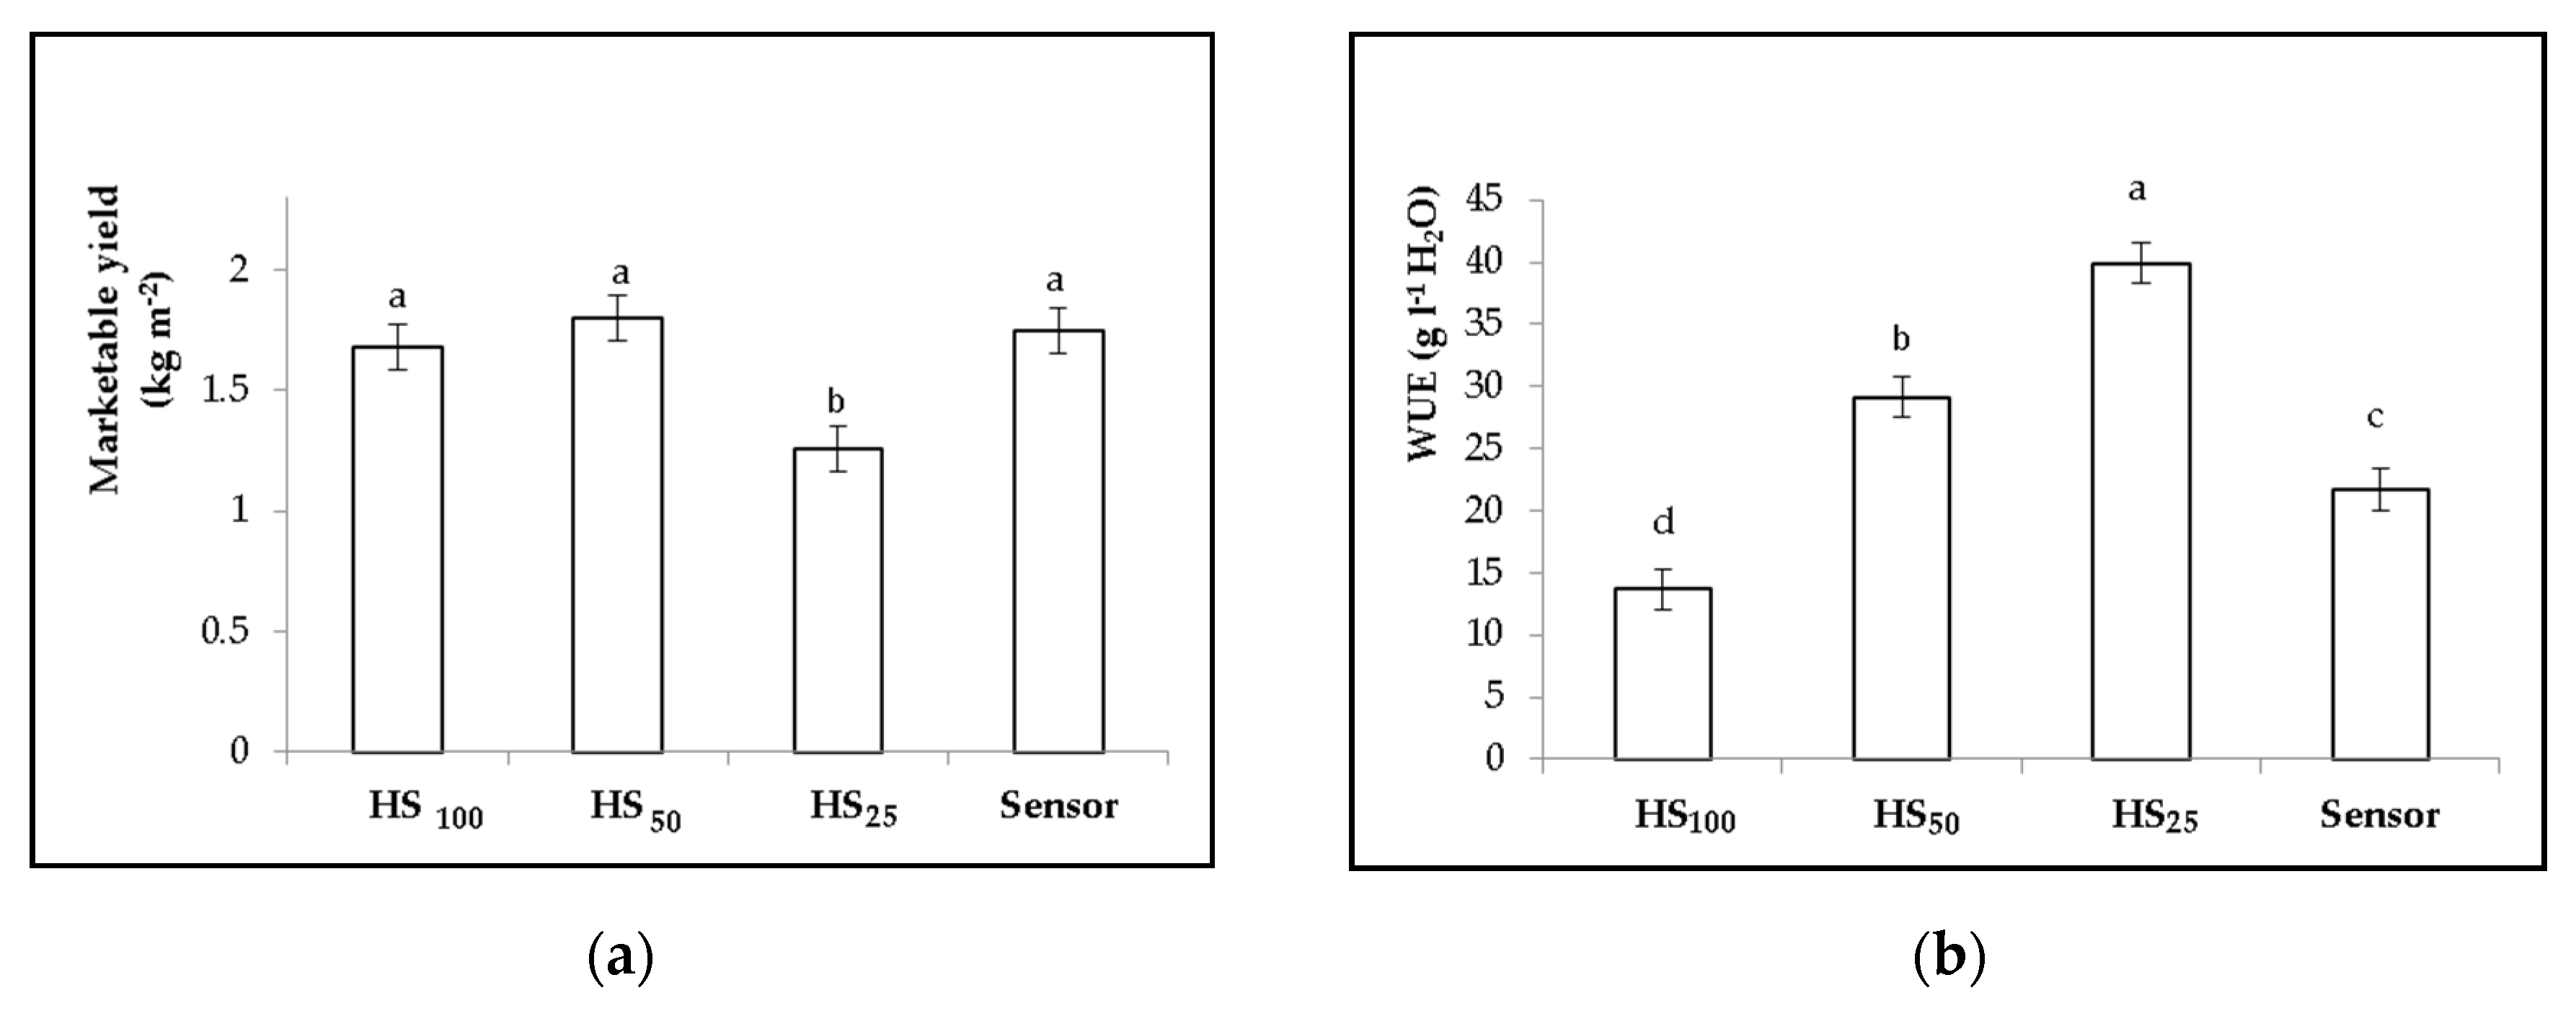
The main outcome of these three experiments is that it is possible to obtain a high yield of lettuce by restoring with irrigation only a fraction of the estimated crop evapotranspiration. Accordingly, the reduction of irrigation water allowed either the highest yield or a yield comparable to the restitution of 100% ETc to be obtained in all the experiments.
In the first experiment, the highest yield was associated with the HS50 treatment (146 g plant−1, corresponding to a 1.90 kg m−2 marketable yield) (Table 3 and Figure 1a). No significant differences were observed by comparing it with the HS100 and sensor treatments, which produced 137 and 141 g plant−1, respectively (1.68 and 1.83 kg m−2 marketable yield) (Table 3 and Figure 1). The use of the wireless sensors, although easy to use and showing some advantages, such as diminishing excessive water usage, as compared to HS
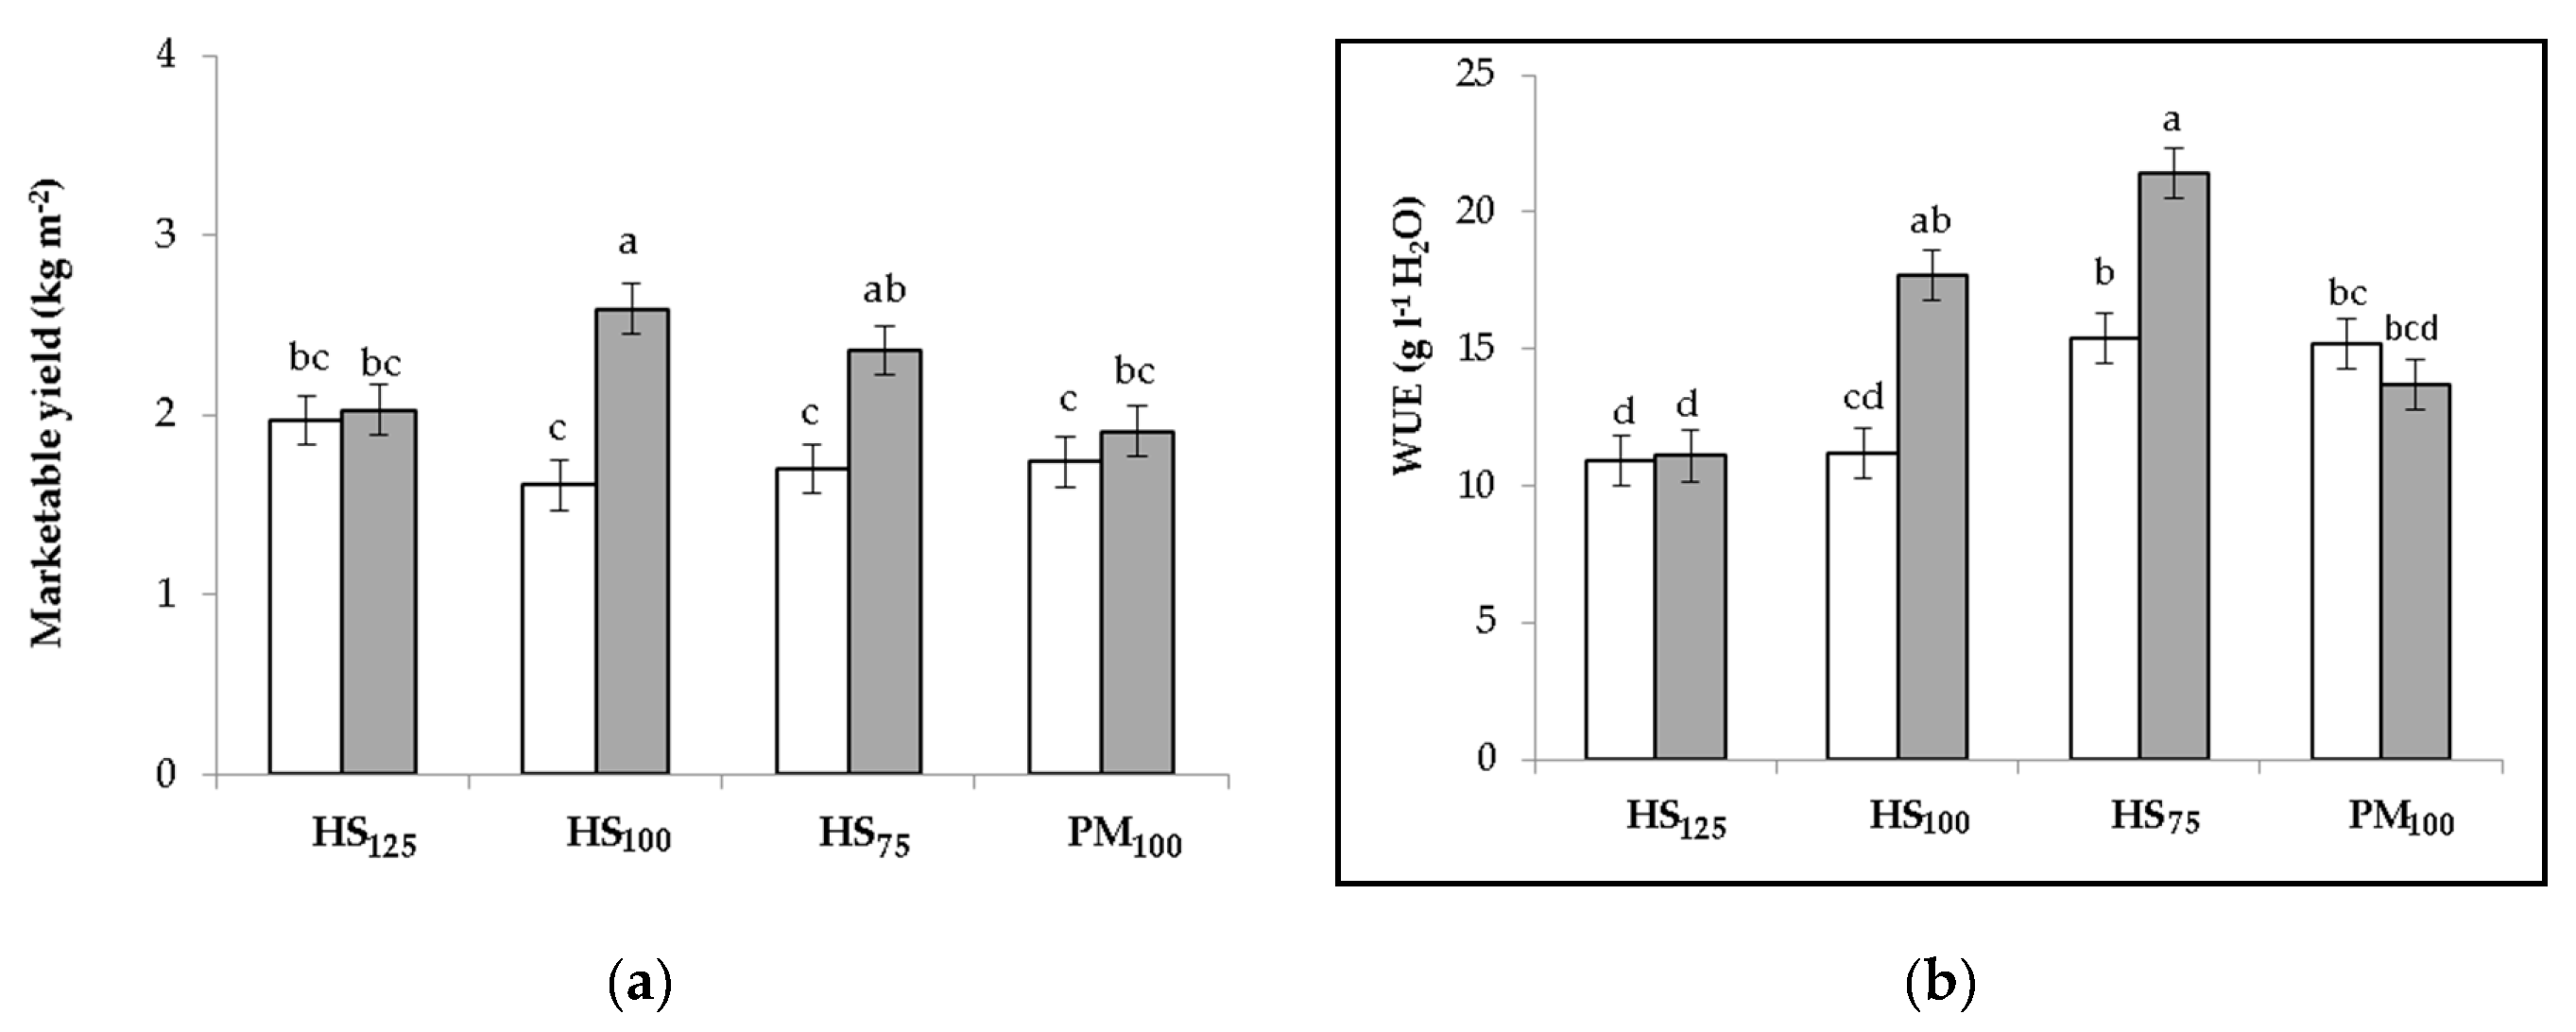
100, appears to still be unaffordable for farmers in the Central Dry Zone of Myanmar due to their cost. In the second experiment, when soil was covered with straw mulching, both the HS100 and HS75 treatment gave the best results, producing 2.59 and 2.36 kg m−2, respectively (
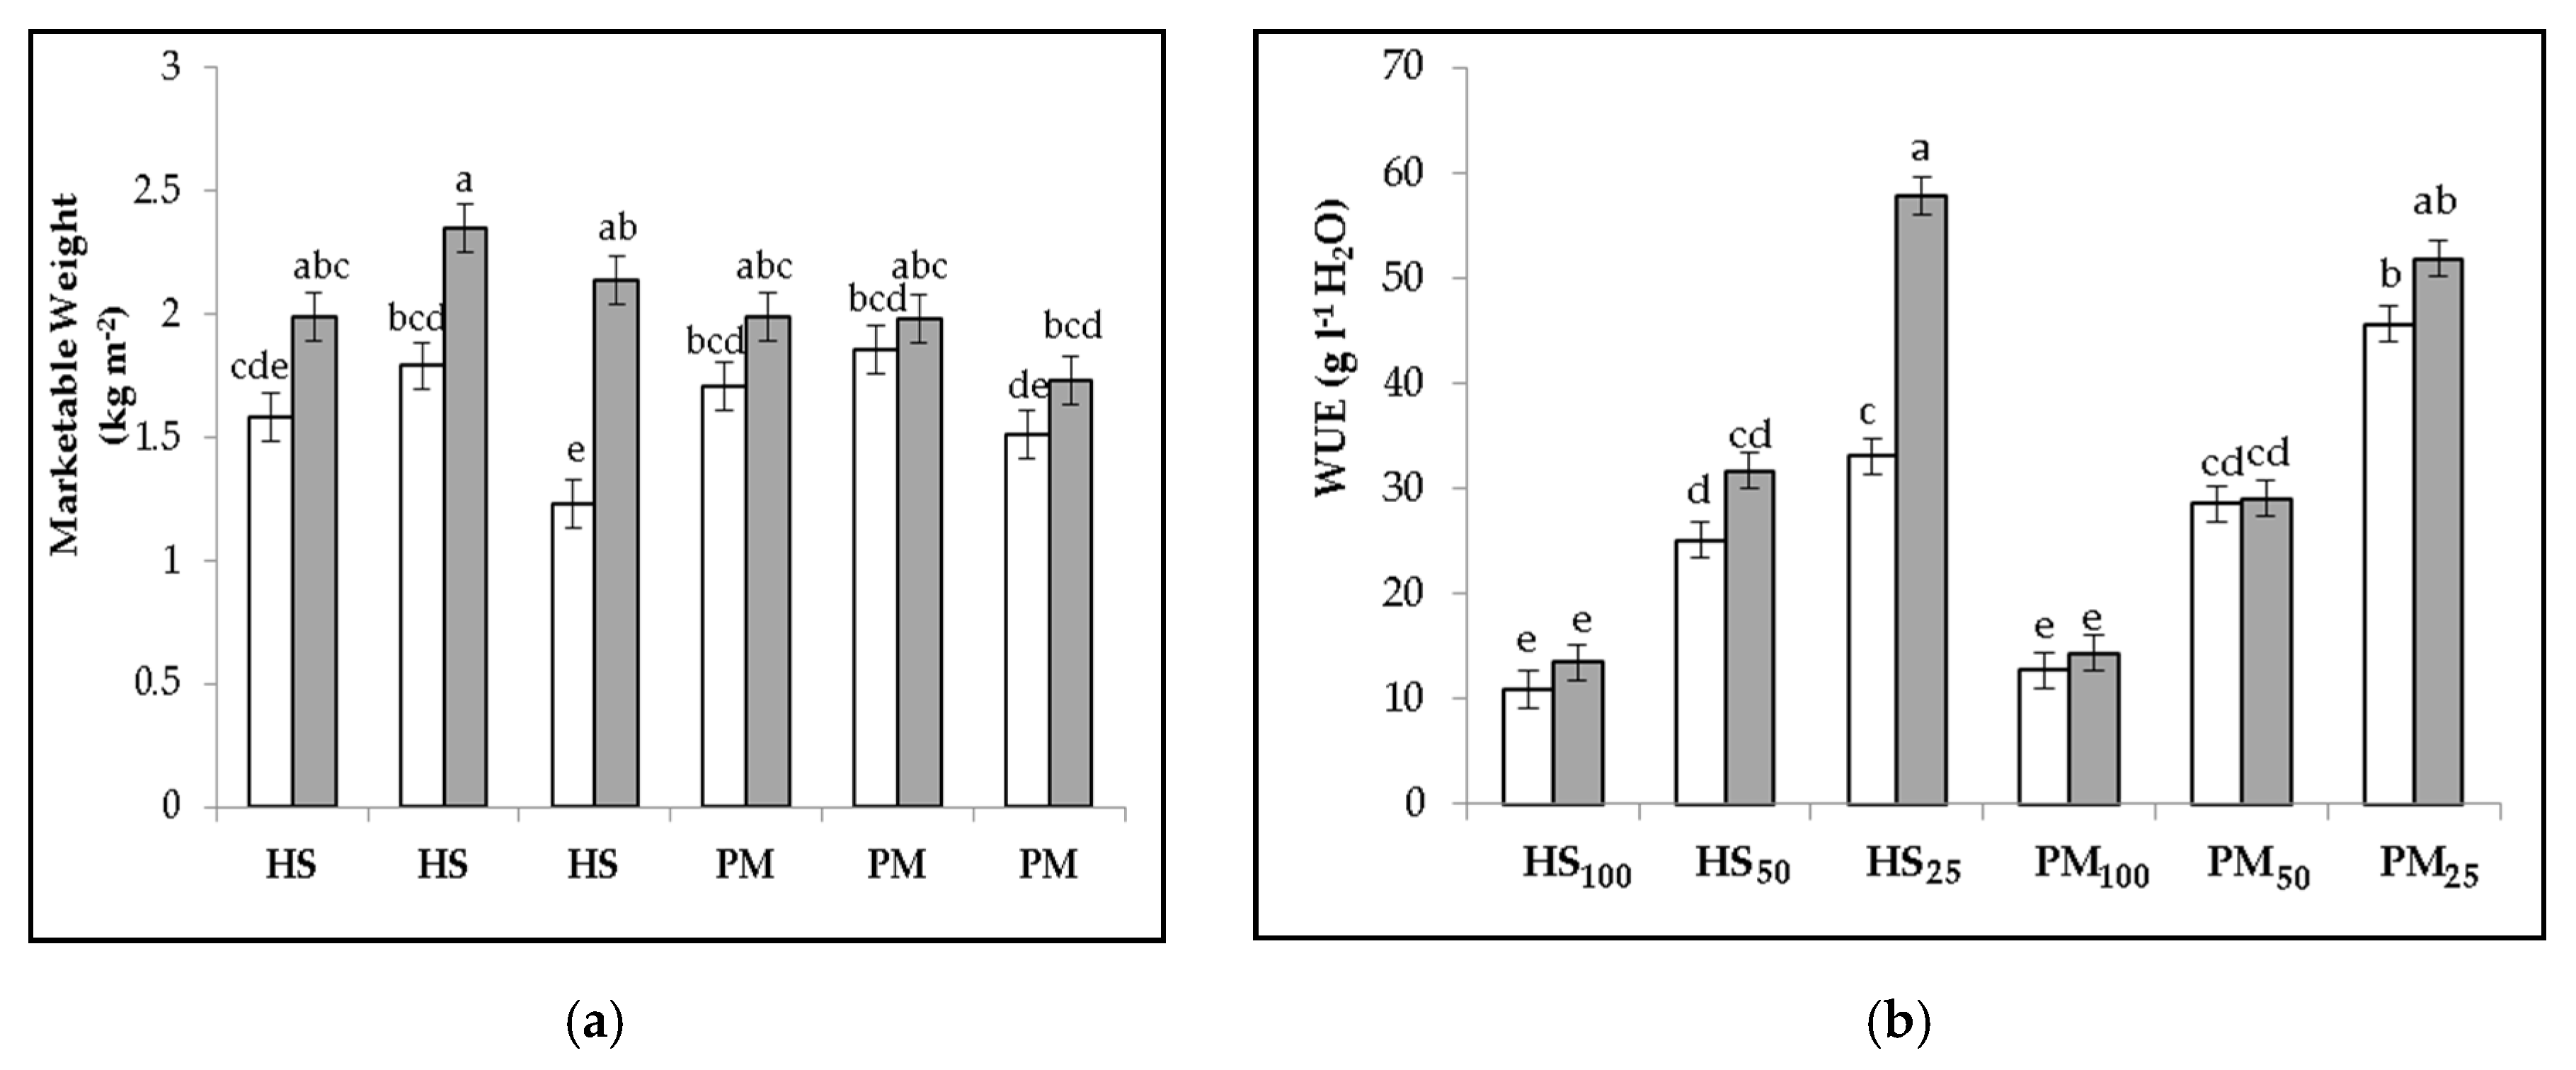
Table 7). Even in the third experiment, the highest production was observed in mulched soil in all water treatments excluding PM25 (with a mean marketable yield of 2.09 kg m−2) (Table 11).
The second experiment also pointed out that over-irrigation is not recommended since lettuce production did not benefit from the HS125 treatment (Table 7). Nevertheless, when soil was mulched with rice straw, the excess humidity caused a 22% reduction in yield as compared to the HS100 treatment (Figure 2a). This is a relevant aspect to consider when training growers on the benefits of rational use of irrigation water and to minimize the negative impact of water overuse in agriculture.
An important aspect that the second and the third experiments have underlined is that there is an effect on lettuce behavior, although not always significant, which is related to the method used for estimation of ETc and, consequently, with the time and amount of water restored by irrigation. Generally, the Hargraves–Samani method (HS) overestimated ET0, as compared with Penman–Monteith (PM), being 14% and 8% higher in the second and third experiment, respectively (Table 5 and Table 7). In addition to a 10%–15% higher irrigation volume, this overestimation entailed more frequent water supplies during the crop cycle (18 waterings every 1.6 days in the HS treatments, and 15 waterings every 2 days in the PM treatments). This probably led to a more uniform hydration of the root zone, which combined with the mulching of the soil allowed adequate control of the soil temperature, better use of nutrients, negligible infestation of weeds, and finally a higher yield. Therefore, the Hargraves–Samani formula can be suggested as a method for estimating ET0, particularly where the availability and access of climate data are limited, such as the Central Dry Zone of Myanmar. Under such circumstances, the HS equation, actually based on the maximum and minimum air temperature, could easily be used to estimate ET0, contrarily to the Penman–Monteith equation, which, although being the recommended system as a standard for calculating the reference evapotranspiration, requires a large number of parameters that are not always easily available locally.
In all experiments, the lower the irrigation water level, the higher the water use efficiency (WUE) (Figure 1b, Figure 2b and Figure 3b). In the first experiment, WUE was around 40 g L−1 H2O in the HS25 treatment followed by the HS50, sensor, and HS100 treatments, where values of around 30, 22, and 14 g L−1 H2O were observed, respectively (Figure 1b). The same trend was observed in the second and third experiments, where the use of rice straw as soil mulching allowed a further increase of WUE, as shown by the higher values compared with the treatments without mulching (Figure 2b and Figure 3b). As commonly experienced, the greater WUE was associated with the lowest irrigation treatments, but despite the limited water availability, the lettuce plants were able to extract the soil solution and to guarantee a satisfactory production as well. A similar WUE trend was observed by Dagdelen et al. [6] in cotton crops grown with a drip irrigation system. An increase in WUE was observed when 25% of ETc was applied, reaching 1.46 g L−1, while in irrigation with 100% ETc, the WUE was 0.81 g L−1. Furthermore, Singh et al. [32], experiencing a water deficit for cotton in a semi-arid region, found a significant relationship between WUE and the different irrigation depths studied. The treatment for which the irrigation was returned to 100% of the ETc obtained a value of 0.54 g L−1, while the 50% ETc obtained a value of 0.64 g L−1. Related to lettuce production, Barbosa et al. [33], comparing lettuce growth with a drip irrigation system in a conventional field and a hydroponic system, found a value of WUE of 4 and 50 g L−1, respectively. Moreover, Maraseni et al. [34] detected a WUE of 19 g L−1 in lettuce growth with a drip irrigation system in eastern Australia.
The irrigation strategy also significantly affected the stomatal conductance and leaf temperature (Table 2, Table 5 and Table 9). Plants that experienced water stress (due to either a reduced water supply or the absence of straw mulching) showed decreased stomatal conductance and a higher leaf temperature. According to Turner [35], stress conditions can influence the stomatal action as well as the pressure deficit of water vapor. Under the hereby described experimental conditions, stomatal conductance and leaf temperature status were shown to efficiently allow for the detection of a water deficiency.
In both experiments where the soil mulching was tested, it significantly affected the lettuce behavior, influencing the plants’ fresh and dry weight, marketable yield, and water use efficiency, Furthermore, it also affected the stomatal conductance in experiment 2 and both the dry matter percentage and SPAD units in experiment 3. On average, the use of straw mulching on the lettuce crop increased the fresh weight from 19% (third experiment) to 30% (second experiment) and the WUE from 21% (second experiment) to 22% (third experiment) as compared to lettuce cultivated on bare soil. It is therefore possible to state that the use of mulching for lettuce vegetable production in semi-arid environmental conditions is crucial in order to improve the soil microenvironment around the root zone and to promote the conservation of soil moisture, which can contribute to increasing both the quantitative and qualitative parameters of production.

5. Conclusions

The three experiments highlighted the importance of the adoption of accurate irrigation management associated with innovation in diagnostic tools and sensors as a strategy to improve water use efficiency for vegetable production in semi-arid areas, such as the Central Dry Zone of Myanmar. It was possible to affirm that accurate irrigation management associated with drip irrigation systems and mulching technology increases the yield and improves the WUE of lettuce production in the Central Dry Zone of Myanmar. Under water-limiting conditions, irrigation management returning 50% of ETc resulted in efficient water use and higher yields. An interdisciplinary approach and appropriate dissemination activities will be essential to guarantee that improved water management methodology and technology for agriculture will be put in place adequately by local institutions and farmers.

Author Contributions

Conceptualization, N.M. and G.G.; methodology, N.M.; validation, N.M., G.G., G.P., F.O.; formal analysis, N.M., G.P., G.G.; investigation, N.M.; N.O.M.; resources, F.O., G.P.; data curation, N.M., G.P.; writing—original draft preparation, N.M.; writing—review and editing, G.P., G.G., F.O.; visualization, N.M., G.P., G.G.; supervision, F.O., G.P.; project administration, N.M.; funding acquisition, F.O., G.G. All authors have read and agreed to the published version of the manuscript.

Funding

This research received no external funding.

Acknowledgments

We thank Nang Hseng Hom, Rector of Yezin agriculture University of Myanmar for providing the area, infrastructure and equipment to carry out the experiments and the Company Crop X (Tel Aviv, Israel) for donating the soil moisture sensors used in the experimentation.

Conflicts of Interest

The authors declare no conflict of interest.

References

  1. Fereres Castiel, E.; Orgaz Rosua, F.; González-Dugo, V. Reflections on food security under water scarcity. J. Exp. Bot. 2011, 62, 4079–4086. [Google Scholar] [CrossRef] [Green Version]
  2. Godfray, H.C.J.; Beddington, J.R.; Crute, I.R.; Haddad, L.; Lawrence, D.; Muir, J.F.; Toulmin, C. Food security: The challenge of feeding 9 billion people. Science 2010, 327, 812–818. [Google Scholar] [CrossRef] [PubMed] [Green Version]
  3. Kummu, M.; De Moel, H.; Porkka, M.; Siebert, S.; Varis, O.; Ward, P.J. Lost food, wasted resources: Global food supply chain losses and their impacts on freshwater, cropland, and fertiliser use. Sci. Tot. Environ. 2012, 438, 477–489. [Google Scholar] [CrossRef] [PubMed]
  4. Dursun, M.; Ozden, S. A wireless application of drip irrigation automation supported by soil moisture sensors. Sci. Res. Essays 2011, 6, 1573–1582. [Google Scholar]
  5. Berihun, B. Effect of mulching and amount of water on the yield of tomato under drip irrigation. J. Hort. For. 2011, 3, 200–206. [Google Scholar]
  6. Dağdelen, N.; Başal, H.; Yılmaz, E.; Gürbüz, T.; Akcay, S. Different drip irrigation regimes affect cotton yield, water use efficiency and fiber quality in western Turkey. Agric. Water Manag. 2009, 96, 111–120. [Google Scholar] [CrossRef]
  7. Kumar, R.; Jat, M.K.; Shankar, V. Methods to estimate irrigated reference crop evapotranspiration–a review. Water Sci. Technol. 2012, 66, 525–535. [Google Scholar] [CrossRef]
  8. Valipour, M. Ability of Box-Jenkins models to estimate of reference potential evapotranspiration (A case study: Mehrabad Synoptic Station, Tehran, Iran). IOSR J. Agric. Vet. Sci. 2012, 1, 1–11. [Google Scholar] [CrossRef]
  9. Valipour, M. Application of new mass transfer formulae for computation of evapotranspiration. J. Appl. Water Eng. Res. 2014, 2, 33–46. [Google Scholar] [CrossRef]
  10. Valipour, M. Temperature analysis of reference evapotranspiration models. Meteorol. Appl. 2015, 22, 385–394. [Google Scholar] [CrossRef]
  11. Rezaei, M.; Valipour, M.; Valipour, M. Modelling evapotranspiration to increase the accuracy of the estimations based on the climatic parameters. Water Conserv. Sci. Eng. 2016, 1, 197–207. [Google Scholar] [CrossRef] [Green Version]
  12. Valipour, M.; Sefidkouhi, M.A.G.; Raeini, M. Selecting the best model to estimate potential evapotranspiration with respect to climate change and magnitudes of extreme events. Agric. Water Manag. 2017, 180, 50–60. [Google Scholar] [CrossRef]
  13. Trajkovic, S. Hargreaves versus Penman-Monteith under humid conditions. J. Irrig. Drain. Eng. 2007, 133, 38–42. [Google Scholar] [CrossRef]
  14. Gianquinto, G.; Orsini, F. Feasibility Study for the Improvement of Food Security in Central Dry Zone, Myanmar; Report; Terre des Hommes Italy: Milano, Italy, 2007; p. 190. [Google Scholar]
  15. Herridge, D.F.; Win, M.M.; Nwe, K.M.M.; Kyu, K.L.; Win, S.S.; Shwe, T.; Cornish, P.S. The cropping systems of the Central Dry Zone of Myanmar: Productivity constraints and possible solutions. Agric. Syst. 2019, 169, 31–40. [Google Scholar] [CrossRef]
  16. FAO. Myanmar Dry Zone development programme—Scoping Report. FAO Investment Centre. Available online: https://www.lift-fund.org/myanmar-dry-zone-development-programme-scoping-report (accessed on 25 April 2020).
  17. Livelihood and Food Security Trust Fund (LIFT). Available online: http://www.liftfund.org/sites/liftfund.org/_les/uploads/Dry_Zone/Dry_Zone_programme_framework_24_April_15.pdf (accessed on 17 June 2015).
  18. Araújo, W.F.; de Souza, K.T.S.; de Araújo Viana, T.V.; Azevedo, B.M.; Oliveira, G.A. Rendimento e eficiência do uso da água pela alface em função da lâmina de irrigação. Rev. Caatinga 2010, 23, 115–120. [Google Scholar]
  19. Kang, S.; Zhang, L.; Hu, X.; Li, Z.; Jerie, P. An improved water use efficiency for hot pepper grown under controlled alternate drip irrigation on partial roots. Sci. Hortic. 2001, 89, 257–267. [Google Scholar] [CrossRef]
  20. Gomes, D.P.; de Carvalho, D.F.; de Almeida, W.S.; Oliveira, L. Organic carrot-lettuce intercropping using mulch and different irrigation levels. J. Food Agric. Environ. 2014, 12, 323–328. [Google Scholar]
  21. Domingues, D.S.; Takahashi, H.W.; Camara, C.A.; Nixdorf, S.L. Automated system developed to control pH and concentration of nutrient solution evaluated in hydroponic lettuce production. Comp. Elec. Agric. 2012, 84, 53–61. [Google Scholar] [CrossRef]
  22. Beiquan, M. Vegetables, 1st ed.; Springer: New York, NY, USA, 2008; pp. 75–116. [Google Scholar]
  23. Prasad, K.N.; Shivamurthy, G.R.; Aradhya, S.M. Ipomoea aquatica, an underutilized green leafy vegetable: A review. Int. J. Bot. 2008, 4, 123–129. [Google Scholar] [CrossRef]
  24. Prosdocimi, M.; Tarolli, P.; Cerdà, A. Mulching practices for reducing soil water erosion: A review. Earth-Sci. Rev. 2016, 161, 191–203. [Google Scholar] [CrossRef]
  25. Hooks, C.R.R.; Johnson, M.W. Impact of agricultural diversification on the insect community of cruciferous crops. Crop. Protect. 2003, 22, 223–238. [Google Scholar]
  26. Asaduzzaman, M.D.; Sultana, S.; Ali, M.A. Combined effect of mulch materials and organic manure on the growth and yield of lettuce. J. Agric. Environ. Sci. 2010, 9, 504–508. [Google Scholar]
  27. Capra, A.; Scicolone, B. Progettazione e gestione degli impianti di irrigazione. In Criteri di Impiego e Valorizzazione delle Acque per Uso Irriguo, 2nd ed.; Edagricola: Milano, Italy, 2016. [Google Scholar]
  28. Duffie, J.A.; Beckman, W.A.; Blair, N. Solar Engineering of Thermal Processes, Photovoltaics and Wind, 5th ed.; John Wiley & Sons: Hoboken, NJ, USA, 2020. [Google Scholar]
  29. Baum, M.C.; Michael, D.D.; Grady, L.M. Analysis of residential irrigation distribution uniformity. J. Irrig. Drain. Eng. 2005, 131, 336–341. [Google Scholar] [CrossRef]
  30. Bozkurt, S.; Bozkurt, G.S. The effects of drip line depths and irrigation levels on yield, quality and water use characteristics of lettuce under greenhouse condition. Afr. J. Biotechnol. 2011, 10, 3370–3379. [Google Scholar]
  31. Acutis, M.; Scaglia, B.; Confalonieri, R. Perfunctory analysis of variance in agronomy, and its consequences in experimental results interpretation. Eur. J. Agron. 2012, 43, 129–135. [Google Scholar] [CrossRef]
  32. Singh, Y.; Rao, S.S.; Regar, P.L. Deficit irrigation and nitrogen effects on seed cotton yield, water productivity and yield response factor in shallow soils of semi-arid environment. Agric. Water Manag. 2010, 97, 965–970. [Google Scholar] [CrossRef]
  33. Barbosa, G.L.; Gadelha, F.D.A.; Kublik, N.; Proctor, A.; Reichelm, L.; Weissinger, E.; Halden, R.U. Comparison of land, water, and energy requirements of lettuce grown using hydroponic vs. conventional agricultural methods. Int. J. Environ. Res. Public Health 2015, 12, 6879–6891. [Google Scholar] [CrossRef] [Green Version]
  34. Maraseni, T.N.; Mushtaq, S.; Reardon-Smith, K. Integrated analysis for a carbon-and water-constrained future: An assessment of drip irrigation in a lettuce production system in eastern Australia. J. Environ. Manag. 2012, 111, 220–226. [Google Scholar] [CrossRef] [Green Version]
  35. Turner, N.C. Stomatal behavior and water status of maize, sorghum and tobacco under field conditions. II. At low soil water potential. Plant Physiol. 1974, 53, 360–365. [Google Scholar] [CrossRef] [PubMed] [Green Version]
Figure 1. Effect of the irrigation strategy (HS100 = recovery of 100% ETc calculated by the Hargraves–Samani equation; HS50 = recovery of 50% ETc calculated by the Hargraves–Samani equation; HS25 = recovery of 25% ETc calculated by the Hargraves–Samani equation; Sensors = recovery of irrigation through soil moisture sensors) on lettuce (a) Marketable yield, (kg FW m−2) and (b) water use efficiency, (WUE, g FW L−1 H2O). Vertical bars indicate SE, different letters indicate significant differences with p ≤ 0.05.
Agronomy 10 00668 g001
Figure 2. Experiment 2: Effect of irrigation strategy (HS175 = recovery of 125% ETc calculated by the Hargraves–Samani equation; HS100 = recovery of 100% ETc calculated by the Hargraves–Samani equation; HS75 = recovery of 75% ETc calculated by the Hargraves–Samani equation; PM100 = recovery of ETc calculated by the Penman–Monteith equation) and mulching (white bars, no mulched, black bars, mulched) on soil-grown lettuce’s (a) marketable yield (kg FW m−2) and (b)water use efficiency (WUE, g FW L−1 H2O). Vertical bars indicate SE, different letters indicate significant differences with p ≤ 0.05.
Agronomy 10 00668 g002
Figure 3. Experiment 3: Effect of irrigation strategy (HS100 = recovery of 100% ETc calculated by the Hargraves–Samani equation; HS50 = recovery of 50% ETc calculated by the Hargraves–Samani equation; HS25 = recovery of 25% ETc calculated by the Hargraves–Samani equation; PM100 = recovery of 100% ETc calculated by the Penman–Monteith equation; PM50 = recovery of 50% ETc calculated by the Penman–Monteith equation; PM25 = recovery of 25% ETc calculated by the Penman–Monteith equation) and mulching (white bars, no mulched, black bars, mulched) on soil-grown lettuce’s (a) marketable yield and (b) water use efficiency (WUE, g FW L−1 H2O). Vertical bars indicate SE, different letters indicate significant differences with p ≤ 0.05.
Agronomy 10 00668 g003
Table 1. Main climatic features during the experiments.
Exp.Average Air Temperature (°C)RH (%)DLI 1 (mol m−2 d−1)Wind Speed (m s−1)ET0 (mm)GDD 4 (°C)
MinMaxMaxMinHS 2PM 3
Exp. 116.731.5734817.01.04.1-662
Exp. 217.032.3735016.71.44.03.8730
Exp. 319.535.6593020.91.95.64.8731
1 DLI = average daily light integrals; 2 HS = ET0 estimate by using the Hargraves–Samani equation; 3 PM = ET0 estimate by using the Penman–Monteith equation; 4 GDD = growing degree days, calculated based on a crop base temperature of 4 °C.
Table 2. Experiment 1: Effect of irrigation strategy on the physiological parameters of lettuce. Different letters indicate significant differences at Tukey HSD test (p ≤ 0.05). Data are the means of three replicates. Significance codes: *, significant at p ≤ 0.05; **, significant at p ≤ 0.01; ***, significant at p ≤ 0.001, “Ns” = not significant. HS25 = recovery of 25% ETc calculated by the Hargraves–Samani equation; HS50 = recovery of 50% ETc calculated by the Hargraves–Samani equation; HS100 = recovery of 100% ETc calculated by the Hargraves–Samani equation.
Water LevelIrrigation (mm)Stomatal Conductance (mmol m−2 s−1)Leaf Temperature (°C)SPAD Value
HS100130.4234 a22.7 b17.7 ab
HS5065.2229 a23.0 b16.7 b
HS2532.6115 b24.7 a21.6 ab
Sensors84.4233 a24.2 ab22.3 a
mean-******
Table 3. Experiment 1: Fresh and dry matter yield and dry matter percentage as affected by the irrigation strategy in lettuce. Different letters indicate significant differences in the Tukey HSD test (p ≤ 0.05). Data are the means of three replicates. Significance codes: *, significant at p ≤ 0.05; **, significant at p ≤ 0.01; ***, significant at p ≤ 0.001, “Ns” = not significant. HS25 = recovery of 25% ETc calculated by the Hargraves–Samani equation; HS50 = recovery of 50% ETc calculated by the Hargraves–Samani equation; HS100 = recovery of 100% ETc calculated by the Hargraves–Samani equation.
Water LevelIrrigation (mm)Plant FW (g plant−1)Plant DW (g plant−1)Dry Matter (%)
HS100130.4137 a13.4 a7.19 b
HS5065.2146 a14.0 a7.63 b
HS2532.6100 b5.90 b9.15 a
Sensors84.4141 a12.3 a8.55 ab
mean-********
Table 4. Experiment 2: Effect of the irrigation strategy and soil mulching on the physiological parameters of lettuce. Significance codes: *, significant at p ≤ 0.05; **, significant at p ≤ 0.01; ***, significant at p ≤ 0.001, “Ns” = not significant.
Stomatal Conductance (mmol m−2 s−1)Leaf Temperature (°C)SPAD
Irrigation strategy (IS)NsNsNs
Soil mulching (M)***NsNs
WL × M*****Ns
Table 5. Experiment 2: Effect of the interaction between irrigation strategy and soil mulching on the physiological parameters of lettuce. Different letters indicate significant differences in the Tukey HSD test (p ≤ 0.05). Lower case letters indicate differences between treatments; capital letters indicate differences between the means of the soil mulching factor. Data are the means of three replicates. HS75 = recovery of 75% ETc calculated by the Hargraves–Samani equation; HS100 = recovery of 100% ETc calculated by the Hargraves–Samani equation; HS125 = recovery of 125% ETc calculated by the Hargraves–Samani equation; PM100 = recovery 100% of ETc calculated by the Penman–Monteith equation. SM = Straw mulching; BS = Bare soil.
Irrigation StrategyIrrigation (mm)Stomatal Conductance (mmol m−2 s−1)Leaf Temperature (°C)
SMBSSMBS
HS100154312 ab207 bc29.4 abc30.5 a
HS75 116351 a201 c30.4 ab28.5 c
HS125193253 abc264 abc28.6 bc30.5 a
PM100133280 abc235 bc29.8 abc30.6 a
mean-299 A227 B--
Table 6. Experiment 2: Effect of irrigation strategy and soil mulching on the productive parameters of lettuce. Significance codes: *, significant at p ≤ 0.05; **, significant at p ≤ 0.01; ***, significant at p ≤ 0.001, “Ns” = not significant. FW = fresh weight; DW = dry weight; WUE = Water use efficiency.
Plant FW (g plant−1)Plant DW (g plant−1)Dry Matter (%)Marketable Yield (kg m−2)WUE (g FW L−1 H2O)
Irrigation strategy (IS)NsNs*Ns***
Mulch (M)*****Ns******
WL × M**Ns*******
Table 7. Experiment 2: Effect of the interaction between irrigation strategy and soil mulching on the productive parameters of lettuce. Different letters indicate significant differences in the Tukey HSD test (p ≤ 0.05). Lower case letters indicate differences between treatments; capital letters indicate differences between the means of 1 soil mulching or 2 irrigation strategy factor. Data are the means of three replicates. HS75 = recovery of 75% ETc calculated by the Hargraves–Samani equation; HS100 = recovery of 100% ETc calculated by the Hargraves–Samani equation; HS125 = recovery of 125% ETc calculated by the Hargraves–Samani equation; PM100 = recovery 100% of ETc calculated by the Penman–Monteith equation. SM = Straw mulching; BS = Bare soil.
Irrigation StrategyIrrigation (mm)Plant FW (g plant−1)Dry Matter (%)
SMBSSMBSMean 2
HS100154211 a134 c7.10 a6.56 ab6.84 AB
HS75 116191 ab138 c6.80 ab6.58 ab6.70 AB
HS125193186 ab161 bc6.91 a5.30 b6.11 B
PM100133156 bc140 c7.29 a7.07 a7.19 A
Mean 1-186 A143 B---
Table 8. Experiment 3: Effect of irrigation strategy and soil mulching on the physiological parameters of lettuce. Significance codes: *, significant at p ≤ 0.05; **, significant at p ≤ 0.01; ***, significant at p ≤ 0.001, “Ns” = not significant.
Stomatal Conductance (mmol m−2 s−1)Leaf Temperature (°C)SPAD Value
Irrigation strategy (IS)********
Soil mulching (M)NsNs***
WL × MNsNsNs
Table 9. Experiment 3: Effect of irrigation strategy on the physiological parameters of lettuce. Different letters indicate significant differences in the Tukey HSD test (p ≤ 0.05). Data are the means of four replicates. HS75 = recovery of 75% ETc calculated by the Hargraves–Samani equation; HS100 = recovery of 100% ETc calculated by the Hargraves–Samani equation; HS125 = recovery of 125% ETc calculated by the Hargraves–Samani equation; PM25 = recovery 25% of ETc calculated by the Penman–Monteith equation; PM50 = recovery 50% of ETc calculated by the Penman–Monteith equation; PM100 = recovery 100% of ETc calculated by the Penman–Monteith equation.
Water LevelIrrigation (mm)Stomatal Conductance (mmol m−2 s−1)Leaf Temperature (°C)SPAD Value
HS100153359 abc28.5 c19.3 ab
HS50 77322 bc30.4 b20.6 a
HS2538272 c33.1 a20.7 a
PM100141416 a30.8 b18.0 b
PM5070365 ab30.8 b18.9 ab
PM2535283 bc33.3 a19.5 ab
Table 10. Experiment 3: Effect of irrigation strategy and soil mulching on the productive parameters of lettuce. Significance codes: *, significant at p ≤ 0.05; **, significant at p ≤ 0.01; ***, significant at p ≤ 0.001, “Ns” = not significant. FW = fresh weight; DW = dry weight; WUE = Water use efficiency.
Plant FW (g plant−1)Plant DW (g plant−1)Dry Matter (%)Marketable Yield
(kg m−2)
WUE (g FW L−1 H2O)
Irrigation strategy (IS)***NsNs******
Mulch (M)***************
WL × M****Ns******
Table 11. Experiment 3: Effect of the interaction between irrigation strategy and soil mulching on the productive parameters of lettuce. Different letters indicate significant differences in the Tukey HSD test (p ≤ 0.05). Lower case letters indicate differences between treatments; capital letters indicate differences between the means of 1 soil mulching or 2 irrigation strategy factor. Data are the means of three replicates. HS100 = recovery of 100% ETc calculated by the Hargraves–Samani equation; HS50 = recovery of 50% ETc calculated by the Hargraves–Samani equation; HS25 = recovery of 25% ETc calculated by the Hargraves–Samani equation; PM100 = recovery of 100% ETc calculated by the Penman–Monteith equation; HS50 = recovery of 50% ETc calculated by the Penman–Monteith equation; HS25 = recovery of 25% ETc calculated by the Penman–Monteith equation. SM = Straw mulching; BS = Bare soil; WUE = Water use efficiency.
Irrigation StrategyIrrigation (mm)Plant FW (g plant−1)Plant DW (g plant−1)
SMBSMean 2SMBSMean 2
HS100153160 abc128 cd144 B10.7 abc8.46 abc-
HS5077187 a147 bc167 A11.5 ab8.72 abc-
HS2538179 ab97.6 d134 B12.6 a6.88 c-
PM100141155 abc137 bc147 AB9.73 abc9.57 abc-
PM5070156 abc154 abc153 AB9.12 abc9.60 abc-
PM2535140 bc124 cd132 B9.70 abc8.29 bc-
Mean 1-162 A131 B-10.5 A8.61 B-

