Article

22KD Zein Content Coordinates Transcriptional Activity during Starch Synthesis in Maize Endosperm

National Key Laboratory of Crop Genetic Improvement, Huazhong Agricultural University, Wuhan 430070, China
*
Author to whom correspondence should be addressed.
These authors have contributed equally to this work.
Agronomy 2020, 10(5), 624; https://doi.org/10.3390/agronomy10050624
Submission received: 1 April 2020 / Revised: 16 April 2020 / Accepted: 21 April 2020 / Published: 28 April 2020
(This article belongs to the Special Issue Maize Breeding for Alternative and Multiple Uses)

Abstract

:
Starch, the main form of stored energy in plants, plays an important role in maize (Zea mays L.) kernel development. The Shrunken-2 (Sh2) gene encodes the large subunit of the rate-limiting starch biosynthetic enzyme ADP-glucose pyrophosphorylase (AGPase). The sh2 mutant exhibits impaired AGPase activity, resulting in the partial or complete loss of starch synthesis. Here, we investigated the transcriptional regulatory framework of sh2 through transcriptome and co-expression network analysis using an F2 population derived from the maize reference line B73 and sweet corn inbred line HZ508. We identified 5175 differentially expressed genes (DEGs), including 2878 upregulated and 2297 downregulated genes in sh2 mutant lines. DEGs are associated with various biological processes including nutrient reservoir activity, transferase activity, catalytic activity, water deprivation and glycogen metabolism. At the genetic level, 2465 DEGs, including 357 transcription factors, were involved in transcription. In addition, the maize floury and opaque mutant genes fl1, ndk2, o7 and o2, which regulate the biosynthesis of 22KD zein, were co-expressed with the differential expressed transcription factor genes, thus suggesting that zein content might be a key regulator coordinating the expression of genes determining starch accumulation in maize endosperm.

1. Introduction

Starch regulation draws the attention of the scientific community, as this polymer is essential to meet energy needs in early plant development, human diet, feedstock and bioenergy. It accounts for up to 70% of the seed storage components in cereal endosperm and is thus a major contributor to yield as well as the main source of energy for seed germination and seedling growth. Starch production is a multistep mechanism starting with the conversion of Glc-1-P and ATP into ADP-Glc by ADP-glucose pyrophosphorylase (AGPase). This step is particularly important, as the inhibition of AGPase activity results in the partial or complete termination of starch biosynthesis, which greatly reduces yields [1,2]. AGPase is made of two subunits known as the large subunit (LSU) and small subunit (SSU). Genes encoding for AGPase subunits depend on the organ and tissue where they are localized. The fate of LSU and SSU are determined by Agpslzm and Agpllzm in the leaf, shrunken2 (Sh2) and brittle2 (Bt2) in the endosperm while Agplsmzm and Agplemzm are specifically expressed in the embryo [3]. Knocking down of Sh2 and Bt2 genes yields the starch-deficient mutant with a pericarp shrivel upon maturation [4]. As the mutant sh2 and bt2 genes behave in a complementary manner, the complete loss of function, which is lethal, requires a double homozygous mutant [4]. Heterologous expression of the gene encoding Escherichia coli glgC AGPase increased tuber yield by 35% in potato (Solanum tuberosum L.) [5], grain yield by 11% in rice (Oryza sativa L.) [6] and seed weight by 13% to 25% in maize [7]. Likewise, the inhibition of AGPase activity using site-specific mutagenesis system [8] and overexpression of Sh2 [9] also lead to an increase of maize seed weight by 11%–18%. Heterologous expression of a modified form of maize Sh2 (Sh2r6hs) increased yield by 38% in wheat (Triticum aestivum L.) [10], 23% in rice [11] and 64% in maize [12]. Although AGPase is crucial for starch biosynthesis and seed development in maize, the genetic and molecular mechanisms regulating this process need to be further clarified.
In this study, we aimed to get further insights into the genetic regulation of starch biosynthesis during maize kernel development.
We performed transcriptomic analysis using mutant sh2 kernels and wild-type kernels collected at 15 days after pollination (DAP), as well as co-expression network analysis using RNA-seq data from some well-known maize kernel mutants. Finally, we confirmed the reliability of our RNA-seq data via qRT-PCR using various differentially expressed genes (DEGs) related to starch or zein biosynthesis. Our analyses uncovered huge changes in the transcriptome of sh2 and point to four zein-related genes as major coordinators of transcriptional activity occurring during endosperm development in maize kernels.

2. Materials and Methods

2.1. Plant Materials and Sample Collection

Maize kernels harboring the starch deficiency (shrunken) phenotype in the HZ508 background (HZ508sh2) were received from the agricultural academy of Enshi Tujia and Miao autonomous prefecture. This material was crossed with the maize inbred B73 to succinctly produce the F1 and F2 population used to carry this experiment.
The F1 plants were self-crossed; 15 days after pollination (DAP), samples were collected on developing F2 ears. On each ear, 10 homozygous mutant kernels (sh2sh2) and homozygous wild-type kernels (Sh2Sh2) were snap-frozen in liquid nitrogen and stored at −80 °C until RNA extraction. The identity of each kernel was confirmed by genotype analysis, and each set of 10 kernels constitute a sample that was replicated three times.

2.2. RNA Extraction and Library Construction

Total RNA was extracted from pooled wild-type and sh2 mutant kernels obtained from the same F2 ears derived from the cross B73 × HZ508sh2 at 15 DAP (10 kernels per sample) using TRIzol reagent, followed by cleanup and DNase I treatment using a Qiagen RNeasy Mini Kit, according to the manufacturer’s protocol. We used the Illumina NEBNext Ultra RNA Library Prep Kit ( cat.no E7530L New England Biolabs, MA, USA) to generate RNA-seq libraries following the manufacturer’s recommendations. These libraries were sequenced on the Illumina NovaSeq platform by Novogene.

2.3. Identification of DEGs

The sequence reads were trimmed using Trimmomatic (version: 0.33) and mapped to the B73 reference genome (RefGen_v4.34) using HISAT2 (version: 2.1.0). StringTie (version: 1.3.3b) was employed to reconstruct the transcripts and to estimate gene expression levels [13]. HTSeq (version: 0.6.1) was used to count the number of reads per gene. When using the DEseq2 package, we applied the p-value adjusted for multiple testing (padj) as a threshold. Significant DEGs are those with a padj of differential expression above the threshold (p < 0.05, absolute value of log2 (fold change) > 0.5). Gene ontology (GO) enrichment was performed for the significant DEGs using the agriGO Singular Enrichment Analysis tool with default parameters (http://bioinfo.cau.edu.cn/agriGO/) and REVIGO [14].

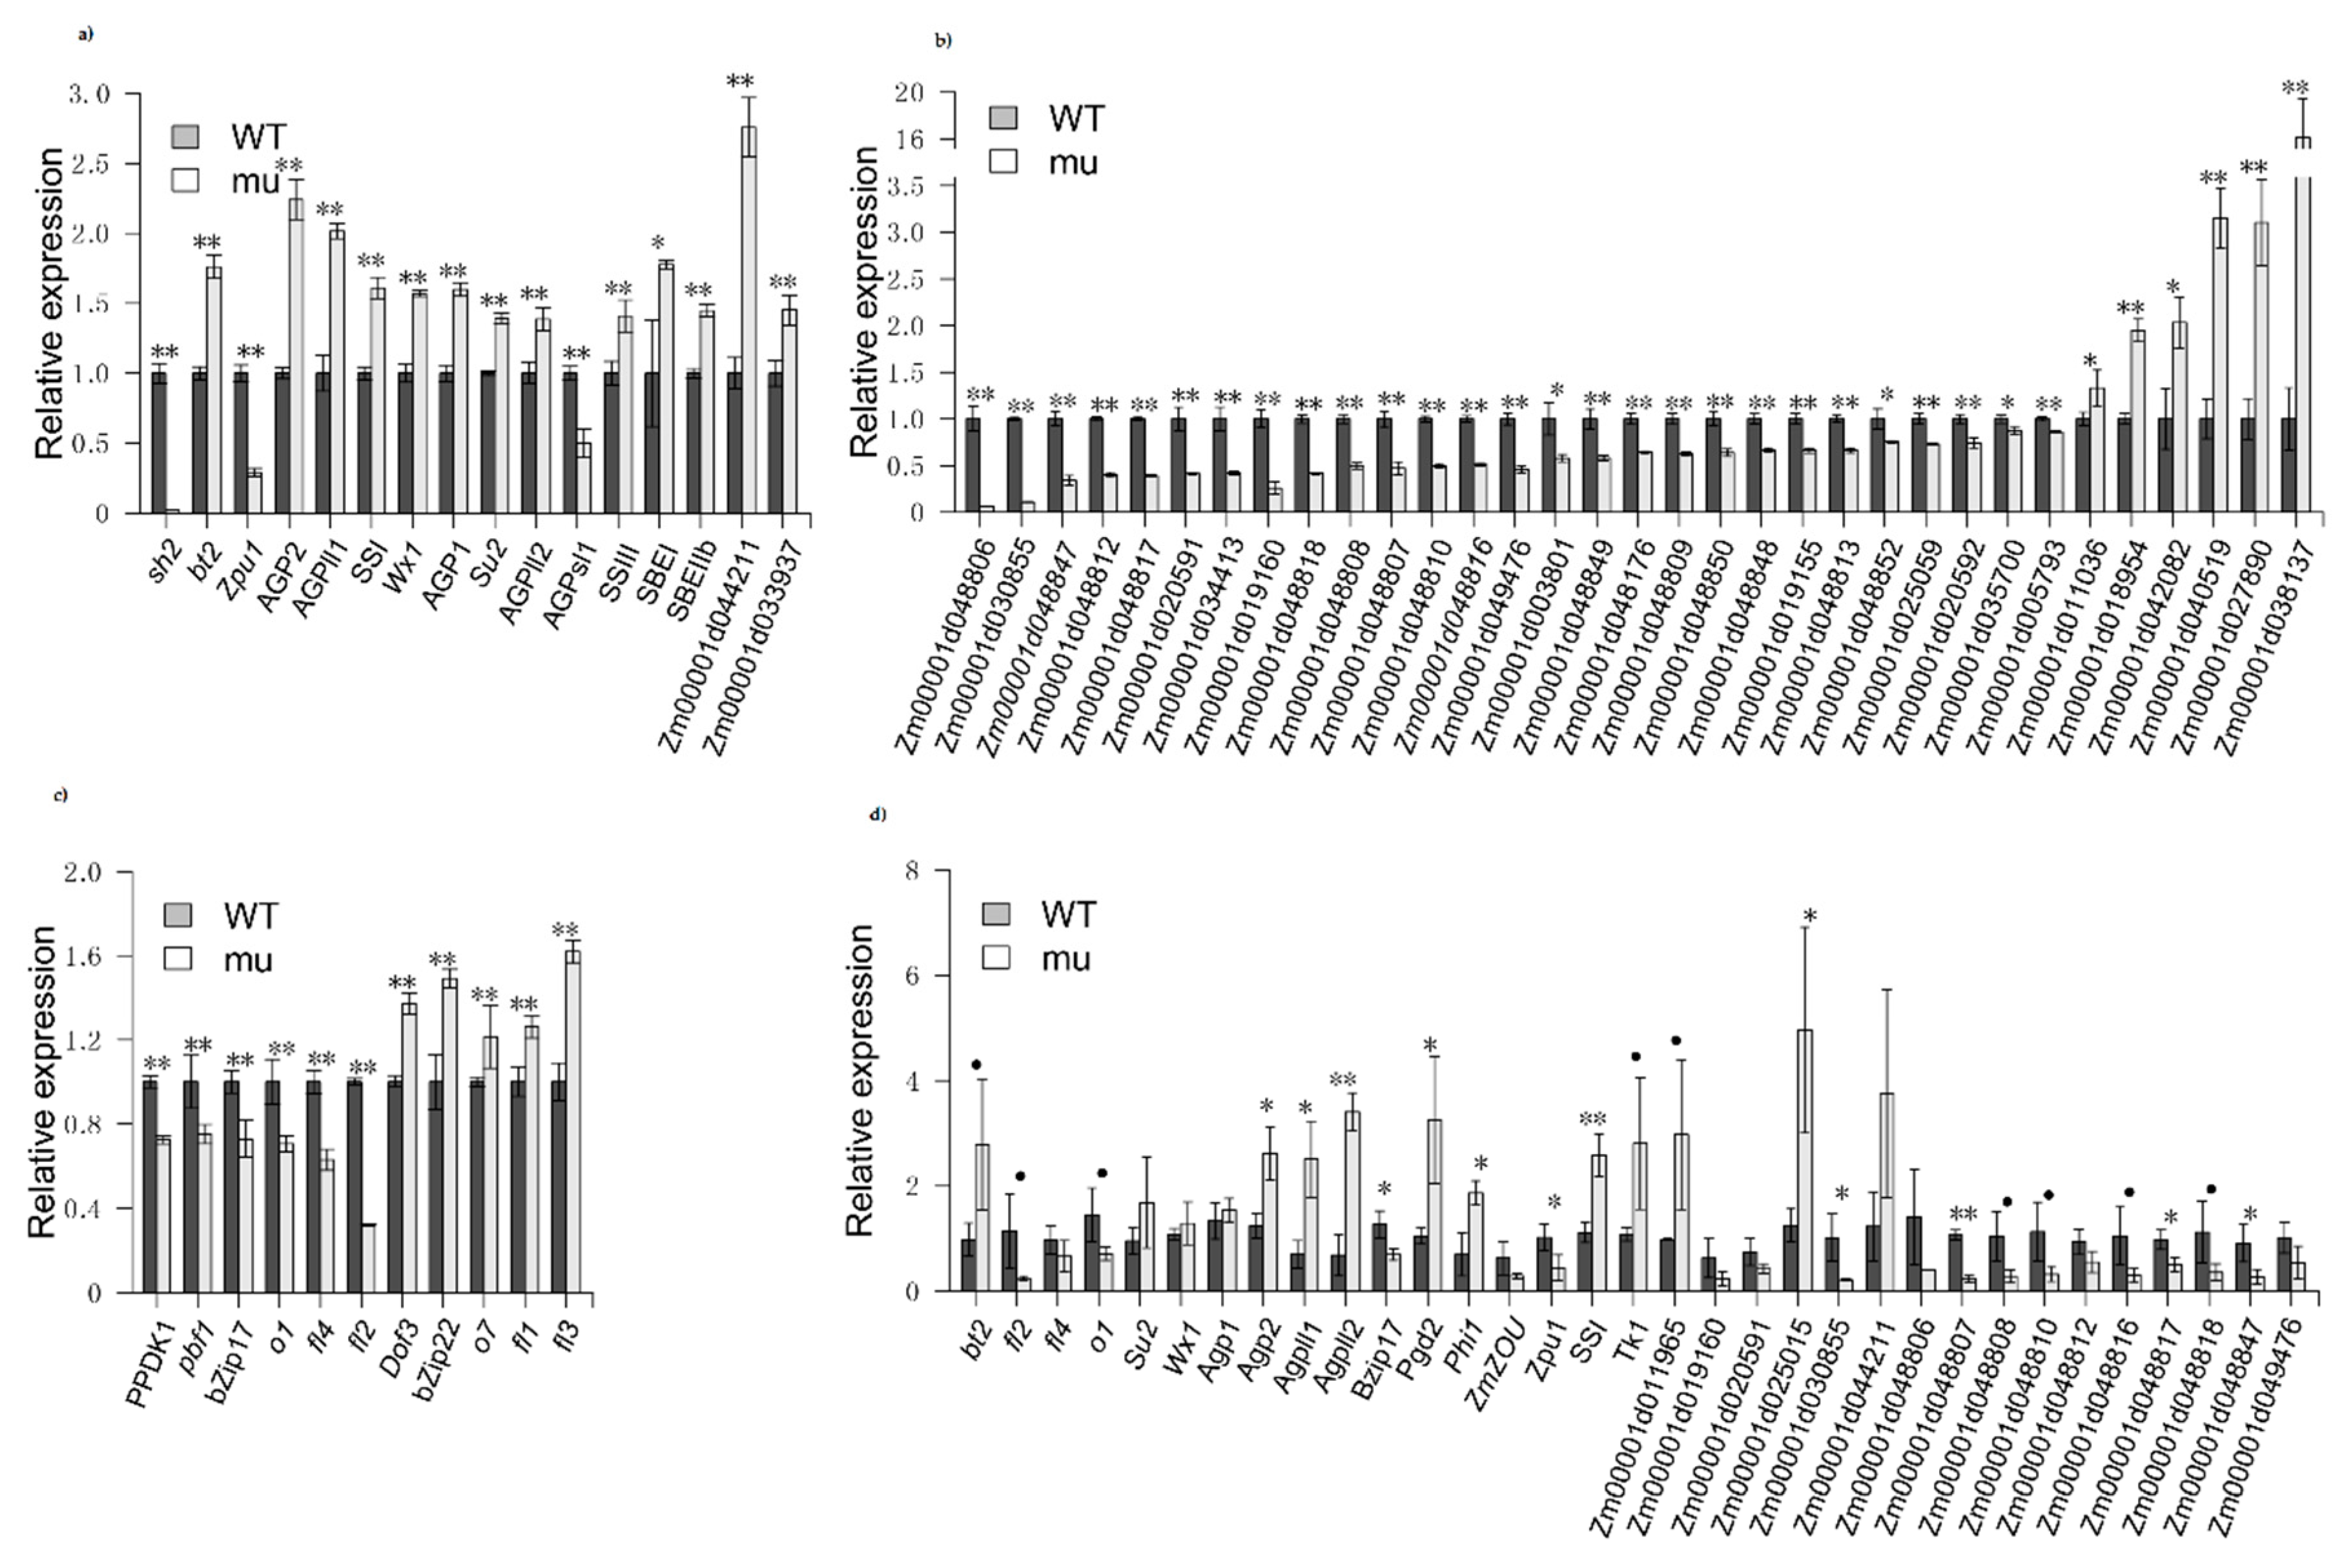
2.4. Confirmation of DEG

qRT-PCR was performed on 33 genes using SYBR Select Master Mix (Aidlab) on a CFX96 real-time PCR system (Bio-Rad, C1000 Touch). Relative expression levels were calculated using the comparative Ct method [15] and the maize actin gene (Zm00001d010159) as the internal control. All primers used are listed in Table S1.

2.5. Co-Expression Network Analysis of Well-Known Maize Kernel Mutant Transcriptomes

To construct a co-expression network, RNA-seq data from several well-known maize kernel mutants were obtained from the sequence read archive SRA database. Raw data filtering, mapping to the reference genome and gene expression level estimation were performed as described for RNA-seq data analysis. The weighted correlation network analysis (WGCNA) package in R was used to construct the gene co-expression network using the TPM matrix from StringTie. The analysis was conducted using an unsigned type of topological overlap matrix (TOM). For any gene pair (i and j), we applied the exponential adjacency function in the WGCNA algorithm to measure their relation index, the exponential weighted β square of the correlation coefficient (aij  =  power (Sij, β)  =  |Sij|β). Exponential weighted β is the power of the correlation coefficient. We selected β  =  12 after the analysis (fit value R2 to approximately 0.9). After determining the adjacency function parameter β, the correlation matrix S  =  [Sij] was switched into the adjacency matrix A  =  [aij] and converted into the topological overlap matrix Ω  =  [ωij]. ki or kj indicate the sum of one node’s adjacency coefficients. Genes for which the sum in each sample was below 80 (<80) and the standard deviation (SD) was below 100 (<100) or above 6000 (>6000) were filtered out, yielding 14,528 genes for WGCNA co-expression network analysis.
The node is a gene (i or j). The hierarchical clustering tree was built using the dissimilarity coefficient, and the different branches represent the gene modules. We used the function of cutreeDynamic in WGCNA package to identify gene modules. The soft thresholding power was 12, the relatively minimum module size was 30 and the absolute value of correlation was greater than 0.25.

3. Results

3.1. Isolation of Shrunken Mutant and DEGs

Using total RNA from the endosperm of sh2 mutant kernels and wild-type kernels at 15 DAP, we generated three mRNA libraries. After high-throughput sequencing and filtering of reads, we obtained 24.8–27.3 million clean reads (Table S2). We mapped these clean reads to the B73 reference genome (RefGen_v4.34). More than 91% of the clean reads were uniquely mapped to the reference genome for each sample (Table S3), and more than 94% of the mapped reads aligned to exons (Table S4). Comparing the structure of Sh2 gene in pooled wild-type and F2 samples, we observe that the structure of Sh2 gene was altered in this mutant (Figure S1). The wild-type Sh2 line has 15 transcribed exons while sh2 mutant line has only one exon. That difference also served as a basis for separating between wild-type and mutated shrunken kernels.
Identification of differentially expressed genes started by calculating the relative expression level of each gene using the unique mapped reads. Then, we normalized relative expression levels to the number of fragments per kilobase of the transcript sequence per million base pairs sequenced (FPKM) [16]. Principal component analysis based on these FPKM values showed that the three biological replicates of each sample were clustered into a single group (Figure S2).
Using DEGseq2 to identify DEGs, we detected 2878 upregulated genes and 2297 downregulated genes in sh2 under the threshold of padj < 0.05 and log2 (FoldChange) > 0.5 and log2 (FoldChange) < −0.5 (Figure S3).

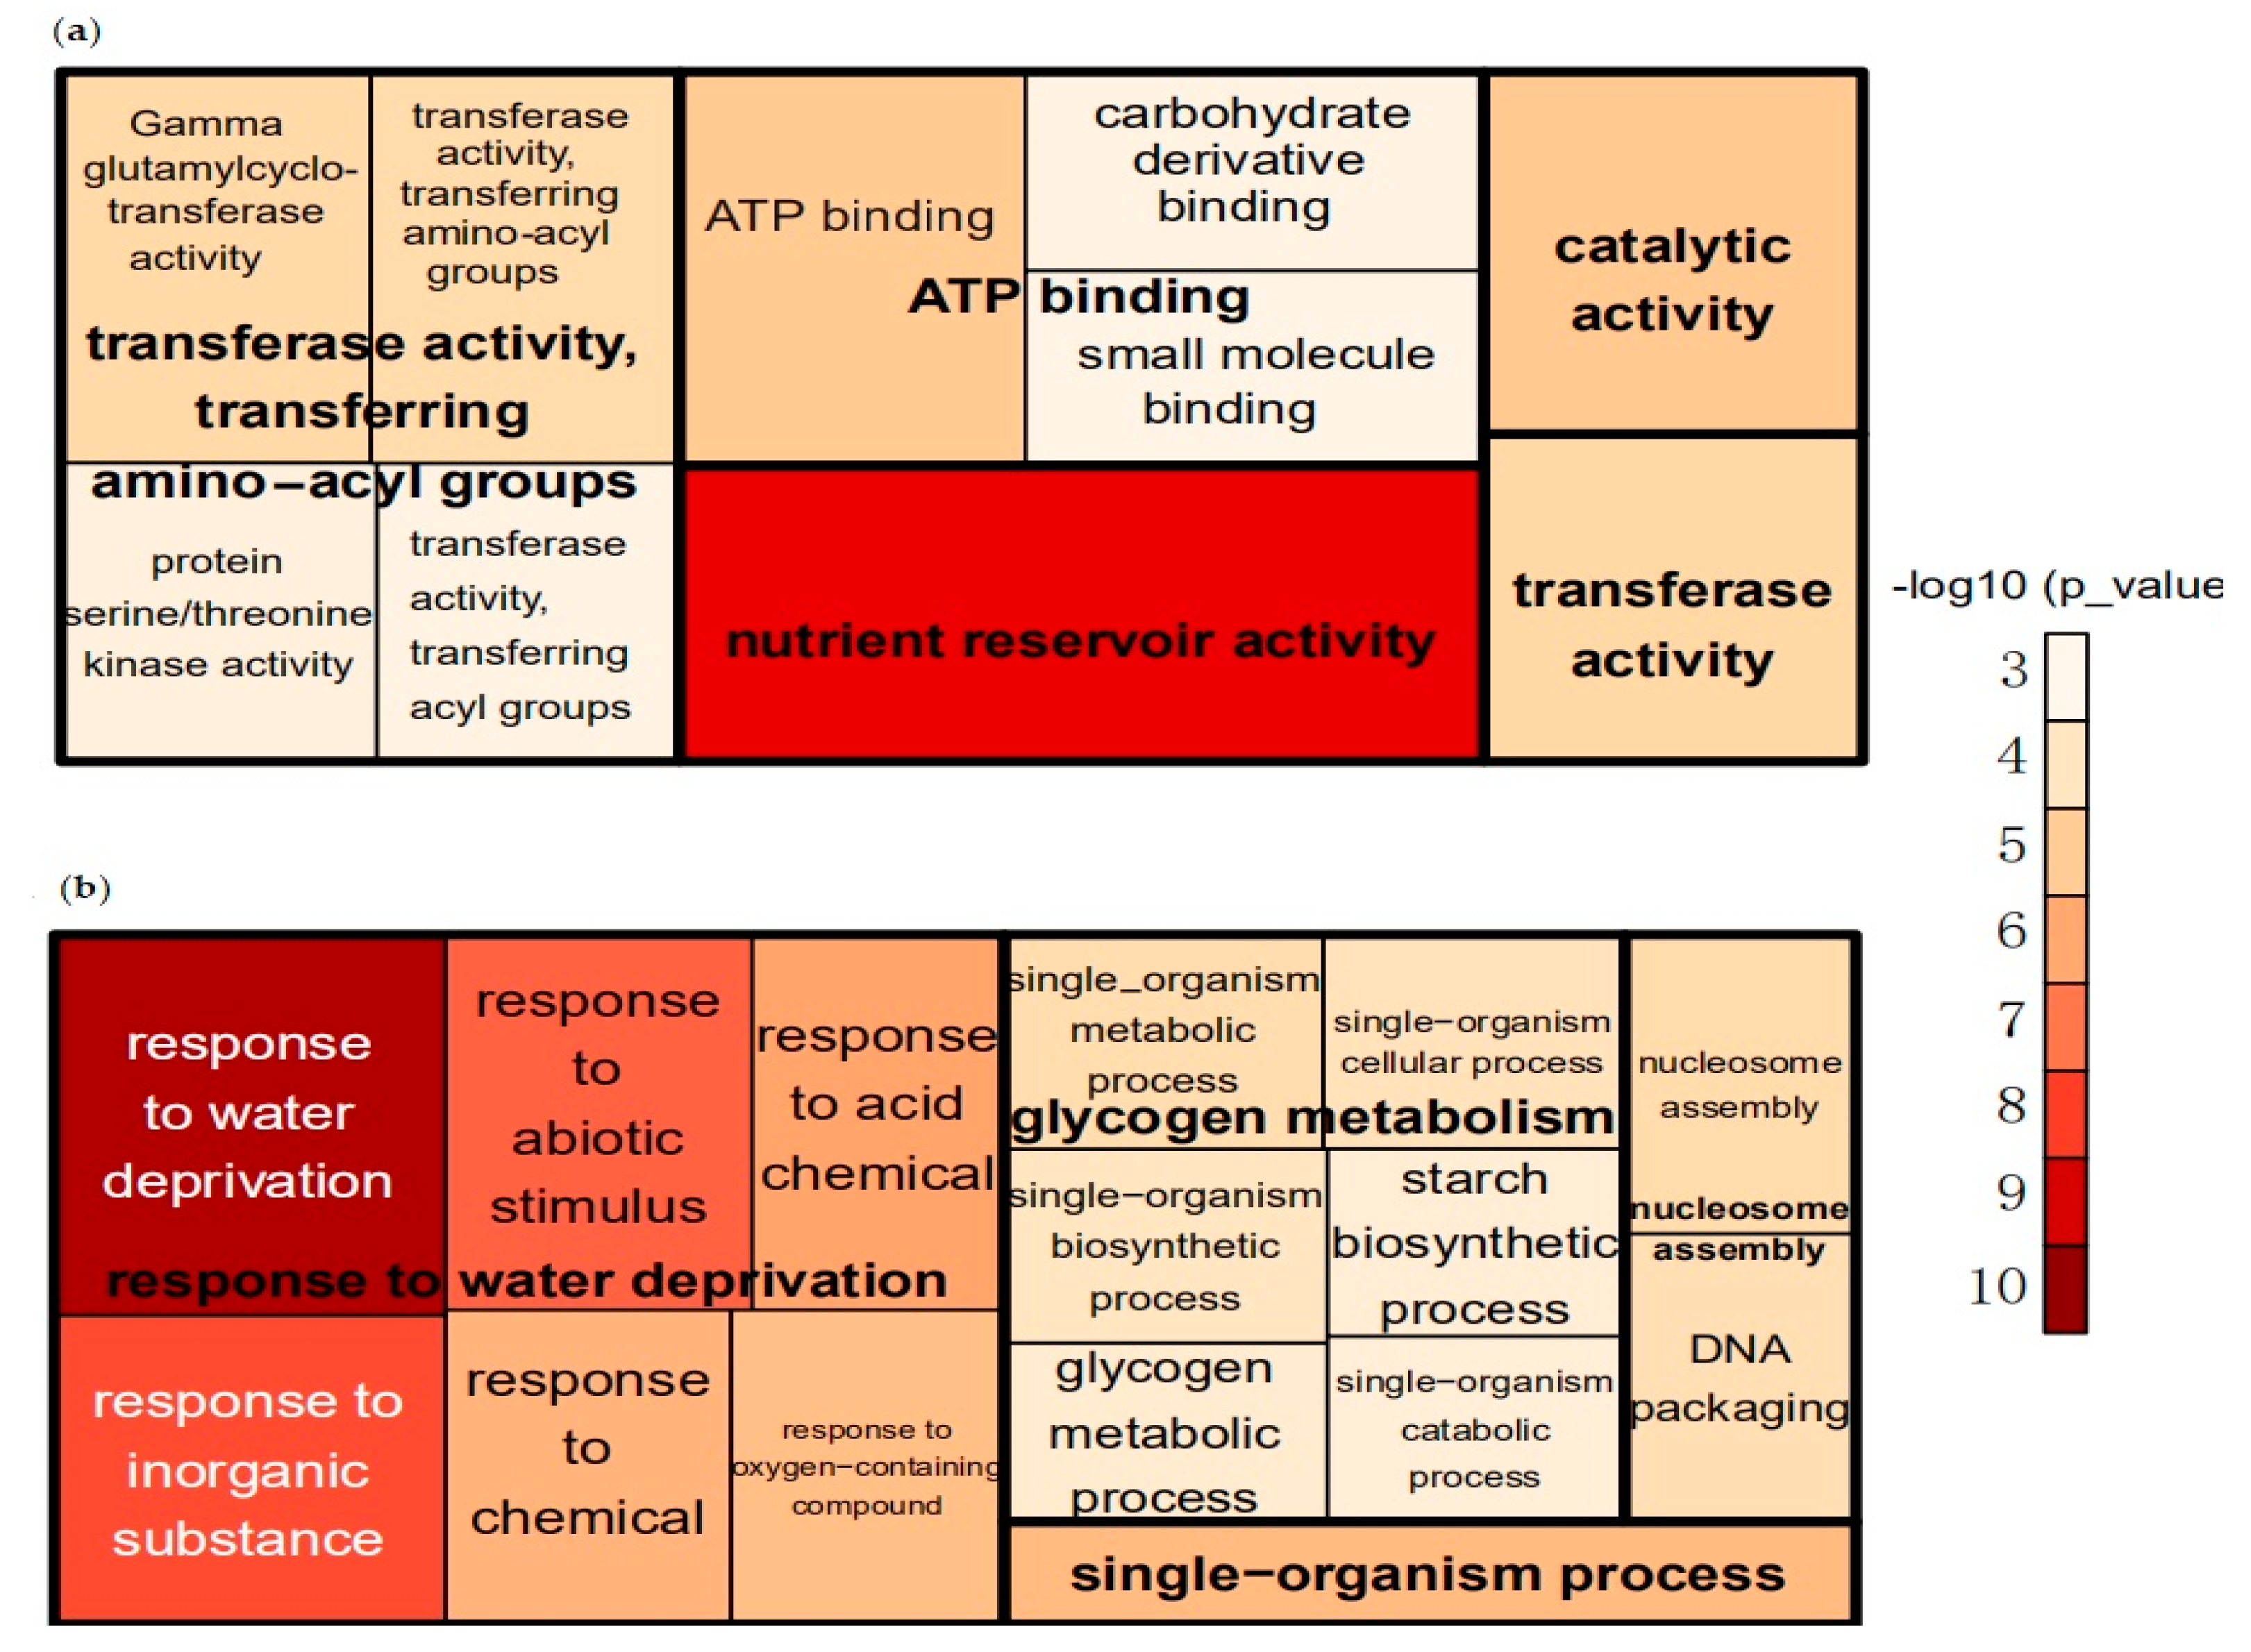
3.2. GO Enrichment Analysis of DEGs

Out of the 2297 downregulated genes in sh2, 74.44% could be functionally annotated using AgriGO. Most of the significantly enriched gene ontology (GO) terms belong to the molecular function category, including genes involved in nutrient reservoir activity, transferase activity, ATP binding, and catalytic activity. The biological process-related DEGs are involved in glutathione catabolic processes, organonitrogen compound catabolism, and sulfur compound catabolic processes. There were no significantly enriched GO terms in the cellular component category (Figure 1a, Table S5).
Out of the 2878 upregulated genes in sh2 mutant lines, 74.08% could be functionally annotated. DEGs in the biological process category include genes involved in the response to water deprivation, glycogen metabolism, nucleosome assembly and single-organism processes. Cellular-component-related genes are enriched in various GO categories, including nucleosome, cell junction, plasmodesmata and cell periphery. Molecular-function-related genes are involved in protein heterodimerization activity, oxidoreductase activity, cofactor binding, coenzyme binding, monooxygenase activity, acid phosphatase activity and DNA binding (Figure 1b, Table S6).

3.3. Starch Biosynthesis and Zein-Related Genes Are Differentially Regulated in sh2 Kernels

We identified seven AGPase-encoding DEGs between mutant and wild-type kernels. Out of these DEGs, five were upregulated and two were downregulated genes along with Sh2 in mutant lines. We identified nine additional DEGs involved in starch biosynthesis, including one phosphoglucomutase (PGM) gene, three glycogen synthase genes, three glucan-branching enzyme (GBE) genes, and one starch debranching enzyme gene. Out of these, only the starch debranching enzyme gene was downregulated in sh2 mutant lines (Figure 2a). In addition, 27 zein genes were downregulated and five were upregulated, which may lead to the reduced zein levels in the mutant kernels (Figure 2b). Many genes influencing zein accumulation and maize kernel development were differentially expressed between mutant and wild-type kernels, such as the classic semi-dominant maize endosperm mutant genes fl1, fl2, fl3 and fl4 [18,19,20,21]; the classic recessive maize endosperm mutant genes o1 and o7 [21,22]; and the maize endosperm mutant genes pbf1, bZIP17, and bZIP22 [23,24] and PPDK1 (Figure 2c), all of which could affect storage protein gene expression [25].
To confirm the reliability of the RNA-seq data, we analyzed the expression levels of individual DEGs using qRT-PCR analysis in mutant and wild-type kernels and found a high association between the two datasets (Figure 2d). The expression levels of many genes related to starch and zein biosynthesis were altered in the mutant, suggesting that the levels of starch and zein were altered due to the dysfunction of AGPase activity.

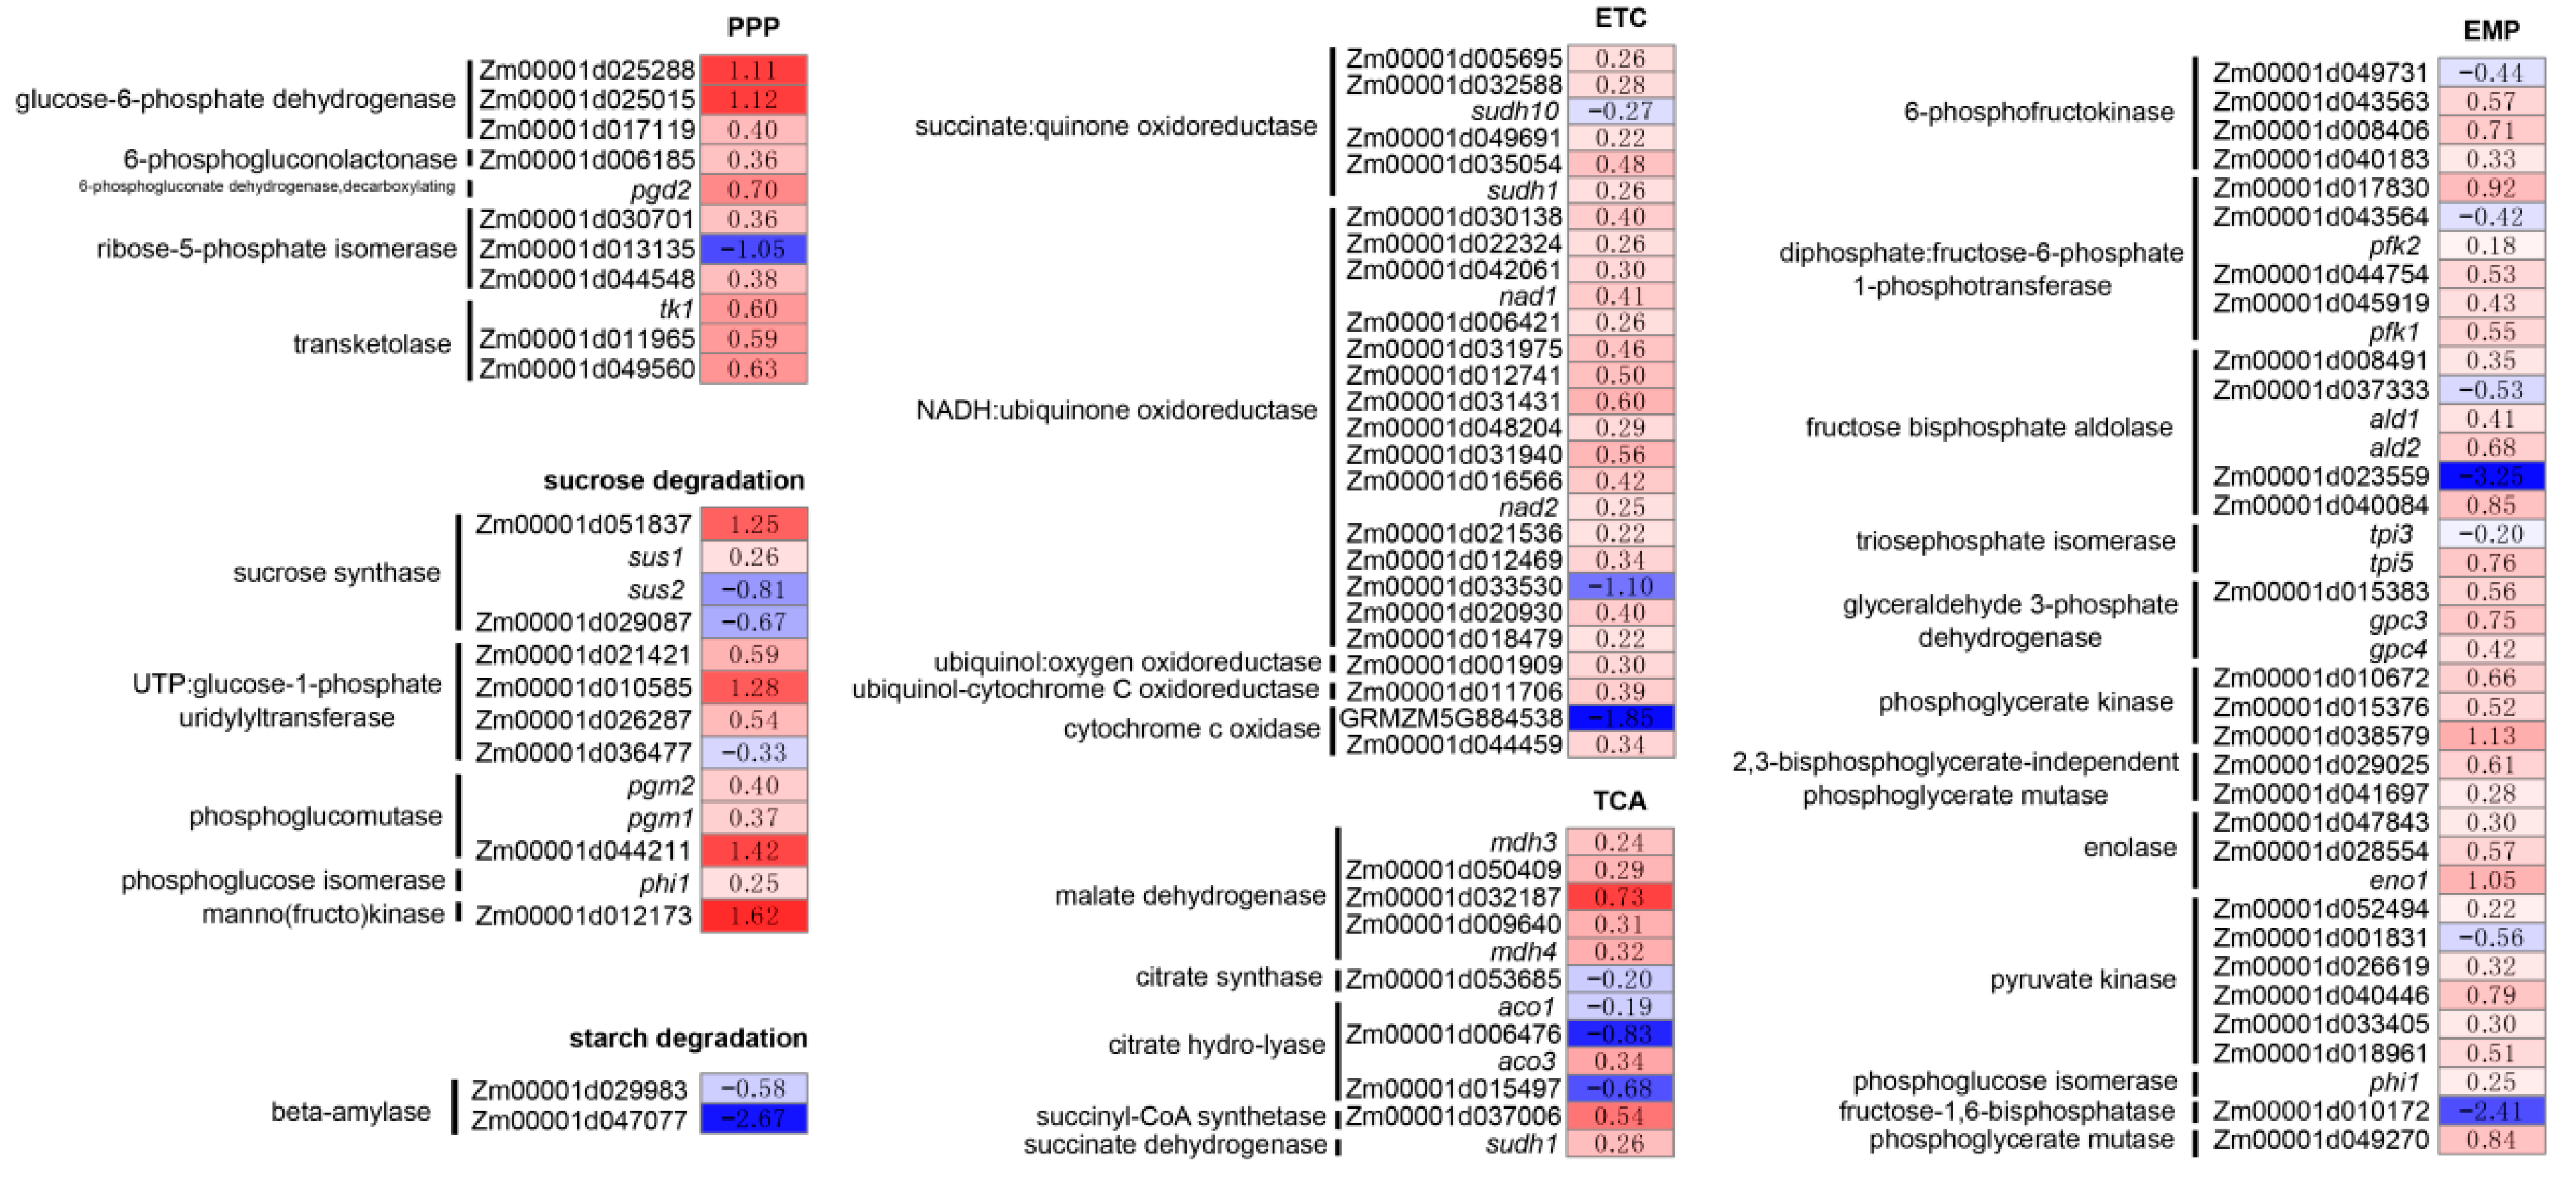
3.4. Carbohydrate Catabolism and Electron Transport Chain Related Genes Are Differentially Regulated in sh2 Kernels

As the weight of mature sh2 kernels was substantially reduced, we focused on genes in the carbohydrate catabolism pathway. We identified 103 DEGs in various carbohydrate catabolism pathways. For every enzyme in the Embden–Meyerhof–Parnas (EMP) pathway, at least one gene was differentially expressed, and most of these DEGs were upregulated in sh2 (Figure 3). Some of these enzymes are related to energy supply and maize kernel development, such as phosphofructokinase [26], and there is a competitive relationship between the EMP pathway and starch biosynthesis [27].
For the pentose phosphate pathway (PPP), 11 genes encoding five enzymes were differentially expressed, 10 of which were upregulated in sh2 mutant lines (Figure 3). For every enzyme in the sucrose degradation pathway, at least one gene was differentially expressed, and most were upregulated in sh2 (Figure 3). Sus1 and Sus2 play important roles in sucrose metabolism and plant growth, but the functions of these genes are different, perhaps explaining why they had opposite expression patterns in mutant and wild-type kernels [28]. No starch degradation genes were upregulated in mutant kernels (Figure 3).
We identified 12 and 27 DEGs involved in the tricarboxylic acid cycle (TCA) and electron transport chain (ETC) (Figure 3), respectively, which help supply energy for plant growth and function in stress resistance, but only 17.9% (7 of 39) of these were downregulated.

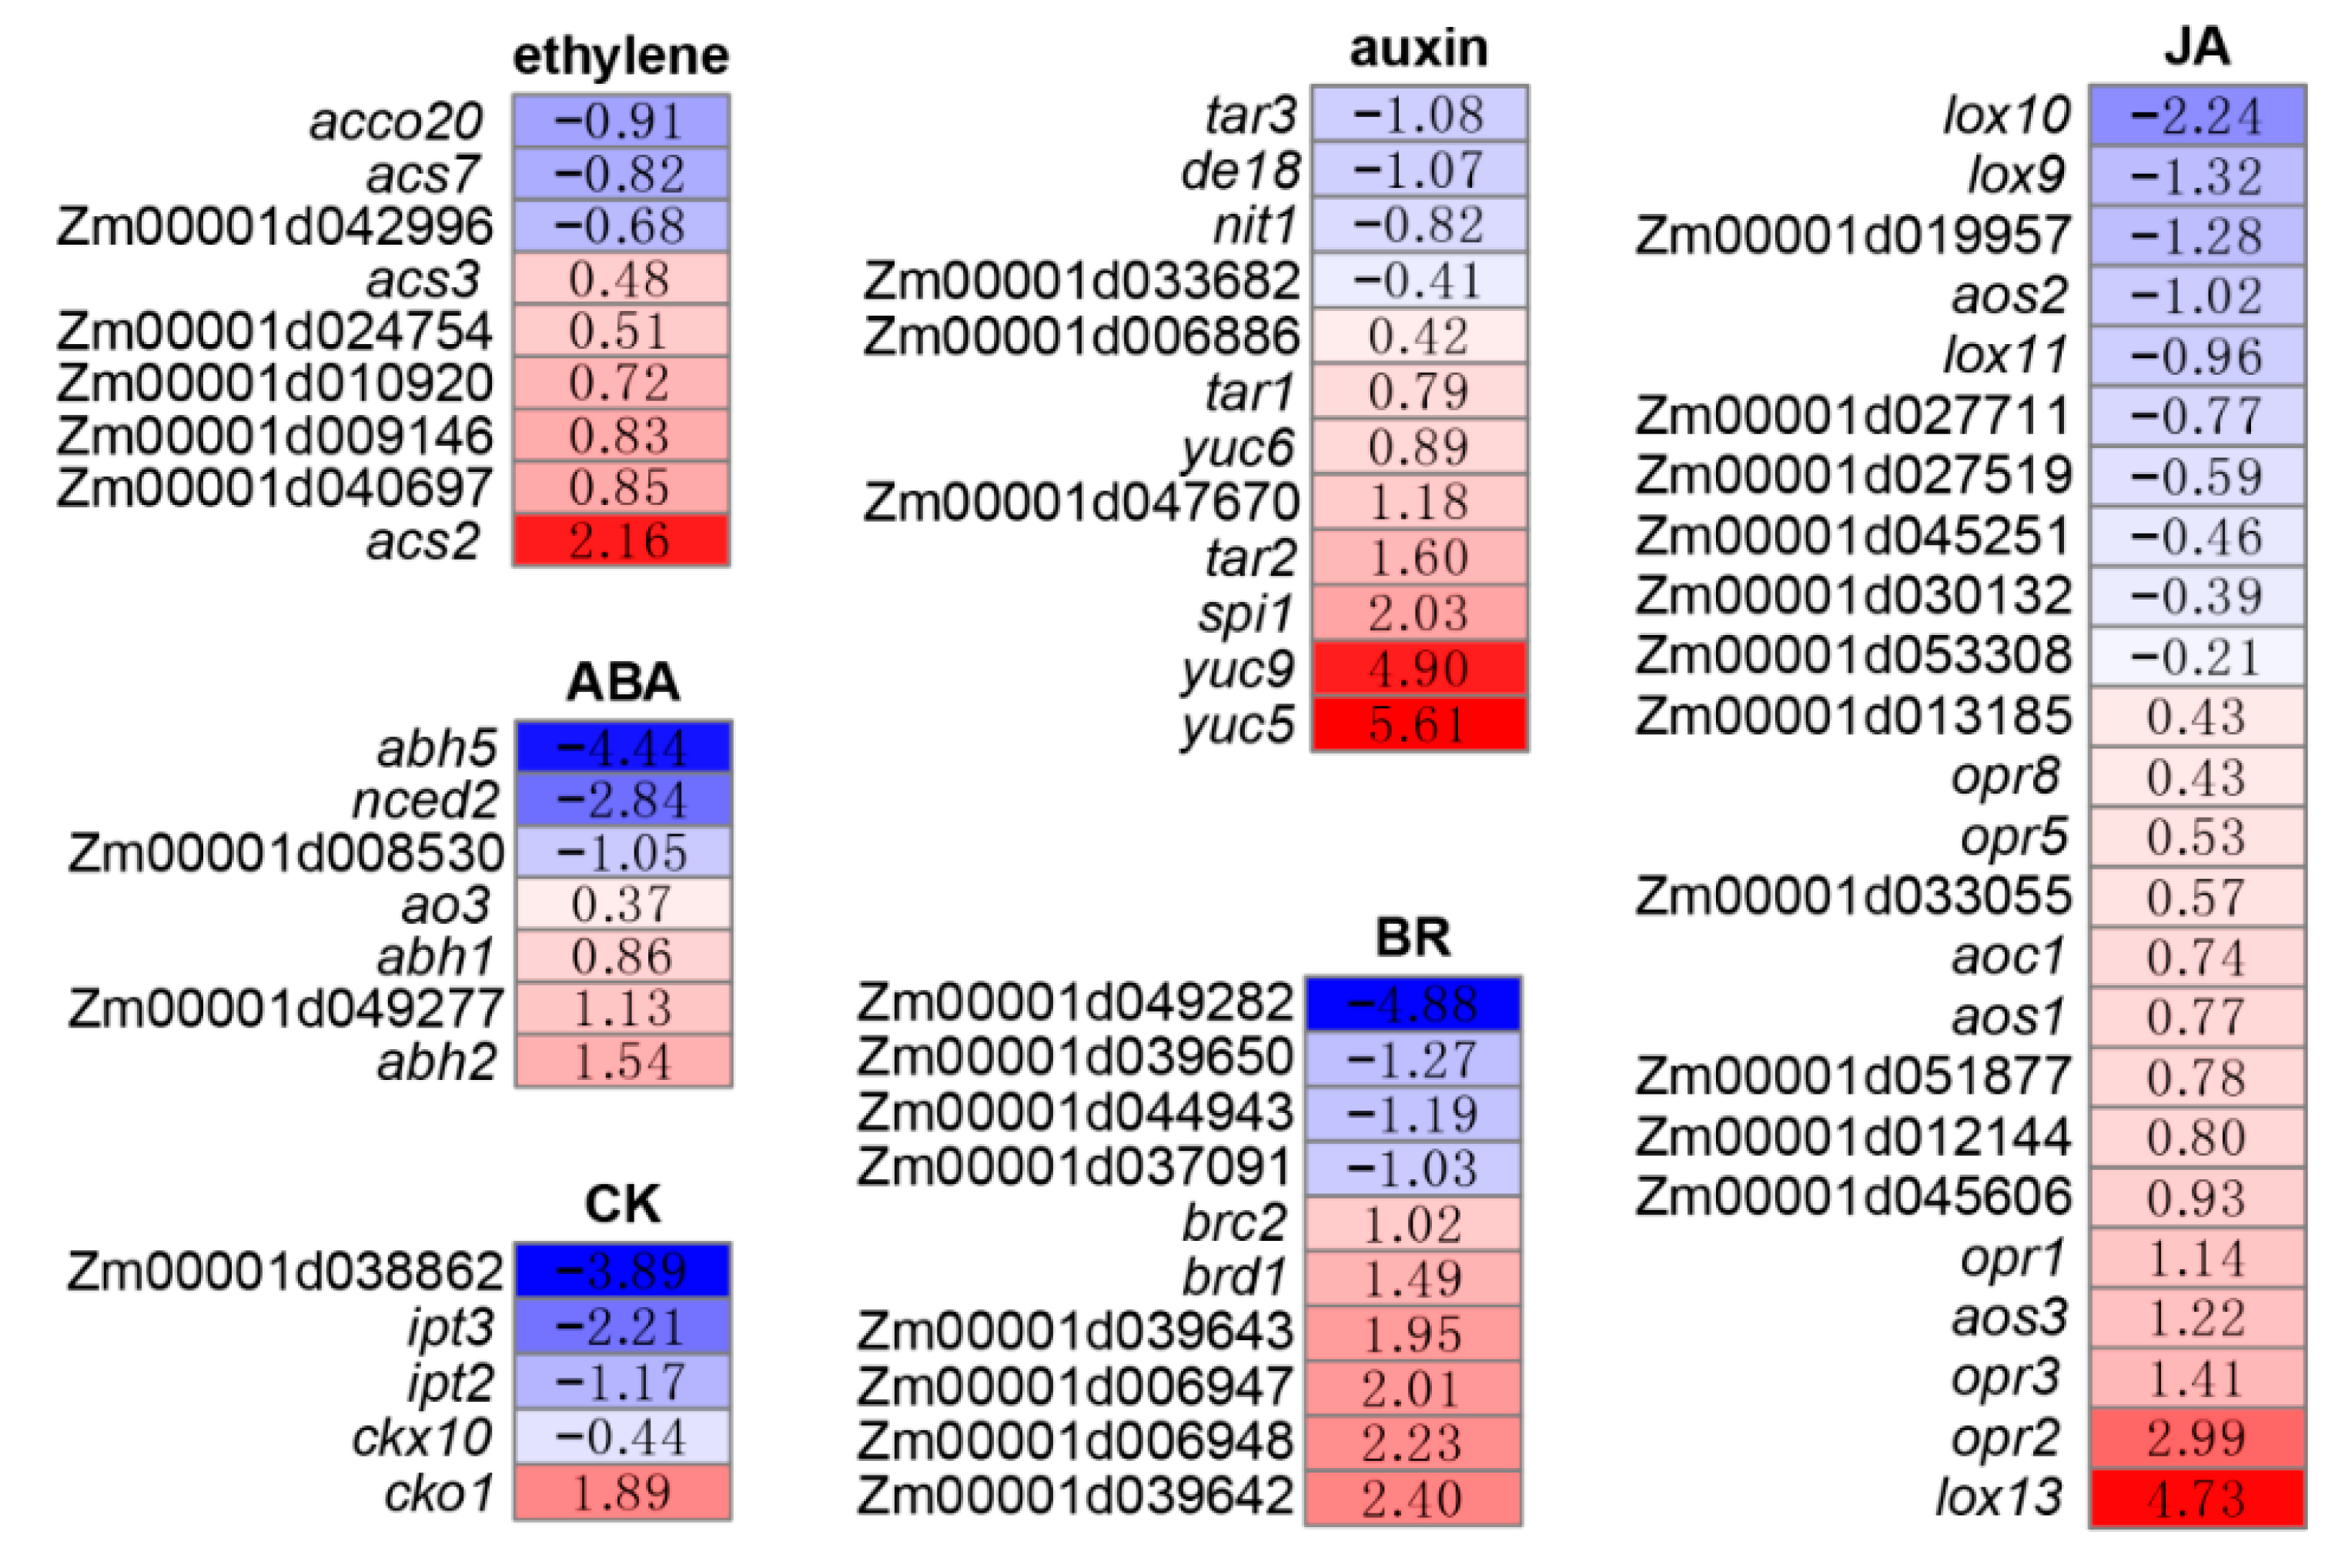
3.5. Hormone-Related DEGs

Hormones play important roles in regulating plant growth and kernel development. Ethylene negatively regulates those genes encoding enzymes related to starch biosynthesis [30]. We identified nine DEGs related to the ethylene metabolism pathway (Figure 4), and 34 ERFs (ethylene-responsive transcription factors) were differentially expressed between mutant and wild-type kernels, as revealed by RNA-seq (Table S7).
Abscisic acid (ABA) functions in abiotic stress resistance, and its levels of accumulation are highly correlated with starch accumulation [31]. Four genes related to ABA biosynthesis pathways and three genes related to ABA catabolic pathways were differentially expressed between mutant and wild-type kernels (Figure 4), including nced2, which codes for 9-cis-epoxycarotenoid dioxygenase (NCED) and catalyzes the conversion of 9-cis-epoxycarotenoids to xanthoxin, a key regulatory step in ABA biosynthesis [32]. Three genes (abh1, abh2 and abh5) encoding for ABA 8’-hydroxylase, an enzyme involved in the ABA catabolic pathway, were also differentially expressed [33].
Auxin regulates rice grain size [34]. The main form of auxin in plants is indole-3-acetic acid (IAA). We identified 12 DEGs related to the IAA biosynthesis pathway (Figure 4), including six indole-3-pyruvate monooxygenase genes, three 2-oxoglutarate aminotransferase genes, two indole-3-acetamide amidase genes and one nitrilase gene.
Jasmonic acid (JA) and the jasmonate signaling pathway regulate plant growth and influence grain yield [35,36]. We identified 24 DEGs related to the JA biosynthesis pathway (Figure 4), including genes encoding linoleate 13S-lipoxygenase, allene oxide synthase, 12-oxophytodienoate reductase, 3-oxo-2-(2’-[Z]-pentenyl) cyclopentane-1-octanoate CoA ligase, fatty-acyl coenzyme A oxidase, OPC8-trans-2-enoyl-CoA hydratase and OPC8-3-hydroxyacyl-CoA dehydrogenase. Brassinosteroids (BR) also have profound effects on plant growth and grain yield [34,37]. We identified 10 DEGs involved in BR biosynthesis and BR inactivation pathways (Figure 4). In addition, increased CK (cytokinin) activity leads to higher grain number and improved grain yield [38]. We identified five DEGs related to CK degradation and biosynthesis pathways (Figure 4), including cko1, the orthologue of which regulates grain shape in rice [39].

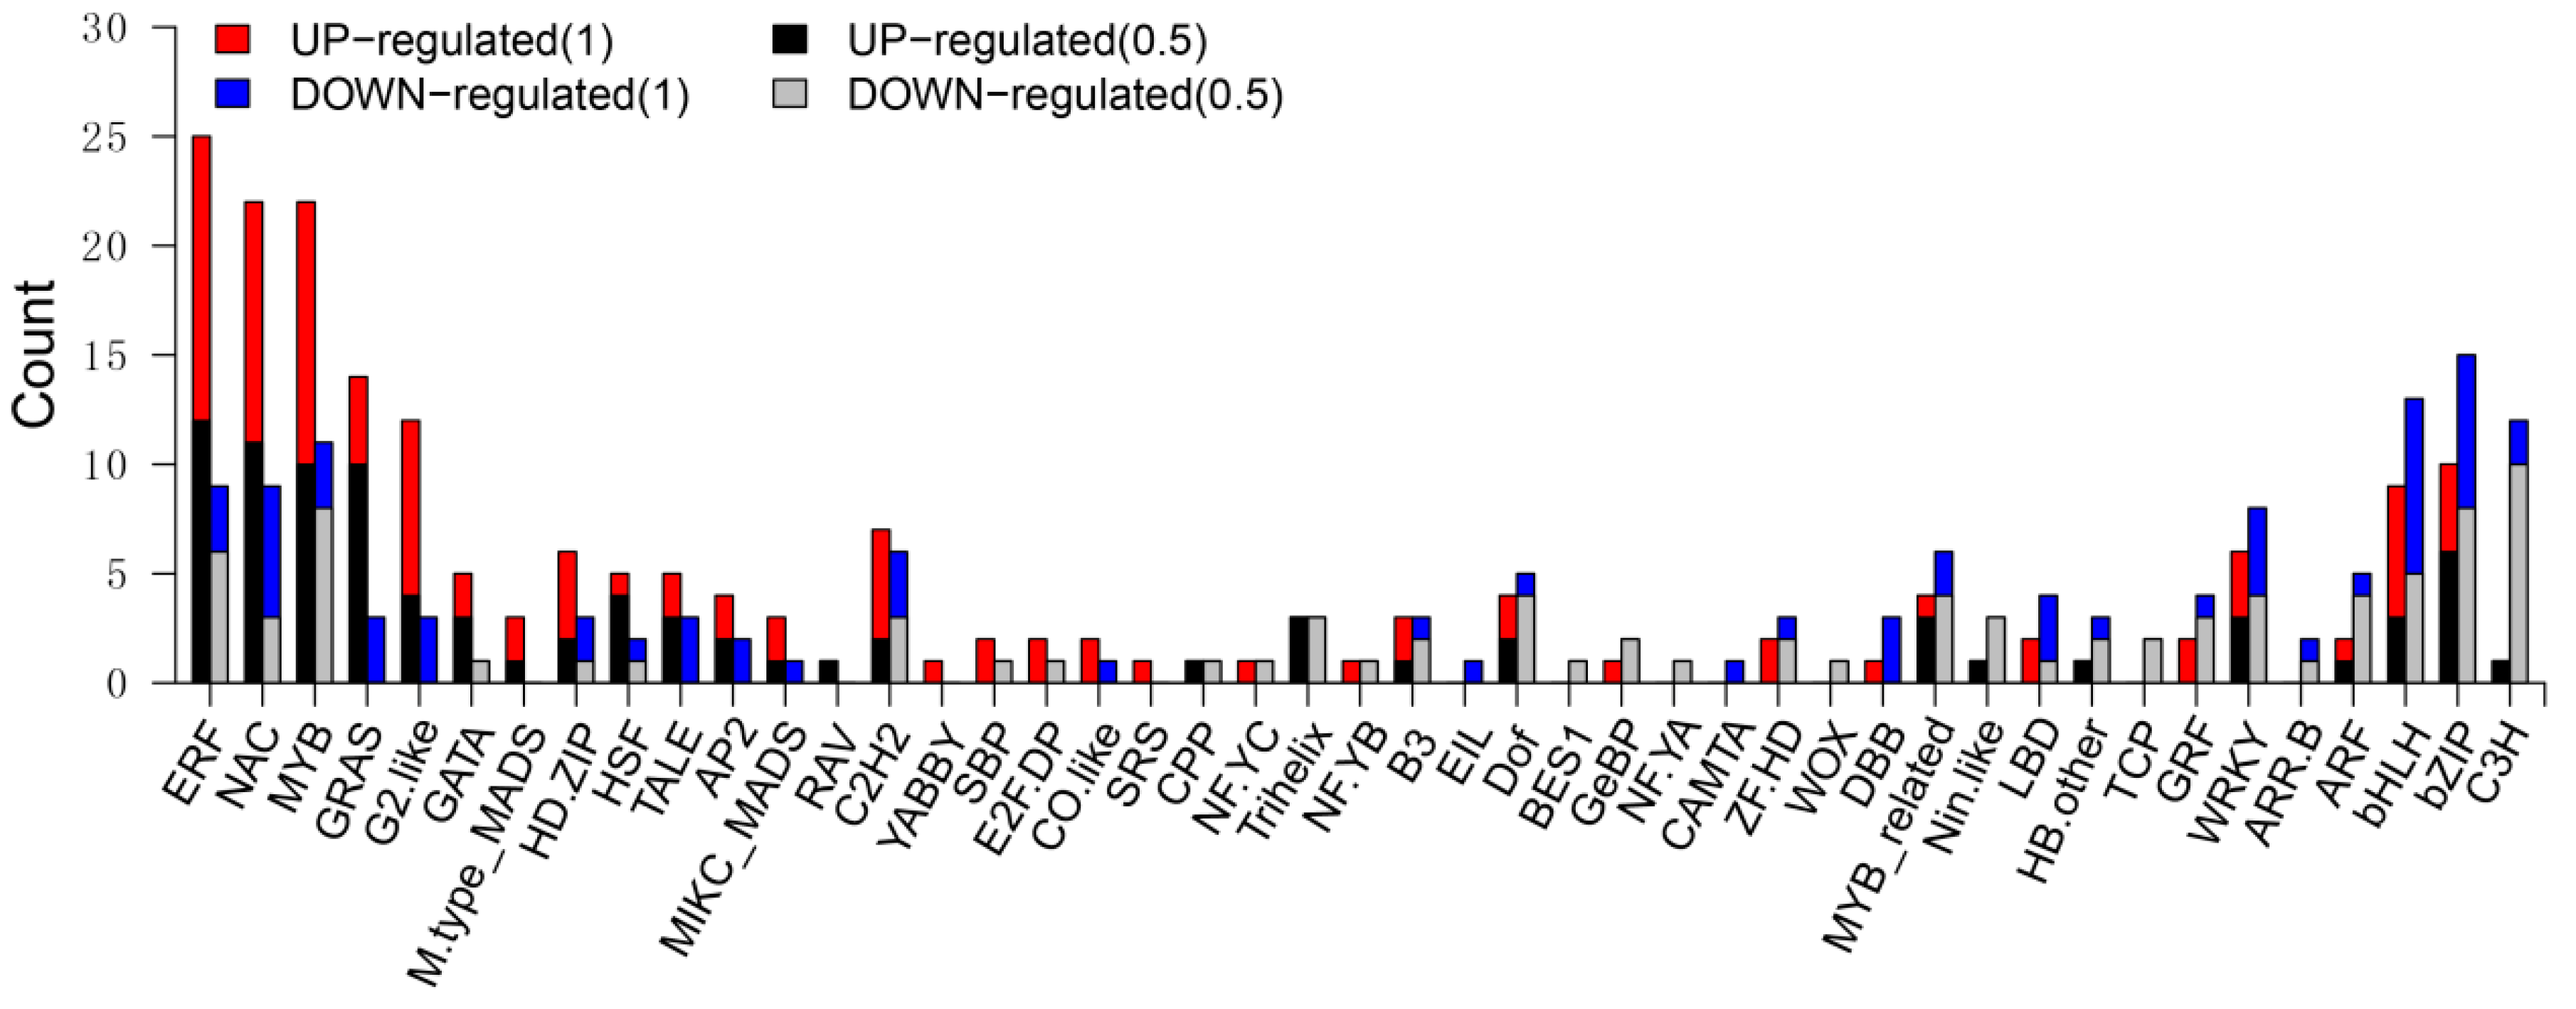
3.6. Differentially Expressed TF Genes between the Wild Type and sh2

To investigate potential regulators involved in starch biosynthesis and kernel development, we focused on differentially expressed TF genes based on annotations in PlantTFDB v4.0 [17]. We identified 160 (6.97%) downregulated genes and 197 (6.85%) upregulated genes that were annotated as TF genes (Table S7).
According to PlantTFDB these TF genes are classified into 45 TF families (Figure 5). Transcription factors belonging to the ethylene-responsive family (ERF), NAC factors, MYB, GRAS, G2-like, bZIP and bHLH are the most abundant, with DEG amount ranging from 34 to 14 (Table S7).

3.7. Transcriptional Activity is a Key Regulator of Starch Synthesis at 15 DAP

We found numerous DEGs which related to many biological processes in our RNA-seq data but did not reveal key regulators of maize kernel development and starch biosynthesis that were not altered in the sh2 mutant. To resolve this problem, we performed weighted correlation network analysis (WGCNA) [41] to build a co-expression network using published RNA-seq data from various maize kernel mutants, including o2, pbf, mads47, o11, fl3, fl4, dek2, dek10, dek35, dek37, sh2 and the o2-pbf double mutant (Table S8). We used HISAT2 and StringTie to obtain the transcripts per kilobase of exon model per million mapped read (TPM) [13] for every gene in each sample. Genes expressed in each sample were filtered out with moderate SD in different samples, leading to the identification of 20 modules containing these genes (Figure 6a). Finally, 6623 nodes and 19 modules were obtained by applying link weights above 0.1 with each module containing >3 and <2465 nodes (Table 1).
The “orange” module had a high module membership (MM) with sh2, with a correlation coefficient of 0.97 and a p-value of 8 × 10⁻⁸ (Figure 6b, Figure S4). We subjected the genes in that module to GO enrichment analysis and identified only one significant GO term: TF activity (sequence-specific DNA binding; GO:0003700, p-value = 3.5 × 10⁻⁹). This implies that many genes related to TF activity are included in this module. Out of the 2465 genes found in this module, 249 are TF genes, which include 70 upregulated and 15 downregulated DEGs in sh2, as determined by annotation using PlantTFDB (Figure S4). Most of these genes encode members of the ERF, bZIP, bHLH, GRAS, Trihelix, MYB, GATA, C2H2 and NAC TF families, and nine TF families include more than 10 members. The bZIP TF family, with 24 members, includes o2, a zein mutant known to network regulate maize endosperm development by directly regulating zein and other TF genes [24,42]. We identified 22 bHLH TF genes, including o11, encoding a key regulator of endosperm development and nutrient metabolism [43]. Twenty MYB and MYB-related TF genes are included, such as MYB14, which regulates the starch biosynthesis pathway in maize by regulating ZmBT1 promoter activity [44]. Other genes in the “orange” module, such as Zm00001d021537 and Zm00001d038288, are targets of o11 in the MYB TF family [43]. Two targets of o11, Zm00001d023294 and Zm00001d049860, encode NAC TFs [43]. Although transcriptional regulation is essential in starch synthesis, its global network is yet to be identified.

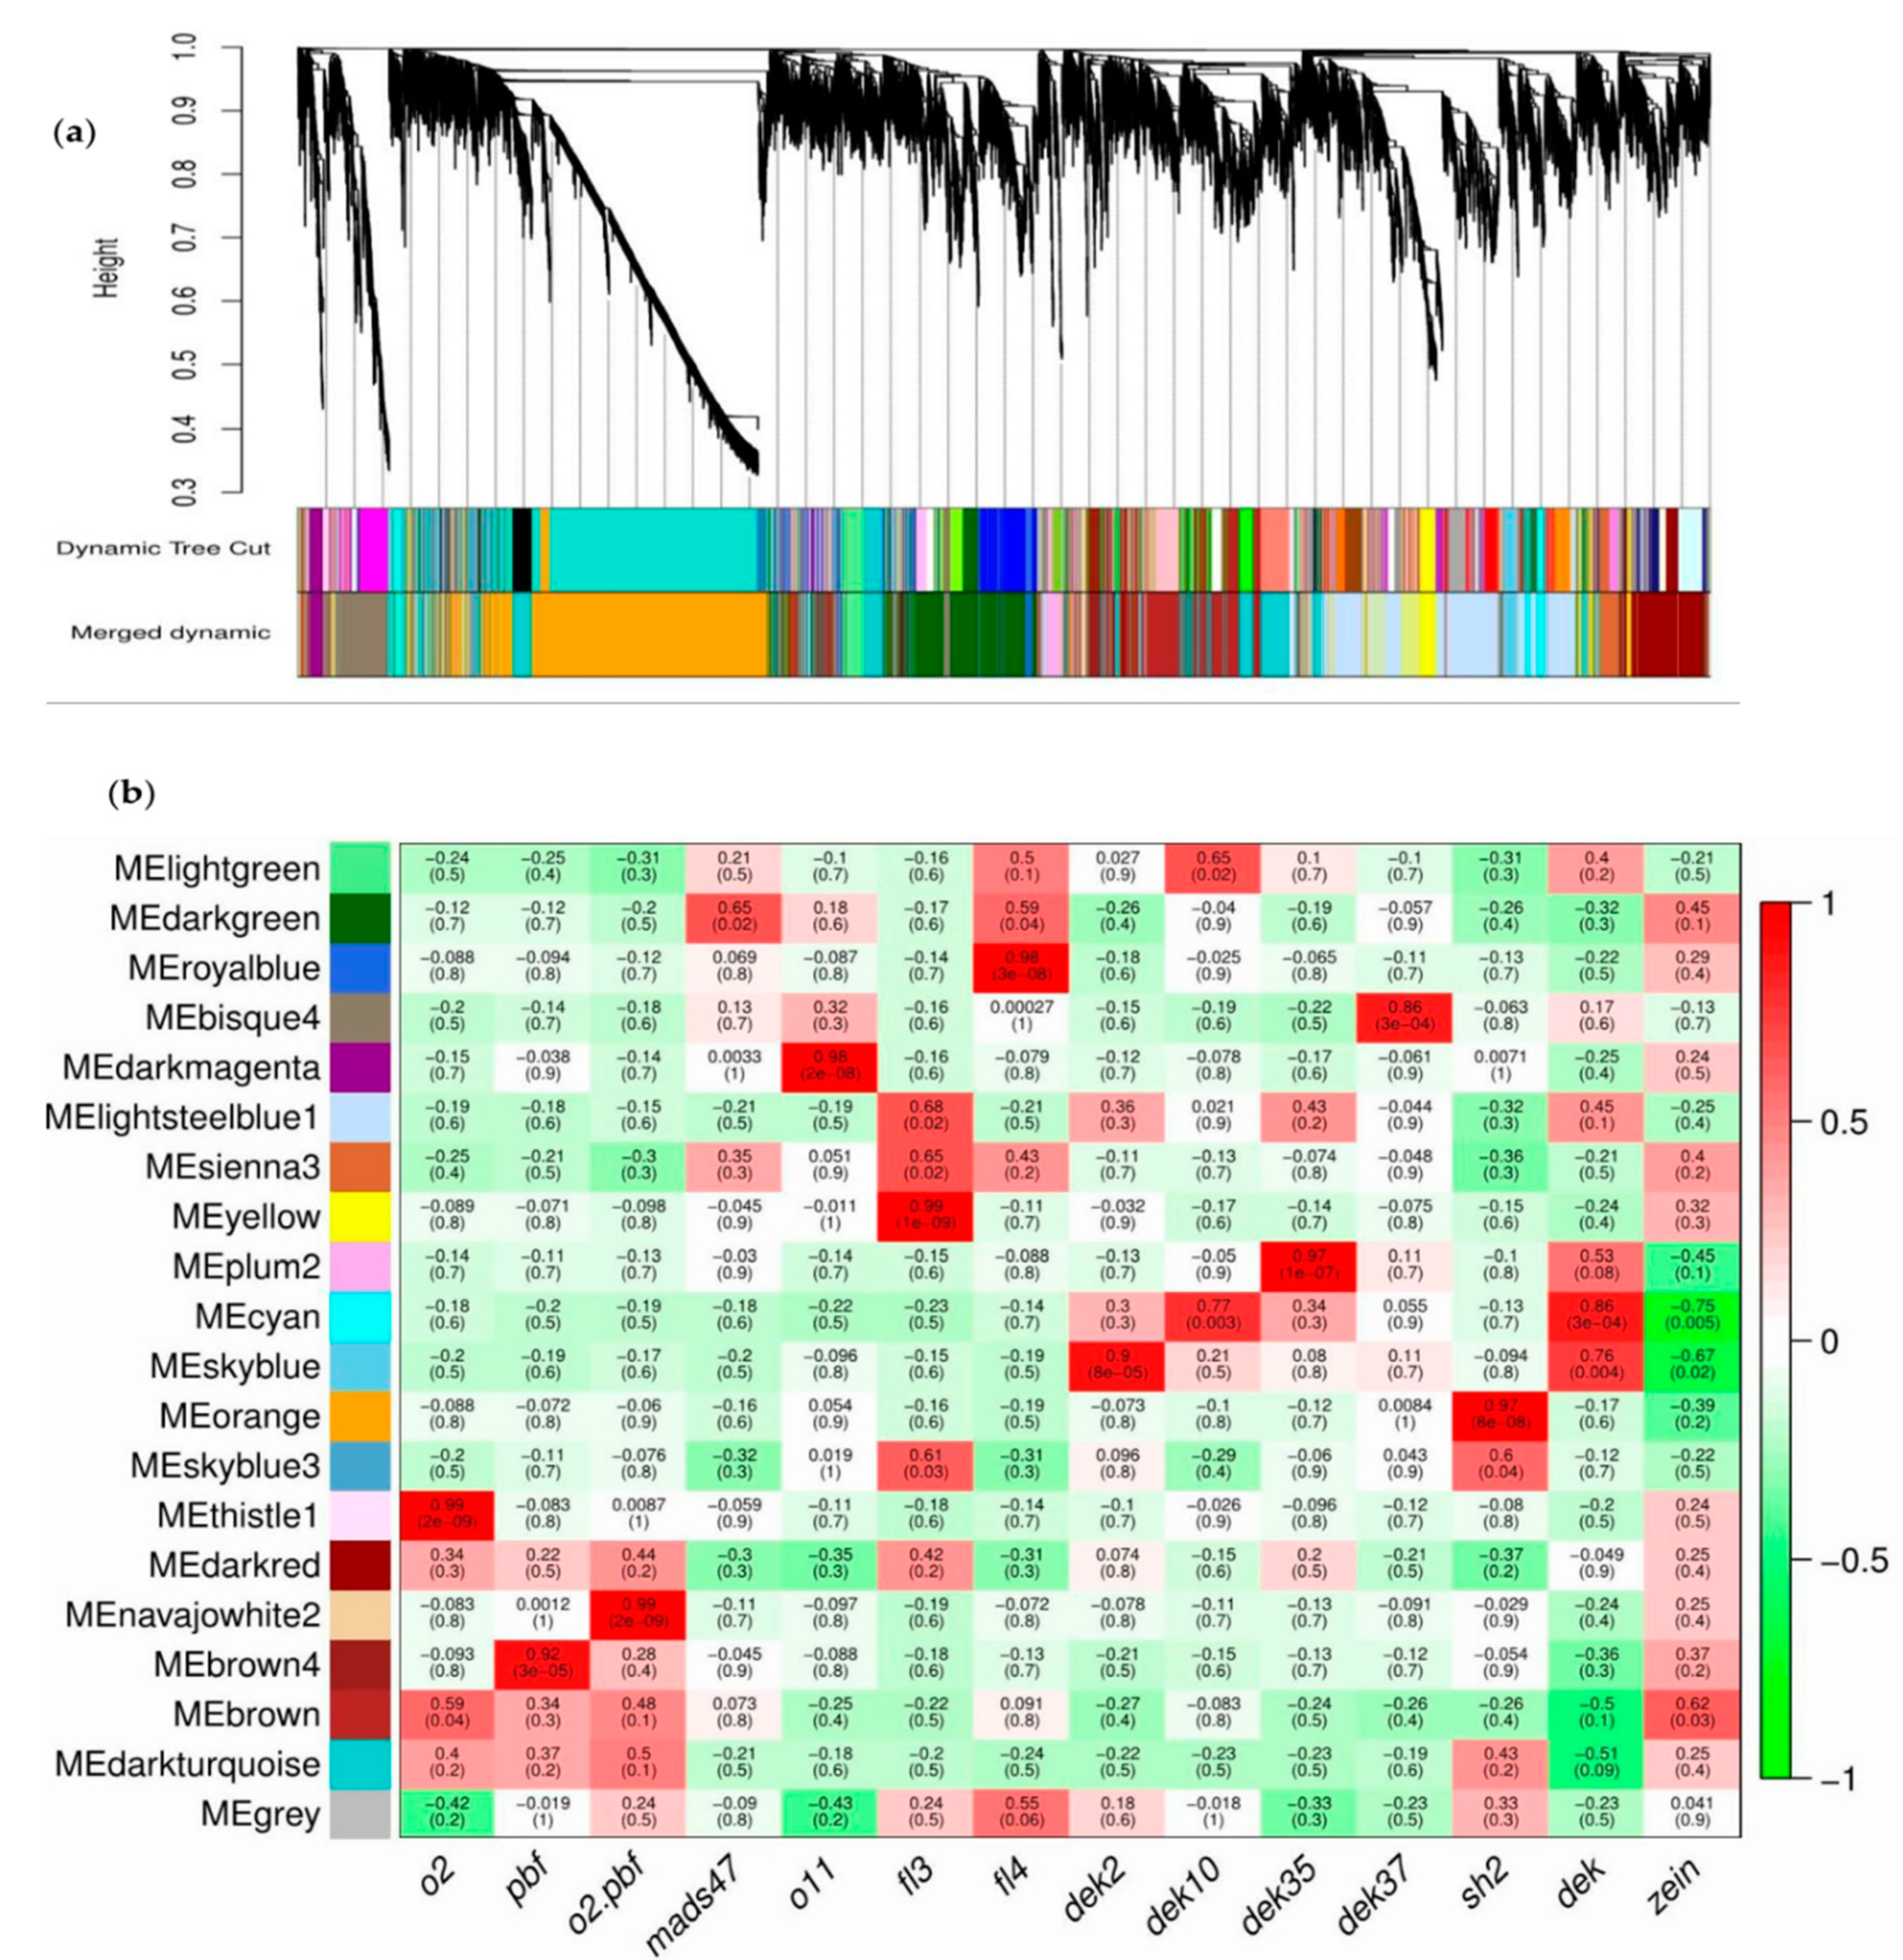
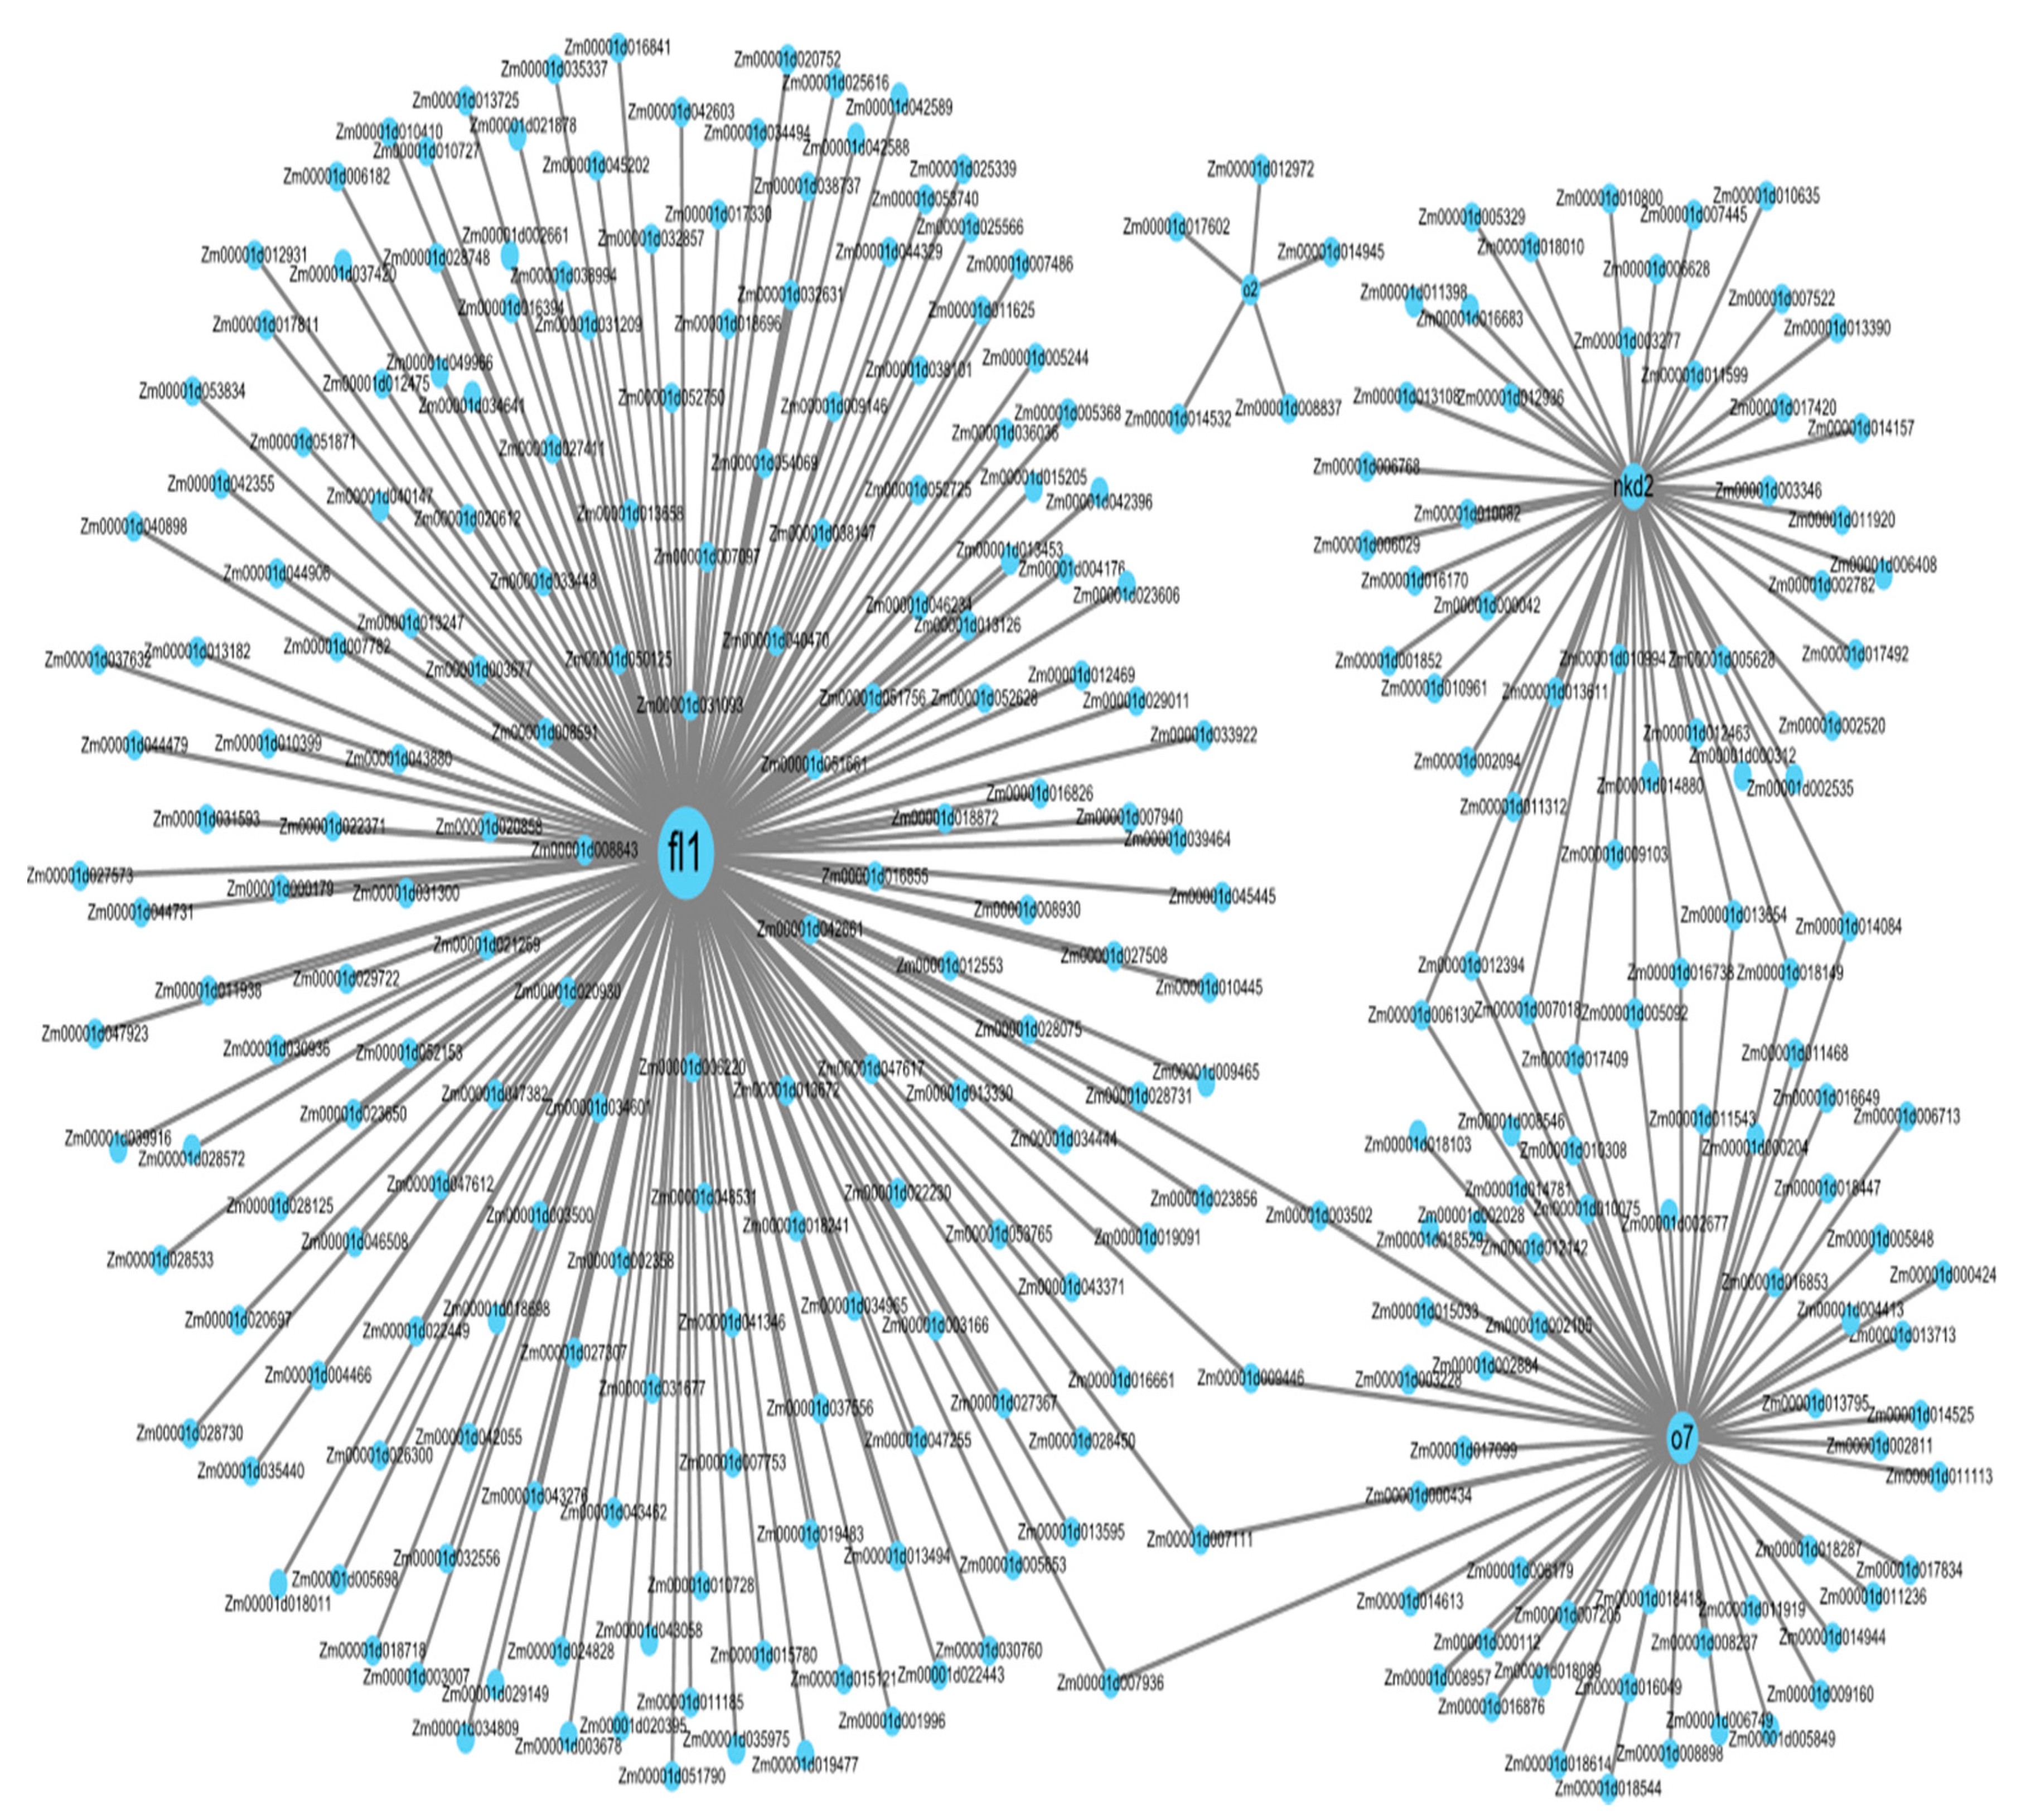
3.8. Co-Expression Network Analysis

To further understand the transcriptional mechanism regulating starch biosynthesis in early endosperm development (15 DAP) in maize, we selected four maize endosperm mutants belonging to the “orange” module (Figure 6). RNA-seq data from these mutants (fl1, o7, nkd2 and o2) were downloaded from the SRA database. The imprinted floury1 mutant gene fl1 presented greater co-expression with genes related to transcriptional activity (Figure 7). It is followed by nkd2 and o7, while o2 is only associated to five genes.

4. Discussion

Malfunction of AGPase resulting from loss of Sh2 function causes disruption of starch biosynthesis pathway, resulting in an increase of soluble sugar in kernels that are not fully formed and causing mature kernels to have reduced weight [45,46]. Insight into the transcriptional regulatory framework of sh2 mutant in immature maize kernels can improve our understanding of genetic regulation of starch accumulation during endosperm development. To be enzymatically active, AGPase requires the complementary activity of its two subunits encoded by Bt2 and Sh2 genes in maize endosperm [4,47,48]. The effect of mutational changes in these genes leads to various phenotypes, which range from similarity to wild-type to lethality depending on the combination of the Bt2 and Sh2 alleles [49]. We identified a sh2 allele in which only one exon was transcribed, while the wild type had 15 exons transcribed in the B73 background (Figure S1). RNA-seq analysis performed on this mutant at 15 DAP revealed 5175 DEGs identified from sh2 mutant line kernels and wild-type kernels. DEGs related to endosperm include 11 genes for kernel development, 16 genes for starch biosynthesis and 32 zein-encoding genes. DEGs related to starch, including bt2, were upregulated (Figure 2). This alteration of the shrunken2 gene also affects the expression of protein-related genes. Among the 32 zein-encoding genes identified in our experimental conditions, 25 genes were downregulated (Figure 2b). These data support that starch and zein synthesis are strongly associated biological processes which likely depend on transcript content of AGPase-related genes [48,50,51].
Starch synthesis occurs at 10–35 DAP, when the carbohydrate, storage protein and amino acid metabolism enzymes have accumulated [52]. Transcriptional regulation of expression of proteins was initially suggested to be the regulatory mechanism determining this coordinated expression [52]. Our co-expression network analysis shows that the module with the highest module membership had 2465 genes involved in transcriptional activity. A total of 357 TF genes, or 6.89% of the genome-wide DEGs, were identified, thus supporting the importance of transcriptional control in the regulation of starch biosynthesis [43,50,53,54]. In addition, four known mutants fl1, o7, nkd2 and o2 are co-expressed (Figure 7). The mutant of floury gene 1 (fl1) shows the greatest amount of co-expressed genes. Previous work reports that fl1 encodes a zein protein body membrane accumulating 22-kD α-zeins in the γ-zein-rich periphery and center of the core rather than their normal discrete location in a ring at outer edge of the core [18]. This mutation results in the formation of starchy endosperm, while the wild-type allele Fl1 causes the vitreous endosperm. This is consistent with a putative role as a coordinator of transcriptional activity in starch synthesis at 15 DAP. The maize opaque 7 mutant gene (o7) appear to be the second TF gene highly co-expressed with maize endosperm genes at this developmental stage. In addition to decreasing starch α-zein contents, o7 influences amino acid biosynthesis by affecting a-ketoglutaric acid and oxaloacetic acid both in maize and rice [22,55]. Although less important than fl1, the naked endosperm 2 (nkd2) and the opaque 7 (o7) mutant TF genes are also co-expressed with a wide number of genes in the “orange” module. ndk2 TF is a member of the indeterminant domain (IDD) TF family, which is implicated in many biological functions, including the regulation of carbohydrate metabolism, gravitropism, seed germination, lateral organ morphogenesis, gravitropism, hormone signaling or DNA binding factor in Arabidopsis [56]. In maize, characterization of ndk1 ndk2 double mutant into B73 background revealed that ndk1 and ndk2 influence 6.7% of transcriptome in starchy endosperm (at 15 DAP) [57], and NDK2 activates transcription from the 22KD zein promoter. The fourth connector is o2, a gene that was previously identified in the regulation of starch and protein synthesis in maize endosperm at 16 DAP [23]. However, the genetic network regulated by o2 is reduced to five genes only in our experimental conditions. The difference is likely due to the pathway controlled by these two genes. While sh2 controls starch synthesis by regulating the activity of AGPase, the transcription factor o2 induces the downregulation of genes involved in the pentose phosphate pathway. Altogether, these data confirm that coordinated expression of starch is controlled by protein content. Our co-expression data highlight the specific role of 22KD zein content in sh2-deficient mutant.

5. Conclusions

Control of starch production and storage in the endosperm determines seed weight and kernel properties. In maize endosperm, this mechanism is regulated by several enzymes, among which AGPase plays a determinant role. Transcriptome profiling supports that the modification of sh2 transcript content influences not only AGPase activity, but also the expression of genes controlling starch and protein synthesis during endosperm development. This regulation is carried out through a transcriptional network capped by four TF, namely the floury mutant gene 1 (fl1), the opaque 7 gene, the naked endosperm 2 (nkd2) gene and opaque 2 TF gene. Previous functional characterization of these genes demonstrated that they activate the transcription of genes involved in the storage of 22KD zein, thus supporting that accumulation of zein is a determinant for starch accumulation.

Supplementary Materials

The following are available online at https://www.mdpi.com/2073-4395/10/5/624/s1, Figure S1: Reads aligned to sh2, Figure S2: Principal component analysis of FPKM, Figure S3: MA-plot shows the log2-fold changes, Figure S4: Venn diagram of the number of TF genes in the DEG set and “orange” module, Table S1: List of Primers Used in this Study Table S2: Raw Data and Data Filtering, Table S3: RNA-Seq Data Mapping, Table S4: RNA-Seq Mapped Events, Table S5: Downregulated Genes Identified by GO Enrichment Analysis, Table S6: Upregulated Genes Identified by GO Enrichment Analysis, Table S7: List of annotated TFs, Table S8: Data Used for Co-expression Network Analysis.

Author Contributions

F.Q., A.M.N.S. and H.Z. conceived and designed the experiments; A.M.N.S., H.Z., Y.Q. and Q.S. performed the experiments; A.M.N.S., H.Z., Y.Q., D.G. and Z.P. analyzed the data; A.M.N.S., H.Z., Y.Q. and F.Q. wrote and revise the article. All authors have read and agreed to the published version of the manuscript.

Funding

This work was supported by the National Key Research and Development Program of China (2016YFD0100303) and the National Nature Science Foundation of China (31771796).

Acknowledgments

We are grateful to Xiangfen Zhu (Enshi Tujia and Miao autonomous prefecture agricultural academy) for kindly providing plant materials.

Conflicts of Interest

The authors declare no conflict of interest.

References

  1. Ballicora, M.A.; Iglesias, A.A.; Preiss, J. ADP-Glucose pyrophosphorylase, a regulatory enzyme for bacterial glycogen synthesis. Microbiol. Mol. Biol. Rev. 2003, 67, 213–225. [Google Scholar] [CrossRef] [PubMed] [Green Version]
  2. Hannah, L.C.; James, M. The complexities of starch biosynthesis in cereal endosperms. Curr. Opin. Biotechnol. 2008, 19, 160–165. [Google Scholar] [CrossRef]
  3. Georgelis, N.; Braun, E.L.; Shaw, J.R.; Hannah, L.C. The two AGPase subunits evolve at different rates in angiosperms, yet they are equally sensitive to activity-altering amino acid changes when expressed in bacteria. Plant Cell 2007, 19, 1458–1472. [Google Scholar] [CrossRef] [PubMed] [Green Version]
  4. Hannah, L.C.; Giroux, M.; Boyer, C. Biotechnological modification of carbohydrates for sweet corn and maize improvement. Sci. Hortic. 1993, 55, 177–197. [Google Scholar] [CrossRef]
  5. Stark, D.M.; Timmerman, K.P.; Barry, G.F.; Preiss, J.; Kishore, G.M. Regulation of the amount of starch in plant tissues by ADP glucose pyrophosphorylase. Science 1992, 258, 287–292. [Google Scholar] [CrossRef] [PubMed]
  6. Sakulsingharoj, C.; Choi, S.-B.; Hwang, S.-K.; Edwards, G.E.; Bork, J.; Meyer, C.R.; Preiss, J.; Okita, T.W. Engineering starch biosynthesis for increasing rice seed weight: The role of the cytoplasmic ADP-glucose pyrophosphorylase. Plant Sci. 2004, 167, 1323–1333. [Google Scholar] [CrossRef]
  7. Wang, Z.; Chen, X.; Wang, J.; Liu, T.; Liu, Y.; Zhao, L.; Wang, G. Increasing maize seed weight by enhancing the cytoplasmic ADP-glucose pyrophosphorylase activity in transgenic maize plants. Plant Cell. Tissue Organ Cult. 2007, 88, 83–92. [Google Scholar] [CrossRef]
  8. Giroux, M.J.; Shaw, J.; Barry, G.; Cobb, B.G.; Greene, T.; Okita, T.; Hannah, L.C. A single mutation that increases maize seed weight. Proc. Natl. Acad. Sci. USA 1996, 93, 5824–5829. [Google Scholar] [CrossRef] [Green Version]
  9. Li, N.; Zhang, S.; Zhao, Y.; Li, B.; Zhang, J. Over-expression of AGPase genes enhances seed weight and starch content in transgenic maize. Planta 2011, 233, 241–250. [Google Scholar] [CrossRef]
  10. Smidansky, E.D.; Clancy, M.; Meyer, F.D.; Lanning, S.P.; Blake, N.K.; Talbert, L.E.; Giroux, M.J. Enhanced ADP-glucose pyrophosphorylase activity in wheat endosperm increases seed yield. Proc. Natl. Acad. Sci. USA 2002, 99, 1724–1729. [Google Scholar]
  11. Smidansky, E.D.; Martin, J.M.; Hannah, L.C.; Fischer, A.M.; Giroux, M.J. Seed yield and plant biomass increases in rice are conferred by deregulation of endosperm ADP-glucose pyrophosphorylase. Planta 2003, 216, 656–664. [Google Scholar] [CrossRef] [PubMed]
  12. Hannah, L.C.; Futch, B.; Bing, J.; Shaw, J.R.; Boehlein, S.; Stewart, J.D.; Beiriger, R.; Georgelis, N.; Greene, T. A shrunken-2 transgene increases maize yield by acting in maternal tissues to increase the frequency of seed development. Plant Cell 2012, 24, 2352–2363. [Google Scholar] [CrossRef] [PubMed] [Green Version]
  13. Pertea, M.; Kim, D.; Pertea, G.M.; Leek, J.T.; Salzberg, S.L. Transcript-level expression analysis of RNA-seq experiments with HISAT, stringtie and ballgown. Nat. Protoc. 2016, 11, 1650–1667. [Google Scholar] [CrossRef] [PubMed]
  14. Supek, F.; Bošnjak, M.; Kunca, S.; Muc, S. Summarizes and visualizes long lists of gene ontology terms. PLoS ONE 2011, 6, e21800. [Google Scholar] [CrossRef] [PubMed] [Green Version]
  15. Livak, K.J.; Schmittgen, T.D. Analysis of relative gene expression data using real-time quantitative PCR and the 2−ΔΔCT method. Methods 2001, 25, 402–408. [Google Scholar] [CrossRef]
  16. Trapnell, C.; Williams, B.A.; Pertea, G.; Mortazavi, A.; Kwan, G.; Van Baren, M.J.; Salzberg, S.L.; Wold, B.J.; Pachter, L. Transcript assembly and quantification by RNA-Seq reveals unannotated transcripts and isoform switching during cell differentiation. Nat. Biotechnol. 2010, 28, 511–515. [Google Scholar] [CrossRef] [Green Version]
  17. Jin, J.; Tian, F.; Yang, D.-C.; Meng, Y.-Q.; Kong, L.; Luo, J.; Gao, G. PlantTFDB 4.0: Toward a central hub for transcription factors and regulatory interactions in plants. Nucleic Acids Res. 2017, 45, D1040–D1045. [Google Scholar] [CrossRef] [Green Version]
  18. Holding, D.R.; Otegui, M.S.; Li, B.; Meeley, R.B.; Dam, T.; Hunter, B.G.; Jung, R.; Larkins, B.A. The maize Floury1 gene encodes a novel endoplasmic reticulum protein involved in zein protein body formation. Plant Cell 2007, 19, 2569–2582. [Google Scholar] [CrossRef] [Green Version]
  19. Coleman, C.E.; Lopes, M.A.; Gillikin, J.W.; Boston, R.S.; Larkins, B.A. A defective signal peptide in the maize high-lysine mutant floury 2. Proc. Natl. Acad. Sci. USA 1995, 92, 6828–6831. [Google Scholar] [CrossRef] [Green Version]
  20. Li, Q.; Wang, J.; Ye, J.; Zheng, X.; Xiang, X.; Li, C.; Fu, M.; Wang, Q.; Zhang, Z.; Wu, Y. The maize imprinted gene floury3 encodes a PLATZ protein required for tRNA and 5S rRNA transcription through interaction with RNA polymerase III. Plant Cell 2017, 29, 2661–2675. [Google Scholar] [CrossRef] [Green Version]
  21. Wang, G.; Qi, W.; Wu, Q.; Yao, D.; Zhang, J.; Zhu, J.; Wang, G.; Wang, G.; Tang, Y.; Song, R. Identification and characterization of maize floury4 as a novel semidominant opaque mutant that disrupts protein body assembly. Plant Physiol. 2014, 165, 582–594. [Google Scholar] [CrossRef] [PubMed] [Green Version]
  22. Wang, G.; Sun, X.; Wang, G.; Wang, F.; Gao, Q.; Sun, X.; Tang, Y.; Chang, C.; Lai, J.; Zhu, L.; et al. Opaque7 encodes an acyl-activating enzyme-like protein that affects storage protein synthesis in maize endosperm. Genetics 2011, 189, 1281–1295. [Google Scholar] [CrossRef] [PubMed] [Green Version]
  23. Zhang, Z.; Zheng, X.; Yang, J.; Messing, J.; Wu, Y. Maize endosperm-specific transcription factors O2 and PBF network the regulation of protein and starch synthesis. Proc. Natl. Acad. Sci. USA 2016, 113, 10842–10847. [Google Scholar] [CrossRef] [Green Version]
  24. Zhan, J.; Li, G.; Ryu, C.H.; Ma, C.; Zhang, S.; Lloyd, A.; Hunter, B.G.; Larkins, B.A.; Drews, G.N.; Wang, X.; et al. Opaque-2 regulates a complex gene network associated with cell differentiation and storage functions of maize endosperm. Plant Cell 2018, 30, 2425–2446. [Google Scholar] [PubMed] [Green Version]
  25. Lappe, R.R.; Baier, J.W.; Boehlein, S.K.; Huffman, R.; Lin, Q.; Wattebled, F.; Mark Settles, A.; Curtis Hannah, L.; Borisjuk, L.; Rolletschek, H.; et al. Functions of maize genes encoding pyruvate phosphate dikinase in developing endosperm. Proc. Natl. Acad. Sci. USA 2018, 115, E24–E33. [Google Scholar] [PubMed] [Green Version]
  26. Tobias, R.B.; Boyer, C.D.; Shannon, J.C. Alterations in carbohydrate intermediates in the endosperm of starch-deficient maize (Zea mays L.) genotypes. Plant Physiol. 1992, 99, 146–152. [Google Scholar] [CrossRef]
  27. Tobias, R.B.; Boyer, C.D.; Shannon, J.C. Enzymes catalyzing the reversible conversion of fructose-6-phosphate and fructose-I,6-bisphosphate in maize (Zea mays L.) Kernels’. Plant Physiol. 1992, 99, 140–145. [Google Scholar] [CrossRef]
  28. Duncan, K.A.; Hardin, S.C.; Huber, S.C. The three maize sucrose synthase isoforms siffer in sistribution, localization, and phosphorylation. Plant Cell Physiol. 2006, 47, 959–971. [Google Scholar] [CrossRef] [Green Version]
  29. Tsuwamoto, R.; Yokoi, S.; Takahata, Y. Arabidopsis embryomaker encoding an AP2 domain transcription factor plays a key role in developmental change from vegetative to embryonic phase. Plant Mol. Biol. 2010, 73, 481–492. [Google Scholar] [CrossRef]
  30. Sekhar, S.; Panda, B.B.; Mohapatra, T.; Das, K.; Shaw, B.P.; Kariali, E.; Mohapatra, P.K. Spikelet-specific variation in ethylene production and constitutive expression of ethylene receptors and signal transducers during grain filling of compact- and lax-panicle rice (Oryza sativa) cultivars. J. Plant Physiol. 2015, 179, 21–34. [Google Scholar] [CrossRef]
  31. Wang, G.-Q.; Hao, S.-S.; Gao, B.; Chen, M.-X.; Liu, Y.-G.; Yang, J.-C.; Ye, N.-H.; Zhang, J.-H. Regulation of gene expression in the remobilization of carbon reserves in rice stems during grain filling. Plant Cell Physiol. 2017, 58, 1391–1404. [Google Scholar] [CrossRef] [Green Version]
  32. Iuchi, S.; Kobayashi, M.; Taji, T.; Naramoto, M.; Seki, M.; Kato, T.; Tabata, S.; Kakubari, Y.; Yamaguchi-Shinozaki, K.; Shinozaki, K. Regulation of drought tolerance by gene manipulation of 9-cis-epoxycarotenoid dioxygenase, a key enzyme in abscisic acid biosynthesis in Arabidopsis. Plant J. 2001, 27, 325–333. [Google Scholar] [CrossRef] [Green Version]
  33. Nambara, E.; Marion-Poll, A. Abscisic acid biosynthesis and catabolism. Annu. Rev. Plant Biol. 2005, 56, 165–185. [Google Scholar] [CrossRef] [Green Version]
  34. Liu, L.; Tong, H.; Xiao, Y.; Che, R.; Xu, F.; Hu, B.; Liang, C.; Chu, J.; Li, J.; Chu, C. Activation of big grain1 significantly improves grain size by regulating auxin transport in rice. Proc. Natl. Acad. Sci. USA 2015, 112, 11102–11107. [Google Scholar] [CrossRef] [Green Version]
  35. Weng, X.; Wang, L.; Wang, J.; Hu, Y.; Du, H.; Xu, C.; Xing, Y.; Li, X.; Xiao, J.; Zhang, Q. Grain number, plant height, and heading date7 is a central regulator of growth, development, and stress response. Plant Physiol. 2014, 164, 735–747. [Google Scholar] [CrossRef] [Green Version]
  36. Hakata, M.; Muramatsu, M.; Nakamura, H.; Hara, N.; Kishimoto, M.; Iida-Okada, K.; Kajikawa, M.; Imai-Toki, N.; Toki, S.; Nagamura, Y.; et al. Overexpression of TIFY genes promotes plant growth in rice through jasmonate signaling. Biosci. Biotechnol. Biochem. 2017, 81, 906–913. [Google Scholar] [CrossRef] [Green Version]
  37. Che, R.; Tong, H.; Shi, B.; Liu, Y.; Fang, S.; Liu, D.; Xiao, Y.; Hu, B.; Liu, L.; Wang, H.; et al. Control of grain size and rice yield by GL2-mediated brassinosteroid responses. Nat. Plants 2015, 2, 15195. [Google Scholar] [CrossRef]
  38. Ashikari, M.; Sakakibara, H.; Lin, S.; Yamamoto, T.; Takashi, T.; Nishimura, A.; Angeles, E.R.; Qian, Q.; Kitano, H.; Matsuoka, M. Cytokinin oxidase regulates rice grain production. Science 2005, 309, 741–745. [Google Scholar] [CrossRef]
  39. Pingyong, S.; Wuhan, Z.; Yihua, W.; Qiang, H.; Fu, S.; Hai, L.; Jie, W.; Jianmin, W.; Longping, Y.; Huafeng, D. OsGRF4controls grain shape, panicle length andseed shattering in rice. J. Integr. Plant Biol. 2016, 58, 836–847. [Google Scholar]
  40. Schläpfer, P.; Zhang, P.; Wang, C.; Kim, T.; Banf, M.; Chae, L.; Dreher, K.; Chavali, A.K.; Nilo-Poyanco, R.; Bernard, T.; et al. Genome-Wide prediction of metabolic enzymes, pathways, and gene clusters in plants. Plant Physiol. 2017, 173, 2041–2059. [Google Scholar] [CrossRef] [Green Version]
  41. Langfelder, P.; Horvath, S. WGCNA: An R package for weighted correlation network analysis. BMC Bioinform. 2008, 9, 559. [Google Scholar] [CrossRef] [Green Version]
  42. Li, C.; Qiao, Z.; Qi, W.; Wang, Q.; Yuan, Y.; Yang, X.; Tang, Y.; Mei, B.; Lv, Y.; Zhao, H.; et al. Genome-wide characterization of cis-acting DNA targets reveals the transcriptional regulatory framework of opaque2 in maize. Plant Cell 2015, 27, 532–545. [Google Scholar] [CrossRef] [Green Version]
  43. Feng, F.; Qi, W.; Lv, Y.; Yan, S.; Xu, L.; Yang, W.; Yuan, Y.; Chen, Y.; Zhao, H.; Song, R. OPAQUE11 Is a central hub of the regulatory network for maize endosperm development and nutrient metabolism. Plant Cell 2018, 30, 375–396. [Google Scholar] [CrossRef] [Green Version]
  44. Xiao, Q.; Wang, Y.; Du, J.; Li, H.; Wei, B.; Wang, Y.; Li, Y.; Yu, G.; Liu, H.; Zhang, J.; et al. ZmMYB14 is an important transcription factor involved in the regulation of the activity of the ZmBT1 promoter in starch biosynthesis in maize. FEBS J. 2017, 284, 3079–3099. [Google Scholar]
  45. Janick, J. Plant Breeding Reviews; John Wiley & Sons: Hoboken, NJ, USA, 1996; Volume 14, ISBN 9780470650073. [Google Scholar]
  46. Dodson-Swenson, H.G.; Tracy, W.F. Endosperm carbohydrate composition and kernel characteristics of shrunken2-intermediate (Sh2-i/sh2-i su1/su1) and shrunken2-intermediate–sugary1- reference (sh2-i/sh2-i su1-r/su1-r) in sweet corn. Crop Sci. 2015, 55, 2647–2656. [Google Scholar] [CrossRef]
  47. Greene, T.; Hannah, L. Maize endosperm ADP-glucose pyrophosphorylase SHRUNKEN2 and BRITTLE2 subunit interactions. Plant Cell 1998, 10, 1295–1306. [Google Scholar]
  48. Giroux, M.J.; Boyer, C.; Feix, G.; Hannah, L.C. Coordinated transcriptional regulation of storage product genes in the maize endosperm. Plant Physiol. 1994, 106, 713–722. [Google Scholar] [CrossRef] [Green Version]
  49. Bhave, M.R.; Lawrence, S.; Barton, C.; Curtis, L. ldentification and molecular characterization of shrunken-2 cDNA clones of maize. Plant Cell 1990, 6, 581–588. [Google Scholar]
  50. Chen, J.; Zeng, B.; Zhang, M.; Xie, S.; Wang, G.; Hauck, A.; Lai, J. Dynamic transcriptome landscape of maize embryo and endosperm development. Plant Physiol. 2014, 166, 252–264. [Google Scholar] [CrossRef] [Green Version]
  51. Zhang, Z.; Dong, J.; Ji, C.; Wu, Y.; Messing, J. NAC-type transcription factors regulate accumulation of starch and protein in maize seeds. Proc. Natl. Acad. Sci. USA 2019, 166, 11223–11228. [Google Scholar] [CrossRef] [Green Version]
  52. Keeling, P.L.; Myers, A.M. Biochemistry and genetics of starch synthesis. Annu. Rev. Food Sci. Technol. 2010, 1, 271–303. [Google Scholar] [CrossRef] [PubMed]
  53. Prioul, J.L.; Méchin, V.; Lessard, P.; Thévenot, C.; Grimmer, M.; Chateau-Joubert, S.; Coates, S.; Hartings, H.; Kloiber-Maitz, M.; Murigneux, A.; et al. A joint transcriptomic, proteomic and metabolic analysis of maize endosperm development and starch filling. Plant Biotechnol. J. 2008, 6, 855–869. [Google Scholar] [CrossRef] [PubMed]
  54. Qu, J.; Ma, C.; Feng, J.; Xu, S.; Wang, L.; Li, F.; Li, Y.; Zhang, R.; Zhang, X.; Xue, J.; et al. Transcriptome dynamics during maize endosperm development. PLoS ONE 2016, 11, e0163814. [Google Scholar] [CrossRef]
  55. Miclaus, M.; Wu, Y.; Xu, J.H.; Dooner, H.K.; Messing, J. The maize high-lysine mutant opaque7 is defective in an Acyl-CoA synthetase-like protein. Genetics 2011, 189, 1271–1280. [Google Scholar] [CrossRef] [Green Version]
  56. Bemer, M.; Heijmans, K.; Airoldi, C.; Davies, B.; Angenent, G.C. An atlas of type I MADS box gene expression during female gametophyte and seed development in Arabidopsis. Plant Physiol. 2010, 154, 287–300. [Google Scholar] [CrossRef] [Green Version]
  57. Gontarek, B.C.; Neelakandan, A.K.; Wu, H.; Becraft, P.W. NKD Transcription factors are central regulators of maize endosperm development. Plant Cell 2016, 28, 2916–2936. [Google Scholar] [CrossRef] [Green Version]
Figure 1. Gene ontology (GO) analysis of differentially expressed genes (DEGs) via AgriGO [17] and REVIGO [14]. The size and color of each square/rectangle indicate the level of enrichment (−log10 p-value). (a) Molecular function of downregulated genes in sh2. (b) Biological processes of the upregulated genes in sh2.
Agronomy 10 00624 g001
Figure 2. Expression levels of starch biosynthesis, zein and maize endosperm genes in sh2 mutant kernels (mu) and wild-type kernels (WT). (a) Genes related to starch biosynthesis based on RNA-seq data (FPKM values); (b) Zein-encoding genes based on RNA-seq data (FPKM values); (c) Endosperm genes based on RNA-seq data (FPKM values); (d) Results of qRT-PCR. All expression levels were normalized to that of the wild type. The data are from three biological replicates per sample and are presented as mean values ± SD. (Student’s t-test, “•” represents p-value < 0.1, “*” represents p-value < 0.05, “**” represents p-value < 0.01).
Agronomy 10 00624 g002
Figure 3. Pathway analysis of the DEGs involved in carbohydrate catabolism and the electron transport chain. The data and the color of the rectangles indicates mean log2 (fold change) of the DEGs; plant metabolic pathway databases [29] were used for pathway analysis described above from left to right: Pentose phosphate pathway (PPP), sucrose degradation, starch degradation, Electron Transport Chain (ETC), Tricarboxylic Acid Cycle (TCA) and the Embden–Meyerhof–Parnas pathway (EMP).
Agronomy 10 00624 g003
Figure 4. DEGs related to phytohormone-related. Pathways include: ethylene, auxin, Abscisic Acid (ABA), cytokinin (CK), Brassinosteroids (BR) and the Jasmonic Acid (JA). The data and the colors of the rectangles indicate mean log2 (fold change) of the DEGs; plant metabolic pathway databases were used for pathway analysis [40].
Agronomy 10 00624 g004
Figure 5. Distribution of differentially expressed TF genes between wild-type and mutant kernels. The graph shows the number of upregulated genes (log2 (fold change) > 1 or log2 (fold change) < −1) in each family identified in the mutant (red) and wild-type (blue) and the number of upregulated genes (log2 (fold change) > 0.5 or log2 (fold change) < −0.5) in each family identified in the mutant (black) and wild-type (gray).
Agronomy 10 00624 g005
Figure 6. WGCNA using RNA-seq data for 12 endosperm mutants. (a) Hierarchical cluster analysis showing the co-expression modules identified by WGCNA; (b) Module–trait associations. Each row corresponds to a module. Each column shows one mutant (dek represents the four dek mutants used in this study, similarly zein stands for the seven zein mutants. The values in each cell represent the corresponding correlation coefficient and p-value.
Agronomy 10 00624 g006
Figure 7. Visualization of the network connections among fl1, o7, nkd2 and o2.
Agronomy 10 00624 g007
Table 1. Modules identified by weighted correlation network analysis (WGCNA).
ModuleGene NumberModuleGene NumberModuleGene Number
Bisque4527Dark turquoise438Royal blue86
Brown429Light green3Sienna326
Brown477Light steel blue11230Sky blue71
Cyan62Navajo white221Skyblue314
Dark green622Orange2465Thistle121
Dark magenta104Plum289
Dark red115Yellow327

