1. Introduction
The United States animal agriculture industry has undergone significant growth and consolidation over the past several decades. Dramatic shifts have occurred in the U.S. dairy, egg, hog, poultry, and turkey industries in particular [
1]. This consolidation of animal operations has created landscape scenarios in which large quantities of manure are produced in geographically clustered areas, raising concern over the ability of these operations to beneficially employ manure nutrients to enhance crop growth and manage environmental impacts of livestock production. Losses of nitrogen (N) and phosphorus (P), the two primary nutrients in manure, can contaminate surface water and groundwater, leading to a wide range of environmental and economic consequences [
2,
3].
There are few scientifically accepted methods for quantifying the cumulative impact of animal agriculture on the landscape. A common impediment is the lack of available data on the location and size of animal operations. Where this data does exist, the assimilative capacity of the landscape is often unknown or determined by the amount of cropland that exists at an administrative (township, county) or watershed scale [
4,
5]. These approaches lack the spatial and temporal detail necessary to adequately address the factors impacting manure distribution in the landscape.
A novel approach is presented to spatially model the application of manure from the point of production to adjacent cropland, using geographic information system (GIS) technology. The study area is the state of Minnesota (MN), which is important to U.S. livestock production, currently ranking first in U.S. turkey production, third in hog production, seventh in dairy cow inventory, and eighth in cattle on feed inventory [
6]. Detailed information was gathered on the location and size of livestock operations in the state, from which the amount of recoverable (non-pastured) manure, N, and P was estimated. Nitrogen losses during storage and application were accounted for to determine the amount of manure sourced N available for land application on an annual basis.
Nitrogen is the most limiting nutrient for agricultural production throughout much of the Midwest, with 98% of US planted corn acres receiving N in the form of commercial fertilizer or manure in 2018 [
7]. Crop yield goals have traditionally been relied upon to determine N application rates [
8], although, more recently, approaches that maximize the economic return of N fertilizer have become the preferred approach for many universities and state agencies [
9]. As concern over nutrient pollution has increased, these university and agency guidelines are often looked to as the solution for achieving environmental outcomes. However, even leading fertilizer guidelines are based on achieving economic rather than environmental outcomes [
10].
The benefits of manure as a fertilizer source are well recognized, including its potential contribution to improved soil quality and nutrient recycling, as well as being a valuable soil amendment [
4,
11]. These soil health benefits from manure application have been repeatedly documented at the experiment plot scale, where manure application is carefully managed [
12]. Little is known, however, about whether leading industry practices are adhering to these same management principles. Achieving soil health benefits of manure fertilizer while minimizing environmental risk can be challenging given the variability of manure nutrient content and other logistical constraints associated with manure storage, transport, and application [
13]. A report by the US Department of Agriculture’s (USDA) Agricultural Resource Management Survey found that 95% of manure applications to maize acres did not follow national recommendations for application rate, timing, and placement [
14]. Additionally, a recent study in Western Iowa [
15] found that commercial N inputs plus generated manure N equaled nearly double the N removed by harvested grain, suggesting that in standard practice, widespread environmental losses may be accompanying the potential benefits of manure as a fertilizer source.
Many state and federal agencies have established guidelines that pertain to the application of manure as a crop nutrient source. Invariably, these recommendations suggest that manure sourced nutrients should offset the use of commercial fertilizers, and in some cases, manure nutrients may fully satisfy crop nutrient requirements. While many recommendations suggest that N be used to establish manure application rate, others have suggested that P may be a more limiting concern. Research has suggested that continued manure application to meet the N needs of crops, which is the dominant manure management practice throughout much of the Corn Belt, may result in an accumulation of soil P [
16]. Indiana, for example, has established a soil test P rule to determine which nutrient should be used to estimate manure application rates [
17].
This paper’s objective is twofold; first, a method is introduced for modeling the capacity of a region’s agricultural croplands to assimilate manure sourced nutrients while accounting for the economic constraints of manure haul distance. This approach can be applied in any geographic region, although significant effort is required to understand manure storage, handling, and application methods, as well as the agronomic requirement of surrounding cropland. Second, commercial fertilizer N sales were combined with manure sourced N to estimate the amount of N applied statewide relative to crop requirements. Using a range of N application rate guidelines and haul distance scenarios provides a means to analyze the sensitivity of the approach to changes in these parameter assumptions. Model outputs will hopefully provide a scientific and objective look at the contribution of the animal agriculture industry to nutrient budgets in MN and, potentially, throughout the Corn Belt, allowing for a more informed regulatory and permitting process to take place.
2. Materials and Methods
The Minnesota Pollution Control Agency (MPCA) maintains a database [
18] of feedlots housing 50 or more animal units (AU) in the State of Minnesota. “Animal unit” is a unit of measure that allows nutrient excretion rates to be readily compared among livestock types (1 AU = 1 slaughter steer or heifer weighing 1000 lbs) [
19]. Feedlot registration is updated every four years and consists of general information for each facility, including but not limited to: facility status, facility location, and number and type of animals. MPCA publishes this feedlot registration as a geospatial dataset, which was downloaded on 17 June, 2019 and subset to all active operations housing a dominant livestock group, including poultry (layers, broilers, and turkeys), swine, beef cattle, and dairy cattle.
The feedlot dataset contained 27,735 active facilities. Of these active facilities, 4117 had no animal counts listed and were removed from the dataset, leaving 23,618 facilities with detailed information on animal type and count. In MN, the 300 AU threshold corresponds to the level at which a manure management plan must be filed [
20]. Nearly 80% of facilities (78%, or 18,388) fell below this threshold. All of the 23,618 facilities were included in the analysis, as the majority of operations below the 300 AU threshold (88%) are beef or dairy operations, which can be important contributors to nutrients in the landscape regardless of size.
Animal counts listed in the database represent the maximum number of animals that may be housed at these facilities and may not accurately reflect the actual number of animals at any given time. This is particularly true for smaller operations. To account for this, animal counts were reduced for facilities below 300 animal units using the following adjustment factors, from MPCA [
21]: 90% for dairy and swine, 70% for beef, 80% for turkey, and 85% for chicken.
County-level commercial fertilizer sales were obtained from the Minnesota Department of Agriculture (MDA) 2016 Crop Year Fertilizer Sales Report [
22]. Statewide, 706,768 metric tons of farm-use N were sold or distributed by licensed dealers in the state of MN. The dominant form of N fertilizer was Urea (47% of statewide sales), followed by Anhydrous Ammonia (24%), other (19%), and liquid (10%). While sales data may not accurately reflect fertilizer use in the same county in which it was sold, MDA reports that clustering sales data from neighboring counties can reduce this geographical bias, and that statewide sales data is considered very accurate.
Field boundaries with crop rotation history were obtained from the Agricultural Conservation Planning Framework (ACPF) database and were used to estimate by-field N requirements. The ACPF is a concept for agricultural watershed management supported by high-resolution data and an ArcGIS toolbox (Esri, Redlands, CA, USA), which are used to identify site-specific opportunities to install conservation practices across small watersheds [
23]. The ACPF is currently maintained by the Agricultural Research Service (ARS) of the United States Department of Agriculture (USDA).
Detailed information on the generation of the ACPF database can be found in Tomer et al. [
24]. Field boundary features were edited to align with actual patterns of land cover from the 2015 United States Department of Agriculture (USDA) National Agriculture Statistics Service (NASS) Cropland Data Layer (CDL). Dominant land cover within each field was calculated using the area of each field polygon and the majority crop cover classification of CDL cells in each polygon. For each agricultural field in the database, ACPF provided six years (2012–2017) of land cover history. ACPF attribution includes a crop rotation string (an example is “CBCBCB”, where a rotation value of “C” = Corn and a rotation value of “B” = Soybean) and a count of consecutive years of corn grown on a single field. Fields smaller than 15 acres (6 ha) were considered too small for reliable classification and were excluded from the analysis. This equated to 6.4% of all field acreage.
ACPF rotation values were grouped into six primary crop categories considered to be the major crop types grown in the state of MN (
Table 1). Pasture was excluded based on the assumption that no manure is applied to alfalfa. Although some manure application to alfalfa does likely occur in MN, this is assumed to be a small proportion of overall manure application in the state, with MPCA estimates ranging from 10% to 50% of manure from small cattle operations applied to alfalfa. To conservatively account for the fraction of manure that may be applied to alfalfa and is, therefore, non-recoverable, as-excreted amounts of manure, N, and P were reduced by 50% for all cattle operations below 300 AU and with a pasture flag in the feedlot database. This reduced the total amount of available N from all feedlots by 6.2%. While minimal compared to total N availability, this factor was applied to over 12,000 small beef and dairy cattle operations in the state and significantly reduced the manure contribution from cattle and dairy, particularly in areas with large amounts of pasture and other grasses/hay.
Manure application to corn was modeled using three different N application rates, chosen to represent the range of N fertilizer application in MN. Maximum Return to Nitrogen (MRTN) rates [
10] correspond to university extension and agency recommendations for N application to corn and represent the low and middle range of N application in MN. The Yield Goal is the highest N application rate modeled in this analysis and typifies the approach taken for corn N fertilization for decades [
9]. For consistency across rate scenarios, it is assumed that N application rates are the same whether the fertilizer source is manure or commercial applied fertilizer.
MRTN rates rely on a ratio of the cost of fertilizer (in
$/lb) to the price of corn (in
$/bushel). A 0.10 MRTN ratio (
$0.40/lb fertilizer cost and
$4.00/bushel corn price) in MN equates to 147 kg ha
−1 (131 lbs/acre) N for corn following a soybean crop and 185 kg ha
−1 (165 lbs/acre) N for corn following a corn crop and represents the optimal N application rate for growers who are either paying a premium for manure or the full price of commercial N fertilizer [
25]. The 0.10 MRTN ratio represents the lowest N application rate modeled. A 0.05 MRTN ratio is suggested by MPCA as the maximum N rate for corn production when manure is the fertilizer source, which is typically less costly than commercial fertilizer N [
26]. The 0.05 MRTN ratio (
$0.20/ton fertilizer cost and
$4.00/bushel corn price) in MN equates to 168 kg ha
−1 (150 lbs/acre) N for corn following a soybean crop and 219 kg ha
−1 (195 lbs/acre) N for corn following a corn crop. The 0.05 MRTN ratio represents the middle N application rate modeled.
A Yield Goal rate was developed to represent the maximum yield a grower can achieve under optimal conditions. For nearly fifty years, Stanfords 1.2 Rule was widely employed to recommend N fertilizer rates to corn farmers and was used to determine the yield goal N application rate for corn [
27]. The 1.2 Rule suggests that producers apply 1.2 lb of N fertilizer per acre for every bushel of corn per acre that could be expected under ideal conditions, with adjustments for previous crops grown and other factors. Corn yield goals were determined to be 110% of a five-year average county corn yield [
28], as determined from NASS surveys in MN from 2014 to 2018. This yield goal was multiplied by 1.2 to determine the N application rate for corn in each county in MN and represents the highest N application rate modeled.
The ACPF six-year rotation allowed for the previous crop to be identified for all years of corn except for year one, in which case a previous crop of soybean was assumed. When determining the MRTN rate for each field, all corn years were assigned the MRTN rate associated with corn following a soybean crop, except for years in which corn followed a corn crop explicitly, in which case the higher MRTN rate was used. When determining the yield goal rate for each field, every corn year that followed either a year of soybean or pasture was given an N credit of fifty pounds per acre (56 kg ha−1), which was subtracted from the 1.2 yield goal rate. For all other corn years, the yield goal rate was determined to be 1.2 times the yield goal for the county in which the centroid of the field is located.
University of Minnesota (UMN) Extension [
29] and MPCA [
21] guidelines were used to determine N rates for crops other than corn (
Table 2). Guidelines for oats were used as a proxy for small grains. Additional assumptions for interpreting UMN guidelines included the absence of a soil NO
3-N test, a previous crop belonging to a Group 2 crop (corn, grass, oats, or wheat), an average expected yield, and a medium to high organic matter level soil type. Similar to Andersen and Pepple [
4], it was assumed that all N removed with soybean was obtained entirely through nitrogen fixation and, therefore, the N requirement was set at zero and no manure application was modeled for soybean years.
The recommended N rate for each crop in the six-year rotation was multiplied by the size (in hectares) of each field. A six-year cumulative N requirement was calculated by summing the N requirement for each of the six years, then dividing by six to represent an annual N requirement. This annual N requirement was used to define the N requirement for each field in the analysis. This calculation was performed for each of the application rate guidelines so that each field had three different annual N estimates depending on which rate guidance was selected.
Using an alternating corn-soybean field (“CBCBCB”) as an example, the field N requirement using the 0.05 MRTN ratio was found by taking the MRTN rate of 168 kg of manure N per ha (150 lbs/acre for corn following a soybean crop) for each corn year divided by six years, or 168 pounds N * 3 corn years/6 years = 84 kg of N per ha. This rate of 84 kg ha−1 was multiplied by the size (in hectares) of the field to estimate an annual N requirement for that field.
The Midwest Planning Service (MWPS) 18 Second Edition (2004) was used to calculate as-excreted amounts of manure, N, and P from each animal feeding operation, which vary with the size, age, feed, and management approach of each animal. While the MWPS is a commonly used resource for estimating manure nutrient content, book values provide estimates only, and the actual characteristics of manure can vary +/− 30% from table values due to genetics, diet, and farm management [
30].
Each unique animal type listed in the MN feedlot database was matched to a MWPS animal type (
Table 3) to estimate excretion values per animal in kg/day. MWPS values were averaged when an exact match to an animal type could not be made. For example, excreted values for a dairy calf were assigned using the average of a 150 and 250 lb (68 and 113 kg) dairy calf, and excretion values for a medium swine were assigned using the average of all 150 to 300 lb (68 to 136 kg) growing swine. Dairy cattle values were weighted assuming cows are lactating 305 days and dry 60 days of the year [
4]. Daily excreted amounts in kg/day were multiplied by 365 days to estimate annual excreted amounts.
Nitrogen loss during manure storage, primarily through ammonia volatilization, can substantially decrease the amount of N available for application [
31]. The amount of N loss varies by animal type and management system and was adapted from MDA and UMN Extension Nutrient and Manure Management Tables [
32]. The average of daily scrape and haul, manure pack, and open lot management methods was assumed for all cattle facilities. All swine operations were considered to have below ground covered pits, and all poultry operations were assumed to be dry litter. Annual N excretion amounts from each animal operation were reduced by the percent loss for each animal type to estimate the amount of annual as-stored N (
Table 4).
Nitrogen loss during field application is highly dependent on manure type and application method. Incorporation of manure below the soil surface has shown to reduce N loss, although it can increase the risk of nitrate leaching, particularly following rain events [
33]. In contrast, surface application of manure with delayed or no incorporation increases N volatilization loss and risk of overland surface runoff. Common manure application methods in MN range from injection of liquid manure (sweep, knife, or disc) to surface broadcast of solid manure (with or without incorporation).
A survey of MN’s 2014 corn crop [
34] was used to inform the statewide distribution of manure application method. Estimated N losses during application from UMN Extension Nutrient and Manure Management Tables [
32] were weighted by the statewide prevalence of each application method using the 2014 survey. Losses associated with disc injection were assumed to be the same as broadcast application and incorporation within 12 h, while losses associated with broadcast application and incorporation after 96 h were assumed to be the same as no incorporation.
Swine manure was considered 100% liquid while poultry manure was assumed to be 100% solid. Therefore, the statewide distribution of liquid and solid manure application method from MDA’s 2014 survey was used to inform the N loss calculation for these livestock types, respectively. The liquid-to-solid ratio of cattle manure will likely vary with size of operation, with liquid storage facilities more often found at larger operations. Manure was, therefore, considered 100% solid for all cattle facilities below 300 AU, while a 15/85 and a 70/30 liquid-to-solid ratio was assumed for beef and dairy facilities at or above 300 AU, respectively. For example, manure from a dairy operation larger than 300 AU was weighted assuming 70% of the manure experienced N loss associated with liquid manure application and 30% from solid manure application. The percentage N loss during application was rounded to the nearest 5% interval. Annual as-stored N amounts from each animal operation were reduced by the percent loss for each animal type to estimate the amount of manure sourced N from each feedlot annually (
Table 4).
A novel approach for modeling field-scale manure application was developed for use within ArcGIS software. Two primary data inputs include: (1) point locations of animal feedlots attributed with annual manure sourced amounts of N and P, and (2) field boundaries attributed with average annual N requirement derived from individual crop rotations. User input includes a maximum haul distance unique to each animal operation.
The program runs as a series of manure application loops. The initial loop begins by selecting, for each feedlot provided, the single nearest field (based on a Euclidean distance measure) with an average annual N requirement greater than zero. Each feedlot can apply manure to a single field during any given loop. Using each feedlot as a source of available N, manure application is simulated by decrementing the amount of N required by the field from the source feedlot. Accounting is performed to track how much N is applied during each loop of manure application. If a feedlot can meet the entire N requirements of a field, that amount of N is subtracted from the amount of available N of the feedlot. Once the total N requirement of a field has been met, the field is no longer eligible to receive N from any feedlot. Alternatively, if a feedlot is only able to partially supply the N requirements of a field, the new N requirement of the field becomes the initial requirement minus what was applied during the current loop. Once a feedlot has disposed of the entirety of its manure, it is removed from the analysis. During each application loop, the single nearest field that is still eligible to receive manure from any remaining feedlot is selected. It is possible, though uncommon, that multiple feedlots will apply manure to the same field.
The cost of manure hauling increases with distance from the source, with greater costs associated with high water content manure [
35]. This cost can effectively decrease the value of manure. Following each manure application loop, fields nearest to feedlots will begin to meet their N requirement, forcing the program to search at further distances to find additional fields to dispose of remaining manure. This represents an ideal scenario, in which each field surrounding a feedlot that has an N requirement is available for manure application.
A distance limiting measure was built into the program to account for the cost of manure haul distance. A unique transport distance (in km) was assigned to each feedlot and specifies the maximum distance (defined as the shortest separation between two features) between the feedlot and a field identified for manure application. In the rare circumstance where no fields exist within the specified distance during the initial application loop, the feedlot is flagged and removed from analysis. If all fields within the specified distance have already received their N requirement, over-application of manure must occur.
To begin modeling the potential over-application of manure, the N requirement of all fields is reset to their original N requirement. The manure application loop then starts over by selecting the nearest field to each feedlot with manure remaining, then moving outward until either the N requirement of all fields is met a second time or the feedlot has disposed of its manure. As many over-application loops as necessary can occur to dispose of all the manure from feedlots within the specified distance.
Three haul distance scenarios were modeled in this study. Within each scenario, different maximum haul distances were used depending on the type of animal manure being transported. The most restrictive scenario included a maximum haul distance of 4.8 km (3 miles) for all dairy, beef, and swine facilities, and a maximum haul distance of 16 km (10 miles) for poultry facilities. A 2014 MDA survey [
34] that included average travel distance statewide for the various manure types was used to inform these distances (
Table 5).
While this survey provided one of the few means by which to estimate manure haul distance, the use of statewide averages may introduce bias against larger facilities that have the potential to move manure much further than smaller facilities. Technology continues to remove the cost barriers associated with manure transport, which has traditionally become cost-prohibitive for liquid or semiliquid sources at distances greater than about one mile [
35]. To account for this potential bias against larger facilities, two additional distance scenarios were modeled: the first increased the maximum haul distance for swine and cattle operations to 8 km (5 miles) and the maximum haul distance for poultry to 40 km (25 miles), and the second assumed no distance cap on how far manure can be transported from its source.
To prevent bias between livestock types, application loops were alternated between the two distances. That is, one application loop was run for dairy, beef, and swine feedlots for fields within 4.8 km (using distance scenario 1 as an example), followed by one application loop for poultry feedlots for fields within 16 km, then back to 4.8 km, and so on. If alternation did not occur, all dairy, beef, and swine facilities would apply to the nearest fields until all their manure was disposed of before poultry facilities were able to apply any of their manure.
3. Results
The spatial extent of land area receiving manure was compared for the nine different scenarios modeled (three N application rates and three distance scenarios) (
Table 6). While more hectares are expected to receive manure when applied at low N fertilizer rates and less restrictive distance caps, and conversely fewer hectares at high N fertilizer rates and more restrictive distance caps, the relative impact of rate and distance assumptions on the spatial distribution of nutrients was unknown.
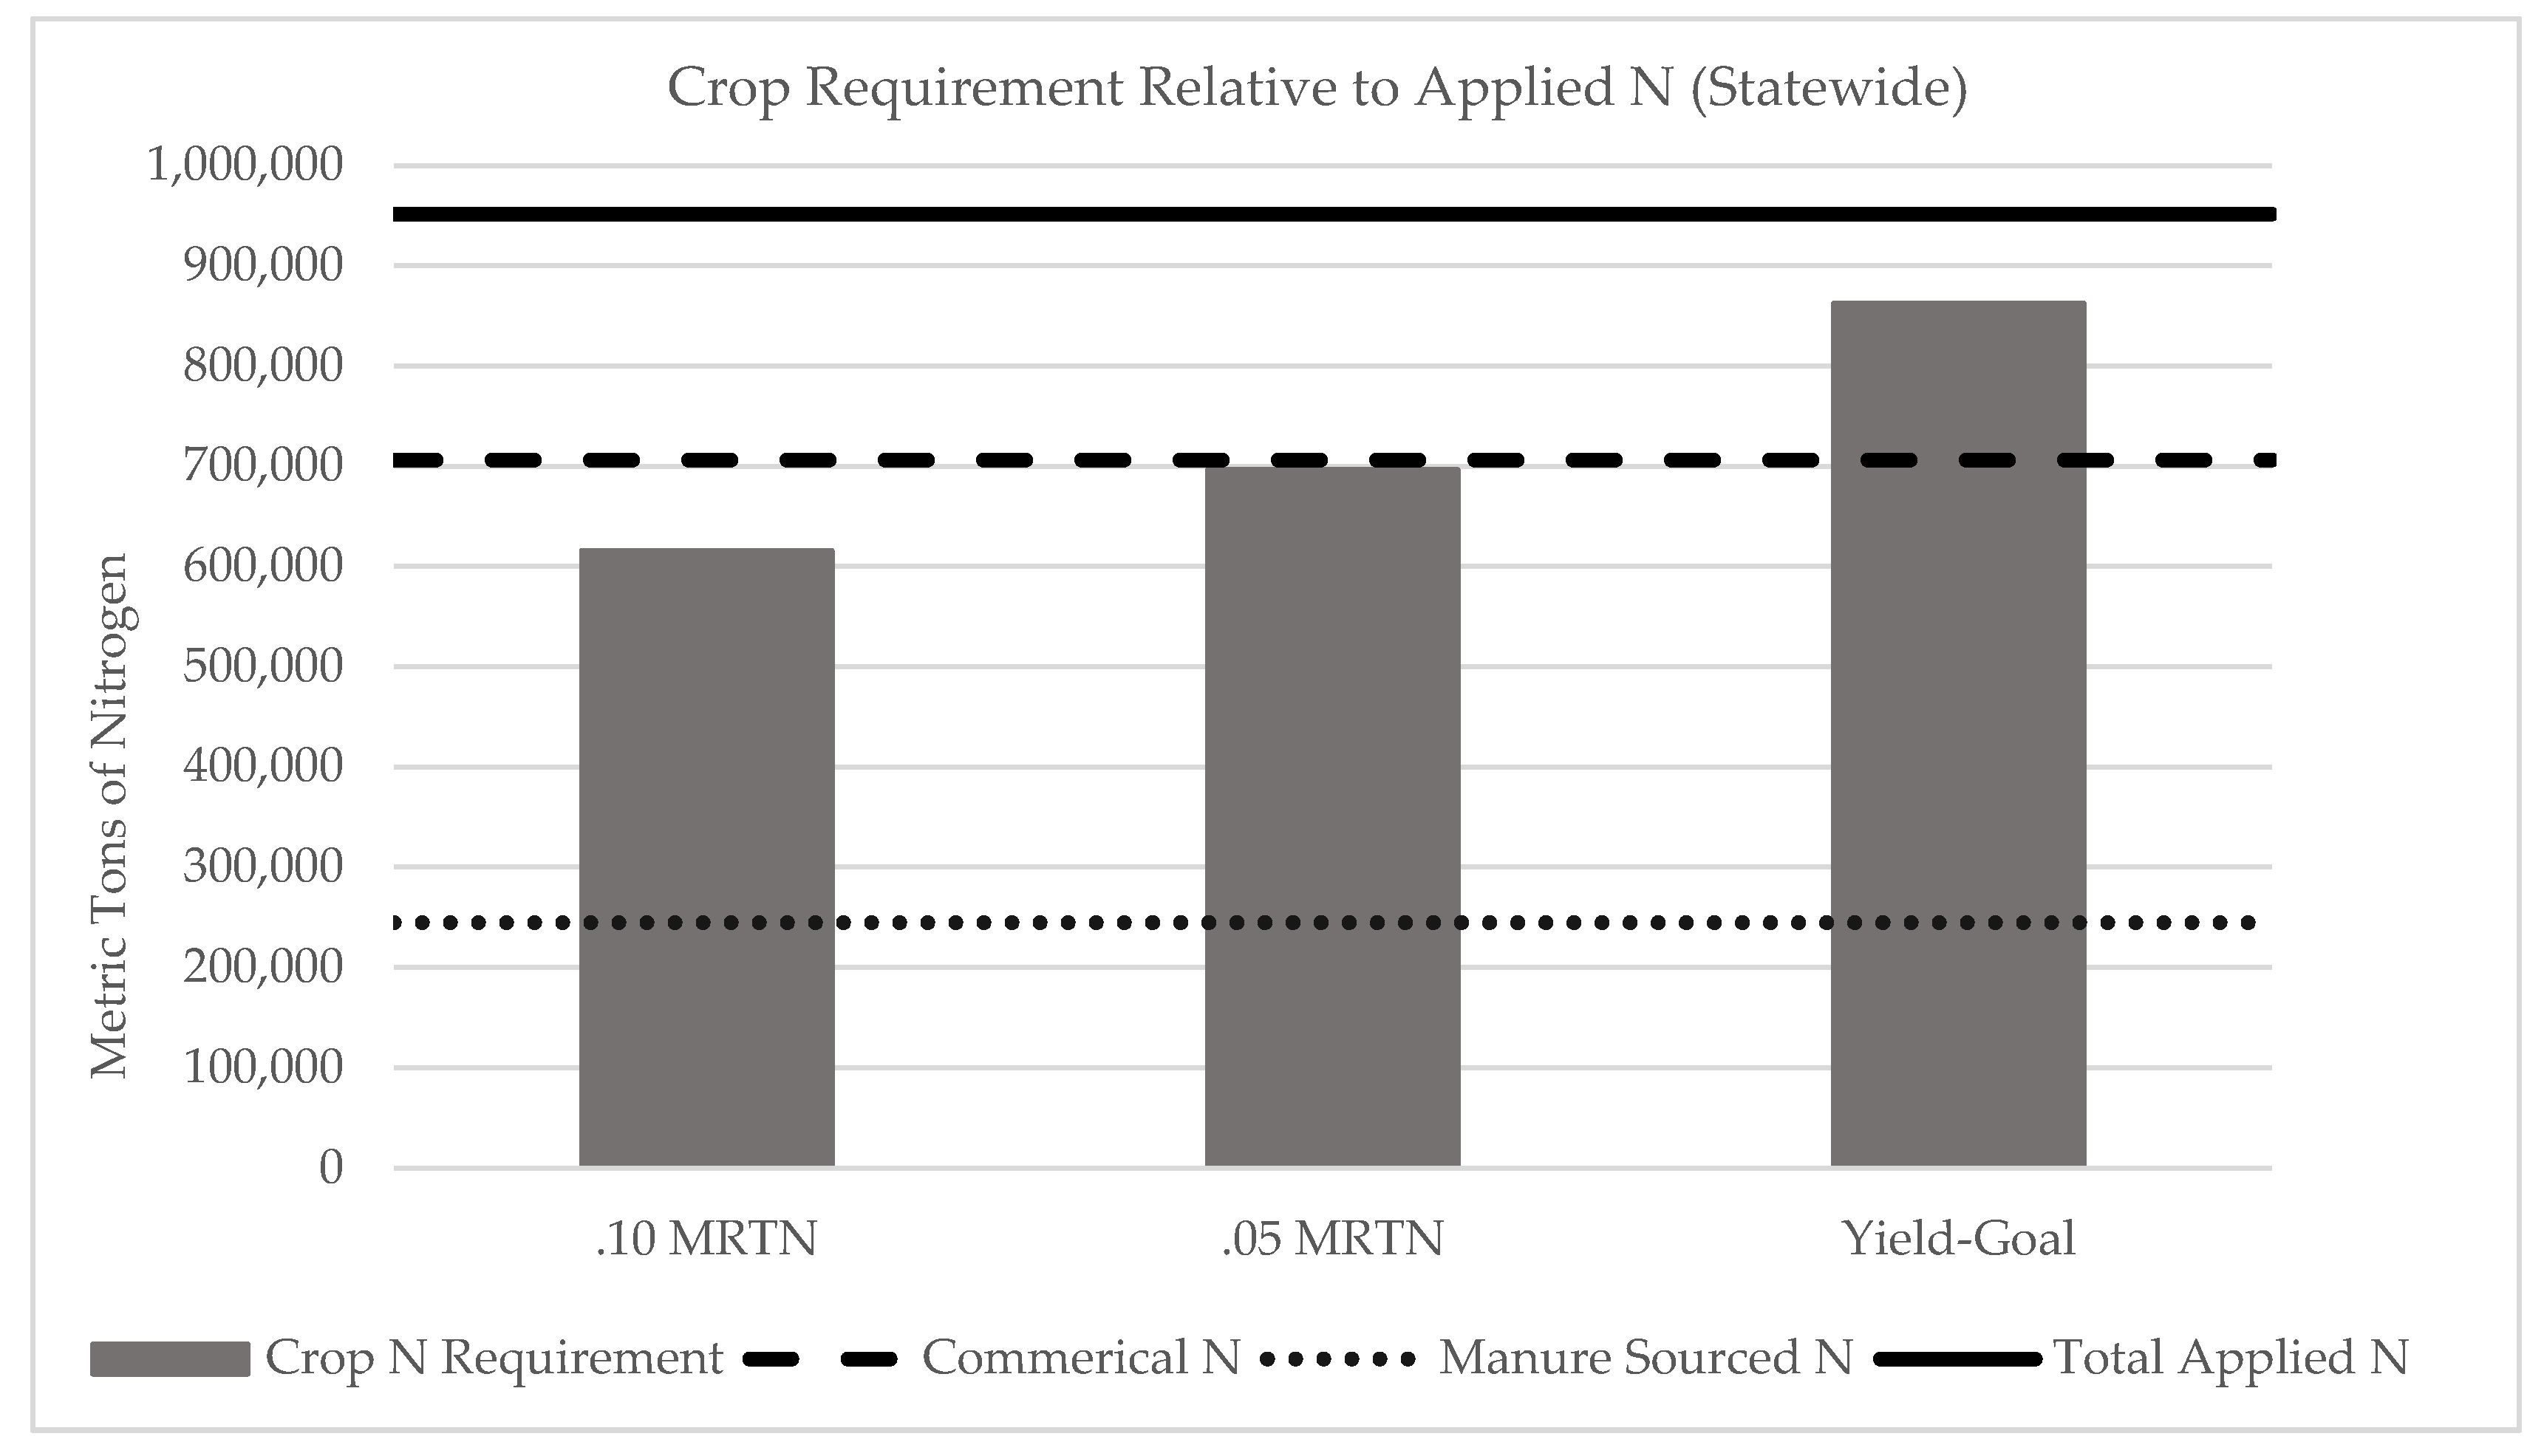
Using the nutrient calculations described in this paper, an estimated 244,951 metric tons of manure sourced N is applied to agricultural fields in MN each year. There is ample cropland in the state that requires N fertilizer, with 7,629,658 ha of cropland having an annual N requirement greater than zero over the six-year period from 2012 to 2017. The total N requirement of cropland in the state of MN ranged from 615,667 metric tons at the 0.10 MRTN rate to 696,824 metric tons at the 0.05 MRTN rate and 862,340 metric tons at the yield goal rate.
The percentage of statewide crop N need that can be met by manure alone ranged from 28.4% when using the yield goal rate to 39.7% when using the 0.10 ratio MRTN rate (
Figure 1). In all three rate scenarios, manure was applied to a smaller fraction of land area than the percentage N need that could be met by manure, ranging from 24.9% to 25.2% of ha receiving manure at the yield goal rate (across the three distance scenarios) to 34.8% to 36.8% of ha receiving manure at the 0.10 MRTN rate. This is largely explained by unequal distribution of N fertilizer requirement across the state. Crop rotations showed corn followed corn more frequently on manured fields compared to non-manured fields. That is, 29% of manured fields grew corn in four or more years of the 6-year rotation, compared to 17% of non-manured fields. Across all nine scenarios, there was a higher annual N requirement for modeled manured hectares as compared to non-manured hectares. Using the 0.05 MRTN rate and distance scenario 2 (8 km and 40 km) as an example, the mean annual N requirement of manured hectares was 99 kg ha
−1 compared to 86.2 kg ha
−1 for non-manured hectares. Similar isolated areas of N over-application were observed for all three rate scenarios when using capped manure haul distances, which will contribute (although to a far lesser degree) to the discrepancy between percentage of N need met by manure compared to hectares applied.
Swine operations account for over half (53%) of the manure sourced N statewide. This is followed by dairy cattle (19% of manure sourced N), beef cattle (16%), and poultry (12%). Technological advancements associated with swine manure storage (liquid storage in underground pits) and application (injection and incorporation) have resulted in reduced N volatilization losses for swine operations [
36].
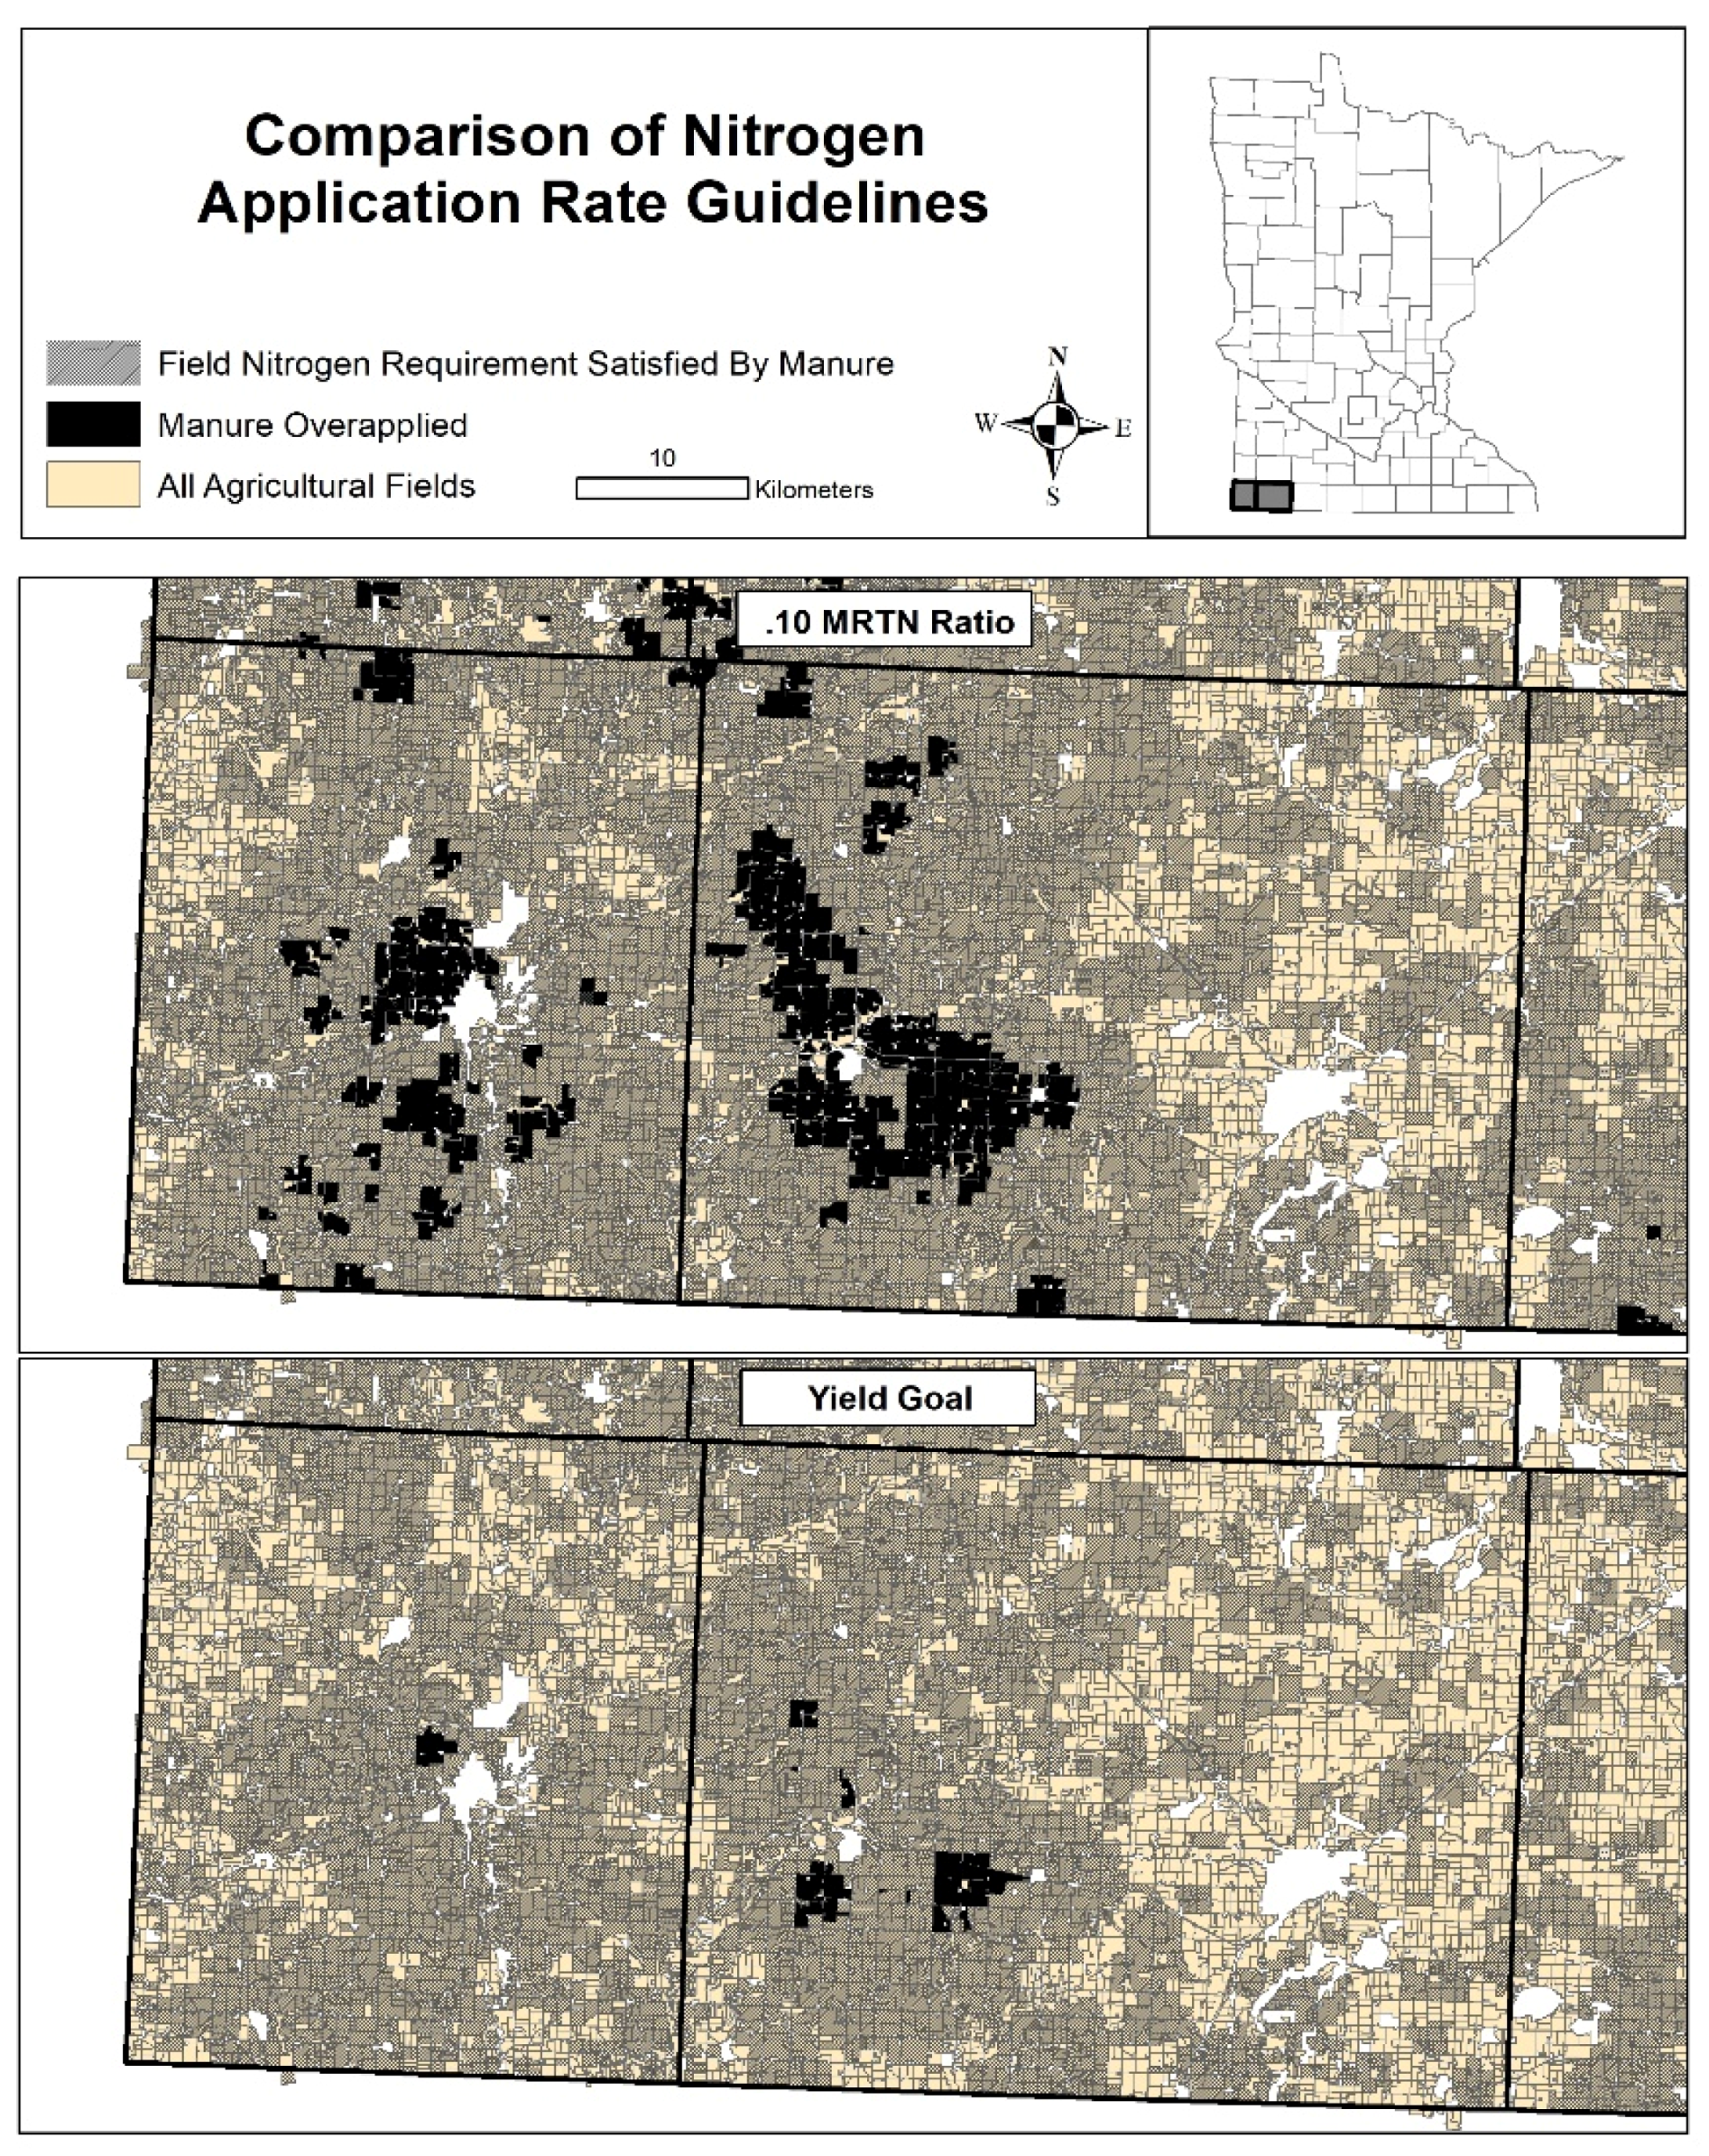
Results from all six N scenarios with capped manure haul distances showed minimal manure over-application statewide, with a decreasing number of fields at risk as N fertilizer rates increase (
Table 6). At the lowest 0.10 MRTN ratio, 4.6% of fields were modeled as having received manure sourced N above-recommended rates. This is compared to 2.5% of fields at the 0.05 MRTN rate and 1.5% of fields at the yield goal rate.
Figure 2 illustrates the varying extent of fields at risk for manure over-application as N fertilizer rates increase, although the geographic regions remain consistent. A very small proportion of manured fields (0.6%) were identified as at risk for over-application when using the highest N rate and increased maximum haul distances of 8 km and 40 km.
As expected, no manure over-application was observed for the three scenarios with no cap on manure haul distance. For each N application rate, the manure was transported as far as necessary from the feedlot for application at the corresponding rate. The maximum required travel distance among all feedlots was recorded by animal type for each of the three application rates (
Table 7). Only feedlots in counties with at least 5% of the land area having an N requirement were assessed to omit outliers in isolated agricultural areas.
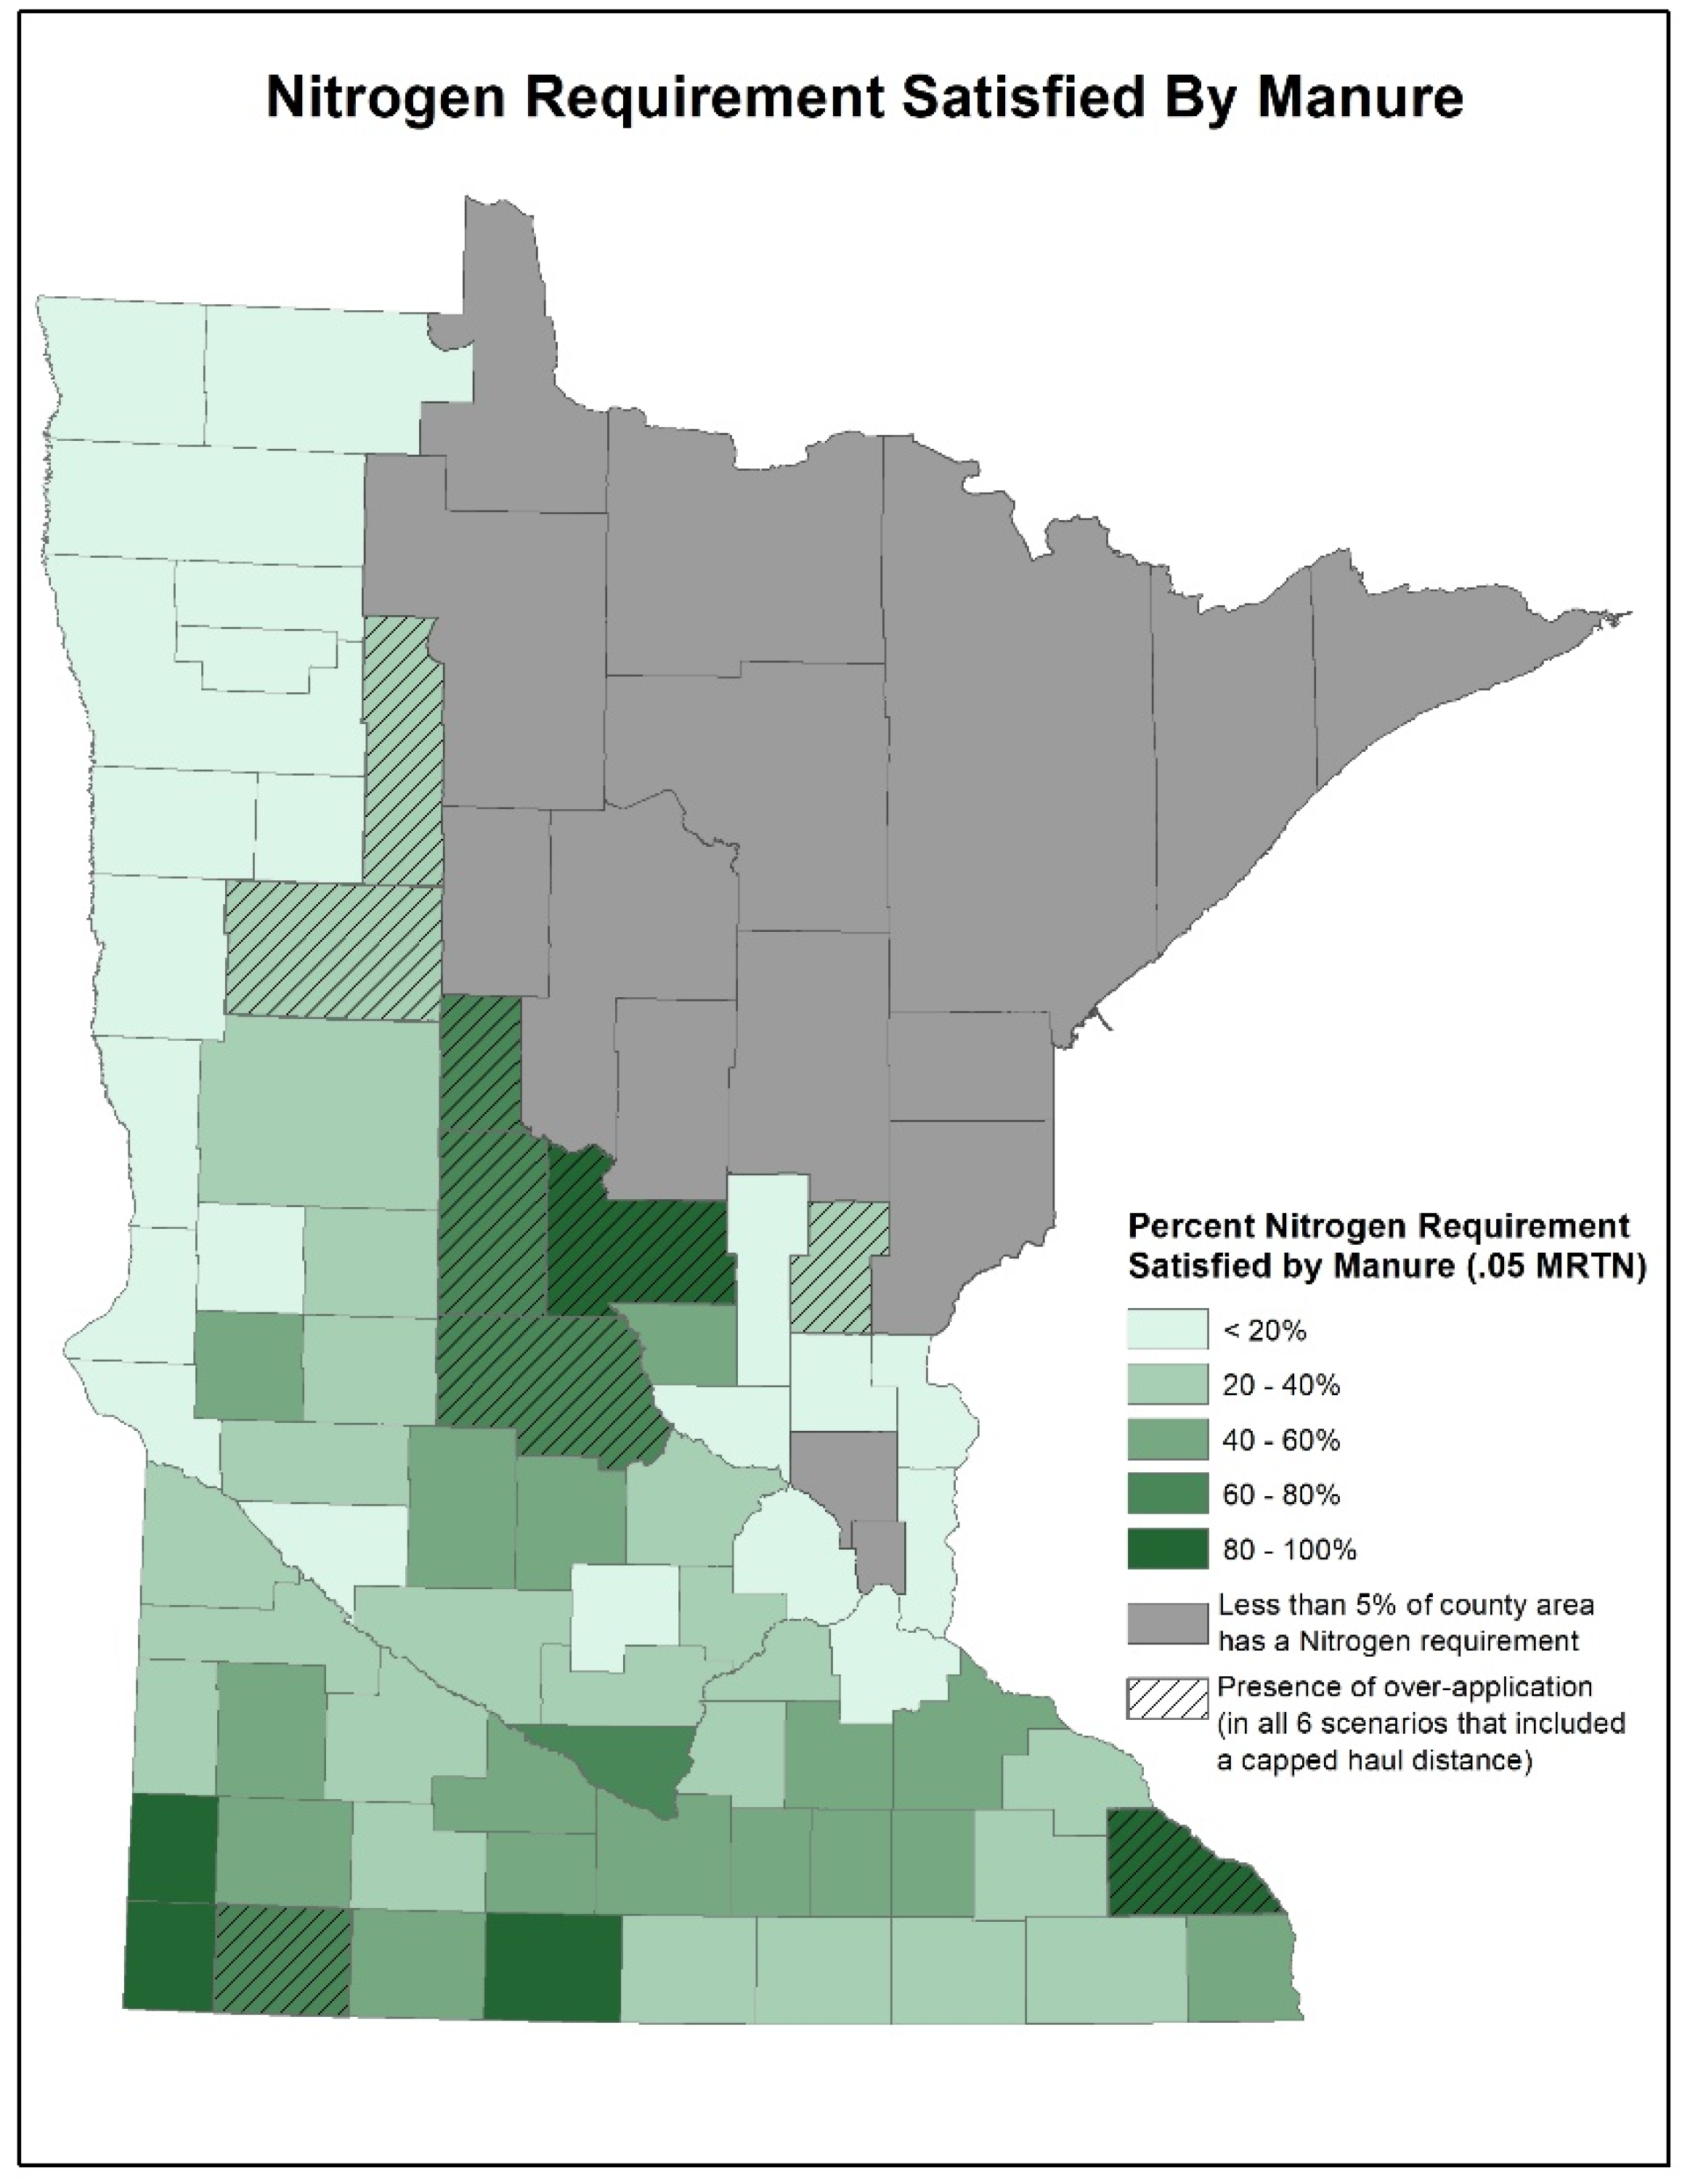
A few distinct geographic regions of potential over-application were observed across all capped manure haul distance scenarios, for which increased risk of N application at rates higher than the agronomic need of the crop is likely. Most notable is a densely concentrated region of animal operations at the border of Morrison and Todd counties in central MN. Other isolated high-risk areas are scattered throughout southeast, southwest, and south-central MN (
Figure 3).
Figure 3 also illustrates the proportion of N requirement in each county that can be provided by manure nutrients. Although manure cannot supply more than 100% of N fertilizer need in any county, at least five counties can meet over 80% of their fertilizer N requirement with manure alone. Martin county (93%) has the highest proportion of N need potentially provided by manure nutrients. The presence of manure over-application risk is not necessarily correlated with the proportion of N need provided by manure nutrients, with high-risk fields identified in counties where manure can supply less than 50% of the county N need. This highlights the necessity for detailed spatial models that can quantify manure distribution at a sub-county level.
In 2016, farm-use commercial fertilizer N sales in MN were 706,768 metric tons. This alone exceeds the total statewide N requirement by 14.7% when assuming all crops are fertilized at the 0.10 MRTN rate. At the 0.05 MRTN rate, commercial fertilizer N sales near-perfectly match (100.01%) the statewide N need. At the yield goal rate, commercial fertilizer N sales equal 81.9% of the statewide N need.
The sum of manure sourced N and commercial fertilizer N sold in 2016 indicates a total of 951,719 metric tons of N applied to MN fields each year, which exceeds the statewide N need in all three rate scenarios. At the lowest 0.10 MRTN rate, total N from manure and commercial fertilizer is equal to 155% of the statewide N need of 615,667 metric tons. This is compared to 137% of the statewide N need at the 0.05 MRTN rate and 110% of the statewide N at the yield goal rate.
Potential commercial fertilizer replacement cost savings were estimated for each N application rate (
Table 8) on a per hectare basis. These estimates assume cost savings from not purchasing commercial fertilizer, and do not account for the significant costs associated with the pumping and transport of manure. Total hectares receiving manure at each of the three application rates were assumed to supplant commercial fertilizer usage on those same hectares. Cost savings were allocated assuming a
$0.40/lb N commercial fertilizer cost (equivalent to the 0.10 MRTN ratio) and an N fertilizer rate equivalent to the average manure N application rate for each scenario. A high and low end was calculated for each of the three application rates using the no distance cap and most restrictive manure haul distance scenario, respectively. Applied statewide, these savings may be as much as
$215,000,000 annually.


