Article

Relationship between Environmental Covariates and Ceylon Tea Cultivation in Sri Lanka

by
Sadeeka Layomi Jayasinghe
1,2,*,
Lalit Kumar
1 and
Md Kamrul Hasan
1,3
1
School of Environmental and Rural Science, University of New England, Armidale, NSW 2351, Australia
2
Faculty of Animal Science and Export Agriculture, Uva Wellassa University, Passara Road, Badulla 90000, Sri Lanka
3
Department of Agricultural Extension and Rural Development, Patuakhali Science and Technology University, Dumki, Patuakhali 8602, Bangladesh
*
Author to whom correspondence should be addressed.
Agronomy 2020, 10(4), 476; https://doi.org/10.3390/agronomy10040476
Submission received: 17 March 2020 / Accepted: 24 March 2020 / Published: 30 March 2020

Abstract

:
How the current distribution of tea cultivation is influenced by specific environmental conditions in Sri Lanka is yet to be explored. Therefore, this study aims to assess the differences between tea and non-tea growing areas with respect to climatic and topographic covariates, and to determine the major covariates that control tea distributions. Climatic data of temperature and rainfall were extracted from WorldClim-Global Climate Data; the elevation, slopes, and aspects were obtained from Global Multi-resolution Terrain Elevation Data; and the solar radiation data was computed using a clear-sky solar radiation model. Random points were created on rasterised environmental layers for tea-growing and non-tea growing areas, stratified into low, mid, and high regions, using ArcGIS version 10.4.1 (Environmental Systems Research Institute: ESRI Redlands, CA, USA).Correlations were derived between covariates and tea and non-tea growing areas. According to the logistic regression analysis, there was no significant influence of the south-west, west, and north-west aspect compared to the north aspect when all other covariates were held constant. The odds ratio indicated that an area with a one-unit higher solar radiation was 1.453 times more likely to be a tea growing area. Similarly, a per unit increase in slope increases the likelihood of an area being suitable for tea cultivation by 1.039 times. When the annual mean temperature increased, the suitability of tea cultivation decreased, but an increased rainfall had increased the suitability of an area for tea cultivation. Areas with a north facing slope had the highest suitability for tea cultivation. This research demonstrated that tea growing could be expanded into a variety of locations as long as these variables are either found or managed in order to obtain the critical levels. In addition, it is proposed that the results of this study could be utilised in the assessment of the climate or/and land suitability for tea.

Graphical Abstract

1. Introduction

Tea is manufactured on nearly every continent on Earth, and the total region under cultivation continues to grow [1,2]. Tea grows in over 50 countries with over three million hectares of total tea-growing land, generating nearly five million tons of tea per year [3]. After India, China, and Kenya, Sri Lanka is the world’s leading tea producer and, thus, the fourth largest in the world. Black tea is the major foreign currency earner in Sri Lanka, accounting for 15% of the net foreign income [4], while contributing 1.2% of the Gross Domestic Product (GDP) [4]. The tea industry in Sri Lanka serves 2.2 million individuals with employment opportunities [5] and has acquired a long-standing reputation in the world market for providing tea (e.g., Ceylon) with its unique flavour and aroma [6].
As a woody perennial cultivated crop in a rain-fed mono-cropping system, tea (Camellia sinensis (L.) O. Kuntze) is highly dependent on agro-climatic circumstances, such as solar radiation, temperature, rainfall, and topographic features [7,8,9]. Usually, these variables are used to assess the potential for land use of tea crops at global and regional levels [10,11]. Previous studies have only shown how solar radiation affects the yields of tea plants. Willson [12] found that the amount of solar radiation reaching a tea bush at high altitudes in equatorial regions can be up to 600 Wm−2. However, for most tea species the importance of specific solar radiation in defining distribution (e.g., minimum or maximum solar radiation per month) is unknown. A number of prior research projects indicated the desired temperature range and rainfall for tea [7,13,14,15]. For example, according to a study carried out by Jayasinghe et al. [12], tea plants prefer a mean annual temperature range from 13 °C to 28 °C and rainfall ranging from 2000 to 5000 mm. The tea shoot growth and yield highly depend on the temperature and rainfall, and bushes do not develop when these variables are either too low or too high, irrespective of other climate variables [16].
Topography (i.e., elevation, slope, and aspect) is another key factor in determining both where tea can be grown, and the quality of the tea grown in a particular region [17]. The tea plant can often only be grown within a certain range of elevations where low-lying areas in Sri Lanka (i.e., 0–100 m) are considered inappropriate for tea. The elevations at which tea grows greatly affects the quality and quantity of tea [15,18]. It is advisable to avoid flatter and steeper slopes for tea, as steeper slopes pose a significant risk of soil erosion and landslide, whereas flatlands increase water-logging conditions, which are undesirable for tea production [19]. Aspects have a strong influence on solar radiation and temperature and impact the distribution of tea [17,20]. Variations in these topographic covariates pose ecological stress and limitations as well as opportunities for tea production.
The complex topography of tea growing fields in Sri Lanka leads to complicated microclimatic environments, with distinct regions getting variable wind and precipitation patterns throughout the year from the two dominant weather systems (Yala and Maha) [21]. The climate of each tea-growing district is, therefore, more or less different from the other. Even within a single district, it is often possible to identify the variation between small areas. These climatic variations are reflected in the range of quality characters which are Ceylon Tea’s leading and most valued features. Tea is highly sensitive to the changes in climatic and topographic covariates [22]. The identification of the impact of the varied climate and topography on the manufacturing of tea has led to the refinement of a range of fine teas that are unique to each agro-climate district.
A small number of empirical studies exist in the literature that have focused on the environmental variables that separate potential tea growing from non-tea growing regions, such as the climate and topography [23]. Mathenge [23] reported that the sustainability of small tea enterprises in Kenya is significantly influenced by the enterprise characteristics, way of doing business, finance, and resources (i.e., human and environmental). Furthermore, he highlighted that some external factors are difficult to control, such as the climate, topography, market, and other legal forms that affect the sustainability of the tea industry. Among the above factors, understanding the main environmental determinants that influence tea cultivation is likely to bridge the knowledge gap and set the benchmark to identify the best use of available land for tea cultivation. No previous studies have been undertaken in Sri Lanka to evaluate the variations in these characteristics either for tea growing or non-tea growing areas. Such investigations may identify further areas that may be suitable for tea growing. If climate variables such as solar radiation, temperature, and precipitation change in the non-tea growing regions that are close to the tolerance of a phenotypic plasticity of tea species, then the cultivation of tea can be expanded further to these areas [24,25]. However, it is hard to comprehend the distinctiveness of the often subtle factors that may separate potential tea growing regions from those that are not suitable. Climate change brings some urgency to the search for mitigation and adaptation strategies for the tea industry’s viable growth. For instance, if we understand the specific spectrum of solar radiation appropriate for the distribution of tea in tea-growing regions, we can bring tea into non-tea growing regions by changing shade management methods [26] if the only limiting factor is solar radiation. Nevertheless, the absence of understanding of the fundamental environmental constraints has hampered the development of adaptation strategies for maintaining or extending the areas for growing tea.
Despite various ongoing efforts, gaps still exist in the understanding of the spatial distribution of tea with respect to the climatic and topographic covariates. Disparate national and regional sources of statistics provide no definite data on the relationship between environmental covariates and tea cultivation, and how these factors affect tea distribution in Sri Lanka. Therefore, this paper was shaped by two objectives: to assess the differences between tea and non-tea growing areas with respect to climatic and topographic covariates, and to determine the extent to which major covariates control the distributions of tea cultivation in Sri Lanka. The covariates were solar radiation, temperature, precipitation, elevation, slope, and aspect. The findings of this research could be instrumental in future efforts in the land/climate suitability assessment of tea cultivation. In addition, this study is expected to generate information on specific requirements for tea cultivation in diverse topographic and climatic environments. This will also help decision-making bodies and local users of natural resources to effectively allocate land resources to achieve a sustainable tea production.

1.1. Study Area

The whole of Sri Lanka was considered as the study area, which covers 65,625 km2 and is geographically positioned in Universal Transverse Mercator (UTM) zone 44. The climate is characterised as tropical, hot, and humid throughout the year, based on the location of Sri Lanka in the Asiatic monsoon region, lying between 5°55′ to 9°51′ N latitude and between 79°42′ to 81°53′ E longitude. The mean annual precipitation in Sri Lanka fluctuates from under 900 mm in the driest parts of the southeast and northwest of the country to more than 5000 mm in the wettest parts of the central highlands. The study region is characterised by an annual mean temperature that varies from 27 °C in the coastal areas to 16 °C at Nuwara Eliya in the central highlands, which is 1900 m above sea level (m a.s.l) [22]. Sri Lanka is characterised by a central-southern mountain range that rises at its peak to 2524 m above sea level (Figure 1).

1.1.1. Tea Growing Areas

Currently, tea is grown on around 221,969 ha, and the cultivation is mainly divided into three major regions; low-grown (<600 m a.s.l), mid-grown (600–1200 m a.s.l), and high-grown (>1200 m a.s.l) areas [26]. There are seven main tea growing areas: Ruhuna and Sambaragamuwa in the low-growing region, Kandy in the mid-growing region, and Nuwara Eliya, Dimbula, Uva, and Uda Pussallawa in the high-growing region of Sri Lanka (Figure 1) [27].

1.1.2. Non-Tea Growing Areas

The areas apart from the existing tea growing areas were considered as non-tea growing areas in this study. The elevation of non-tea growing areas ranges from sea level to around 2340 m a.s.l. These areas have different topographic characteristics, i.e., flat-low-land along the coastal belt and rough-high-land areas in the central part of the country.

2. Materials and Methods

2.1. Data Compilation

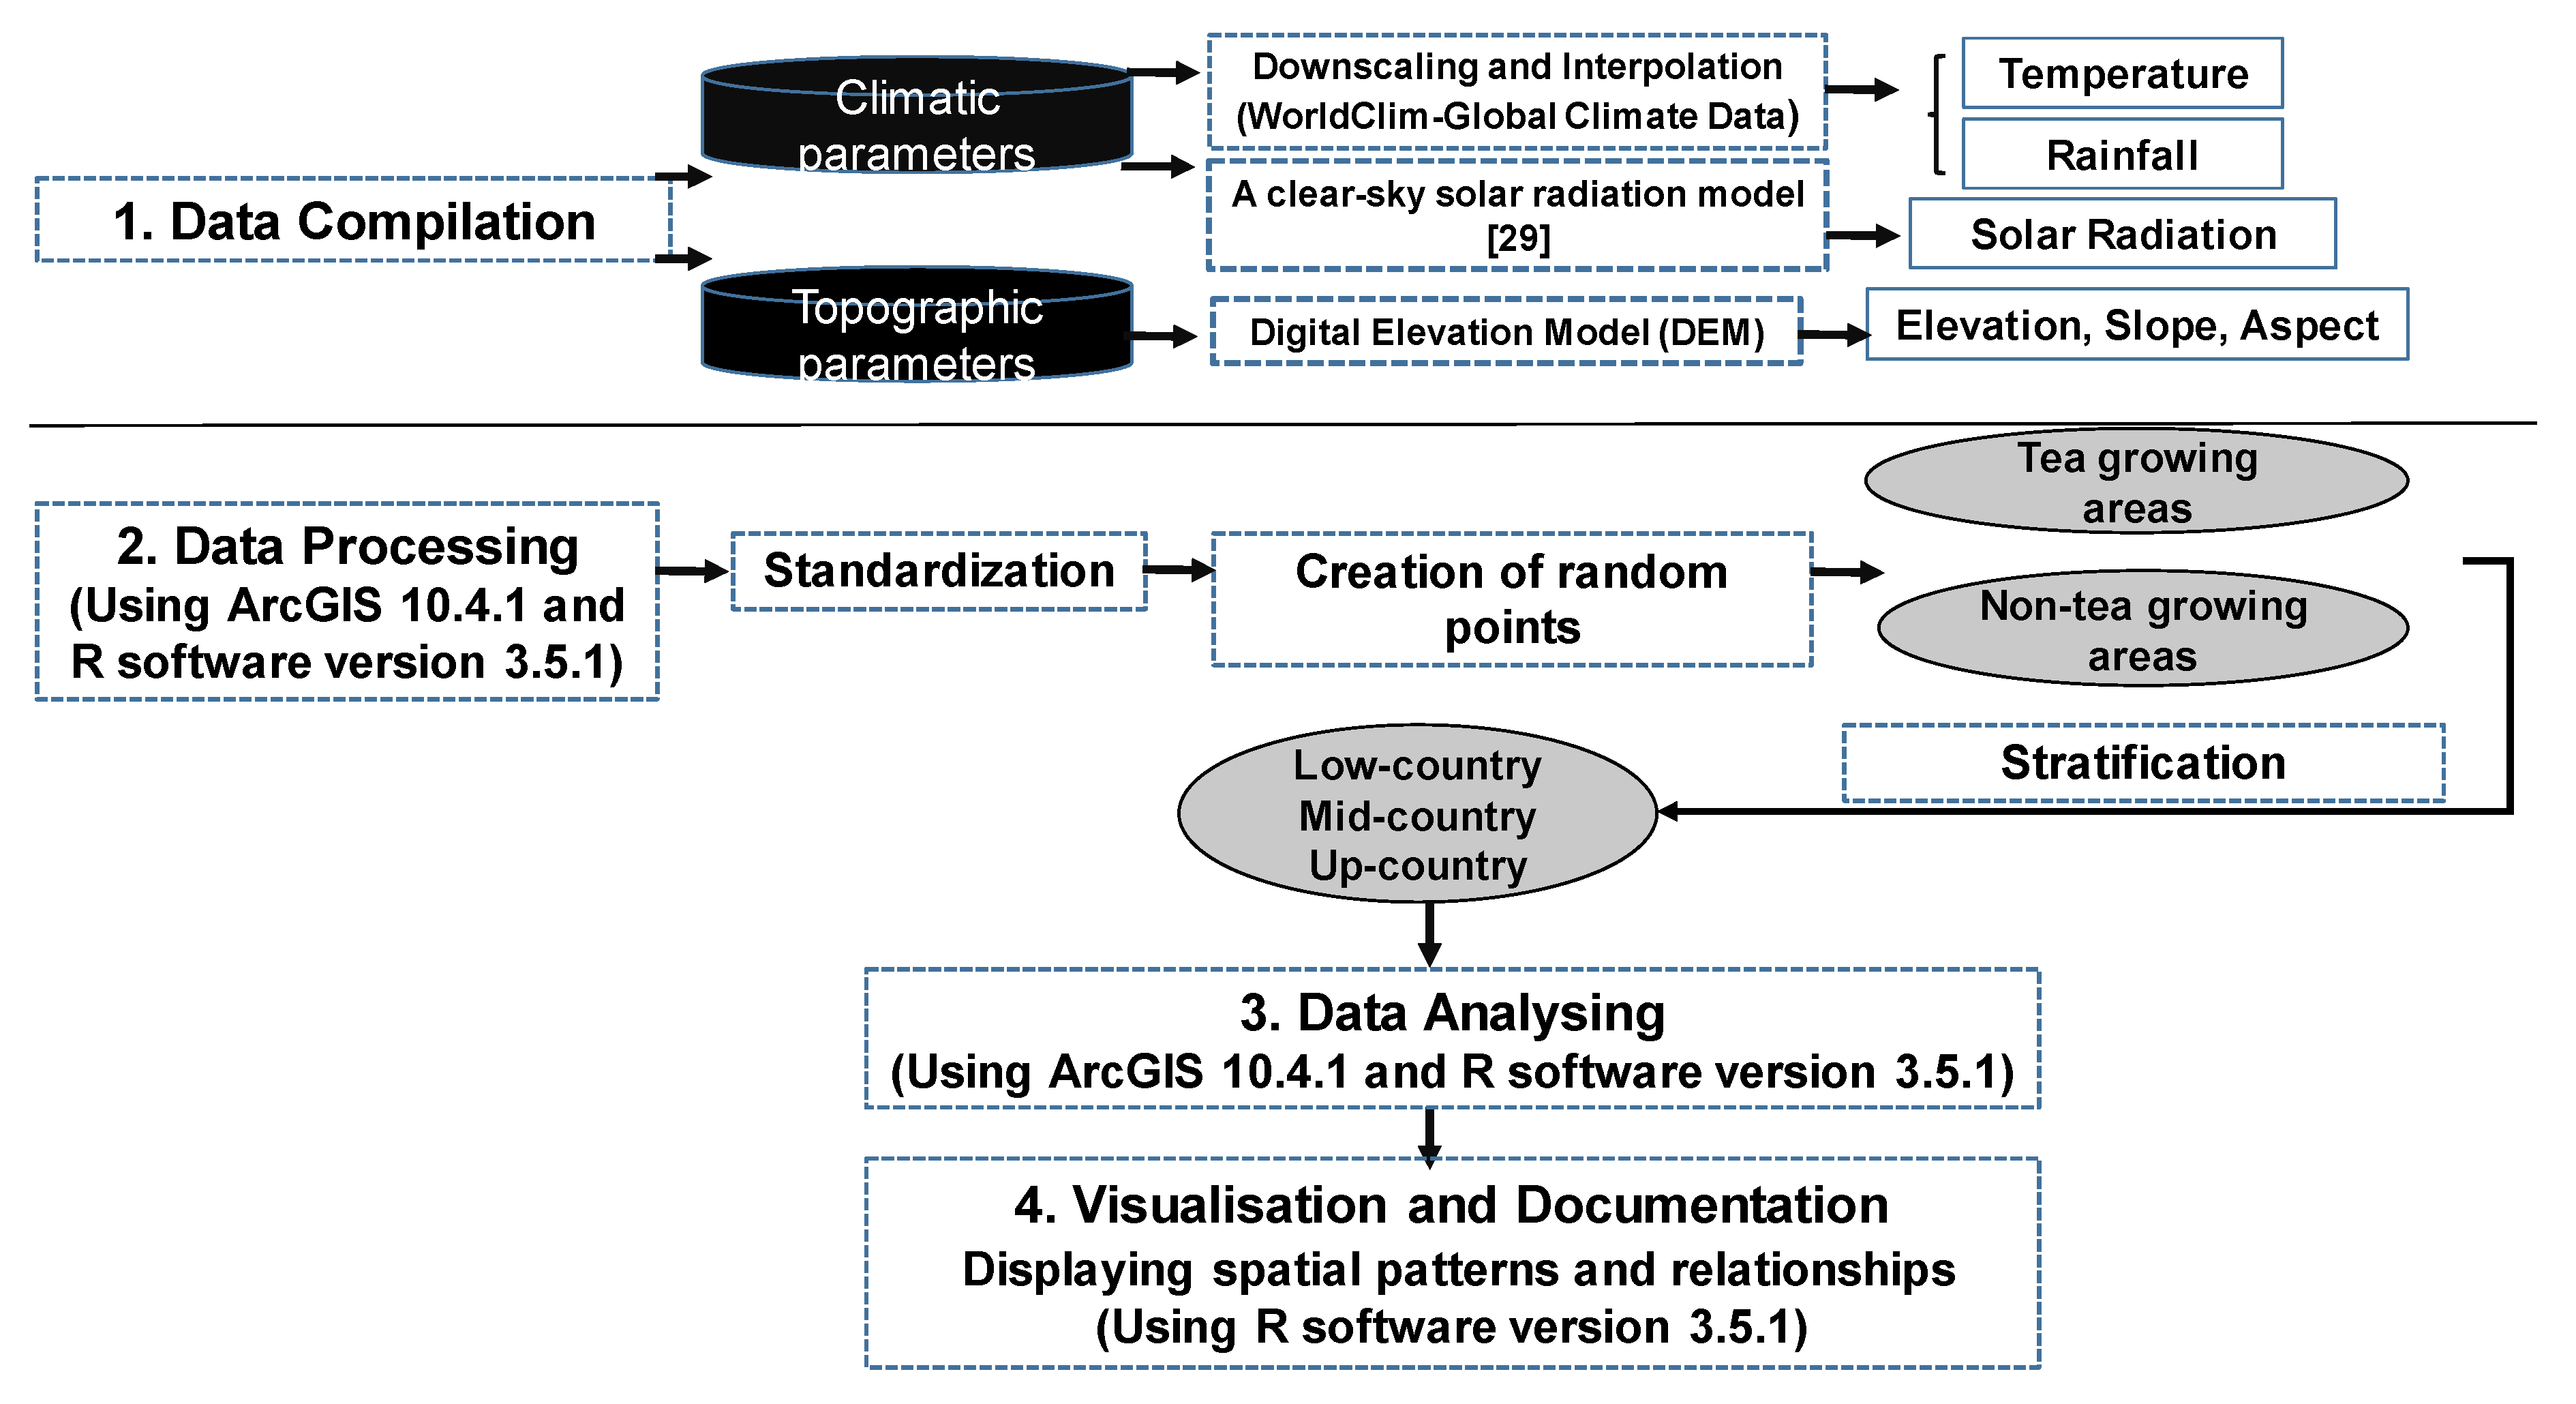
Several factors regulate the distribution of commercial tea production worldwide, with the main factors being climate, weather, and topography. The ecological patterns of a plant population are defined by the interactions between population dynamics and external environmental components [28]. Climate and topography are among the most fundamental environmental drivers of plant diversity. Even slight changes in environmental variables can have a significant impact on the characteristics of ecological functions, and thus influence the distribution dynamics of a crop, including tea. In this study, we compared several climatic and topographic factors between tea and non-tea growing areas. The factors were solar radiation, elevation, slope, aspect, temperature, and rainfall. The following subsections explain the generation of data for these factors, and Table 1 presents the database, and their type and structure. Figure 2 shows the main stages of the spatial analysis model used in this study.

2.1.1. Solar Radiation

The estimation of solar radiation and its spatial patterns were executed using the approach documented by Kumar et al. [29] using ARC GIS software. The Kumar et al. [29] solar radiation model calculates the potential shortwave solar radiation received at a surface under clear-sky conditions for a study area for a given time period. In this research, the parameters used to calculate solar radiation on a monthly basis were: (1) the longitude and latitude of the Digital Elevation Model (DEM) with a spatial resolution of 1 km2, (2) the first and last days of each month according to the Julian Calendar, and (3) a 15-min time interval. The potential solar radiation was calculated for every 15 min interval from sunrise to sunset and integrated to give the daily solar radiation for each of the days. The daily data was then added to provide the monthly and seasonal solar radiation. The seasonal data was summer (June–August), autumn (September–November), winter (December–February), and spring (March–May).
We used MJ m−2 day−1 as a unit of the daily solar radiation calculation. However, we also used µmol m−2 s−1 to easily compare it with the existing literature, where 1 MJ m−2 day−1 is equal to 52.95 µmol m−2 s−1 [30]. Regarding the daily conversion of solar radiation, a portion of 50% of solar radiation was considered as Photosynthetically Active Radiation (PAR) as suggested by various authors [31,32].

2.1.2. Rainfall and Temperature

Temperature and rainfall variables are key elements which govern the distribution of tea species; these variables were extracted from the WorldClim-Global Climate Data [33]. WorldClim comprises gridded global climate layers at 30-arc seconds with a spatial resolution of 1 km2 with Geographic Coordinate System (GCS) of World Geodetic System (GCS_WGS_1984) projection [34] for the period of 1960–1990 [35]. Since Sri Lanka has diverse climatic conditions and topographies over a short range, we selected a spatial scale of 1 km for the data analysis.

2.1.3. Elevation, Slope and Aspect

Elevation data with a similar resolution of 30-arc seconds as bioclimatic variables were obtained from the global multi-resolution terrain elevation data [36]. Slope and aspect rasters of the study area were derived from the elevation data (both in degrees) using the Environmental Systems Research Institute’s ARC GIS version 10.4.1.

2.2. Data Processing and Analysis

All the environmental variable layers were rasterised into the same bound, cell size, and the same coordinate system as the layer of occurrence localities in ArcGIS 10.4.1. The environmental variable layers were then re-projected to GCS_WGS_1984 with 1 km2 spatial resolutions. As we needed to check the impact of the solar radiation, temperature, rainfall, elevation, aspect, and slope on the distribution of tea, random points were created for tea-growing areas and non-tea growing areas separately using Data Management tools in ArcGIS 10.4.1. In Sri Lanka, tea growing areas cover only 3.57% of the total area. Therefore, we selected a lower number of points from tea-growing areas compared to non-tea growing areas. The random points were then separated as low, mid, and up-country for both tea and non-tea growing areas, as shown in Table 2. The “tidyverse” package [37] implemented in R software version 3.5.1 [38] was used for the processing and visualisation of the data.
We used descriptive statistics, such as mean, standard deviation (SD), minimum (min), and maximum (max) to explore the data. An analysis of variance (ANOVA) along with Tukey’s HSD (Honestly Significant Difference) post hoc analysis was used to infer the differences in average solar radiations across different seasons (autumn, spring, summer, and winter) and country types (low-country, mid-country, and up-country). Tukey’s HSD was chosen because it can control the familywise error rate and is recommended in most situations as the best multiple comparison method [39].

3. Results

3.1. Climatic and Topographic Covariates Of Tea Cultivation

The comparative descriptive statistics between tea and non-tea growing areas for solar radiation, temperature, rainfall, elevation, and slope are summarized in Table 3. These results are for the overall distribution of random points, not based on stratification. Accordingly, tea growing areas received less solar radiation than non-tea growing areas. The differences in solar radiation in a year, and in summer, autumn, and spring between these two types of growing areas, were statistically significant as shown by the t-statistics. However, winter solar radiation did not show any significant difference between tea and non-tea growing areas. Among the four seasons, spring received the highest solar radiation (M = 25.87 MJ m−2 d−1), which was closely followed by the summer season (M = 25.35 MJ m−2 d−1). The winter season always received the lowest amount of solar radiation (M = 22.63 MJ m−2 d−1). Among the studied factors, the minimum solar radiation was one of the most influential variables that discriminated the two areas of study. The tea growing areas received a high amount of minimum total and seasonal solar radiation when compared to non-tea growing areas.
Both elevation and slope in tea growing areas were significantly higher than those of non-tea growing areas. The other two important factors of tea cultivation were temperature and rainfall. Information contained in Table 3 shows that tea growing areas had a mean temperature of 23.42 °C and an annual rainfall of 2795 mm, which were, respectively, 0.54 °C lower and 504 mm higher than for non-tea growing areas.
There was a difference in solar radiation in the different aspects between tea and non-tea growing areas, as shown in Figure 3. The highest solar radiation was received towards the south direction, followed by the southeast and southwest directions in both tea-growing and non-tea growing regions. The lowest solar radiation was received towards the north direction, followed by the northwest and northeast directions. The tea growing areas received a lesser amount of solar radiation than the non-tea growing areas in all aspects except the south direction. As we go from south to north through either east or west, the differences between solar radiations of tea and non-tea growing regions tended to increase. The difference in the north was 0.20 MJ m−2 d−1, while this value in the south was only 0.07 MJ m−2 d−1.

3.2. Interactions among the Covariates of Tea Cultivation Based on Stratified Data

Figure 4 shows that, in low-country conditions, tea growing areas received a significantly lower solar radiation than non-tea growing areas for all four seasons. However, in mid- and up-countries, the tea and non-tea growing areas showed no significant difference for all four seasons. Within both tea and non-tea growing areas, seasonal variations were significant, with spring receiving the highest solar radiation (25.87 MJm−2 day−1) and winter experiencing the lowest solar radiation (22.63 MJ m−2 day−1).
The differences in topographic and climatic factors between tea and non-tea growing areas is illustrated in Figure 5. The elevation differed among low, mid, and up-counties (Figure 5a). As the elevation increased, the difference in elevation between tea and non-tea growing areas tended to increase. Slopes in up- and mid-country were higher than for low-country. Compared to non-tea growing areas, tea growing areas in low-country had higher slopes, but had lower slopes in up-country, which indicated a smaller range of slope requirement for tea cultivation (Figure 5b).
Overall, the annual rainfall was higher in low, mid, and up-country tea growing areas than in non-tea growing areas (Figure 5c). Up-country locations generally received a greater amount of rainfall, but an exceptional case was found in a low-country situation where tea growing areas received higher rainfall than in any other location. This exception had created a larger difference (1248 mm) of annual rainfall on the low-country level between tea and non-tea growing areas. However, in all of the cases, tea growing areas had a higher annual rainfall than non-tea growing areas. Another climatic factor was the temperature, which was highest in the low-country and lowest in the up-country. On all country levels, tea growing areas had lower values of temperature than those of non-tea growing areas (Figure 5d).

3.3. Effects of the Covariates on Tea Cultivation

Table 4 shows how covariates contributed to the determination of the tea distribution. According to the logistic regression analysis, solar radiation, elevation, slope, mean temperature, annual rainfall, the north, north-east, east, south-east, and south aspect had significant impacts on the distribution of tea in Sri Lanka. There was no significant influence of the south-west, west, and north-west aspect compared to the north aspect when all other covariates were held constant. The odds ratio indicated that an area with a one-unit higher solar radiation was 1.453 times more likely to be a tea growing area. Similarly, a per unit increase in slope increased the likelihood of an area being suitable for tea cultivation by 1.039 times. When the annual mean temperature had increased, the suitability of tea cultivation had decreased, but an increased rainfall had increased the suitability of an area for tea cultivation. Among the aspects, areas with a north facing slope had the highest suitability for tea cultivation.
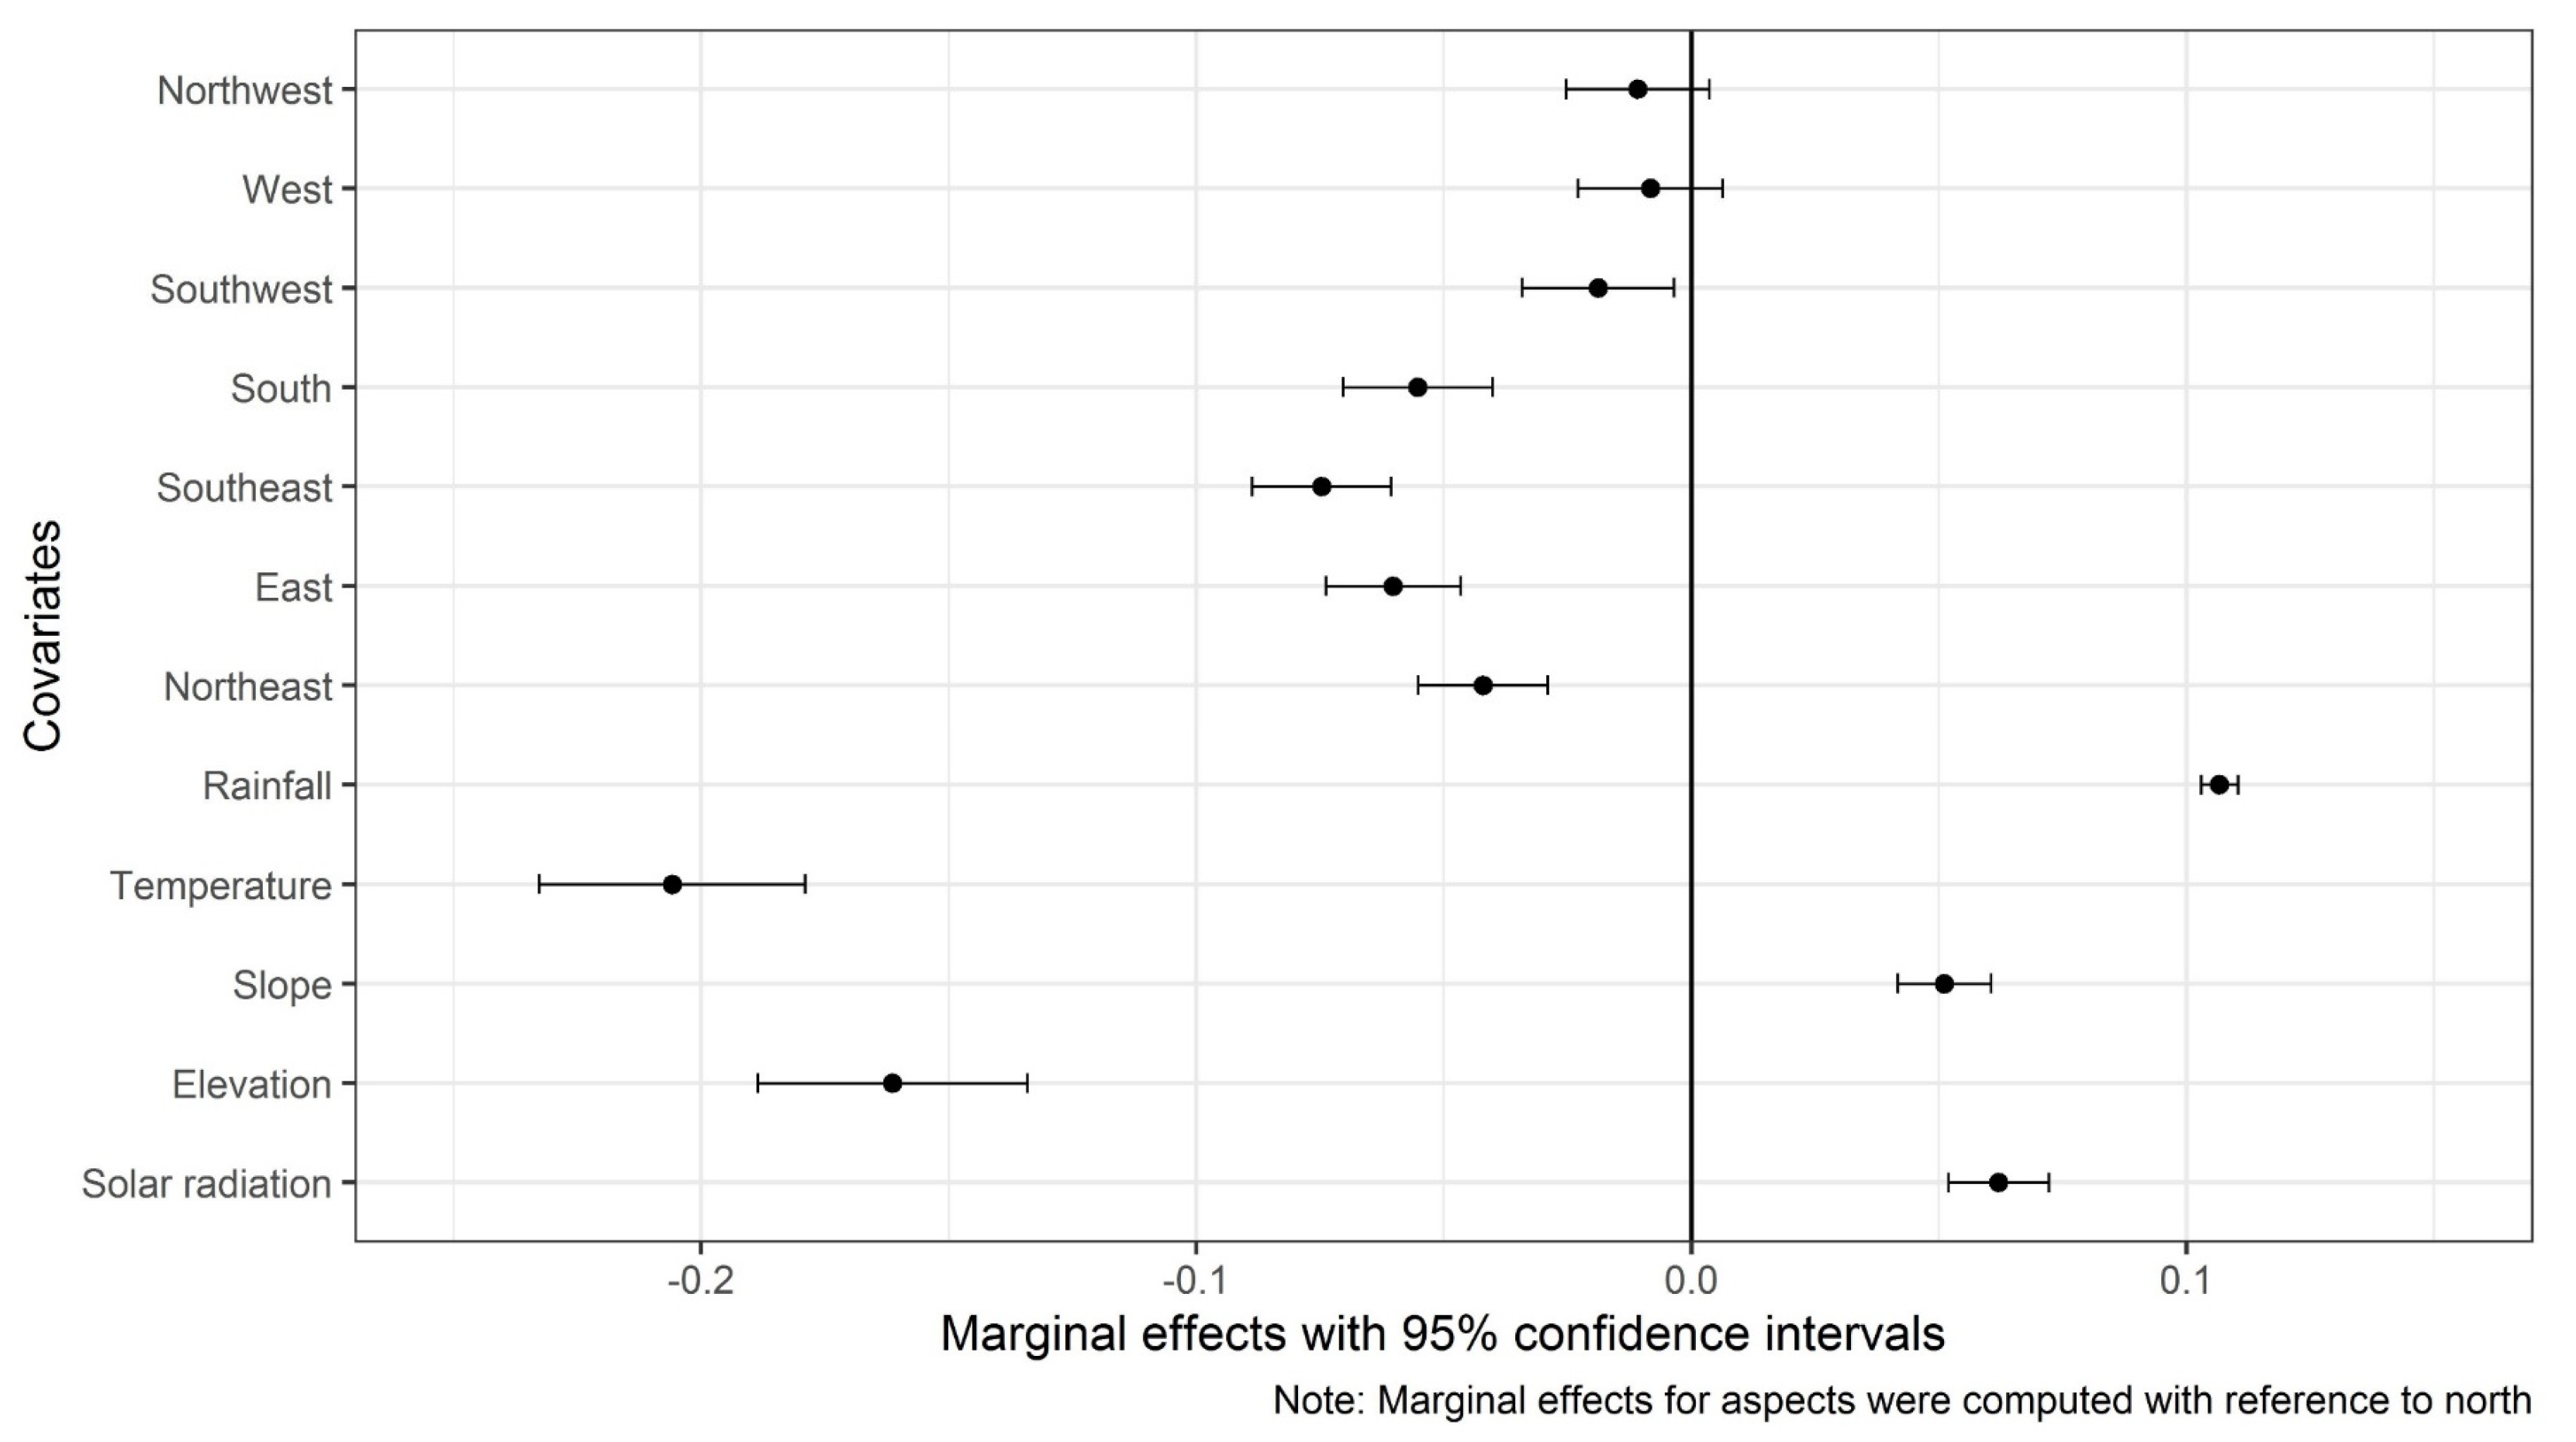
Figure 6 shows the marginal effect of each of the covariates on tea distribution where we can compare different standardized covariates based on their comparative effects. Marginal effects of aspects were computed assuming the north aspect as the reference point, compared to which all other aspects negatively contributed to the probability of a location being a tea growing area. Among the aspects, the southeast facing areas were more likely to decrease the probability of being a tea growing area than any other aspects. Elevation and rainfall had a significant marginal impact on the determination of tea distribution. A higher temperature and slope tended to decrease the probability of an area being used for tea cultivation. Along with other factors, solar radiation had a large (0.06) marginal effect on the probability of tea cultivation. The most important variables that determined where tea could be grown were temperature, elevation, rainfall, solar radiation, and slope.

4. Discussion

The present study was designed to assess how the current distribution of tea cultivation in Sri Lanka is influenced by specific climatic (e.g., solar radiation, temperature, and rainfall) and topographic (e.g., elevation, slope, and aspect) covariates. The major environmental covariates that regulate tea distribution were also investigated to identify the variety of eco-physiological requirements that tea demanded. According to the comparative descriptive statistics, tea and non-tea growing areas differed in terms of total and seasonal solar radiation (summer, autumn, and spring), temperature, rainfall, elevation, slope, and aspect. Logistic regression also confirmed that total solar radiation, rainfall, slope, and aspect had a significant impact on the suitability for tea cultivation.
It was found that the total annual solar radiation in tea growing areas was lower than for non-tea growing areas. This variation reflected the fact that tea is a shade-loving plant, and the intensity of radiation is regarded as necessary because of photoinhibition [40]. Photoinhibition is caused by a strong solar radiation that damages the photosynthetic system as a consequence of excess energy and an over-reduced state of photosynthetic components [41]. Overall, solar radiation was found to be a major covariate in selecting areas in which to distribute tea cultivation in Sri Lanka. The covariates of suitability of tea growing areas were interrelated. Similar to a previous study conducted by Renne et al. [42], the current study indicates that the low-country areas generally received lower solar radiation than the up-country areas did. According to the results of this study, tea requires a specific average solar radiation in tea growing areas, indicating averages of 24.2 MJ m−2 day−1 (640.09 µmol m−2 s−1) in up-country, 24.4 MJ m−2 day−1 (645.3 µmol m−2 s−1) in mid-country, and 24.8 MJ m−2 day−1 (655.9 µmol m−2 s−1) in low-country tea growing regions. These values mirror the physiological requirement of tea as previously reported. The values for saturating light intensities for tea range from 600−800 µmol m−2 s−1 to 1200−1500 µmol m−2 s−1 of PAR [14,43]. The results also show that the highest solar radiation was received in the spring season, while the lowest solar radiation was received in the winter season, for both tea and non-tea growing regions. The higher solar radiation in the spring season was due to the position of the sun, which stays more perpendicular during the spring in Sri Lanka [44]. Our study agrees with the findings of Nijamdeen et al. [45], who indicated that tea production is highest during the spring season (March to May) as tea plants receive a desirable high solar radiation with less cloudiness. Our results show that tea growing areas are impacted by minimum solar radiation. This means that tea requires a certain amount of minimum solar radiation to reach its top canopy at a photosynthetically light saturation point. Squire [46] observed a decline in the production of tea under cloudy conditions, and a lower amount of solar radiation decreased the temperature of the tea canopy, which reduced the yield of tea.
A change of the ideal growing conditions, including rainfall and temperature, would severely affect the geographic distribution, yield, and quality of tea [2,22,47]. According to the results, increased rainfall increases the suitability for tea cultivation. Non-tea growing regions received significantly lower rainfall compared to that of tea growing regions on all country levels. Tea requires a higher mean annual rainfall than other perennial crops [48,49]. This might be the reason for discrepancies in the rainfall between tea and non-tea growing areas. In particular, there was a larger difference in rainfall between tea and non-tea growing areas in low-country compared to the other two country levels. This could be because the random points of low-country non-tea growing areas included lower elevations than tea growing areas, which received higher annual rainfall especially from the South-West monsoon when compared to non-tea growing areas. Topographical features strongly affect the spatial patterns of monsoonal rainfall even within the same district of Sri Lanka [50]. Our results show that the rainfall of tea growing areas varied between 2250–3500 mm, and this result was consistent with the findings of previous studies [22,49] as 2500–3000 mm/per year is considered an optimum rainfall for tea cultivation. Non-tea growing areas received lower rainfall across all the country levels. A reduction in the monthly rainfall by 100 mm could reduce the yield by 29−81 kg/ha/month [51], and impact on the tea quality [52] and its geographical distributions [22]. This may be the reason why some areas are less suitable for tea cultivation and have been known as non-tea growing regions.
Unlike rainfall, the suitability of tea cultivation decreased with an increasing temperature. This was perhaps due to the inhibition of the shoot growth of tea at higher temperatures [14,53]. Our findings indicated that the mean temperature recorded in both tea growing and non-tea growing areas was in the range of 20–30 °C, which is desirable for shoot growth and the production of tea, which is similar to the findings of previous studies [15,26,40,45]. However, a lower temperature was recorded in all tea growing areas compared to non-tea growing areas because higher temperatures are not ideal for the tea plant as they tend to reduce the quality and yield of the tea [7,13,53]. Furthermore, up-country tea growing areas provided the desirable temperature to grow tea as it is close to the optimum temperature (22 °C) [13,53] for the shoot growth of Ceylon tea cultivars. Additionally, optimum yields were recorded at temperatures around 22 °C under the study conducted by Abeysinghe [54].
Findings show that the slope was another important covariate that determined tea distribution in Sri Lanka. Tea growing areas in the low- and mid-country had higher slopes than in the up-country, but lower slopes in the up-country, which indicates a specific slope requirement for tea cultivation. Land with a slope between 15–25° is considered as having a very highly suitable class, while a gentle slope (>5–7°) is regarded as being highly suitable for tea. The class of “very steep slope” (>35°) is considered as being unsuitable for tea [19]. Thus, more flatlands in low-country and steeper slopes (>35°) in up-country are best avoided because flatlands will increase water logging conditions while steeper slopes provide a major risk of soil erosion and landslides, which is undesirable for tea growth [47,55].
Tea cultivation areas were distributed across all aspects from north to south, and the solar radiation received for different aspects varied. The face that a land introduces to the sun (for instance, the north or south) plays a major role in the generation of the microclimate [56,57]. Among the aspects, the southeast facing areas were more likely to decrease the probability of an area being a tea growing area than any other aspects. The highest solar radiation was received towards the south direction, followed by the southeast and southwest directions in both tea growing and non-tea growing regions. For the geographical location of the investigated regions (in the Northern Hemisphere), the south aspect is the best for receiving a high solar radiation for a given surface area because the slope is tilted toward the sun [58].There was a significant difference between the elevation of tea-growing areas and non-tea growing areas in all low, mid, and up-country areas. The results clearly show that tea growing areas recorded a higher elevation than non-tea growing areas on all country levels, and the difference in elevation between tea and non-tea growing areas tended to increase as the elevation increased. This was largely due to the fact that tea plants prefer to grow at high elevations as climatic conditions at high elevations are highly favourable for the development of aromas, and the cold nights and misty peaks slow down the growth of the tea plant, leading to a higher concentration of aromatic oils and richer flavours [18]. However, the maximum elevation of tea growing areas is limited to 2289 m. This result is quite similar to a previous study undertaken by Covey [59] as they indicated that the suitability of tea growing areas tended to decline with a higher elevation since colder temperatures at higher elevations further reduce tea yields.
In a nutshell, this study indicates the differences between tea and non-tea growing areas with respect to climatic and topographic covariates. These environmental factors primarily determine where to grow tea in accordance with its physiological requirements. Adequate knowledge of environmental covariates in the distribution of tea is crucial since even slight perturbations of the suitable environmental factors could inhibit the prospects for tea growing, especially in an era of climate change. Furthermore, this study comprehensively assessed the variations in solar radiation, temperature, rainfall, elevation, aspect, and slope across tea and non-tea growing regions. However, this study was limited by the fact that it did not include soil factors in its analysis due to the lack of a clear and detailed coverage of the point-based soil profile data in Sri Lanka. However, tea has a wide tolerance of different soils so long as low fertility soils are regularly replenished with organic matter [60]. Therefore, in a sense it is the least critical or the most easily managed environmental factor. However, it is vital to conduct further studies that incorporate soil pH as well, since soil pH is the most important soil parameter in tea cultivation [61,62].

5. Conclusions

This study highlights the disparities between tea and non-tea growing areas with respect to climatic and topographic covariates while revealing the relationship between these covariates and the spatial distribution of tea in Sri Lanka. Solar radiation, elevation, slope, mean temperature, annual rainfall, and aspect were significantly correlated with the distribution of tea in Sri Lanka. Tea growing areas were generally situated where less solar radiation was received by the surface when compared to non-tea growing areas. Both the elevation and slopes in tea growing areas were significantly higher than those of non-tea growing areas in all stratified zones. An increased rainfall increases the suitability for tea cultivation, while the suitability of tea cultivation decreases with an increasing temperature. Areas with a north-facing slope had the highest suitability for tea cultivation. Solar radiation provides a stronger explanatory environmental variable for the geographic variation in tea cultivation across Sri Lanka, followed by slope and aspect. Slope and aspect are of course facilitators or inhibitors of solar radiation. The information provided in this study can be useful in developing effective land and/or climate suitability assessment criteria for tea as it provides a synopsis of the physiological requirements for tea to sustain its habitat. Furthermore, these findings shall enable stakeholders to identify the impact of environmental covariates on tea suitability and provide insights to prepare a suitability map of tea distribution in Sri Lanka. The suitability maps for tea can be used to identify more productive regions to expand tea lands and also the limiting factors, if any. Understanding the roles of climatic and topographic covariates is vital for decision-makers in the tea sector, since a clear understanding can help in diagnosing problems and finding solutions efficiently to ensure the sustainability of tea cultivation. However, further research is suggested on the relationship between environmental variables including soil factors and the distribution of tea cultivation. In addition, the tea growing area is considered to be determined not only by natural environmental factors, including climate and topography, but also by socio-economic and cultural factors. Therefore, it is crucial to incorporate these factors in analyses from further research efforts.

Author Contributions

All authors have read and agreed to the published version of the manuscript. Conceptualization, L.K. and S.L.J.; methodology, S.L.J. and L.K.; software, L.K., S.L.J. and M.K.H.; validation, L.K., S.L.J. and M.K.H.; formal analysis, S.L.J. and M.K.H.; investigation, L.K. and S.L.J.; resources, L.K., S.L.J. and M.K.H.; data curation, L.K., S.L.J. and M.K.H.; writing—original draft preparation, S.L.J.; writing—review and editing, L.K., S.L.J. and M.K.H.; visualization, L.K., S.L.J. and M.K.H.; supervision, L.K.; project administration, L.K.; proof-reading, L.K., S.L.J. and M.K.H.

Funding

This research received no external funding.

Acknowledgments

This research was supported by a postgraduate scholarship provided by the University of New England to the first author.

Conflicts of Interest

The authors declare no conflict of interest.

References

  1. Mukhopadhyay, M.; Mondal, T.K. Cultivation, improvement, and environmental impacts of tea. In Oxford Research Encyclopedia of Environmental Science; Oxford University Press: Oxford, UK, 2017. [Google Scholar]
  2. Gunathilaka, R.D.; Smart, J.C.; Fleming, C.M. The impact of changing climate on perennial crops: The case of tea production in Sri Lanka. Clim. Chang. 2017, 140, 577–592. [Google Scholar] [CrossRef]
  3. Faostat–Food and Agriculture Organization of the United Nations Statistics Division. Economic and Social Development Department, Rome, Italy. Available online: http://faostat3.fao.org/home/E (accessed on 31 December 2016).
  4. Esham, M.; Garforth, C. Climate change and agricultural adaptation in Sri Lanka: A review. Clim. Dev. 2013, 5, 66–76. [Google Scholar] [CrossRef]
  5. Jahfer, A.; Inoue, T. Financial development, foreign direct investment and economic growth in Sri Lanka. Int. J. Econ. Policy Emerg. Econ. 2014, 7, 77–93. [Google Scholar] [CrossRef]
  6. Hicks, A. Current status and future development of global tea production and tea products. Au Jt 2009, 12, 251–264. [Google Scholar]
  7. Wijeratne, M. Vulnerability of Sri Lanka tea production to global climate change. Water Air Soil Pollut. 1996, 92, 87–94. [Google Scholar]
  8. Boehm, R.; Cash, S.; Anderson, B.; Ahmed, S.; Griffin, T.; Robbat, A.; Stepp, J.; Han, W.; Hazel, M.; Orians, C. Association between empirically estimated monsoon dynamics and other weather factors and historical tea yields in China: Results from a yield response model. Climate 2016, 4, 20. [Google Scholar] [CrossRef] [Green Version]
  9. Chang, K. World tea production and trade: Current and future development. In Food and Agriculture Organization of The United Nations; Market and Policy Analyses of Raw Materials, Horticulture and Tropical (RAMHOT) Products Team: Rome, Italy, 2015. [Google Scholar]
  10. Brown, A.L.; Lane, J.; Coverly, J.; Stocks, J.; Jackson, S.; Stephen, A.; Bluck, L.; Coward, A.; Hendrickx, H. Effects of dietary supplementation with the green tea polyphenol epigallocatechin-3-gallate on insulin resistance and associated metabolic risk factors: Randomized controlled trial. Br. J. Nutr. 2008, 101, 886–894. [Google Scholar] [CrossRef]
  11. Pelizzaro-Rocha, K.J.; Veiga-Santos, P.; Lazarin-Bidóia, D.; Ueda-Nakamura, T.; Dias Filho, B.P.; Ximenes, V.F.; Silva, S.O.; Nakamura, C.V. Trypanocidal action of eupomatenoid-5 is related to mitochondrion dysfunction and oxidative damage in Trypanosoma cruzi. Microbes Infect. 2011, 13, 1018–1024. [Google Scholar] [CrossRef] [Green Version]
  12. Willson, K. Coffee, Cocoa and Tea; CAB International School of Biological Sciences: Wallingford, UK, 1999. [Google Scholar]
  13. Jayasinghe, H.; Suriyagoda, L.; Karunarathne, A.; Wijeratna, M. Modelling shoot growth and yield of Ceylon tea cultivar TRI-2025 (Camellia sinensis (L.) O. Kuntze). J. Agric. Sci. 2018, 156, 200–214. [Google Scholar] [CrossRef]
  14. Mohotti, A. Shade in Tea. is it beneficial? Tea Sci. 2004, 69, 27–39. [Google Scholar]
  15. Carr, M.K.V.; Stephens, W. Climate, weather and the yield of tea. In Tea; Springer: Dordrecht, Germany, 1992; pp. 87–135. [Google Scholar]
  16. Lemmesa, F. Tea production and management. In Teaching Handout; Department of Plant Sciences, Jimma College of Agriculture: Jimma, Ethiopia, 1996; pp. 1–14. [Google Scholar]
  17. Burnett, B.N.; Meyer, G.A.; McFadden, L.D. Aspect-related microclimatic influences on slope forms and processes, northeastern Arizona. J. Geophys. Res. Earth Surf. 2008, 113. [Google Scholar] [CrossRef] [Green Version]
  18. Owuor, P.O.; Obaga, S.O.; Othieno, C.O. The effects of altitude on the chemical composition of black tea. J. Sci. Food Agric. 1990, 50, 9–17. [Google Scholar] [CrossRef]
  19. Jayasinghe, H.; Kumar, L.; Sandamali, J. Assessment of Potential Land Suitability for Tea (Camellia sinensis (L.) O. Kuntze) in Sri Lanka Using a GIS-Based Multi-Criteria Approach. Agriculture 2019, 9, 148. [Google Scholar] [CrossRef] [Green Version]
  20. Ali, M.; Islam, M.; Saha, N.; Kanan, A.H. Effects of Microclimatic Parameters on Tea Leaf Production in Different Tea Estates in Bangladesh. World J. Agric. Sci. 2014, 10, 134–140. [Google Scholar] [CrossRef] [Green Version]
  21. Amarasinghe, U.A.; Mutuwatta, L.; Sakthivadivel, R. Water Scarcity Variations Within a Country: A Case Study of Sri Lanka; IWMI: Colombo, Sri Lanka, 1999; Volume 32. [Google Scholar]
  22. Jayasinghe, S.L.; Kumar, L. Modeling the climate suitability of tea [Camellia sinensis (L.) O. Kuntze] in Sri Lanka in response to current and future climate change scenarios. Agric. For. Meteorol. 2019, 272, 102–117. [Google Scholar] [CrossRef]
  23. Mathenge, P.M. Factors Influencing Sustainability of Small Tea Enterprises In Kenya and Suggested Strategies. Ph.D. Thesis, Dedan Kimathi University of Technology, Nyeri, Kenya, 2015. [Google Scholar]
  24. Lynch, M. Evolution and extinction in response to environ mental change. Biot. Interact. Glob. Chang. 1993, 49, 234–250. [Google Scholar]
  25. Onduru, D.; De Jager, A.; Hiller, S.; Van den Bosch, R. Sustainability of smallholder tea production in developing countries: Learning experiences from farmer field schools in Kenya. Int. J. Dev. Sust. 2012, 1, 714–742. [Google Scholar]
  26. Bandara, S.N. Agronomy of irrigated tea in low elevation growing areas of Sri Lanka. Ph.D. Thesis, The University of Adelaide, Adelaide, Australia, 2012. [Google Scholar]
  27. Rajapaksha, D.; Waduge, V.; Padilla-Alvarez, R.; Kalpage, M.; Rathnayake, R.; Migliori, A.; Frew, R.; Abeysinghe, S.; Abrahim, A.; Amarakoon, T. XRF to support food traceability studies: Classification of Sri Lankan tea based on their region of origin. X-Ray Spectrom. 2017, 46, 220–224. [Google Scholar] [CrossRef]
  28. Odum, W.E. Pathways of Energy Flow in a South Florida Estuary; University Miami Sea Grant Technical Bulletin; University of Miami: Miami, FL, USA, 1971; Volume 7, p. 162. [Google Scholar]
  29. Kumar, L.; Skidmore, A.K.; Knowles, E. Modelling topographic variation in solar radiation in a GIS environment. Int. J. Geogr. Inf. Sci. 1997, 11, 475–497. [Google Scholar] [CrossRef]
  30. Envionmental Growth Chambers. Lighting Radiation Conversion. Available online: http://www.egc.com/useful_info_lighting.php (accessed on 20 June 2019).
  31. Monteith, J.; Unsworth, M. Principles of Environmental Physics; Edward Arnold: London, UK, 1990. [Google Scholar]
  32. Campbell, G.S.; Norman, J.M. Radiation fluxes in natural environments. In An Introduction to Environmental Biophysics; Springer: Berlin, Germany, 1998; pp. 167–184. [Google Scholar]
  33. WorldClim-Global Climate Data–Registry of Research Data Repositories. Available online: http://re3data.org/repository/r3d100011791 (accessed on 27 February 2020).
  34. Rosenzweig, M.L. Species Diversity in Space and Time; Cambridge University Press: Cambridge, UK, 1995. [Google Scholar]
  35. Hijmans, R.; Cameron, S.; Parra, J.; Jones, P.; Jarvis, A.; Richardson, K. WorldClim, Version 1.3.; University of California: Berkeley, CA, USA, 2005. [Google Scholar]
  36. Global Multi-resolution Terrain Elevation Data (GMTED2010). Available online: https://www.usgs.gov/centers/eros/science/usgs-eros-archive-digital-elevation-global-multi-resolution-terrain-elevation?qt-science_center_objects=0#qt-science_center_objects (accessed on 15 December 2019).
  37. Wickham, H. The Tidyverse. R Package Version 1.2.1. 2017. Available online: https://CRAN.R-project.org/package=tidyverse (accessed on 15 September 2019).
  38. R Core Team. R: A Language and Environment for Statistical Computing, version 3.3.1.; R Foundation for Statistical Computing: Vienna, Austria, 2016. [Google Scholar]
  39. Zwick, R. Pairwise comparison procedures for one-way analysis of variance designs. In A Handbook for Data Analysis in the Behavioral Sciences: Statistical Issues; Lawrence Erlbaum Associates: New Jersey, NJ, USA, 1993; pp. 43–71. [Google Scholar]
  40. Smith, B.G.; Stephens, W.; Burgess, P.J.; Carr, M. Effects of light, temperature, irrigation and fertilizer on photosynthetic rate in tea (Camellia sinensis). Exp. Agric. 1993, 29, 291–306. [Google Scholar] [CrossRef]
  41. Baker, N.R.; Bowyer, J.R. Photoinhibition of Photosynthesis: From Molecular Mechanisms to the Field; Bios Scientific Publishers: Amsterdam, The Netherlands, 1994. [Google Scholar]
  42. Renné, D.; George, R.; Marion, B.; Heimiller, D.; Gueymard, C. Solar Resource Assessment for Sri Lanka and Maldives; National Renewable Energy Lab. (NREL): Golden, CO, USA, 2003. [Google Scholar]
  43. Komaki, S.; Matsuo, K.; Hirose, D.; Tatsumi, J. Analysis of canopy photosynthesis in mature tea (Camellia sinensis L.) bush at late autumn. Jap. J. Crop Sci. 1995, 64, 310–316. [Google Scholar]
  44. Punyawardena, B.; Kulasiri, D. Stochastic Simulation of Solar Radiation from Sunshine Duration in Sri Lanka; Centre for Computing and Biometrics: Canterbury, New Zealand, 1996. [Google Scholar]
  45. Nijamdeen, A.; Zubair, L.; Dharmadasa, M.; Najimuddin, N.; Malge, C. Seasonal impact of climate on tea production in Sri Lanka. In National Science and Technology Commission, Centre for Science and Technology of the Non-Aligned and Other Developing Countries (NAM S&T Centre), Tropical Climate; Mahaweli Authority: Rajawella, Sri Lanka, 2017. [Google Scholar]
  46. Squire, G.R. Seasonal changes in photosynthesis of tea (Camellia sinensis L.). J. Appl. Ecol. 1977, 14, 303–316. [Google Scholar] [CrossRef]
  47. De Costa, W.A.; Mohotti, A.J.; Wijeratne, M.A. Ecophysiology of tea. Braz. J. Plant Physiol. 2007, 19, 299–332. [Google Scholar] [CrossRef]
  48. Galmés, J.; Medrano, H.; Flexas, J. Photosynthetic limitations in response to water stress and recovery in Mediterranean plants with different growth forms. N. Phytol. 2007, 175, 81–93. [Google Scholar] [CrossRef] [PubMed]
  49. TRI. Advisory Circulars. In Guidelines on Land Suitability Classification for Tea; Tea Research Institute of Sri Lanka: Talawakelle, Sri Lanka, 2002; pp. 1–3. [Google Scholar]
  50. DOM. Climate of Sri Lanka. Available online: http://www.meteo.gov.lk/index.php?option=com_content&view=article&id=94&Itemid=310&lang=en (accessed on 10 November 2019).
  51. Wijeratne, M.; Anandacoomaraswamy, A.; Amarathunga, M.; Ratnasiri, J.; Basnayake, B.; Kalra, N. Assessment of impact of climate change on productivity of tea (Camellia sinensis L.) plantations in Sri Lanka. J. Natl. Sci. Found. Sri Lanka 2007, 35, 119–126. [Google Scholar] [CrossRef] [Green Version]
  52. Ahmed, S.; Orians, C.M.; Griffin, T.S.; Buckley, S.; Unachukwu, U.; Stratton, A.E.; Kennelly, E.J. Effects of water availability and pest pressures on tea (Camellia sinensis) growth and functional quality. AOB Plants 2014, 6, 1–9. [Google Scholar] [CrossRef] [Green Version]
  53. Watson, M. Climatic Requirements and Soil; Tea Research Institute of Sri Lanka: Talawakelle, Sri Lanka, 2008. [Google Scholar]
  54. Abeysinghe, S.B. 228th Experiments & Extension Forum Keynote Address; Tea Research Institute of Sri Lanka: Talawakelle, Sri Lanka, 2014. [Google Scholar]
  55. Khormali, F.; Ayoubi, S.; Kananro Foomani, F.; Fatemi, A. Tea yield and soil properties as affected by slope position and aspect in Lahijan area, Iran. Int. J. Plant Prod. 2012, 1, 99–111. [Google Scholar]
  56. Charizopoulos, N.; Psilovikos, A. Geomorphological analysis of Scopia catchment (Central Greece), using DEM data and GIS. Fresen Environ. Bull 2015, 24, 3973–3983. [Google Scholar]
  57. Kumar, L.; Skidmore, A.K. Radiation-vegetation relationships in a Eucalyptus forest. Photogramm. Eng. Remote Sens. 2000, 66, 193–204. [Google Scholar]
  58. Barbour, M.; Burk, J.; Pitts, W.; Gilliam, F.; Schwart, M. Terrestrial Plant Ecology, 3rd ed.Benjamin Cummings: Menlo Park, CA, USA, 1999. [Google Scholar]
  59. Covey, A. Effects of Elevation on Tea Quality; Red Blossom Tea Company: San Francisco, CA, USA, 2017; Available online: https://redblossomtea.com/blogs/red-blossom-blog/effects-of-elevation-on-tea-quality (accessed on 2 March 2020).
  60. UTRF. Soil and Nutrition. Available online: http://www.upasitearesearch.org/ (accessed on 20 October 2019).
  61. Gahlod, N.; Binjola, S.; Ravi, R.; Arya, V. Land-site suitability evaluation for tea, cardamom and rubber using Geo-spatial technology in Wayanad district, Kerala. J. Appl. Nat. Sci. 2017, 9, 1440–1447. [Google Scholar] [CrossRef] [Green Version]
  62. Li, S.; Li, H.; Yang, C.; Wang, Y.; Xue, H.; Niu, Y. Rates of soil acidification in tea plantations and possible causes. Agric. Ecosyst. Environ. 2016, 233, 60–66. [Google Scholar] [CrossRef]
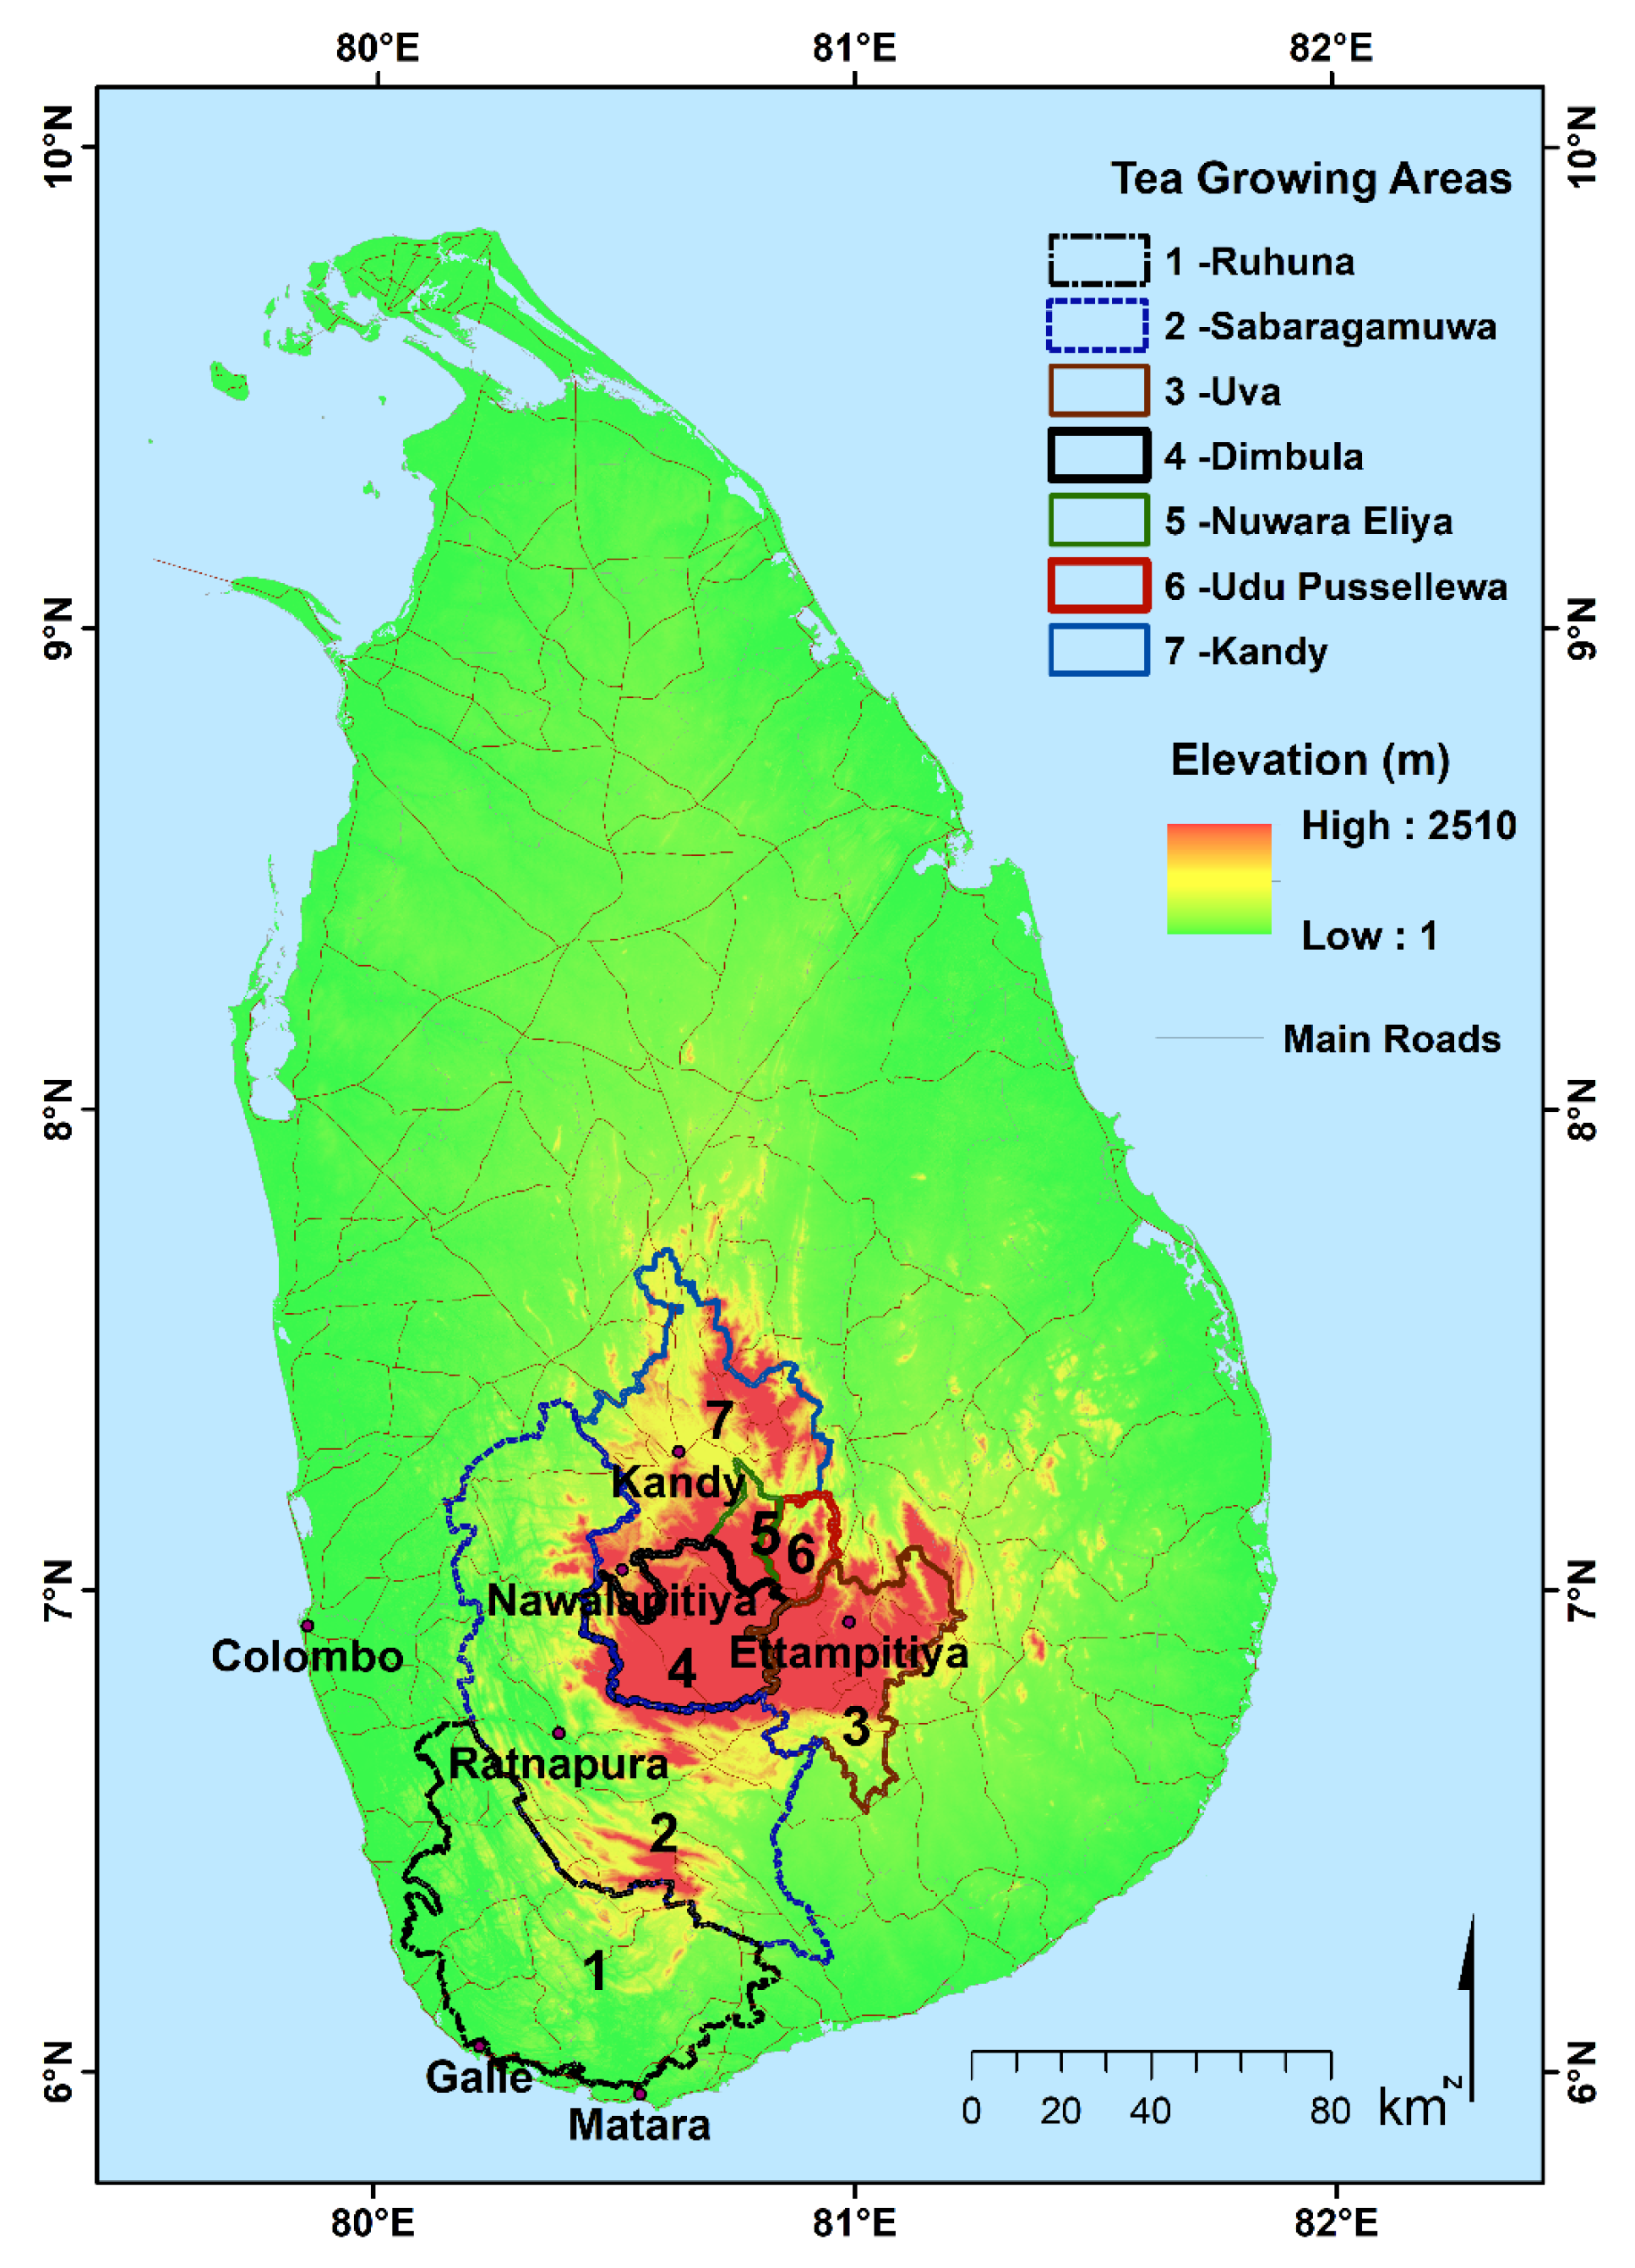
Figure 1. Major tea growing areas in Sri Lanka.
Agronomy 10 00476 g001
Figure 2. The main stages of the spatial analysis model.
Agronomy 10 00476 g002
Figure 3. Aspect-wise solar radiations for tea and non-tea growing areas.
Agronomy 10 00476 g003
Figure 4. Interaction between the seasonal and solar radiation and county-levels in tea and non-tea growing areas. Interactions of seasons, solar radiation, and county-levels in tea and non-tea growing areas. The error bars show one standard deviation. The letters “a” to “o” show solar radiation in decreasing order. Groups having the same letter are not significantly different at a 5% level of probability.
Agronomy 10 00476 g004
Figure 5. Interaction between country levels and different covariates (a. elevation, b. slope, c. rainfall and d. temperature) in tea and non-tea growing areas.
Agronomy 10 00476 g005
Figure 6. Marginal effect of each standardized covariate on tea cultivation.
Agronomy 10 00476 g006
Table 1. Information on the data source and data structure.
Environmental CovariatesUnitData SourceStructure of Data
Solar radiationMJ m−2 day−1A clear-sky solar radiation model [29]Numerical continuous
Temperature°CWorldClim-Global Climate DataNumerical continuous
RainfallMmNumerical continuous
ElevationMGlobal multi-resolution terrain elevation dataNumerical continuous
Slope°Numerical continuous
AspectUnit lessCategorical nominal
Table 2. Number of random observations in each category.
Country Level (Based on Elevation)Non-Tea Growing AreasTea Growing Areas
Low-country (<600 m a.s.l)3197914
Mid-country (600–1200 m a.s.l)3200872
Up-country (>1200 m a.s.l)2099727
Total84962513
Table 3. Comparative statistics of covariates of tea cultivation.
CovariatesAreasMinMaxMeanSDt-Statistics
Total solar radiation (MJ m−2 day−1)Tea growing17.0525.5124.511.003.90 ***
Non-tea growing16.4125.5224.601.05
Summer solar radiation (MJ m−2 day−1)Tea growing13.7727.5425.271.732.60 **
Non-tea growing9.7027.5425.371.77
Autumn solar radiation (MJ m−2 day−1)Tea growing13.5926.5824.311.712.33 *
Non-tea growing12.6826.6024.391.61
Winter solar radiation (MJ m−2 day−1)Tea growing8.9727.5122.582.591.35
Non-tea growing7.7927.5522.652.39
Spring solar radiation (MJ m−2 day−1)Tea growing15.3227.4725.791.463.04 **
Non-tea growing11.3027.4825.891.53
Elevation (m) Tea growing12289651.1514.1−7.00 ***
Non-tea growing32341572.6487.7
Slope (°) Tea growing0.1643.8512.037.63−9.23 ***
Non-tea growing0.0056.3010.278.62
Mean temperature (°C)Tea growing14.127.323.422.878.41 ***
Non-tea growing13.728.123.962.87
Annual rainfall (mm) Tea growing154448292795624.9−29.19 ***
Non-tea growing102048082291796.2
*, ** and, *** denote a significance at the 0.05, 0.01, and 0.001 level of probability, respectively.
Table 4. Results of the logistical regression.
CovariatesRegression CoefficientsStandard ErrorOdds Ratios
(Intercept)−0.9072.0210.404
Total Solar Radiation (MJ m−2 day−1)0.374 ***0.0581.453
Elevation (m)−0.002 ***0.0000.998
Slope (°)0.038 ***0.0071.039
Mean Temperature (°C)−0.448 ***0.0600.639
Annual Rainfall (mm)0.001 ***0.0001.000
North-east−0.281 **0.0950.755
East−0.415 ***0.1070.660
South-east−0.530 ***0.1170.589
South−0.377 ***0.1140.686
South-west−0.1210.1040.886
West−0.0530.0960.949
North-west−0.0690.0950.933
** and *** denote a significance at the 0.01 and 0.001 level of probability, respectively.