Gene Expression and Metabolite Profiling of Thirteen Nigerian Cassava Landraces to Elucidate Starch and Carotenoid Composition

 ,
,  , and
, and
Abstract
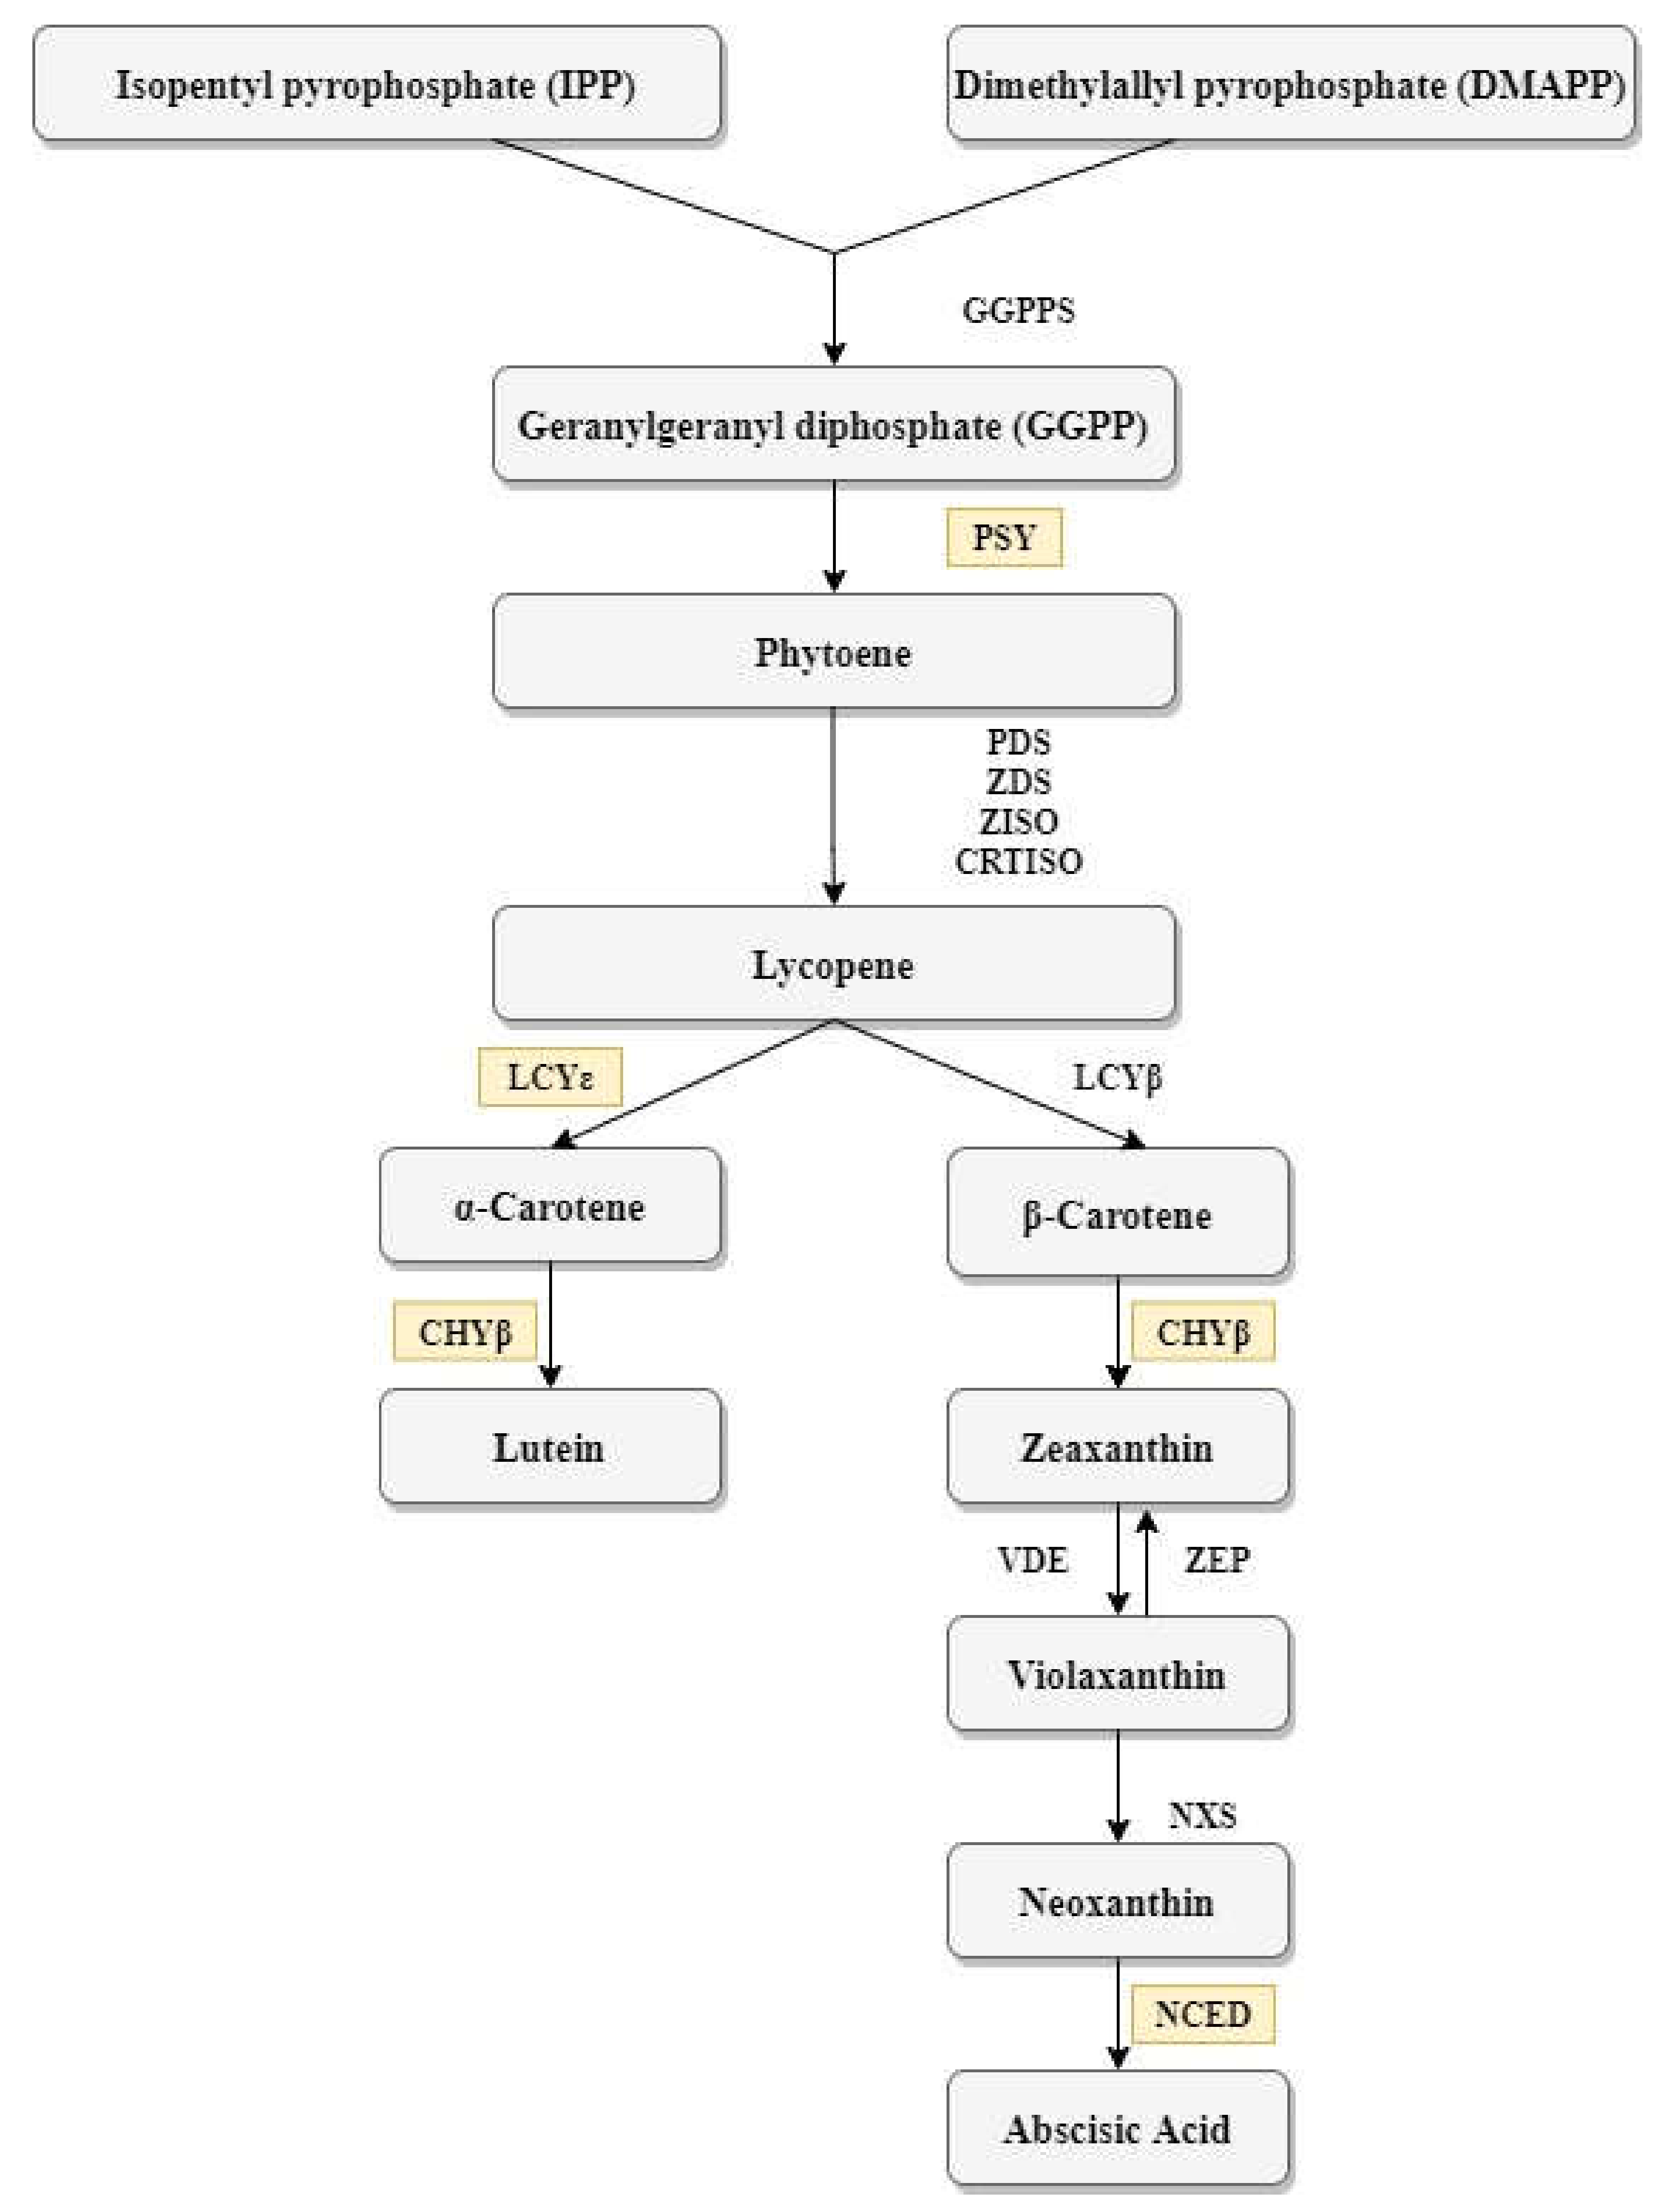
1. Introduction
2. Materials and Methods
2.1. Plant Material
2.2. Field Trial and Layout
2.3. Sample Collection for Gene Expression and Metabolite Analyses
2.4. Agronomic Data and Dry Matter Content (DMC)
2.5. Metabolite Analysis
2.6. DNA and RNA Extraction and Amplification
2.7. Primer Design and RT–qPCR Conditions
2.8. Statistical Analysis
3. Results
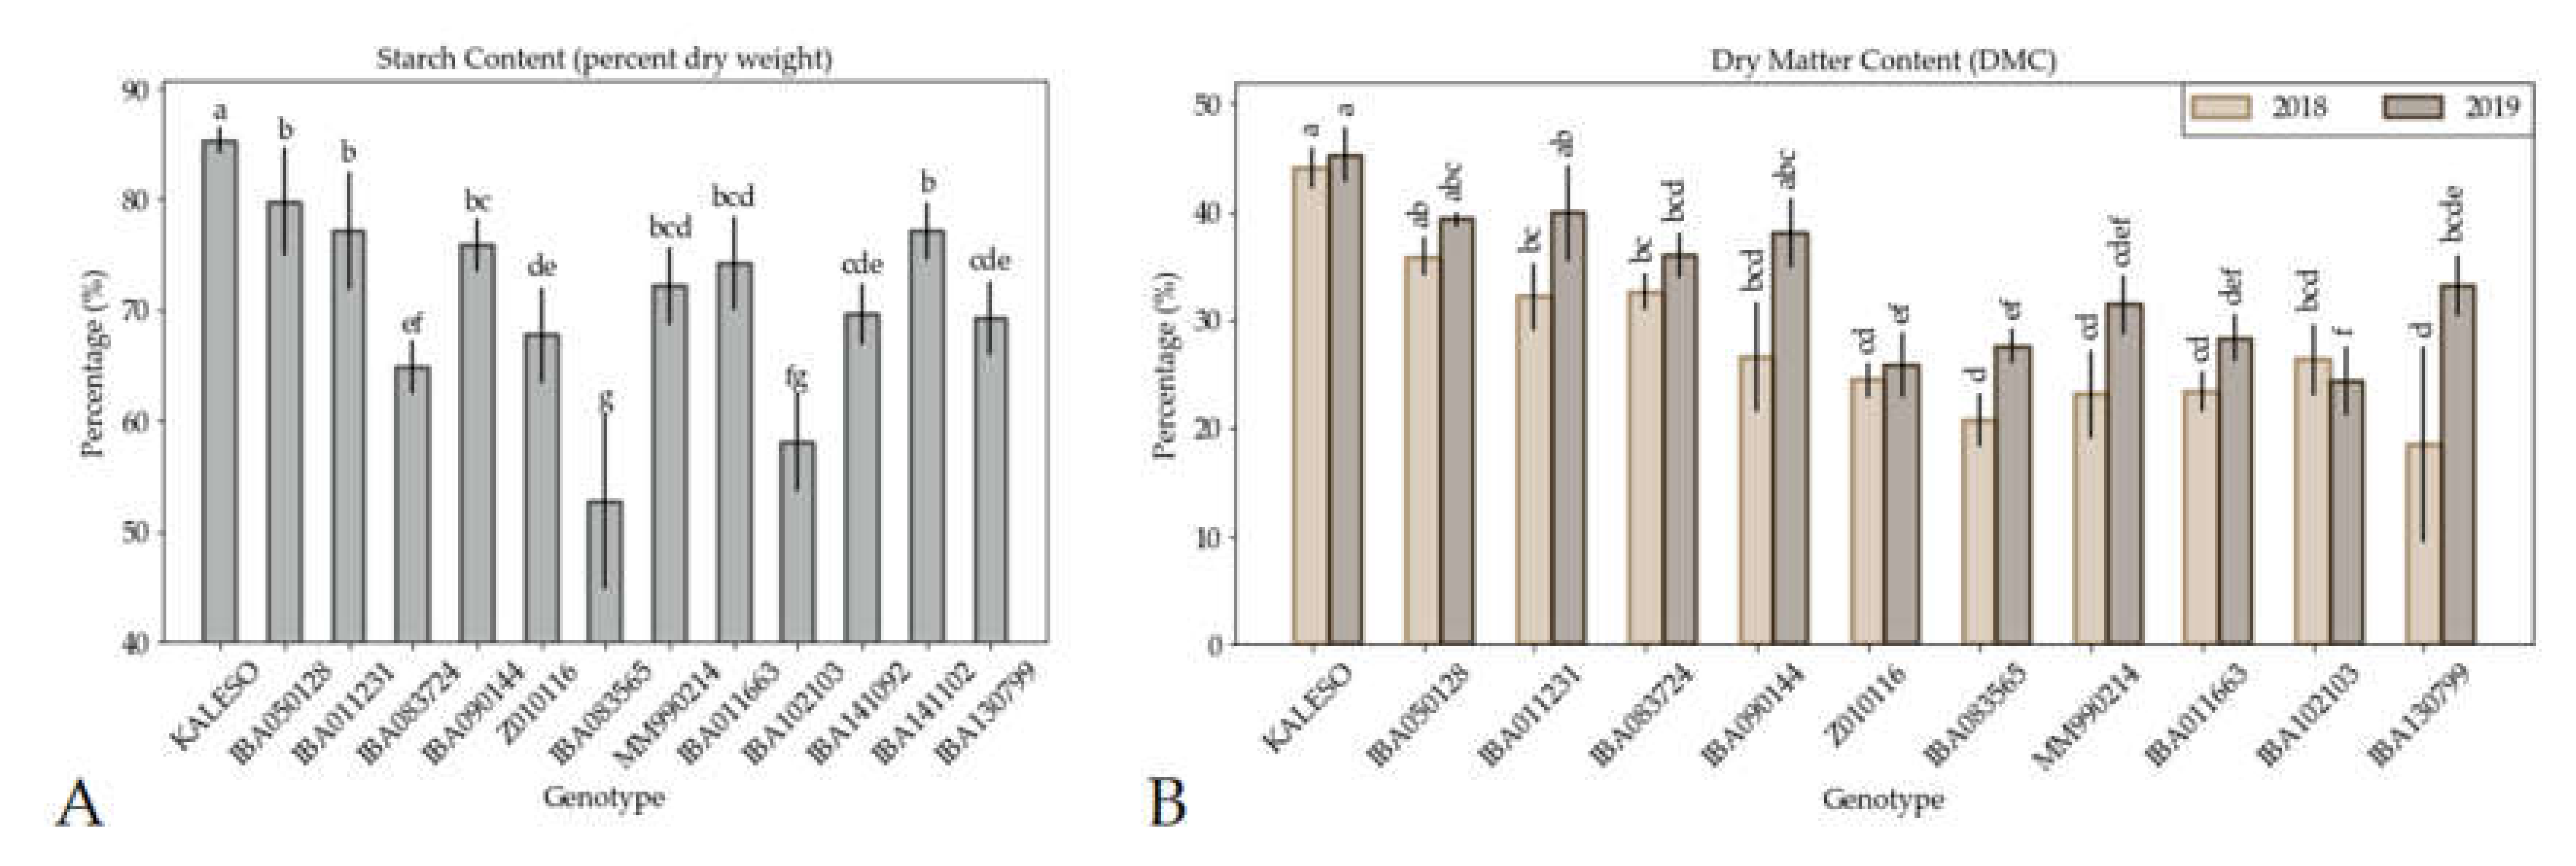
3.1. Starch, Dry Matter Content and Agronomic Data
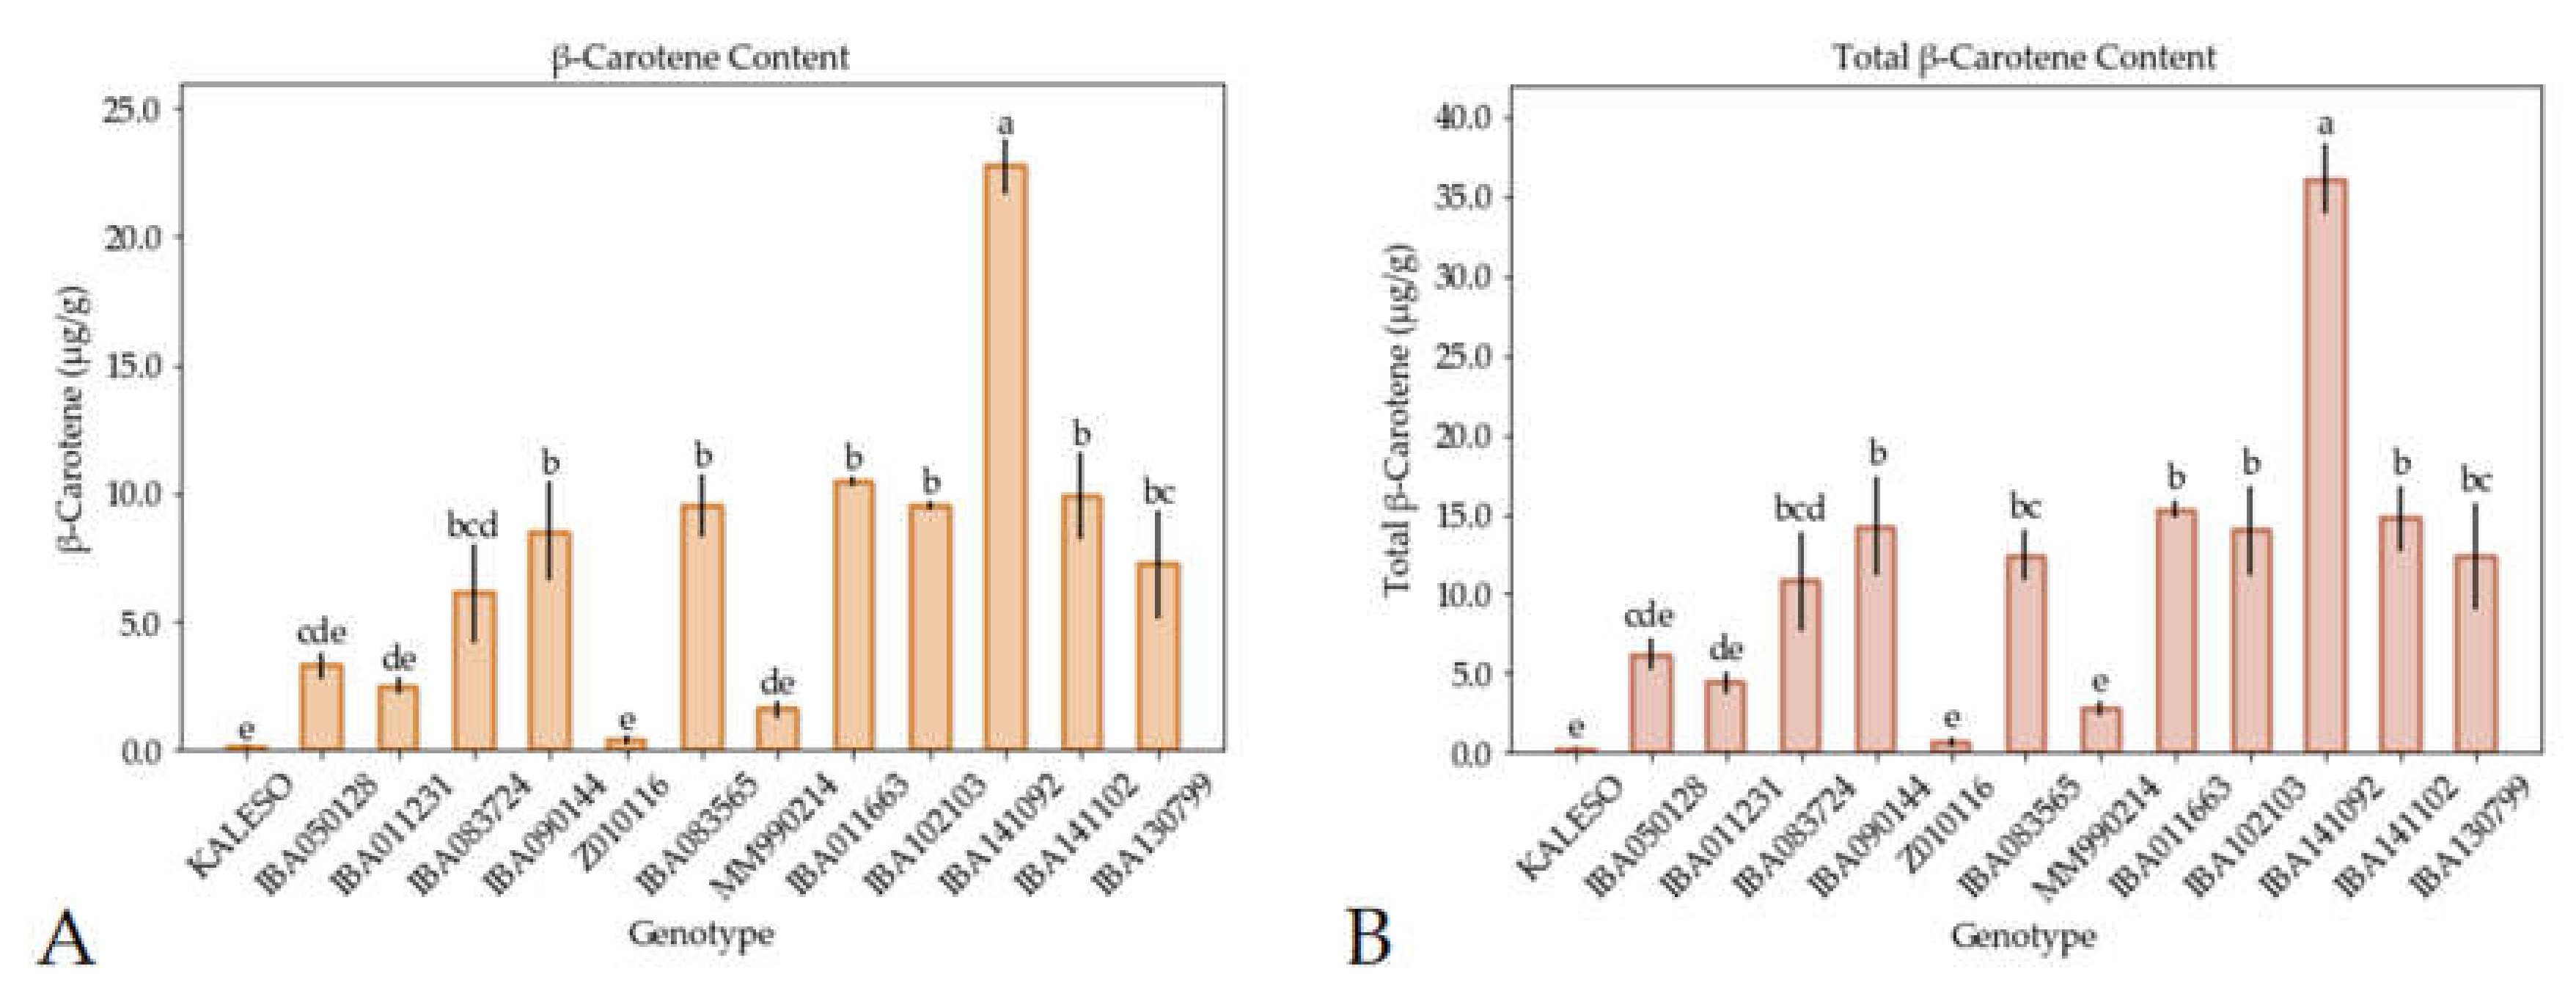
3.2. Carotenoid Measurement by UHPLC–DAD–ToF–MS and iCheck Carotene
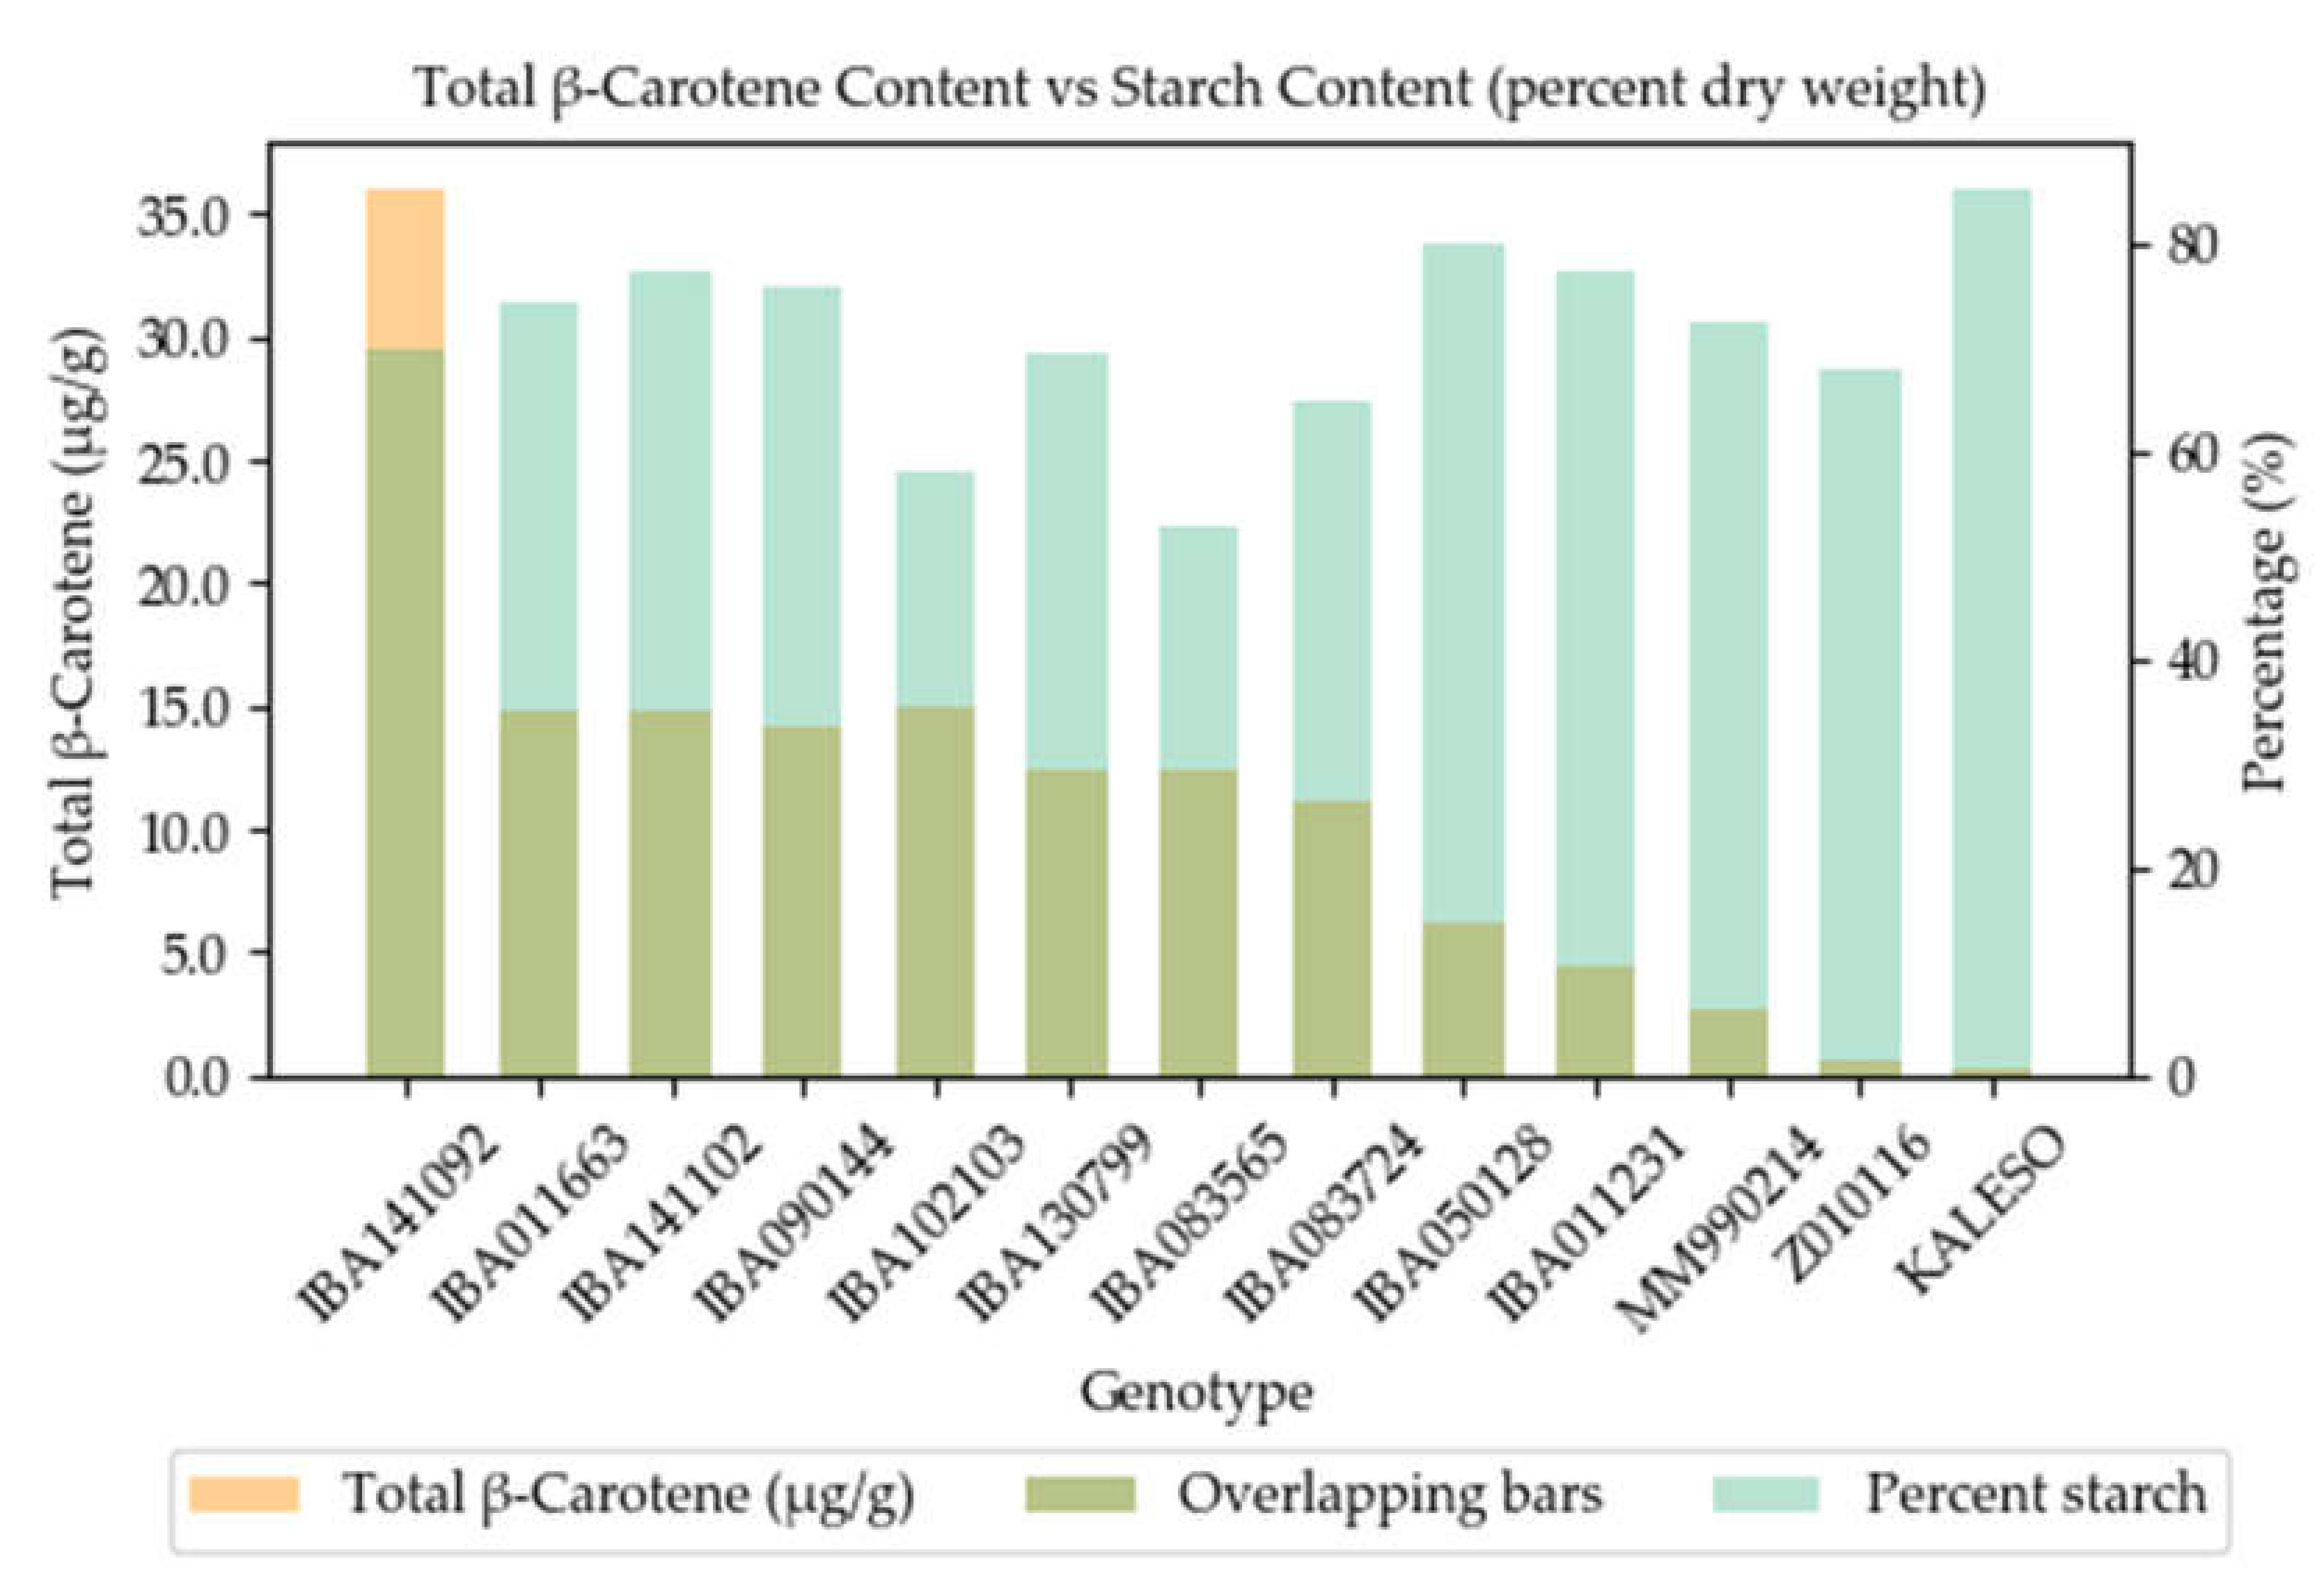
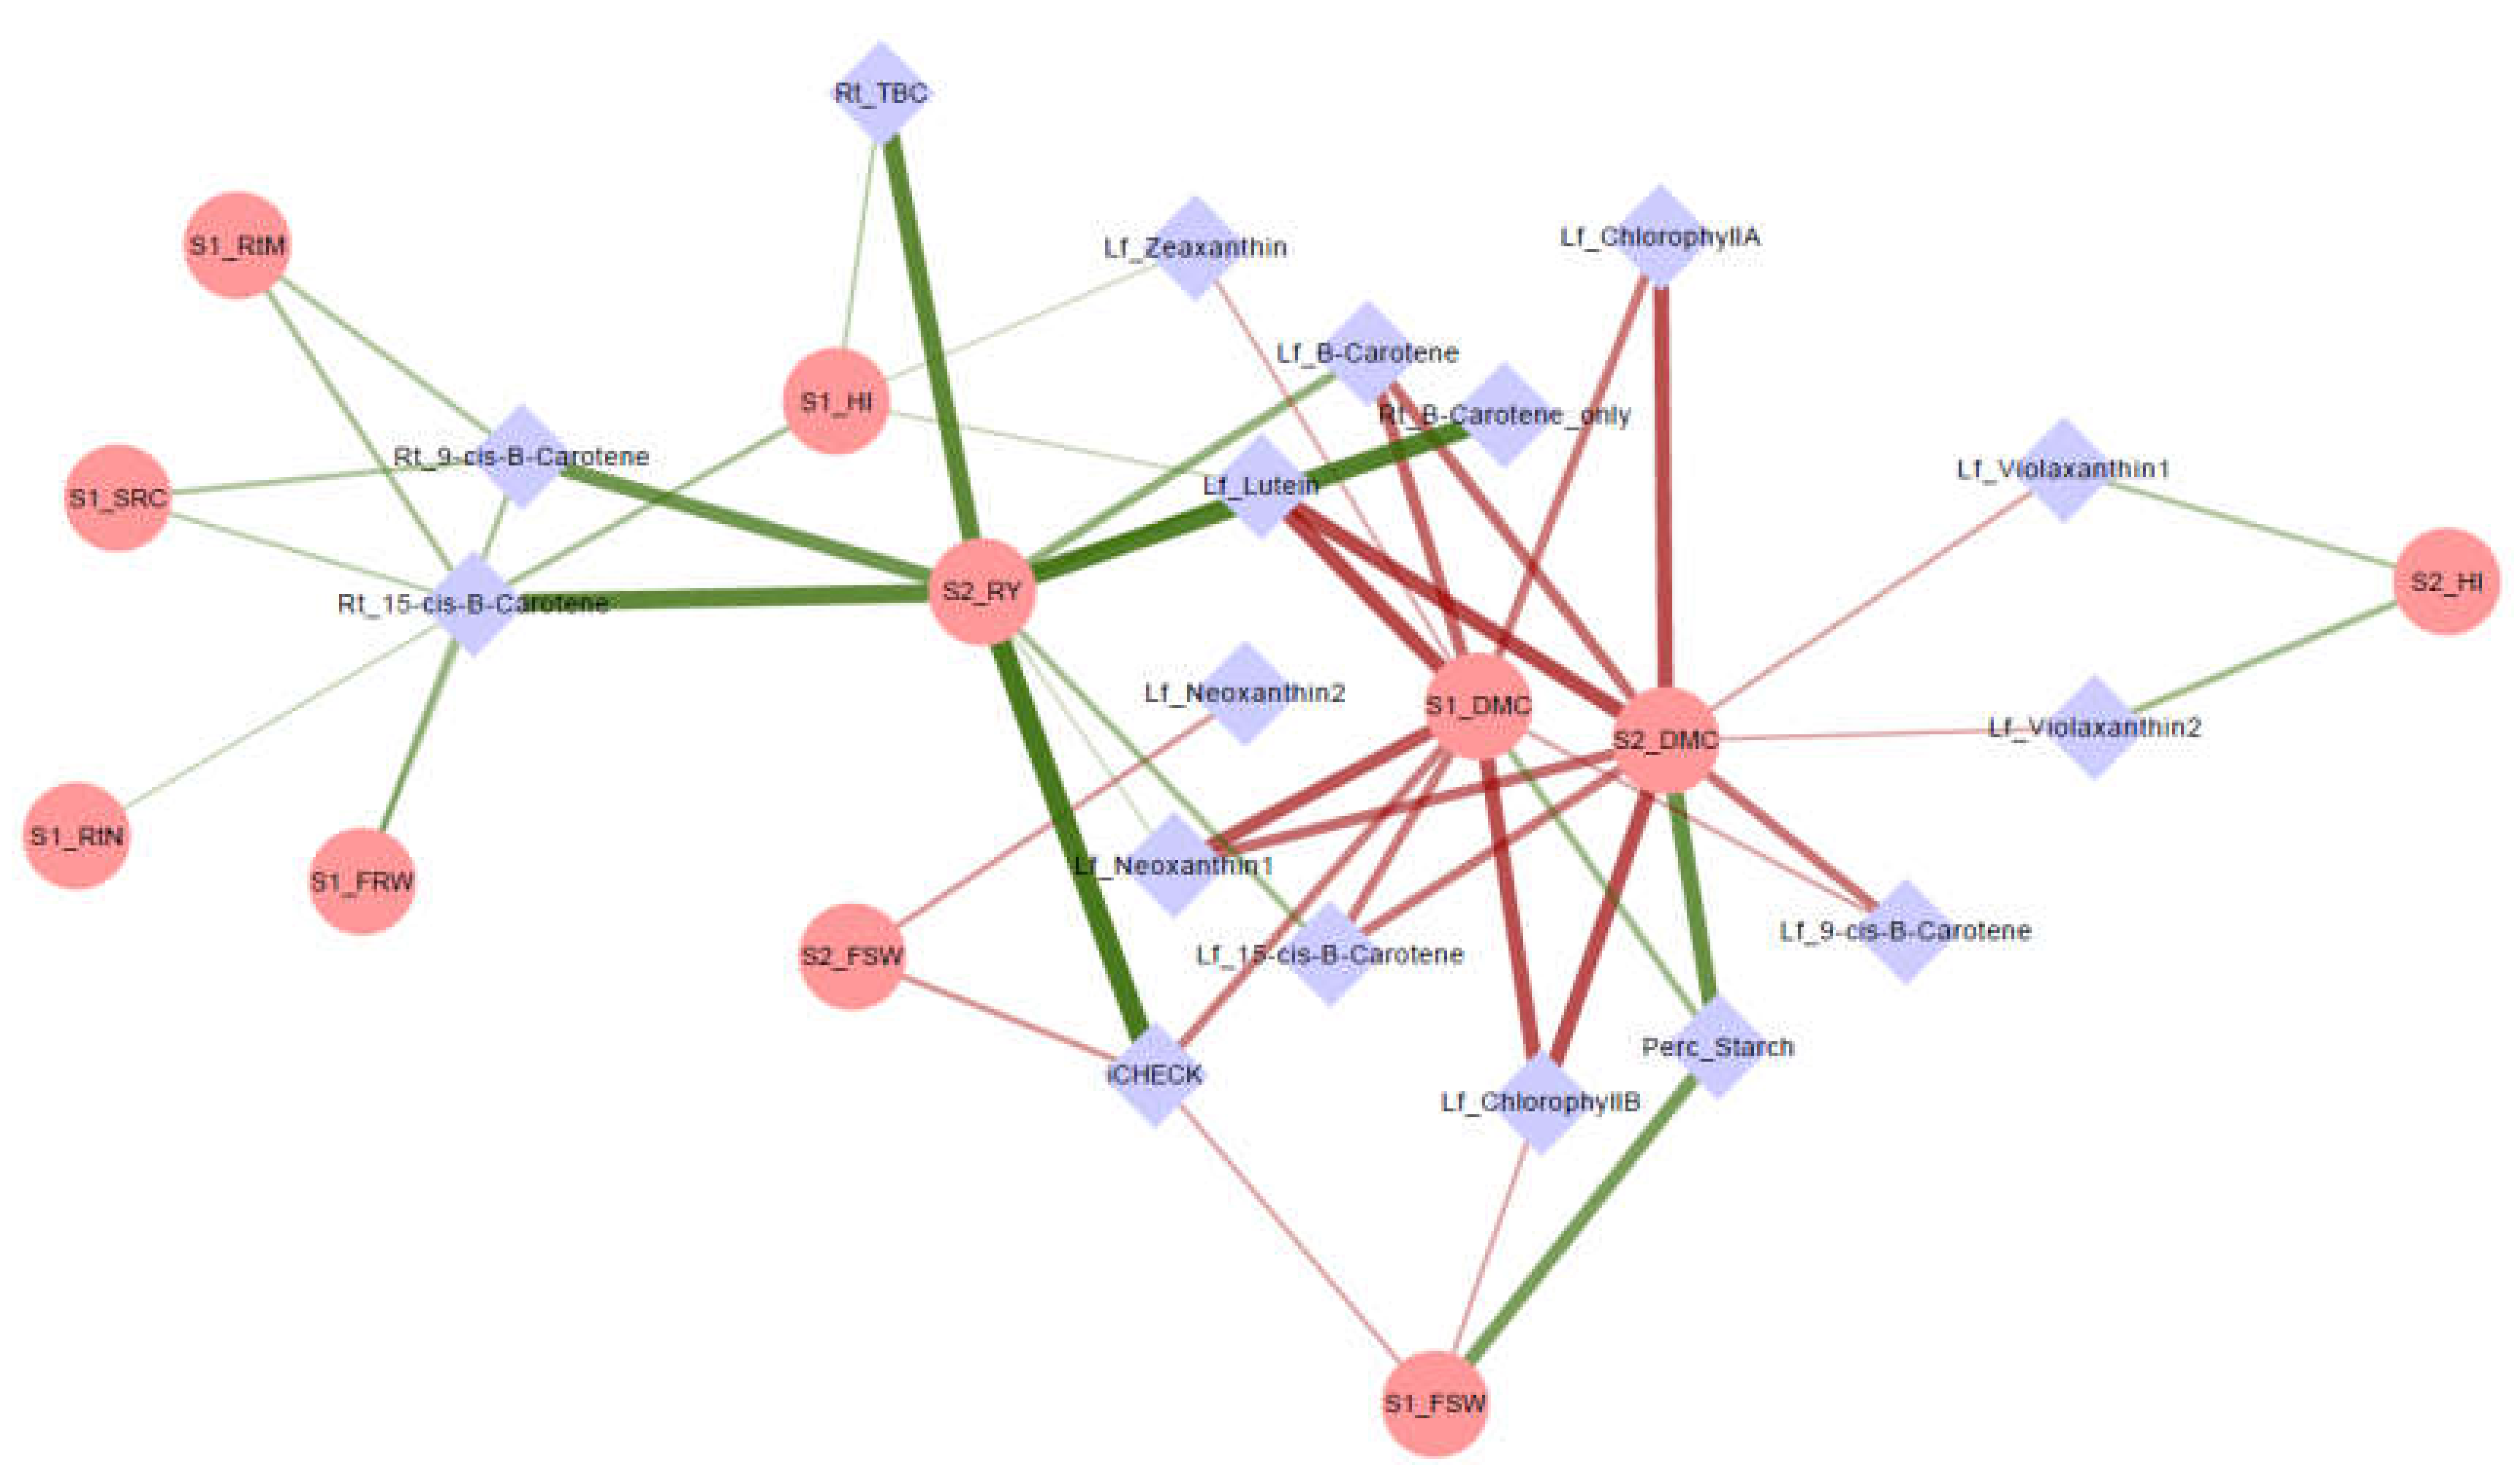
3.3. Network Analysis and Correlations of Agronomic and Metabolite Data
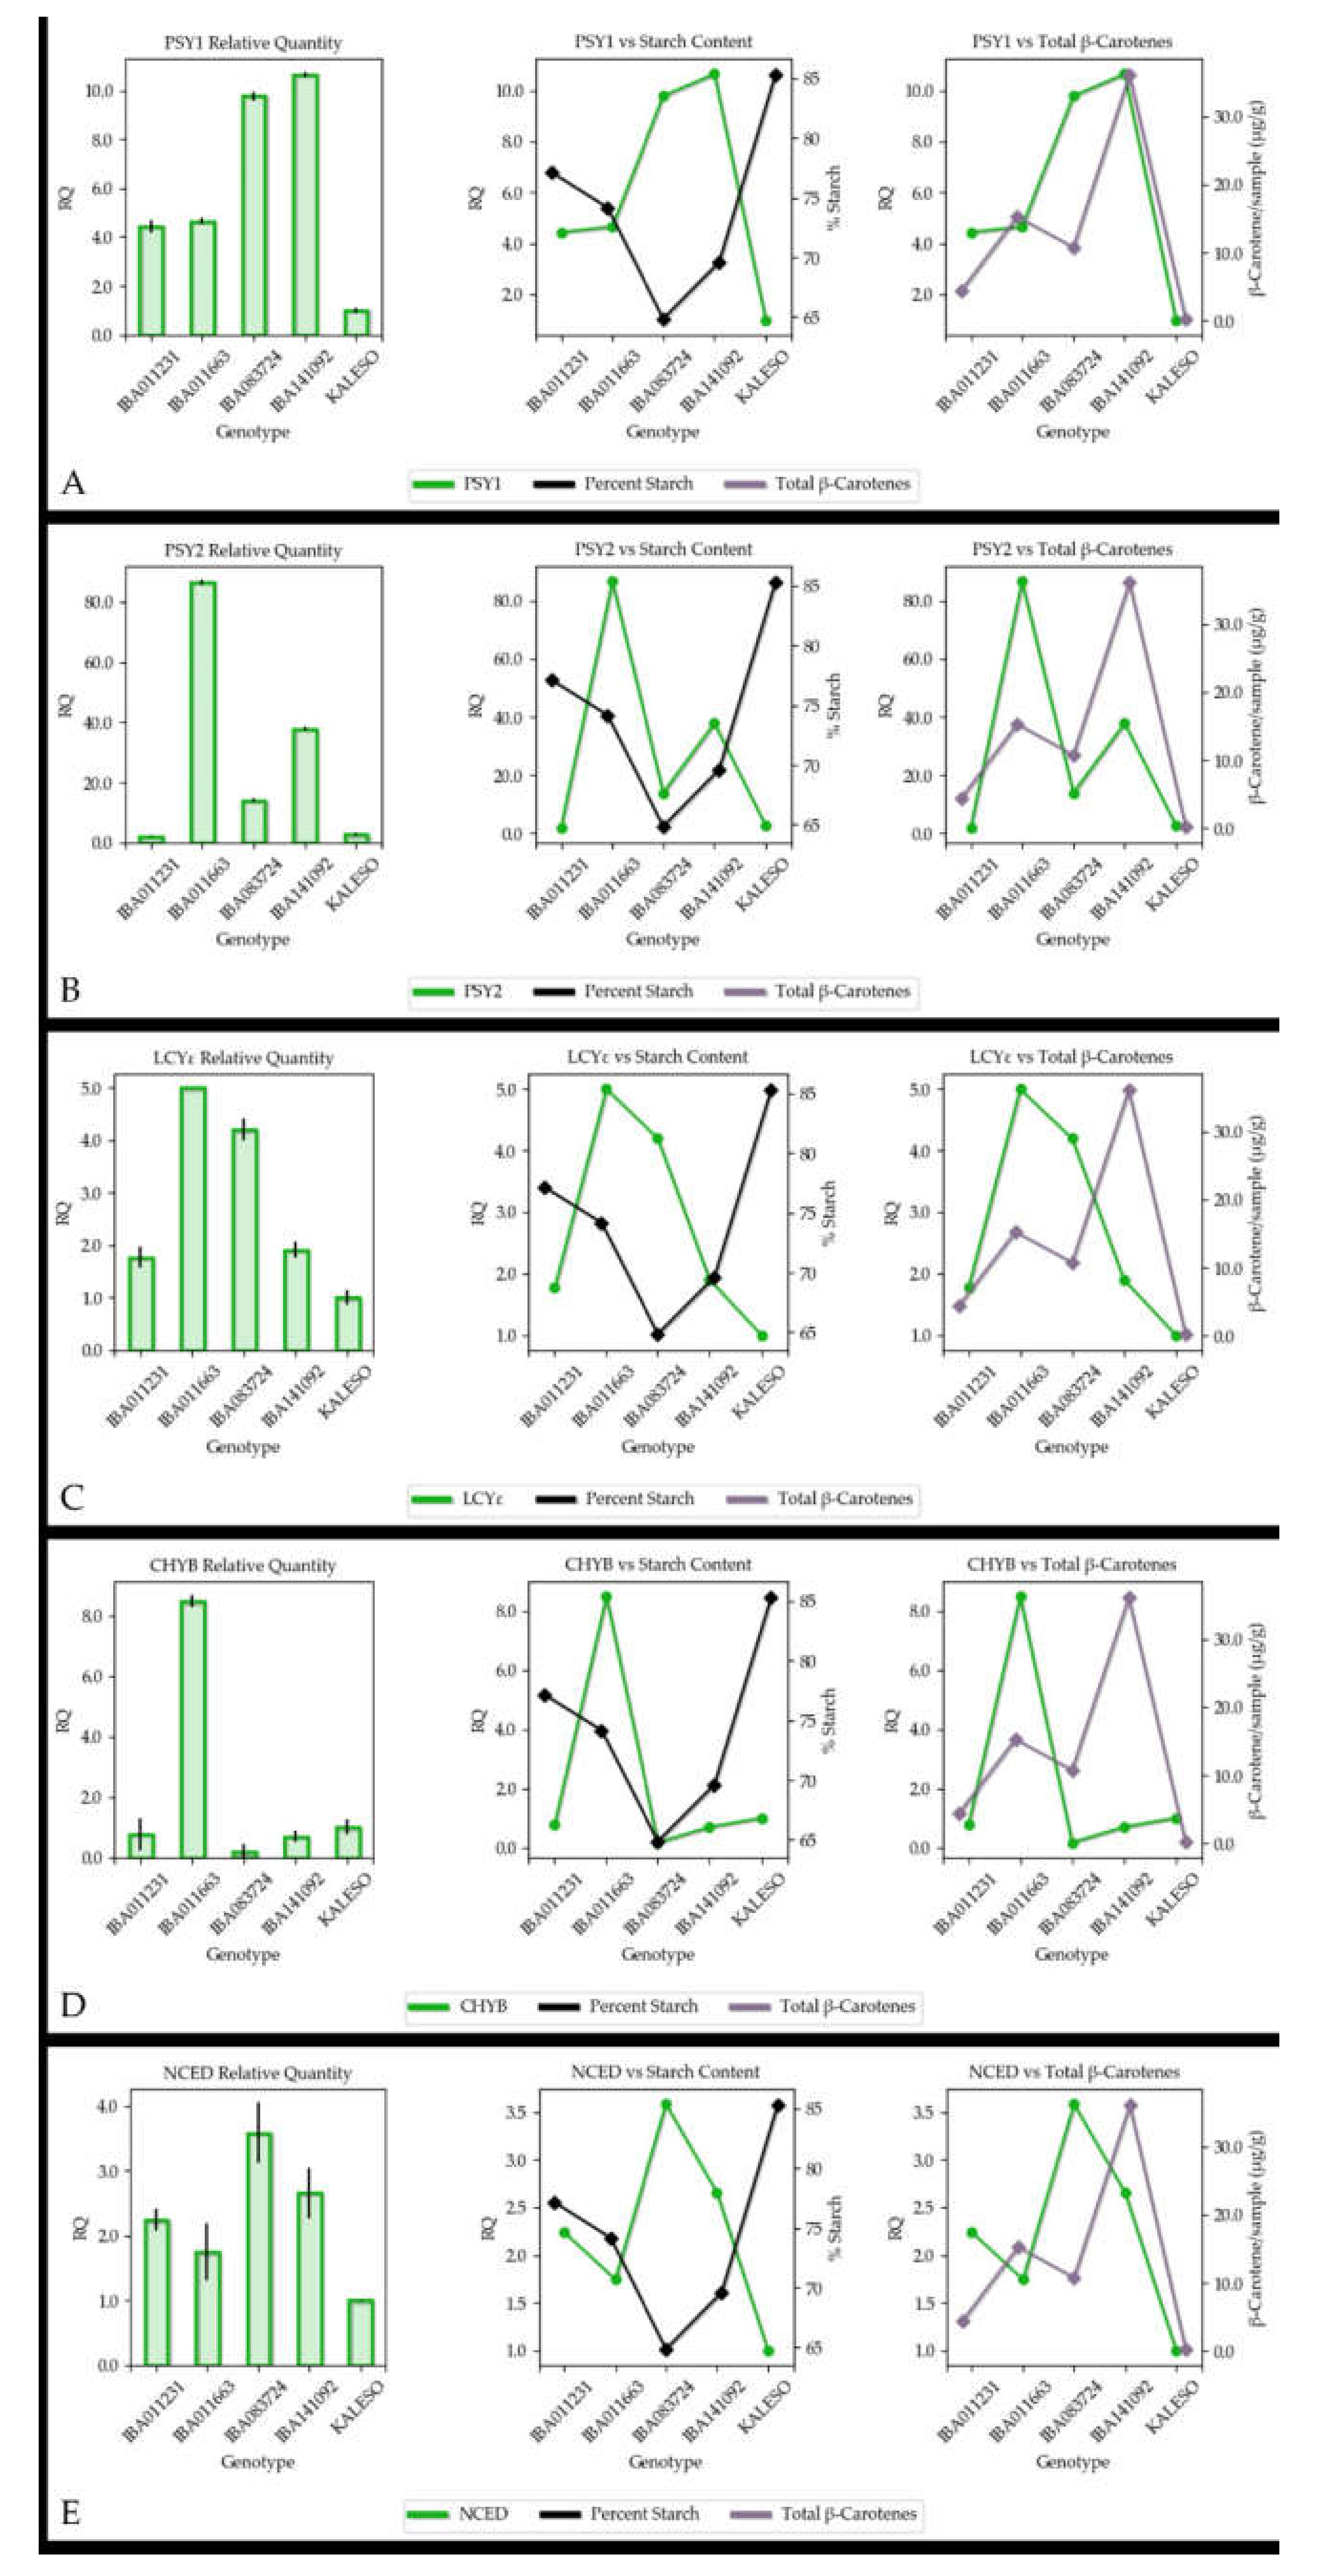
3.4. Gene Expression
4. Discussion
4.1. Agronomic Traits and Metabolite Profiling
4.2. Association between Carotenoid Content and Gene Expression
5. Conclusions
Supplementary Materials
Author Contributions
Funding
Acknowledgments
Conflicts of Interest
References
- El-sharkawy, M.A. Drought-Tolerant Cassava for Africa, Asia, and Latin America. BioScience 1993, 7, 441–451. [Google Scholar] [CrossRef]
- Esuma, W.; Kawuki, R.S.; Herselman, L.; Labuschagne, M.T. Stability and genotype by environment interaction of provitamin A carotenoid and dry matter content in cassava in Uganda. Breed. Sci. 2016. [Google Scholar] [CrossRef]
- Welsch, R.; Arango, J.; Bar, C.; Salazar, B.; Al-Babili, S.; Beltran, J.; Chavarriaga, P.; Ceballos, H.; Tohme, J.; Beyer, P. Provitamin A Accumulation in Cassava (Manihot esculenta) Roots Driven by a Single Nucleotide Polymorphism in a Phytoene Synthase Gene. Plant Cell 2010, 22, 3348–3356. [Google Scholar] [CrossRef] [PubMed]
- Nisar, N.; Li, L.; Lu, S.; Khin, N.C.; Pogson, B.J. Carotenoid metabolism in plants. Mol. Plant 2015, 8, 68–82. [Google Scholar] [CrossRef] [PubMed]
- Sun, T.; Yuan, H.; Cao, H.; Yazdani, M.; Tadmor, Y.; Li, L. Carotenoid Metabolism in Plants: The Role of Plastids. Mol Plant 2018, 11, 58–74. [Google Scholar] [CrossRef]
- Giuliano, G. Provitamin A biofortification of crop plants: A gold rush with many miners. Curr. Opin. Biotechnol. 2017, 44, 169–180. [Google Scholar] [CrossRef]
- Rao, C.K.; Annadana, S. Nutrient Biofortification of Staple Food Crops: Technologies, Products and Prospects. In Phytonutritional Improvement of Crops; Wiley Blackwell: Hoboken, NJ, USA, 2017; pp. 113–183. [Google Scholar] [CrossRef]
- Bohn, T. Determinants and Determination of Carotenoid Bioavailability from Infant Food Formulas and Adult Nutritionals Including Liquid Dairy Products. J. AOAC Int. 2019, 102, 1044–1058. [Google Scholar] [CrossRef]
- Ceballos, H.; Morante, N.; Sanchez, T.; Ortiz, D.; Aragon, I.; Chavez, A.L.; Pizarro, M.; Calle, F.; Dufour, D. Rapid Cycling Recurrent Selection for Increased Carotenoids Content in Cassava Roots. Crop Sci. 2013, 53, 2342–2351. [Google Scholar] [CrossRef]
- Low, J.W.; Mwanga, R.O.M.; Andrade, M.; Carey, E.; Ball, A.M. Tackling vitamin A deficiency with biofortified sweetpotato in sub-Saharan Africa. Glob. Food Sec. 2017, 14, 23–30. [Google Scholar] [CrossRef]
- Sayre, R.; Beeching, J.R.; Cahoon, E.B.; Egesi, C.; Fauquet, C.; Fellman, J.; Fregene, M.; Gruissem, W.; Mallowa, S.; Manary, M.; et al. The BioCassava plus program: Biofortification of cassava for sub-Saharan Africa. Annu. Rev. Plant Biol. 2011, 62, 251–272. [Google Scholar] [CrossRef]
- Atwijukire, E.; Hawumba, J.F.; Baguma, Y.; Wembabazi, E.; Esuma, W.; Kawuki, R.S.; Nuwamanya, E. Starch quality traits of improved provitamin A cassava (Manihot esculenta Crantz). Heliyon 2019, 5, e01215. [Google Scholar] [CrossRef] [PubMed]
- Njoku, D.N.; Gracen, V.E.; Offei, S.K.; Asante, I.K.; Egesi, C.N.; Kulakow, P.; Ceballos, H. Parent-Offspring regression analysis for total carotenoids and some agronomic traits in cassava. Euphytica 2015, 206, 657–666. [Google Scholar] [CrossRef]
- Rabbi, I.Y.; Udoh, L.I.; Wolfe, M.; Parkes, E.Y.; Gedil, M.A.; Dixon, A.; Ramu, P.; Jannink, J.L.; Kulakow, P. Genome-Wide Association Mapping of Correlated Traits in Cassava: Dry Matter and Total Carotenoid Content. Plant Genome 2017, 10. [Google Scholar] [CrossRef] [PubMed]
- Carvalho, L.J.C.B.; Agustini, M.A.V.; Anderson, J.V.; Vieira, E.A.; de Souza, C.R.B.; Chen, S.B.; Schaal, B.A.; Silva, J.P. Natural variation in expression of genes associated with carotenoid biosynthesis and accumulation in cassava (Manihot esculenta Crantz) storage root. BMC Plant Biol. 2016, 16. [Google Scholar] [CrossRef] [PubMed]
- Frede, K.; Schreiner, M.; Baldermann, S. Light quality-Induced changes of carotenoid composition in pak choi Brassica rapa ssp. chinensis. J. Photochem. Photobiol. B 2019, 193, 18–30. [Google Scholar] [CrossRef] [PubMed]
- Livak, K.J.; Schmittgen, T.D. Analysis of relative gene expression data using real-Time quantitative PCR and the 2(-Delta Delta C(T)) Method. Methods 2001, 25, 402–408. [Google Scholar] [CrossRef] [PubMed]
- De Mendiburu, F. Agricolae: Statistical procedures for agricultural research. R Package Version 2014, 1. [Google Scholar]
- Vu, V.Q. ggbiplot: A ggplot2 based biplot. R Package 2011, 342. [Google Scholar]
- Shannon, P.; Markiel, A.; Ozier, O.; Baliga, N.S.; Wang, J.T.; Ramage, D.; Amin, N.; Schwikowski, B.; Ideker, T. Cytoscape: A software environment for integrated models of biomolecular interaction networks. Genome Res. 2003, 13, 2498–2504. [Google Scholar] [CrossRef]
- Jaramillo, A.M.; Londono, L.F.; Orozco, J.C.; Patino, G.; Belalcazar, J.; Davrieux, F.; Talsma, E.F. A comparison study of five different methods to measure carotenoids in biofortified yellow cassava (Manihot esculenta). PLoS ONE 2018, 13, e0209702. [Google Scholar] [CrossRef]
- Sánchez, T.; Chávez, A.L.; Ceballos, H.; Rodriguez-Amaya, D.B.; Nestel, P.; Ishitami, M. Reduction or delay of post-Harvest physiological deterioration in cassava roots with higher carotenoid content. J. Sci. Food sAgric. 2005. [Google Scholar] [CrossRef]
- Anand, M.H.; Byju, G. Chlorophyll meter and leaf colour chart to estimate chlorophyll content, leaf colour, and yield of cassava. Photosynthetica 2008, 46, 511–516. [Google Scholar] [CrossRef]
- Zhang, Y.; Huang, J.; Wang, F.; Blackburn, G.A.; Zhang, H.K.; Wang, X.; Wei, C.; Zhang, K.; Wei, C. An extended PROSPECT: Advance in the leaf optical properties model separating total chlorophylls into chlorophyll a and b. Sci. Rep. 2017, 7, 6429. [Google Scholar] [CrossRef] [PubMed]
- Kang, L.; Ji, C.Y.; Kim, S.H.; Ke, Q.; Park, S.C.; Kim, H.S.; Lee, H.U.; Lee, J.S.; Park, W.S.; Ahn, M.J.; et al. Suppression of the beta-Carotene hydroxylase gene increases beta-Carotene content and tolerance to abiotic stress in transgenic sweetpotato plants. Plant Physiol. Biochem. 2017, 117, 24–33. [Google Scholar] [CrossRef] [PubMed]
- Diretto, G.; Welsch, R.; Tavazza, R.; Mourgues, F.; Pizzichini, D.; Beyer, P.; Giuliano, G. Silencing of beta-Carotene hydroxylase increases total carotenoid and beta-Carotene levels in potato tubers. BMC Plant Biol. 2007, 7, 11. [Google Scholar] [CrossRef] [PubMed]


| Genotype | Flesh Color | Total ß-Carotene | Category |
|---|---|---|---|
| KALESO | W | 0.3 | low |
| IBA050128 | PY | 6.2 | intermediate |
| IBA011231 | PY | 4.4 | intermediate |
| IBA083724 | Y | 11.2 | high |
| IBA090144 | W | 14.2 | high |
| Z010116 | W | 0.6 | low |
| IBA083565 | Y | 12.4 | high |
| MM990214 | W | 2.7 | low |
| IBA011663 | Y | 14.9 | high |
| IBA102103 | W | 15 | high |
| IBA141092 | Y | 36.1 | high |
| IBA141102 | Y | 14.7 | high |
| IBA130799 | Y | 12.4 | high |
| Genotype | Lutein | β-Carotene | 9-cis-β-Carotene | 15-cis-β-Carotene | Zeaxanthin | Neoxanthin1 | Neoxanthin2 | Violaxanthin1 | Violaxanthin2 |
|---|---|---|---|---|---|---|---|---|---|
| KALESO | 393 ± 135 | 229 ± 88 | 35 ± 16 | 5 ± 2 | 328 ± 27 | 70 ± 25 | 22 ± 7 | 55 ± 24 | 46 ± 17 |
| IBA050128 | 529 ± 41 | 326 ± 256 | 48 ± 3 | 9 ± 0.8 | 481 ± 90 | 93 ± 12 | 27 ± 5 | 139 ± 41 | 82 ± 20 |
| IBA011231 | 526 ± 71 | 299 ± 75 | 42 ± 10 | 7 ± 2 | 1849 ± 306 | 106 ± 16 | 17 ± 4 | 65 ± 29 | 34 ± 11 |
| IBA083724 | 528 ± 38 | 289 ± 32 | 40 ± 5 | 7 ± 1 | 641 ± 82 | 87 ± 9 | 21 ± 4 | 75 ± 22 | 56 ± 7 |
| IBA090144 | 570 ± 120 | 268 ± 62 | 33 ± 7 | 7 ± 2 | 702 ± 37 | 88 ± 19 | 22 ± 6 | 62 ± 33 | 33 ± 8 |
| Z010116 | 582 ± 96 | 305 ± 50 | 45 ± 9 | 8 ± 2 | 523 ± 167 | 113 ± 22 | 26 ± 7 | 102 ± 41 | 61 ± 13 |
| IBA083565 | 721 ± 29 | 395 ± 38 | 54 ± 9 | 10 ± 0.9 | 791 ± 131 | 116 ± 5 | 29 ± 5 | 123 ± 36 | 67 ± 22 |
| MM990214 | 781 ± 188 | 402 ± 84 | 51 ± 7 | 12 ± 3 | 915 ± 462 | 137 ± 31 | 20 ± 4 | 71 ± 4 | 52 ± 7 |
| IBA011663 | 575 ± 88 | 329 ± 61 | 44 ± 10 | 9 ± 1 | 993 ± 282 | 97 ± 14 | 19 ± 6 | 55 ± 13 | 40 ± 8 |
| IBA102103 | 841 ± 36 | 500 ± 31 | 68 ± 2 | 15 ± 0.9 | 1478 ± 211 | 166 ± 10 | 27 ± 6 | 140 ± 36 | 94 ± 12 |
| IBA141092 | 812 ± 74 | 405 ± 33 | 49 ± 2 | 11 ± 1 | 734 ± 34 | 125 ± 14 | 20 ± 2 | 86 ± 12 | 61 ± 10 |
| IBA141102 | 722 ± 48 | 366 ± 31 | 45 ± 7 | 10 ± 1 | 1201 ± 135 | 118 ± 1 | 27 ± 5 | 87 ± 28 | 43 ± 7 |
| IBA130799 | 716 ± 26 | 385 ± 87 | 48 ± 14 | 11 ± 4 | 1165 ± 315 | 119 ± 22 | 23 ± 1 | 93 ± 5 | 50 ± 15 |
| Genotype | Chlorophyll A | Chlorophyll B | Chl A: Chl B |
|---|---|---|---|
| KALESO | 8006 ± 2688 | 913 ± 314 | 8.77 |
| IBA050128 | 9775 ± 397 | 1111 ± 106 | 8.8 |
| IBA011231 | 9025 ± 1185 | 1173 ± 169 | 7.69 |
| IBA083724 | 8453 ± 999 | 1096 ± 109 | 7.71 |
| IBA090144 | 7856 ± 1689 | 1060 ± 265 | 7.41 |
| Z010116 | 10,229 ± 1415 | 1321 ± 221 | 7.75 |
| IBA083565 | 10,564 ± 802 | 1397 ± 97 | 7.56 |
| MM990214 | 11,653 ± 2037 | 1609 ± 403 | 7.24 |
| IBA011663 | 9087 ± 1861 | 1220 ± 267 | 7.45 |
| IBA102103 | 13,231 ± 947 | 1841 ± 75 | 7.19 |
| IBA141092 | 10,215 ± 812 | 1380 ± 84 | 7.4 |
| IBA141102 | 10,281 ± 811 | 1525 ± 124 | 6.74 |
| IBA130799 | 10,238 ± 2126 | 1406 ± 368 | 7.28 |
© 2020 by the authors. Licensee MDPI, Basel, Switzerland. This article is an open access article distributed under the terms and conditions of the Creative Commons Attribution (CC BY) license (http://creativecommons.org/licenses/by/4.0/).
Share and Cite
Olayide, P.; Large, A.; Stridh, L.; Rabbi, I.; Baldermann, S.; Stavolone, L.; Alexandersson, E. Gene Expression and Metabolite Profiling of Thirteen Nigerian Cassava Landraces to Elucidate Starch and Carotenoid Composition. Agronomy 2020, 10, 424. https://doi.org/10.3390/agronomy10030424
Olayide P, Large A, Stridh L, Rabbi I, Baldermann S, Stavolone L, Alexandersson E. Gene Expression and Metabolite Profiling of Thirteen Nigerian Cassava Landraces to Elucidate Starch and Carotenoid Composition. Agronomy. 2020; 10(3):424. https://doi.org/10.3390/agronomy10030424
Chicago/Turabian StyleOlayide, Priscilla, Annabel Large, Linnea Stridh, Ismail Rabbi, Susanne Baldermann, Livia Stavolone, and Erik Alexandersson. 2020. "Gene Expression and Metabolite Profiling of Thirteen Nigerian Cassava Landraces to Elucidate Starch and Carotenoid Composition" Agronomy 10, no. 3: 424. https://doi.org/10.3390/agronomy10030424
APA StyleOlayide, P., Large, A., Stridh, L., Rabbi, I., Baldermann, S., Stavolone, L., & Alexandersson, E. (2020). Gene Expression and Metabolite Profiling of Thirteen Nigerian Cassava Landraces to Elucidate Starch and Carotenoid Composition. Agronomy, 10(3), 424. https://doi.org/10.3390/agronomy10030424