Article

Grazing and Cutting under Different Nitrogen Rates, Application Methods and Planting Density Strongly Influence Qualitative Traits and Yield of Canola Crop

1
Guangxi Key laboratory of medicinal resources protection and genetic improvement, Guangxi botanical garden of medicinal plants, Nanning 530005, China
2
Department of Agronomy, The University of Agriculture Peshawar-Pakistan, Peshawar 25000, Pakistan
3
Institute of Nuclear Agriculture Sciences, College of Agriculture and Biotechnology, Zhejiang University, Hangzhou 310058, China
4
College of Agriculture, Guangxi University, Nanning 530005, China
5
Department of Weed Science, The University of Agriculture Peshawar-Pakistan, Peshawar 25000, Pakistan
6
Center for Plant Water-Use and Nutrition Regulation, College of Life Sciences, Joint International Research Laboratory of Water and Nutrient in Cops, Fujian Agriculture and Forestry University, Fuzhou 350002, Fujian, China
7
Department of Agriculture, Abdul Wali khan University Mardan, Mardan 23200, Pakistan
8
FAFU and UIUC-SIB joint center for genomics and biotechnology, Fujian Agriculture and Forestry University, Fujian 350002, China
9
Department of Horticulture, The University of Agriculture Peshawar-Pakistan, Peshawar 25000, Pakistan
*
Author to whom correspondence should be addressed.
Agronomy 2020, 10(3), 404; https://doi.org/10.3390/agronomy10030404
Submission received: 28 January 2020 / Revised: 2 March 2020 / Accepted: 11 March 2020 / Published: 16 March 2020
(This article belongs to the Special Issue Herbaceous Field Crops Cultivation)

Abstract

:
Canola crop has the potential for both seeds and grazing. Optimal planting density, time of nitrogen (N) fertilizer application and rates are the major aspects for successful qualitative traits and canola yield formation. In this content, optimization of planting density, N levels and its time of application in dual purpose canola are needed. This study was carried out in RCB design with split pot arrangement having three repeats during winter 2012–2013 and 2013–2014. The study evaluated N levels (120 and 80 kg N ha−1), cutting treatment, N application timings and planting density (20 and 40 plants m−2) effects on qualitative traits and yield of canola. No-cut treatment had 7.02%, 2.46%, and 4.26% higher, glucosinolates, oil, and protein content with 31.3% and 30.5% higher biological and grain yield respectively, compared with grazed canola. Compared with no-cut canola, grazed canola resulted in 7.74% of higher erucic acid. Further, application of N at 120 kg N ha−1 had 8.81%, 5.52%, and 6.06% higher glucosinolates, percent protein, and seed yield, respectively than 80 kg N ha−1. In-addition, the application of N into two splits was most beneficial than the rest application timings. Cutting had 15% reduction in grain yield of canola and fetched additional income of 143.6 USD compared with no-cut. Grazing resulted in a 23% reduction in grain yield while had additional income of 117.7 USD from fodder yield. Conclusively, the application of N in two splits at 120 kg N ha−1 combined with 20 plants m−2 is a promising strategy to achieve good qualitative attributes and canola yield under dual purpose system.

1. Introduction

The domestic production can only meet 29% of the total edible oil requirements of Pakistan and the remaining 71% was mad through imports [1]. Like other developing countries, Pakistan is also deficit in edible oil production. According to a study conducted the consumer’s demand has steadily increased from 0.3 million tons to 2.764 tons during the last two and half decades. The average yield of canola in Pakistan is 839 kg ha−1 [2], which is very low compared with other agriculturally advanced countries. The European countries have a yield level of 3500 kg ha−1; Canada 3200 kg ha−1; and Australia 2000 kg ha1 for canola crop [3]. To cut down these gaps concrete efforts are needed to increase its local production. Canola is an improved form of conventional rape seed variety developed through genetic engineering having erucic acid less than 2% and 30 μmolg−1 glucosinolates, which are considered the safe limits for health [4]. As compared to other oil crops, it contains less amount of cholesterol [3]. Seed oil concentration was inversely proportional to seed protein concentration in mustard and canola genotypes. Increase in seed yield increased the oil concentration, but decreased the protein concentration [5].
Optimum amount of nutrients supply at proper time to any crop is important [6]. Canola crop requires a higher amount of nutrients, and available nitrogen (N) compared with cereals [7]. Split application of N fertilizer has become more popular in terms of high nitrogen use efficiency. An appropriate rate and timing of N fertilizer application is one of the most important aspects of successful canola production [3]. Canola yield is strongly correlated with biotic and abiotic factors; one of the factors that availability of nutrients especially N is the key driver for improving root growth, leaf photosynthetic rate, biomass production, and yield [8]. N fertilizer boosts yield improving thousand seed weights, seeds pod−1, and pod number plant−1 [9]. Dual purpose cropping is the use of crops for fodder purpose at vegetative stage grazed by animals. The regrowth of plants after cutting or grazing strongly relies on the regenerative ability of the species. After being in stress condition, soon after grazing crops N fertilization is needed for growth improvement, thus N fertilizer selection is a good choice for growth improvement. Increasing N level from normal or recommended dozes boosts the overall plant health and seed production [9]. Considering DP canola, N fertilizer might be increased for better re-growth or regeneration of canola. Moreover, N is the most volatile and due to high losses, N efficiency becomes lesser and thereby affects plant normal functioning [10]. Winter or long-season spring canola with proper N rates can be sown to produce high-quality forage for grazing or fodder for cut and carry and recover from grazing to produce a high grain yield (4 t/ha) with good oil content (47%) [11]. Canola crop has the potential to produce grains and to graze. Although, canola crop is good for forage. Canola grazing is only one of the assortments of choice to the farmers to perk up farm economics and productivity.
However, oil quality is also important, and contains less amount of cholesterol, which is good for human health. Studies regarding N rate, timing, and planting density under dual purpose canola production are lacking. The objectives of this study were to explore canola qualitative and yield attributes to different N rate, application, and planting density under dual purpose canola technology. This study also explores the quantitative relationship among N level, application time and planting density for dual purpose use of canola. Furthermore, the combination of all above discussed factors will make an understanding of the effect of grazing on the yield and quality of canola crop and even development of commercial grazing practices. The tested hypothesis was that N rate, time of application, and planting density would improve canola qualitative traits and yield under dual purpose technology.

2. Materials and Methods

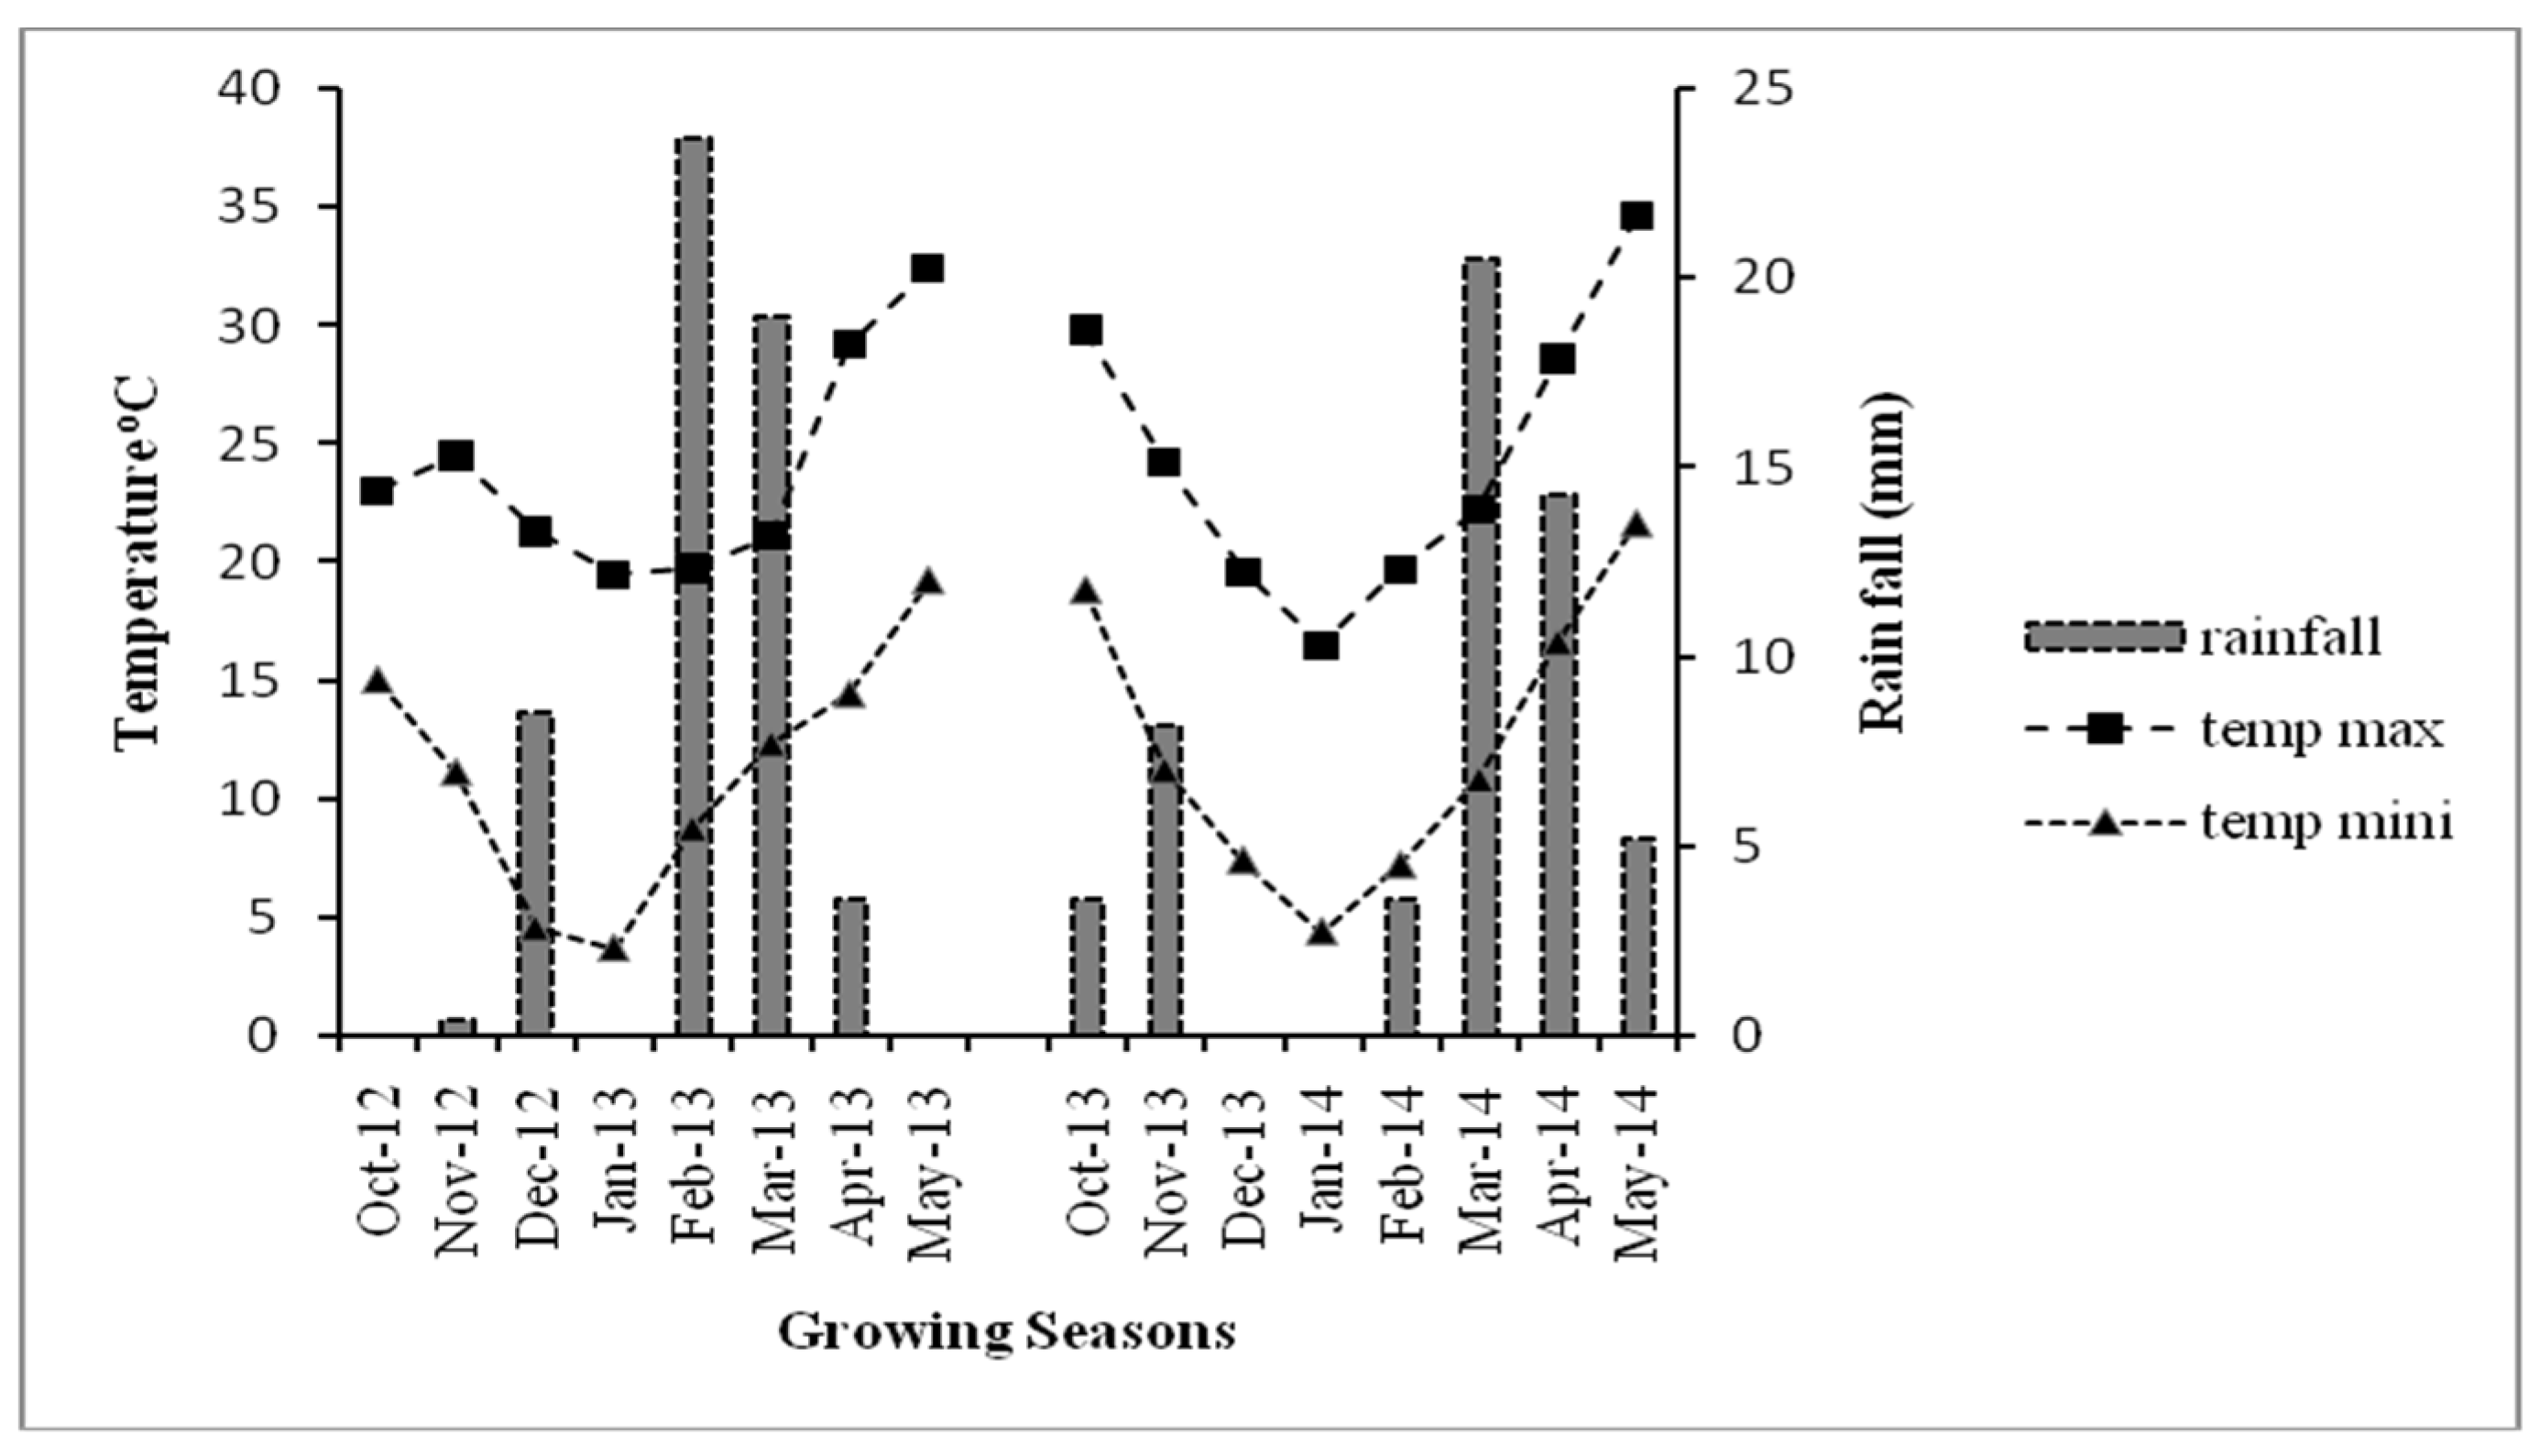
2.1. Experimental Site

The present study was conducted at New Developmental Farm of Agricultural University Peshawar during Rabi 2012–2013. The research farm is located about 300 m above the sea level, while the site has 34° N latitude and 72° E longitude. The soil of the site was clay loamy having pH values ranges between 7.0–7.5. Temperature (°C) and rainfall (mm) during the crop growing season have been shown in Figure 1. Weather data were collected from the meteorological station located near the experimental site.

2.2. Treatments and Methods

The experiment contained two levels (80 and 120 kg ha−1) of nitrogen levels (NL), cuttings (C; (cut, no cut and grazing), application timing (NT; (a) full application at sowing, (b) half dose of N both at sowing and start of rosette stage, (c) one third dose of N each at sowing, start of rosette stage and soon after cut at late rosette stage (60 days after sowing) and plant density (PD: 20 and 40 plants m−2) (Table 1). In 2012–2014, the experiment was conducted in RCB design with split plot arrangement having three replications. Cutting and N levels (urea as a source of nitrogen was applied as top dressed) were assigned to the main plot while N application timings and planting densities were allotted to sub-plot. Cutting and grazing were done 60 days after sowing. Cutting was done manually by cutting the crop at about 10 cm above the ground. However, grazing was done through sheep for predetermined time.

2.3. Field Preparation and Cultural Practices

Cultivar Abasin-95 was sown with a uniform seed rate of 8 kg ha−1. Row to row distance of 50 cm was maintained with a subplot size of 10.5 m2, having 7 rows, and 3 m long. Before sowing, a fine seedbed was prepared by ploughing the field with cultivator followed by rotavator. A basal dose of phosphorus at 60 kg ha−1 was applied in the form of single super phosphate. Nitrogenous fertilizer was applied in the form of urea. Weeds were controlled manually by hoeing, when the crop reached 6–8 cm height. The field was harvested on 10 April each year. All cultural practices were carried out uniformly in all plots.

2.4. Grazing Management

Sheep stock was arranged for grazing canola from nearby village. The sheep were allowed to graze a normal canola field about five days before the treatment grazing to acclimatize them to canola/brassica consumption. The sheep were controlled with the help of fences from going to other treatment plots. Animals for grazing were allowed in noon time because of much frost in morning time during grazing period in the month of December in both years.
Agronomy 10 00404 g005

2.5. Observations

2.5.1. Quality Attributes of Canola

Protein, percent oil content, erucic acid, and glucosinolates were determined by collecting randomly seed samples in each plot and were analyzed by Full Option Science System (FOSS) Routine Near Measurement System (35RP-3752F) TR-3657-C Model 6500, at oilseed laboratory, Nuclear Institute for Food and Agriculture, Peshawar (NIFA). Near infrared reflectance (NIR) spectroscopy is a quick and whole seed analyzing method, which does not require any sample preparation or chemicals [12].

2.5.2. Canola Yield

Biomass yield was determined by harvesting of four central rows, dried and weighted. While in order to determine grain yield, bundles from the same central four rows were threshed, seeds were weighed and the data were converted to kg ha−1 [13].

2.5.3. Statistical Analysis

The data were statistically analyzed over years using ANOVA techniques appropriate for RCB design with split plot arrangement using SPSS software (SPSS Inc., Chicago, IL, USA). Means were compared using LSD test at 0.05 level of probability, when the F-values were significant [14].

3. Results

3.1. Treatments Interactions

The significance ANOVA for main factors and interaction is presented in Table 2. The C × NL significantly affected on Glucosinolates, while the rest of treatments interaction were not significant. Oil content were significantly affected by the C × NL, C × NT, and NT×PD treatments. Protein content was not significant throughout the treatments’ interactions. Eurcic acid showed significant differences on C × PD treatment, while biological yield was significant on C × NL, and NT × NL, and grain yield was on C × NT, and NT × PD treatments.

3.2. Crop Yield

The significance ANOVA for main factors is presented in Table 2. Canola biomass yield was significantly affected by C, PD, and year, whereas NL and NT did not affect biomass yield (Table 3). C3 and C2 decreased biological yield by 11.74% and 31.2% compared with that of C1. Plants grown at PD2 had 5.3% higher biological yield than PD1. The C, NL, and NT significantly influenced grain yield of canola, whereas the effect of planting density and year remained unaffected on grain yield (Table 4). The interactions among C × NT and NT × PD were significant. Higher grain yield was produced in C1 plots, followed by C2 plots, whereas lower grain yield resulted in C3 plots. Grain yield was higher when N was applied at NT2 as compared to NT3.

3.3. Quality Parameters of Canola

3.3.1. Oil Content (%) and Protein Content (%)

Cuttings, PD, NL, NT, and years significantly affected oil content of canola crop (Table 5). A 1.4% higher oil content was resulted in C1 followed by C2. The C3 plots substantially reduced oil content. Application of NL1 had 5.07% of higher oil content compared with NL2. Oil content was higher NT2 followed by NT3 and NT1. Between planting densities, plants under PD2 had higher oil content compared with PD1. The C × NL interaction showed an obvious reduction in oil content for C2 and C3 plots under NL2, whereas the oil content of all cutting treatments remained unchanged under NL1 application (Figure 2A). Interaction between C × NT showed that canola oil content decreased in C3 plots at NT2 than C1 and C2. On other hand, oil content of all cutting treatments remained unchanged under three equal splits application of N (Figure 2B). Interaction between NT and PD indicated that oil content was reduced for PD1 with sole N at sowing than two or three splits and planting densities (Figure 2C). Cuttings, NL and years had remarkedly effects on grain protein content of canola seeds while the effects of NT and PD were insignificant (Table 5). Higher protein content was noted for cut plots which were statistically at par with C3 plots, while C1 plots had lower crude protein content in canola seed. The application of NL2 had 5.5% higher crude protein content compared with that of NL1 (Table 6).

3.3.2. Erucic acid Content (%)

Canola erucic acid content was significantly influenced by C and NT, while the effect of year, NL and PD was non-significant (Table 7). Erucic acid content was 7.7% higher in C3 than other cutting treatments. Similarly, NT1 had higher erucic acid content than NT2 or NT3. In addition, in the first year the content was 8.07% higher than 2nd year of the study. However, significant C × PD interaction revealed that erucic acid content increased with imposition of C2 and C3 than C1 under PD1. No or least variation in erucic acid content in all cutting treatments was noted under PD2 treatment (Figure 3).

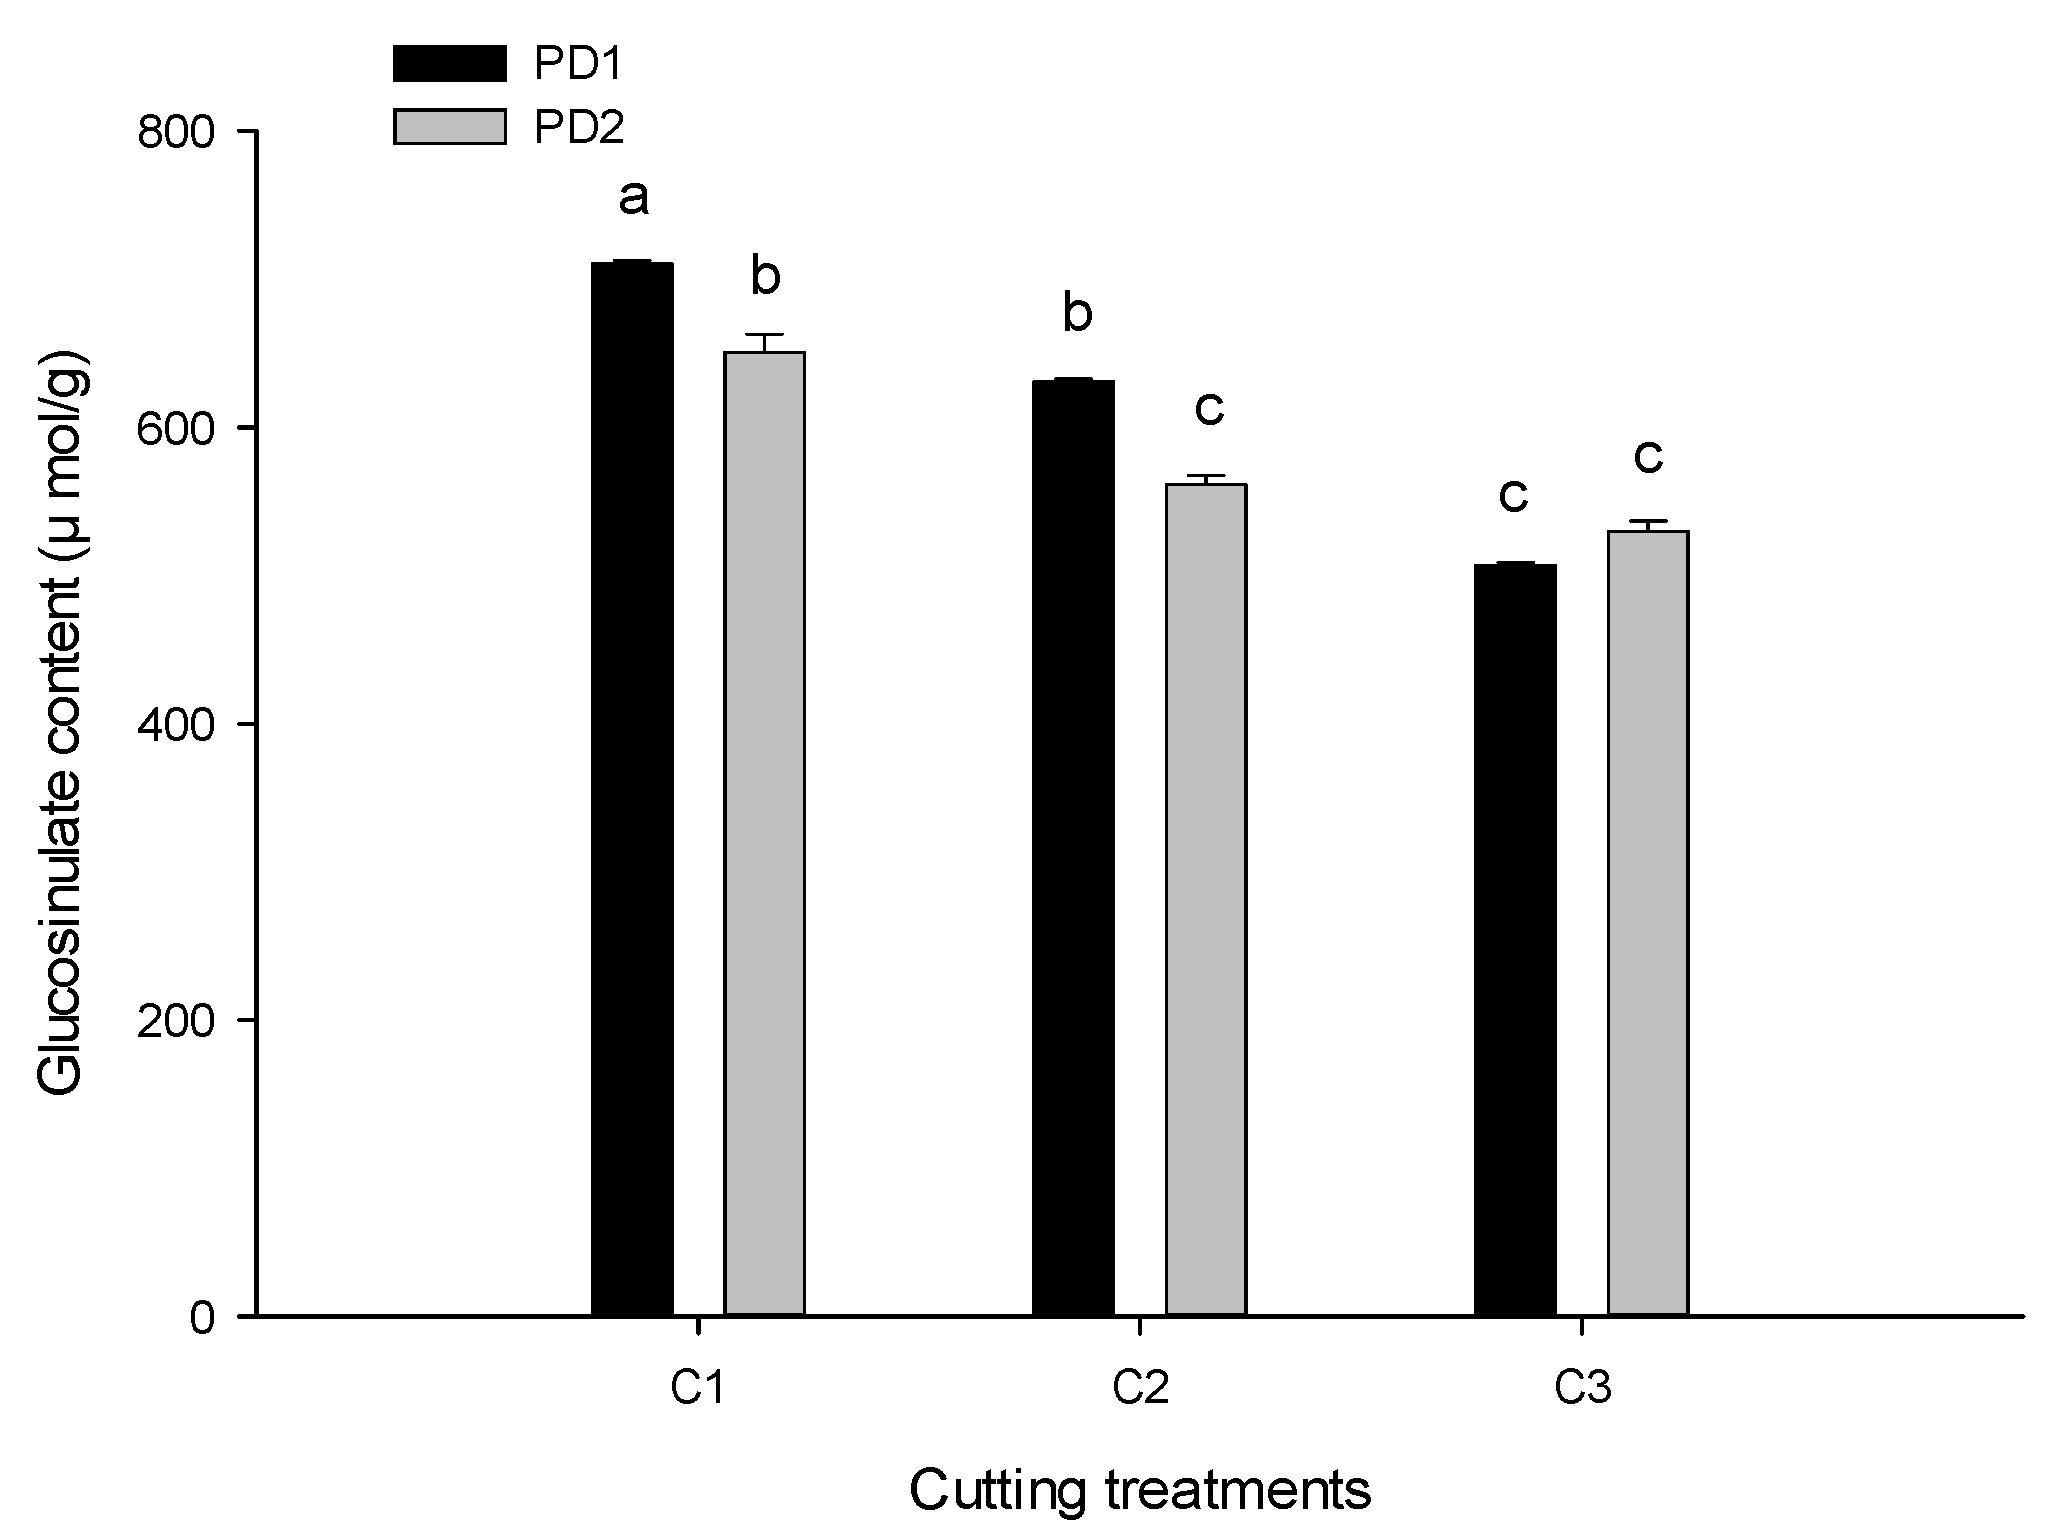
3.3.3. Glucosinolates Concentration

Canola glucosinolates concentration was substantially impacted by C, NL and year, while the effect of NT and, PD and year was not significant (Table 8). Glucosinolates content was 4% higher in C1 followed by C2, while C3 resulted in lower content of glucosinolates. Similarly, glucosinolates concentration increased with the increased of N level from 80 to 120 kg ha−1. Glucosinolates content was 6% higher in second year compared with compared with first year. The C x NL interaction indicated that increasing N from 80 upto 120 kg ha−1 increased the glucosinolates contents in all cutting treatments. However, the glucosinolates were markedly lower in C3 and C2 than C1 under NL1 (Figure 4).

3.4. Economic Analysis

Economic analysis showed that C2 produced higher net income (USD 1202.1) compared to that of C1 (USD 1057.2) (Table 9). However, in C1 plots net income was higher compared to C3 (USD 121). C2 and C3 plots reduced grain yield by 15% and 23%, respectively, than C1 plots. Likewise, value cost ratio (VCR) of C2 was higher compared with C3 and C1 plots. Furthermore, higher VCR (4.16) was found in C2 where N at the rate of 80 kg ha−1 in NT2 with high density (40 plants m−2) was followed by C2 and received at NL1 with PD2. The lower VCR (1.58) in C3 received at NL2 in NT3 in PD1 (Table 10). The net income from fodder of canola in C2 plots were recorded on the basis of area as per usual practice at the same farm.

4. Discussion

4.1. Crop Yield

4.1.1. Effects of Grazing and Cut on Canola Yield

Biological yield is the function of increase rate and growth duration both of which indicate the possibility for improved yield. In this study, biological yield was higher in no-cut plots followed by cut and grazed plots. Biological yield recovered rapidly in cut and grazed plots but the removal of branches in initial grazing and cuttings had led to the differences among the means. Delay in flowering may affect biological yield, when grazing removed the main auxiliary buds from the stems [15]. In our study biological yield was higher in second year (2013–2014) compared with first year (2012–2013), might be due to that in the second year, canola was sown for 15 days earlier than first year. Earlier sown plans of dual-purpose cropping for better results [16]. Reduction in biological yield was associated with the removal of branches in flowering, and not affected on seed yield [17]. Gross marginal value of DP canola is greater than grains only. In most cases grazing during early growth stages does not show significant results in the reduction of seed yield [18,19], while grazing after vegetative stage caused reduction up to 25% or even more [15,16]. Cutting treatments caused significant reduction in grain yield, might be due to less re-growth ability of plants in cut and grazed plots, and they were unable to regenerate quickly and reach to the growth of plants of no cut plots. The possible reason for this substantial decrease in yield of grazed and cut plots might be the removal of main stem either manually or by sheep grazing.

4.1.2. Effects of N fertilizer, Application Timings on Canola Yield

Canola crop responded well to N application timings. In these experiments, 3% and 1% increase in biological yield of canola was recorded in plots where N was applied in two or three splits as compared with sole application, respectively. The increase in yield with split application of N at seedling, rosette stage and early flowering [20]. Similarly, application of N at the rate of 100 kg ha−1 in split form (half each at sowing and soon after grazing) increased the biological yield up to 3.95 t ha−1 [21], and nitrogen in split form resulted better than sole application [22].
Canola crop requires high amount of N fertilizer compared to cereals to produce high yields [23]. In our study, seed yield increased by 6 % when N rate mounted from 80 to 120 kg ha−1. Higher yields of canola achieved in the current study also highlights the high levels of N fertilizer which must be applied to achieve enhanced seed yield. In general, for canola crop 80 kg N ha−1 may be applied in the growing season for each 1 t/ha predictable yield [21]. Several studies observed no significant results with further (200 kg ha−1) increase in N levels [3,24]. While, in our study, the improvement in grain yield can be attributed to N fertilizer at 120 kg ha−1 in two splits half at sowing while remaining at rosette stage. The split application of N fertilizer provides flexibility in their fertilizer program, and attracts farmers. Further, higher grain yield was noted in plots where N was applied in two splits as compared with single fertilization of N. The splits application of N fertilizer benefited crop growth and ensure availability of nutrients at two splits, one at sowing and second at rosette stage which may result in higher grain yield of faba bean [25,26].

4.1.3. Effects of Planting Densities on Canola Yield

Optimum planting is important to attain high yield and is a best option for reducing lodging among the plants. Biological yield increased by 3.3% with planting density of 40 plants m−2 compared to 20 plants m−2. This difference may be mainly due to increase in plants per unit area. Dahmardeh et al. compared three planting densities (12.5, 16.7, and 20 plants m−2) and found that biological yield of canola was highest for 20 plant m−2 compared to other planting density [27]. The inter-competition for nutrients among the plants might be a reason for the lower biological yield. Planting density is an important factor which determines the yield and which is individually affected by the climatic conditions and production system of an area as well [28]. In our study, planting density had non-significant effects on grain yield which indicated that 20 and 40 plants m−2 gave same results for grain yield of canola. However, higher yield in least densities indicated the proper utilization and maximum facilitation of nutrients [3].

4.2. Qualitative Traits of Canola

4.2.1. Effects of Grazing and Cut on Quality Traits of Canola

The improvement in quality of seed is the primary objective of breeding oil seed crops to fulfill upcoming edible oil requirements [29]. Oil content is mainly related with genetics for most of the species and varieties but the role of environment cannot be ignored. Cutting and grazing declined oil content of canola. We do not agree with the findings of Kirkegaard et al. that allowing sheep for grazing before bud elongation had no impact on oil content of canola seed [16]. Protein content in cut plots was higher than no cut and grazed plots while, glucosinolates was maximum in no cut plots compared to grazed and cut plots. However, year had significant effect on oil content of canola. Almost 113.6% higher oil content was recorded in second year compared to that of first year. Likewise, in second year protein content was increased up to 161.9% as compared to first year.

4.2.2. Effects of N Fertilizer, Application Timings on Quality Traits of Canola

The N fertilizer had a negative correlation with oil content of the seeds [30,31]. Increasing N level from 80 to 120 kg ha−1 decreased the oil content of canola seed. Likewise, higher oil content was measured in plots where N was applied in splits compared with sole N application. Further, seed oil content of canola reduced significantly with increase in N levels from 0 to 200 kg ha−1 [32,33], and the highest oil content (43.08%) in plots with low N rates (50 kg ha−1) while lowest oil content (38.64%) was recorded with high levels of N fertilizer (200 kg ha−1) [34]. However, the reduction in oil content due to increase in N levels [31,34]. For example, the accessibility of sugar for oil synthesis becomes less with increase in N rates, that the application of high rates of nitrogen fertilizer increased the amount of N containing protein; so this protein development goes through a competition for photosynthesis, as a consequence of less amount of the later is obtainable for fats production [32,35,36]. This inverse relationship between oil and protein content with increase in N levels may also be the possible reason [37]. However, our data did not agree with the findings of Brennan et al. (2000) who concluded that oil content is not going to decrease with increased in N rates [38]. It is also noticeable that protein content of canola seed improved with rising levels of nitrogen.
Nitrogen is the integral part of protein structures and involved in many other plant metabolic processes. Thus, increasing N levels increased the protein content of canola seeds. N at 120 kg N ha−1 application had higher protein content over 80 kg ha−1. The higher protein value is the evidence of negative correlation between oil content and protein content. Both these are inversely proportional to each other [6]. Increased N supply helps in increasing protein synthesis without compromising oil content reduction [18]. Similarly, split application resulted in higher protein contents compared with sole N application. The protein content of canola increased from 22.7% to 23.7% with the increasing N rates from 80 to 160 kg ha−1 [39]. Glucosinolates contents were significantly affected by N levels but N application timing had a non-significant effect on glucosinolates contents. Glucosinolates contents increased from 59 to 64 µmol g−1 with increasing N from 80 to 120 kg ha−1. These data indicated that increasing N levels significantly increased glucosinolates contents. The increase in glucosinolates contents due to N fertilization was also reported by [35,40,41,42]. Glucosinolates structure contains N therefore high N concentration may be influenced by the addition of N fertilizers [43].

4.2.3. Effects of Planting Densities on Quality Traits of Canola

Competition among the plants due to high planting density can result in poor quality attributes, impairs plant growth, reduced biomass formation, and consequently yield loss due to low nutrients uptake, and disruption in leaf structural and functional characteristics [44,45,46]. Increasing density decreases oil content may be due to inter plant competition for nutrients. Plants grown at 40 plants m−2 had higher oil content compared to 20 plants m−2. In contrary, no significant variation in oil content with increase in planting densities from 45 to 80 plants m−2 [47].

4.3. Interaction Effect of Factors

The proper nutrients at proper time to any crop is important [6], and canola crop requires a higher amount of nutrients, and available nitrogen (N) compared with that of cereals [7]. Split application of N fertilizer has become more popular in terms of high nitrogen use efficiency. Therefore, an appropriate rate and timing of N fertilizer application is one of the most important aspects of successful canola production [3]. These findings support our results that the interactive effects of NL2 with NT2 at PD1 were more qualitative and productive for canola under dual purpose.

4.4. Economics Benefits

The effectiveness of dual-purpose canola can be predictable by the economic analysis of no-cut, cut and grazing systems. Cut plots produced higher net income as compared to no-cut and grazed plots. The higher net income and thus higher value cost ratio (VCR) value of cut plots was due to high fodder and grains as compared to no-cut system. However, grazed plots reduced VCR value by 10% and net income by 69% as compared to no-cut plots. Our results are against with the findings that higher net income ($240 to $500) for grazed plots as compared to no-cut or grains only system [47].

5. Conclusions

The study revealed that integration of DP cropping would increase farm productivity, profitability and flexibility of the farm operations. It is an innovation which captures more food by increasing crop and livestock production on the same farm. C2 caused a 15% reduction in grain yield of canola; however, it fetched additional income of USD 143.6 compared to C1. In case of C3, 23% reduction was resulted in grain yield of canola with income of USD 117.7 from fodder yield of the same canola. Treatment NL2 produced higher seed yields and improved quality traits of canola compared with NL1. Further, NL2 increased grain yield and qualitative parameters of canola. Crops under PD2 produced more biological yield compared to PD1. However, seed yield was higher at PD1. Dual purpose cropping is a classical way which can contribute to continued development of sustainable agriculture systems. Currently, Pakistan is facing a serious shortage of edible oils and food insecurity threats. Therefore, the use of application of N in two splits at 120 kg N ha−1 coupled with 20 plants m−2 is a good option to achieve better qualitative attributes and high yield of canola under dual purpose system.

Author Contributions

S.J., performed experiment, K.A., F.S., and M.J., help in data analysis and making figures; M.A., supervision; A.K. (Ahmad Khan), and A.Z., S.A., A.K. (Aziz Khan), Methodology and software; S.B., and F.M., worked as investigators; S.J., write final full length draft; M.M.A., F.J., N.A., and M.A.K., revised and edit English language; F.W., revised article and provide funding; S.Z., Data curation; Writing—Originial draft; N.U.A., Writing—Review & editing. All authors have read and agreed to the published version of the manuscript.

Funding

This review is financially supported by the Guangxi Innovation-Driven Development Project (GuiKe AA18242040, Guangxi Natural Science Foundation (2018GXNSFBA294016).

Conflicts of Interest

The authors declare no conflict of interest.

References

  1. Barlog, P.; Grzebisz, W. Effect of timing and nitrogen fertilizer application on winter oilseed rape (Brassica napus L.). I. Growth Dynamics and Seed Yield. J. Agron. Crop. Sci. 2004, 190, 305–310. [Google Scholar] [CrossRef]
  2. GOP. Economic Survey Report, 2003–2004; Govt. of Pakistan, Finance Division: Islamabad, Pakistan, 2007; pp. 3–4. [Google Scholar]
  3. Cheema, M.A.; Malik, M.A.; Hussain, A.; Shah, S.H.; Basra, S.M.A. Effects of time and rate of nitrogen and phosphorus application on growth and seed and oil yields of canola. J. Agron. Crop. Sci. 2001, 186, 103–110. [Google Scholar] [CrossRef]
  4. Grombacher, A.; Nelson, L. Canola Production. A University of Nebraska Neb Guide Publication, G92-1076-A; Institute of Agriculture and Natural Resources, University of Nebraska-Lincoln: Lincoln, NE, USA, 1992. [Google Scholar]
  5. Gunasekera, C.P.; Martin, L.D.; Siddique, K.H.M.; Walton, G.H. Genotype by environment interactions of indian mustard (Brassica juncea L.) and canola (Brassica napus L.) in mediterranean-type environments: Ii. Oil and protein concentrations in seed. Eur. J. Agron. 2006, 25, 13–21. [Google Scholar] [CrossRef]
  6. Hao, X.C.; Chang, C.; Travis, G.J. Short communication: Effect of long-term cattle manure application on relations between nitrogen and oil content in canola seed. J. Plant Nutr. Soil Sci. 2004, 167, 214–215. [Google Scholar] [CrossRef]
  7. Hocking, P.J.; Strapper, M. Effect of sowing time and nitrogen fertilizer on canola and wheat, and nitrogen fertilizer on Indian mustard. II. Nitrogen concentrations, N accumulation, and N use efficiency. Aust. J. Agric. Res. 2001, 52, 635–644. [Google Scholar] [CrossRef]
  8. Faraji, A.; Sadeghi, S.; Asadi, M. Evaluation of nitrogen and irrigationeffects on yield and yield components of canola varieties in Gonbad. J. Agric. Res. Nat. Resour. 2005, 12, 63–72. [Google Scholar]
  9. Wright, G.C.; Smith, C.J.; Woodroffe, M.R. The effect of irrigation and nitrogen fertilizer on rapeseed (Brassica napus) production in South- Eastern Australia, I. Growth and seed yield. Irrig. Sci. 1988, 9, 1–13. [Google Scholar] [CrossRef]
  10. Sommer, S.G.; Schjoerring, J.K.; Denmead, O.T. Ammonia emission from mineral fertilizers and fertilized crops. Adv. Agron. 2004, 82, 557–622. [Google Scholar]
  11. Kirkegaard, J.A.; Sprague, S.J.; Hamblin, P.J.; Graham, J.M.; Lilley, J.M. Refining crop and livestock management for dual-purpose spring canola (Brassicanapus). Crop Pasture Sci. 2006, 63, 429–443. [Google Scholar] [CrossRef]
  12. Daun, J.K.; Clear, K.M.; Williams, P. Comparison of three whole seed near infrared analyzers for measuring quality components of canola seed. J. Am. Oil Chem. Soc. 1994, 71, 1063–1068. [Google Scholar] [CrossRef]
  13. Canola Council of Canada. The Grower’s Manual (Online); Canola Council of Canada: Winnipeg, MB, Canada, 2005. [Google Scholar]
  14. Jan, M.; Shah, P.; Hollington, P.; Khan, M.; Sohail, Q. Agriculture research: Design and analysis, a monograph. NWFP Agric. Univ. Pesh. Pak. 2009, 1, 232–250. [Google Scholar]
  15. Kirkegaard, J.; Sprague, S.J.; Marcroft, S.; Potter, T.D.; Graham, J.; Virgona, J. Identifying canola varieties for dual-purpose use. In Global Issues—Paddock Action, Proceedings of the 14th Australian Agronomy Conference, Adelaide South, Australia, 21–25 September 2008; Australian Society of Agronomy: Gosford, Australia, 2008. [Google Scholar]
  16. Khan, A.H.; Khalil, I.A.; Shah, H. Nutritional yield and oil quality of canola cultivars grown in NWFP. Sarhad J. Agric. 2004, 20, 287–290. [Google Scholar]
  17. Susko, D.J.; Superfisky, B. A comparison of artificial defoliation techniques using canola (Brassica napus). Plant Ecol. 2009, 202, 169–175. [Google Scholar] [CrossRef]
  18. McCormick, J.I.; Virgona, J.M.; Kirkegaard, J.A. Growth and yield of dual-purpose canola (Brassica napus) under drier inland seasonal conditions of south-eastern Australia. Crop Pasture Sci. 2012, 63, 635–646. [Google Scholar] [CrossRef]
  19. Salehian, H.; Rafiey, M.; Fathiand, G.; Siadat, S.A. Effect of plant density on growth and seed yield of colza varieties under Andimeshk conditions. In Proceedings of the 7th Iranian Crop Sciences Congress, Karaj, Iran, 15 March 2007. [Google Scholar]
  20. Sprague, S.J.; Kirkegaard, J.A.; Graham, J.M.; Dove, H.; Kelman, W.M. Crop and livestock production for dual-purpose winter canola (Brassica napus) in the high-rainfall zone of south-eastern Australia. Field Crop. Res. 2014, 156, 30–39. [Google Scholar] [CrossRef]
  21. Al-Jaloud, A.A.; Hussain, G.; Karimulla, S.; Alhamdi, A.H. Effect of irrigation and nitrogen on yield and yield components of two rapeseed cultivars. Agric. Water Manag. 1996, 30, 57–68. [Google Scholar] [CrossRef]
  22. Balint, T.; Rengel, Z.; Allen, D. Australia canola germplasm differs in nitrogen and sulphur defficiency. Aust. J. Agric. Res. 2008, 59, 1164–1174. [Google Scholar] [CrossRef]
  23. Buttar, G.S.; Thind, H.S.; Aujla, M.S. Methods of planting and irrigation at various levels of nitrogen affect the seed yield and water use efficiency in transplanted oil seed rape. Agric. Water Manag. 2005, 85, 253–260. [Google Scholar] [CrossRef]
  24. Cheema, M.A. Production Efficiency of Canola (Brassica napus L.) cv. Shiralee under Different Agro-Management Practices. Ph.D. Thesis, Department of Agronomy, University of Agriculture, Faisalabad, Pakistan, 1999. [Google Scholar]
  25. Zaman, M. Effect of Rate and Time of Nitrogen Application on Growth, Seed Yield and Oil Contents of Canola (Brassica napus L.). Bachelor’s Thesis, Department of Agronomy, University of Agriculture, Faisalabad, Pakistan, 2003. [Google Scholar]
  26. Dahmardeh, M.; Mahmood, R.; Valizadeh, J. Effect of plant density and cultivars on growth, yield and yield components of faba bean (Viciafaba L.). Afr. J. Biotechnol. 2010, 9, 8643–8647. [Google Scholar]
  27. Shengwu, H.; Ovesna, J.; Kueera, L.; Kueera, V.; Vyvadilova, M. Evaluation of genetic diversity of Brassica napusgermplasm from China and Europe assessed by RAPD markers. Plant Soil Environ. 2003, 49, 106–113. [Google Scholar]
  28. Kirkegaard, J.A.; Sprague, S.J.; Lilley, J.M.; McCormick, J.I.; Virgona, J.M.; Morrison, M.J. Physiological response of spring canola (Brassica napus) to defoliation in diverse environments. Field Crop. Res. 2012, 125, 61–68. [Google Scholar] [CrossRef]
  29. Söchtling, H.P.; Verret, J.A. Effects of different cultivation systems (soil management and nitrogen fertilization) on the epidemics of fungal diseases in oilseed rape (Brassica napus L. var. napus). J. Plant Dis. Prot. 2004, 111, 1–29. [Google Scholar] [CrossRef]
  30. Rathke, G.W.; Christen, O.; Diepenbrock, W. Effects of nitrogen source and rate on productivity and quality of winter oilseed rape (Brassica napus L.) grown in different crop rotations. Field Crop. Res. 2005, 94, 103–113. [Google Scholar] [CrossRef]
  31. Akhtar, K.; Wang, W.; Khan, A.; Ren, G.; Afridi, M.Z.; Feng, Y.; Yang, G. Wheat straw mulching offset soil moisture deficient for improving physiological and growth performance of summer sown soybean. Agric. Water Manag. 2019, 211, 16–25. [Google Scholar] [CrossRef]
  32. Saleem, M.; Cheema, A.M.; Malik, A.M. Agro-EconomicAssessment of Canola Planted under Different Levels of Nitrogenand Row Spacing. Int. J. Agric. Biol. 2001, 3, 27–30. [Google Scholar]
  33. Asare, E.; Scarisbrick, D.H. Rate of nitrogen and sulphur fertilizers on yield, yield components and seed quality of oilseed rape (Brassica napus L.). Field Crop. Res. 1995, 44, 41–46. [Google Scholar] [CrossRef]
  34. Omirou, M.D.; Papadopoulou, K.K.; Papastylianou, I.; Constantinou, M.; Karpouzas, D.G.; Asimakopoulos, I.; Ehaliotis, C. Impact on nitrogen and sulfur fertilization on the composition of glucosinolates in relation to sulfur assimilation in different plant organs of broccoli. J. Agric. Food Chem. 2009, 57, 9408–9417. [Google Scholar] [CrossRef]
  35. Holmes, M.R.J. Nitrogen. In Nutrition of the Oilseed Rape Crop; Applied Science Publishers: Barking, UK, 1980; pp. 21–67. [Google Scholar]
  36. Kutcher, H.R.; Malhi, S.S.; Gill, K.S. Topography and management of nitrogen and fungicide affects diseases and productivity of canola. Agron. J. 2005, 97, 533–541. [Google Scholar] [CrossRef]
  37. Brennan, R.F.; Mason, M.G.; Walton, G.H. Effect of nitrogen fertilizer on the concentrations of oil and protein in canola (Brassica napus) seed. J. Plant Nutr. 2000, 23, 339–348. [Google Scholar] [CrossRef]
  38. Ahmad, G.; Jan, A.; Arif, M.; Jan, M.T.; Khattak, R.A. Influence of nitrogen and sulfur fertilization on quality of canola (Brassica napus L.) under rain fed conditions. J. Zhejiang Univ. Sci. B 2007, 8, 731–737. [Google Scholar] [CrossRef]
  39. Narits, L. Effect of nitrogen rate and application time to yield and quality of winter oilseed rape (Brassica napus L. var. oleiferasubvar. biennis). Agron. Res. 2010, 8, 671–686. [Google Scholar]
  40. Chen, X.J.; Zhu, Z.J.; Ni, X.L.; Qian, Q.Q. Effect of Nitrogen and Sulfur Supply on Glucosinolates in Brassica campestris ssp. chiensis. Agric. Sci. China 2006, 5, 603–608. [Google Scholar] [CrossRef]
  41. Zhao, F.; Evans, E.J.; Bilsborrow, P.E.; Syers, J.K. Influence of nitrogen and sulphur on the glucosinolates profile of rapeseed (Brassica napus L.). J. Sci. Food Agric. 2006, 64, 295–304. [Google Scholar] [CrossRef]
  42. Falk, K.L.; Tokuhisa, J.G.; Gershenzon, J. The effect of sulfur nutrition on plant glucosinolates content: Physiology and molecular mechanisms. Plant Biol. 2007, 9, 573–581. [Google Scholar] [CrossRef]
  43. Saeedi, F.H.; Bagheri, H.; Rasoli, S.A.; Ghasemi, J. The effect of planting density on morphological traits of spring canola cultivars in Chaloos region of Iran. Int. J. Agron. Plant Prod. 2013, 4, 911–914. [Google Scholar]
  44. Khan, A.; Zheng, J.; Tan, D.K.Y.; Khan, A.; Akhtar, K.; Kong, X.; Fahad, S. Changes in Leaf Structural and Functional Characteristics when Changing Planting Density at Different Growth Stages Alters Cotton Lint Yield under a New Planting Model. Agronomy 2019, 9, 859. [Google Scholar] [CrossRef] [Green Version]
  45. Khan, A.; Kong, X.; Najeeb, U.; Zheng, J.; Tan, D.K.Y.; Akhtar, K.; Zhou, R. Planting density induced changes in cotton biomass yield, fiber quality, and phosphorus distribution under beta growth model. Agronomy 2019, 9, 500. [Google Scholar] [CrossRef] [Green Version]
  46. Khan, A.; Wang, L.; Ali, S.; Tung, S.A.; Hafeez, A.; Yang, G. Optimal planting density and sowing date can improve cotton yield by maintaining reproductive organ biomass and enhancing potassium uptake. Field Crop. Res. 2017, 214, 164–174. [Google Scholar] [CrossRef]
  47. Gan, Y.; Malhi, S.S.; Brandt, S.; Katepa-Mupondwa, F.; Stevenson, C. Nitrogen use efficiency and nitrogen uptake of juncea Canola under diverse environments. Agron. J. 2007, 100, 285–295. [Google Scholar] [CrossRef]
Figure 1. Annual rainfall, maximum and minimum temperature of the experimental site for 2012–2013 and 2013–2014.
Agronomy 10 00404 g001
Figure 2. The interactive effects of nitrogen levels and cutting treatments (A), nitrogen application timings and cutting treatments (B), and nitrogen application timings and planting densities (C) for oil content. Vertical bars represent Standard Error. Note: Cuttings (C): no-cut (C1), cutting (C2), grazing (C3); Nitrogen levels (NL): 80 kg ha−1(NL1), 120 kg ha−1 (NL2); Nitrogen timings: Full application at sowing (NT1), half dose of N both at sowing and start of rosette stage (NT2), one third dose of N each at sowing, start of rosette stage and soon after cut at late rosette stage (60 days after sowing (NT3); Planting density (PD): 20 plants m−2 (PD1), 40 plants m−2 (PD2).
Agronomy 10 00404 g002
Figure 3. The interactive effect of planting density and cutting treatments of Erucic acid (%) for canola seed. Vertical bars represent Standard Error. Note: Cuttings (C): no-cut (C1), cutting (C2), grazing (C3); Planting density (PD): 20 plants m−2 (PD1), 40 plants m−2 (PD2).
Agronomy 10 00404 g003
Figure 4. Interaction between cutting treatments and nitrogen levels for glucosinulates content. Vertical bars represent Standard Error. Note: Cuttings (C): no-cut (C1), cutting (C2), grazing (C3); Planting density (PD): 20 plants m−2 (PD1), 40 plants m−2 (PD2).
Agronomy 10 00404 g004
Table 1. The detailed presentation of experimental treatments.
Main Plot FactorsTreatment LevelsSub Plot FactorsTreatment Levels
Cuttings (C)No-cut
(C1)
Nitrogen application timings (NT)(1) full application at sowing (NT1)
Cut (C2) (2) half dose of N both at sowing and start of rosette stage (NT2)
Grazing (C3) (3) one third dose of N each at sowing, start of rosette stage and soon after cut at late rosette stage (60 days after sowing (NT3)
Nitrogen Levels (NL)80 kg ha−1 (NL1)Planting density (PD)20 plants m−2 (PD1)
120 kg ha−1 (NL2) 40 plants m−2 (PD2)
Table 2. Mean square table for crop yield, qualitative attributes, glucosinulates, and erucic acid for the years 2012–14.
SOVGrain YieldBiological YieldOil ContentProtein ContentGlucosinulates ContentEurcic Acid
Year134 ns7.397 *1598.49 *10,560.2799.26 *346.56 *
Cuttings (C)1,482,015 *1.383 *18.93 *27.7 ns330.24 *115.59 *
N-levels (NL)204,857 *5,140,844 ns243.63 *135.91547.22 *22.556 ns
Planting densities (PD)45,182 ns4,630,281 *18.84 *1.2 ns1.23 ns6.476 ns
Nitrogen timings (NT)30,938 ns6,378,573 *23.12 *1.9 ns6.18 ns14.529 ns
C × NLns**ns*ns
C × NT*ns*nsns*
C × PDnsnsnsnsnsns
NL × PDnsnsnsnsnsns
NT × NLns*nsnsnsns
NT × PD*ns*nsns*
C × NT × NLnsnsnsnsnsns
C × NT × PDnsnsnsnsnsns
NT × NL × PDnsnsnsnsnsns
C × NL × NT × PDnsnsnsnsnsns
Note: ns = non-significant, * = Significant at 5% level of probability.
Table 3. Biomass yield (kg ha−1) of canola under cutting treatments, nitrogen levels and application timings under different planting densities.
Variables2012–20132013–2014Two Years Average
Cutting treatments (C)
C19695 a9353 a9524a
C27272 b9774 a8523 b
C36080 c8432 b7256 c
LSD (0.05)598631407
Nitrogen levels (NL)
NL180998794 b8446
NL279329578 a8755
Significance levelns*ns
N application timings (NT)
NT17974 ab90238496
NT27700 b94288564
NT38372 a91078739
LSD (0.05)500506352
Planting density (PD)
PD17785 b8584 b8454 b
PD28264 a9787 a8747 a
Significance level***
Year (*) 8016 b 9186 a
Note: Cuttings (C): no-cut (C1), cutting (C2), grazing (C3); Nitrogen levels (NL): 80 kg ha−1(NL1), 120 kg ha−1 (NL2); Nitrogen timings: Full application at sowing (NT1), half dose of N both at sowing and start of rosette stage (NT2), one third dose of N each at sowing, start of rosette stage and soon after cut at late rosette stage (60 days after sowing (NT3); Planting density (PD): 20 plants m−2 (PD1), 40 plants m−2 (PD2). Means of the same category followed by different letters are significantly different at 5 % level of probability using LSD (0.05) test. ns = non-significant, * = Significant at 5% level of probability.
Table 4. Grain yield (kg ha−1) of canola under cutting treatments, nitrogen levels and application timings under different planting densities.
Variables2012–20132013–2014Two Years Average
Cutting treatments (C)
C11291 a1128 a1210 a
C2983 b1068 b1025 b
C3886 c968 c927 c
LSD (0.05)72.054.142.2
Nitrogen levels (NL)
NL11022 b1024 b1023 b
NL21084 a1086 a1085 a
Significance level***
N application timings (NT)
NT11021 b1054 a1045 ab
NT21029 b1058 a1078 a
NT31109 a1052 a1039 b
LSD (0.05)42.564.638.3
Planting density (PD)
PD1106610571039
PD2104410531068
Significance levelnsnsns
Year (ns) 1053 1055
Note: Cuttings (C): no-cut (C1), cutting (C2), grazing (C3); Nitrogen levels (NL): 80 kg ha−1(NL1), 120 kg ha−1 (NL2); Nitrogen timings: Full application at sowing (NT1), half dose of N both at sowing and start of rosette stage (NT2), one third dose of N each at sowing, start of rosette stage and soon after cut at late rosette stage (60 days after sowing (NT3); Planting density (PD): 20 plants m−2 (PD1), 40 plants m−2 (PD2). Means of the same category followed by different letters are significantly different at 5 % level of probability using LSD (0.05) test. ns = non-significant, * = Significant at 5% level of probability.
Table 5. Canola oil content (%) in response to cutting treatments, nitrogen levels and application timings under varying planting densities.
Variables2012–20132013–2014Two Years Average
Cutting treatments (C)
C140.78 a45.95 a43.37 a
C240.03 b45.51 ab42.77 b
C339.51 b45.18 b42.35 c
LSD (0.05)0.670.590.42
Nitrogen levels (NL)
NL141.13 a46.66 a43.89 a
NL239.09 b44.44 b41.77 b
Significance level***
N application timings (NT)
NT139.81 b45.33 ab42.26 b
NT239.77 b45.09 b43.39 a
NT340.74 a46.22 a42.83 ab
LSD (0.05)0.750.900.58
Planting density (PD)
PD140.0045.3542.53 b
PD240.2145.7643.12 a
Significance level*ns*
Year (*) 40.11 b 45.55 a
Note: Cuttings (C): no-cut (C1), cutting (C2), grazing (C3); Nitrogen levels (NL): 80 kg ha−1(NL1), 120 kg ha−1 (NL2); Nitrogen timings: Full application at sowing (NT1), half dose of N both at sowing and start of rosette stage (NT2), one third dose of N each at sowing, start of rosette stage and soon after cut at late rosette stage (60 days after sowing (NT3); Planting density (PD): 20 plants m−2 (PD1), 40 plants m−2 (PD2). Means of the same category followed by different letters are significantly different at 5 % level of probability using LSD (0.05) test. ns = non-significant, * = Significant at 5% level of probability.
Table 6. Canola protein content (%) in response to cutting treatments, nitrogen levels and application timings under varying planting densities.
Variables2012–20132013–2014Two Years
Average
Cutting treatments (C)
C136.2621.56 b28.91 b
C237.2523.00 a30.14 a
C336.1923.21 a29.70 ab
LSD (0.05)2.011.071.06
Nitrogen levels (NL)
NL135.9021.69 b28.79 b
NL237.2623.50 a30.38 a
Significance levelns**
N application timings (NT)
NT135.90 b22.9329.44
NT236.45 ab22.5729.76
NT337.37 a22.5829.55
LSD (0.05)1.420.830.81
Planting density (PD)
PD136.2423.03 a29.5
PD236.9222.16 b29.66
Significance level**ns
Year (*) 22.59 b 36.58 a
Note: Cuttings (C): no-cut (C1), cutting (C2), grazing (C3); Nitrogen levels (NL): 80 kg ha−1(NL1), 120 kg ha−1 (NL2); Nitrogen timings: Full application at sowing (NT1), half dose of N both at sowing and start of rosette stage (NT2), one third dose of N each at sowing, start of rosette stage and soon after cut at late rosette stage (60 days after sowing (NT3); Planting density (PD): 20 plants m−2 (PD1), 40 plants m−2 (PD2). Means of the same category followed by different letters are significantly different at 5 % level of probability using LSD (0.05) test. ns = non-significant, * = Significant at 5% level of probability.
Table 7. Erucic acid (%) canola as affected by cutting treatments, nitrogen levels and application timings under varying planting densities.
Variables2012–20132013–2014Two Years Average
Cutting treatments (C)
C132.3 b31.2 b31.0 b
C234.1 ab33.1 ab32.9 a
C334.7 a33.6 a33.4 a
LSD (0.05)1.941.911.26
Nitrogen levels (NL)
NL133.432.332.1
NL234.132.932.8
Significance levelnsnsns
N application timings (NT)
NT133.932.832.9 a
NT233.932.832.0 b
NT333.332.132.4 ab
LSD (0.05)nsns0.805
Planting density (PD)
PD133.732.632.3
PD233.732.532.6
Significance levelnsnsns
Year (*) 33.72 a 31.2 b
Note: Cuttings (C): no-cut (C1), cutting (C2), grazing (C3); Nitrogen levels (NL) 80 kg ha−1(NL1), 120 kg ha−1 (NL2); Nitrogen timings: Full application at sowing (NT1), half dose of N both at sowing and start of rosette stage (NT2), one third dose of N each at sowing, start of rosette stage and soon after cut at late rosette stage (60 days after sowing (NT3); Planting density (PD): 20 plants m−2 (PD1), 40 plants m−2 (PD2). Means of the same category followed by different letters are significantly different at 5% level of probability using LSD (0.05) test. ns = non-significant, * = Significant at 5% level of probability.
Table 8. Canola glucosinolates content (µ mol g−1) as affected by cutting treatments, nitrogen levels and application timings under varying planting densities.
Variables.2012–20132013–2014Two Years Average
Cutting treatments (C)
C159.97 b66.18 a64.48 a
C262.78 a63.67 b61.82 b
C358.03 c62.46 b60.25 c
LSD (0.05)1.881.911.26
Nitrogen levels (NL)
NL157.59 b61.42 a59.61 b
NL262.93 a66.79 b64.86 a
Significance level***
N application timings (NT)
NT160.0763.7462.45
NT260.2764.2662.23
NT360.4564.3261.87
LSD (0.05)1.071.510.99
Planting density (PD)
PD160.7664.2962.11
PD259.7663.9362.26
Significance levelnsnsns
Year (*) 60.26 b 64.11 a
Note: Cuttings (C): no-cut (C1), cutting (C2), grazing (C3); Nitrogen levels (NL) 80 kg ha−1(NL1), 120 kg ha−1 (NL2); Nitrogen timings: Full application at sowing (NT1), half dose of N both at sowing and start of rosette stage (NT2), one third dose of N each at sowing, start of rosette stage and soon after cut at late rosette stage (60 days after sowing (NT3); Planting density (PD): 20 plants m−2 (PD1), 40 plants m−2 (PD2). Means of the same category followed by different letters are significantly different at 5 % level of probability using LSD (0.05) test. ns = non-significant, * = Significant at 5% level of probability.
Table 9. Economic analysis of dual-purpose canola.
Yield, Value or CostC1C2C3
Forage yield (kg ha−1)0.013.914.1
Grain yield (kg ha−1)12.410.59.5
Straw yield (kg ha−1)92.174.363.8
Forage value (USD)0.069.570.3
Grain value (USD)884.51067.1863.4
Straw value (USD)552.4446.1383.1
Gross income (USD)1436.91582.81316.9
Net income over control (USD)1057.21202.1936.2
Value cost ratio (VCR %)2.783.12.4
Note: Cuttings (C): no-cut (C1), cutting (C2), grazing (C3).
Table 10. The interactive effects of different factors over economic benefits (VCR values).
Plant density m−2CuttingN rateNT1NT2NT3
PD1C1NL12.952.572.82
C1NL22.592.212.71
C2NL13.003.353.00
C2NL22.713.363.17
C3NL13.093.352.92
C3NL22.852.221.58
PD2C1NL12.603.303.10
C1NL23.022.692.80
C2NL13.524.162.57
C2NL23.223.062.83
C3NL12.182.632.07
C3NL22.592.231.96
Note: Cuttings (C): no-cut (C1), cutting (C2), grazing (C3); Nitrogen levels (NL) 80 kg ha−1(NL1), 120 kg ha−1 (NL2); Nitrogen timings: Full application at sowing (NT1), half dose of N both at sowing and start of rosette stage (NT2), one third dose of N each at sowing, start of rosette stage and soon after cut at late rosette stage (60 days after sowing (NT3); Planting density (PD): 20 plants m−2 (PD1), 40 plants m−2 (PD2).

