Article

Divergent Genomic Selection for Herbage Accumulation and Days-To-Heading in Perennial Ryegrass

1
AgResearch Ltd., Grasslands Research Centre, Palmerston North 4410, New Zealand
2
PGG Wrightson Seeds Ltd., Ruakura Research Centre, Hamilton 3214, New Zealand
*
Author to whom correspondence should be addressed.
Agronomy 2020, 10(3), 340; https://doi.org/10.3390/agronomy10030340
Submission received: 27 January 2020 / Revised: 24 February 2020 / Accepted: 26 February 2020 / Published: 2 March 2020

Abstract

:
Increasing the rate of genetic gain for dry matter (DM) yield in perennial ryegrass (Lolium perenne L.), which is a key source of nutrition for ruminants in temperate environments, is an important goal for breeders. Genomic selection (GS) is a strategy used to improve genetic gain by using molecular marker information to predict breeding values in selection candidates. An empirical assessment of GS for herbage accumulation (HA; proxy for DM yield) and days-to-heading (DTH) was completed by using existing genomic prediction models to conduct one cycle of divergent GS in four selection populations (Pop I G1 and G3; Pop III G1 and G3), for each trait. G1 populations were the offspring of the training set and G3 populations were two generations further on from that. The HA of the High GEBV selection group (SG) progenies, averaged across all four populations, was 28% higher (p < 0.05) than Low GEBV SGs when assessed in the target environment, while it did not differ significantly in a second environment. Divergence was greater in Pop I (43%–65%) than Pop III (10%–16%) and the selection response was higher in G1 than in G3. Divergent GS for DTH also produced significant (p < 0.05) differences between High and Low GEBV SGs in G1 populations (+6.3 to 9.1 days; 31%–61%) and smaller, non-significant (p > 0.05) responses in G3. This study shows that genomic prediction models, trained from a small, composite reference set, can be used to improve traits with contrasting genetic architectures in perennial ryegrass. The results highlight the importance of target environment selection for training models, as well as the influence of relatedness between the training set and selection populations.

1. Introduction

Pastures based on perennial ryegrass (Lolium perenne L.) are the principal source of nutrition for ruminant livestock in temperate environments across the globe. The harvestable dry matter yield (DM yield) is regarded as an important factor influencing livestock production per hectare [1]. The profitability of dairy farms in countries such as New Zealand and Australia, and the international competitiveness of these industries, are closely linked to the consumption of homegrown forage [2] because it is a low-cost feed source. The contribution of DM yield to farm profitability is formally recognised in economic indices used for ranking ryegrass cultivars in Ireland [3,4], New Zealand [5], and Australia [6]. Increasing the annual DM yield of perennial ryegrass, and manipulating the seasonal yield to align with animal nutritional requirements, are therefore critical targets for forage breeders [1,7].
Estimates of the rate of genetic gain for annual DM yield in perennial ryegrass vary by location [7], but European and Australasian studies have placed the rate at between 0.2% and 0.6% per annum under grazing [7,8,9,10]. This is low, particularly when contrasted against gains of up to 1.6% per annum realized for grain yield in major cereal crops [11]. The relatively slow rate of genetic progress for DM yield in forages has been ascribed to long breeding cycles, the inability to fully-exploit either heterosis or a harvest index, and the necessity for breeders to concurrently improve a range of other economic traits [12].
The low rate of improvement may also be attributable to a lack of direct selection for DM yield in breeding programs [13]. Breeding for DM yield directly usually involves full-sibling (FS) or half-sibling (HS) family selection under realistic sward conditions, such as sown plots, over a number of years. The resource required to undertake this can be challenging and limits the number of families that can be assessed [7], particularly because trials should also be replicated in multiple environments to account for genotype-by-environment interactions [14]. Breeding strategies may instead utilize approaches such as applying DM yield selection amongst large numbers of synthetic populations or candidate cultivars to identify superior lines for advancement, and/or applying phenotypic selection on spaced plant vigor or DM production [15], which typically demonstrate weak genetic correlations with sward DM yield [16,17]. Less commonly, breeders have sown single rows for family evaluation, with 2 m single rows demonstrating a strong phenotypic correlation (r = 0.86) with 1.5 m × 5 m plots for DM yield (M.Z.Z. Jahufer, unpublished data).
Genomic selection (GS) is a compelling option for improving the rate of genetic gain for DM yield in perennial outcrossing species such as perennial ryegrass [18]. In GS, the effects of genome-wide single nucleotide polymorphism (SNP) markers on traits are integrated to predict trait performance or breeding value for individuals that have been genotyped, but may not have been phenotyped for the trait of interest [19]. The application of GS first involves the establishment of a training population, consisting of individuals with both genome-wide SNP marker genotypes and phenotypic data for the trait of interest. These data are used to derive a statistical model that predicts the effects of SNP markers on the trait, with all marker effects fitted simultaneously. Only selection candidates (e.g., seedlings) are genotyped and these data are provided to the prediction model to obtain genomic estimated breeding values (GEBVs). Superior genotypes are subsequently selected based on GEBVs and recombined to create the next generation or to develop a synthetic population.
The most cited advantage of GS over conventional selection is the potential to shorten the breeding cycle by enabling selection decisions to be made at an early developmental stage, increasing the number of selection cycles and thereby genetic gain per unit time. In family-based breeding systems, GS also provides an opportunity to enhance the genetic gain from a single selection cycle [20], by applying among-and within-family selection [13]. This involves ranking families assessed in the breeding program based on phenotypic information and then using GS to apply selection within the highest-ranked families, leveraging the ¾ (HS) or ½ (FS) within-family additive genetic variation that is typically inaccessible by conventional breeding for traits such as DM yield. GS also enables the application of higher selection intensities because the cost of predictive screening of individuals for DM yield, for example, is likely to be lower than direct measurement, despite the fact that consideration must be given to consequent reductions in genetic diversity and inbreeding risk [21].
In recent years, genomic prediction models have been developed for ryegrass and their prospective utility evaluated, principally using cross-validation approaches. Prediction models have been trained based on HS family [20,22,23] and FS family [24,25] evaluation in plots or rows and also by utilizing phenotypic records from synthetic populations assessed as plots in a commercial breeding program [26]. These studies have demonstrated the potential of GS as a tool to accelerate improvement for agronomic traits in ryegrass, as well as indicating ways forward for the implementation of GS in breeding programs.
The relative infancy of GS in forage plant breeding, and the time required to evaluate long-term traits such as DM yield, mean that there are currently few reports on the impact of GS on realized performance. The purpose of this study was to determine if the application of divergent genomic selection using genomic prediction models trained for herbage accumulation (HA; [20], a proxy for DM yield potential), would elicit a selection response from breeding populations with differing levels of relatedness to the original training set. As a comparison, independent genomic selections were also made for days-to-heading (DTH), which is a genetically simpler trait of higher heritability, using a prediction model developed with the same training set.

2. Materials and Methods

2.1. Genotyping and Determination of GEBVs

Models for the genomic prediction of herbage accumulation (HA) and days-to-heading (DTH) were developed previously, using data from a training set composed of five discrete breeding populations (Pop I to V) [20]. In that study, prediction models were trained using genotyping-by-sequencing (GBS) SNP genotypes from the maternal parent plants in the training set, with phenotypic data acquired from HS families of the respective maternal parents by evaluating sown plots under field conditions at multiple locations. In the current study, the HA and DTH prediction models developed were applied for divergent genomic selection in each of four synthetic selection populations (Table 1) sourced from the Grasslands Innovation Ltd. breeding program. In all cases, the selection populations were descended from two of the corresponding training set populations (Pop I or Pop III) that had been used to derive the HA and DTH prediction models (Figure S1). The selection populations were either the direct offspring (Pop I G1 and Pop III G1) of the training set generation or were from a more advanced generation (Pop I G3 and Pop III G3). The G3 selection populations had arisen because, while the training set trials described in [20] were being conducted, breeding from training set populations had continued separately in the Grasslands Innovation Ltd. breeding program (for non-DM yield traits). The G3 selection populations are therefore advanced generations derived after two further cycles of conventional selection and recombination.
GEBVs were derived for a total of 970 individuals from the four selection populations (n = 177–280 individuals per population; Table 1). For each of Pop I G1 and Pop III G1, there was a known HS family structure. For those populations, seeds for germination, genotyping, and subsequent GEBV determination were taken from six randomly-chosen HS families within each population. For Pop I G3 and Pop III G3, there was no recognised family structure and for those populations, seeds for germination, genotyping, and GEBV determination were chosen randomly from a bulk sample. Seeds for all but Pop III G3 were germinated and grown under standard greenhouse conditions for approximately four weeks, until two tillers had emerged, before sampling tissue for DNA analysis. For Pop III G3, pseudostem tissue was supplied directly by Grasslands Innovation Ltd. and provided for genotyping. DNA was isolated from 50–100 mg of harvested pseudostem tissue using a semi-automated method for the extraction of sequencing-quality high molecular weight DNA from plants [27]. Each seedling was also subject to an immuno-detection blot [28], to confirm the presence of fungal endophyte (Epichloë festucae var lolii).
Methods for GBS library development, the sequencing of GBS libraries, sequence data processing, genotype calling, and genomic relationship matrix (GRM) estimates were as described in [20]. Briefly, 96-plex GBS libraries were generated for the 970 seedlings by digesting 100 ng of DNA with ApeKI (New England Biolabs, Ipswich, MA, USA) and ligating to a unique barcoded adapter and a common adapter (99 ng). Libraries were size-selected for fragments of 193–313 bp using a Pippin PrepTM DNA size selector (Sage Science, Beverly, MA, USA). Each library was sequenced on one lane of an Illumina HiSeq 2500 (Illumina, San Diego, CA, USA) at AgResearch Invermay, New Zealand. Raw reads from the selection population GBS libraries were merged with those previously generated for the training set [20] and SNP calling was conducted jointly using the TASSEL 5.0 GBS pipeline [29] with a ryegrass reference genome [20,30]. After filtering for missing SNPs (50% maximum missing per site), minor allele frequency (>0.05), and read depth (>2), the allelic counts of the remaining biallelic SNPs were exported to KGD software (https://github.com/AgResearch/KGD) [31] and further filtering based on Hardy−Weinberg disequilibrium (Hardy-Weinberg disequilibrium >−0.05, estimated as the observed frequency of the reference allele homozygote minus its expected value) was applied within the software, as recommended by [31]. A cut-off value of >−0.05 was applied to filter SNPs potentially from duplicated or repetitive regions of the genome. KGD is an approach for kinship estimation which accounts for the (low) read depth of the GBS data and does not require imputation. The KGD method outputs a GRM (may be referred to as a KGD matrix hereafter). GEBVs of the selection candidates were derived by Genomic Best Linear Unbiased Prediction (GBLUP) for the mean HA under each of the five environments described in [20], including the Waikato standard and severe summer defoliation, Manawatu standard and severe summer defoliation, and Canterbury standard summer defoliation. GEBVs for DTH were derived using a model that had been developed for a prediction of the mean DTH using data from two environments (Waikato and Canterbury, the latter in the South Island of New Zealand) [20].

2.2. Selection and Polycross Isolations

For HA, divergent selections were made in each selection population based on a simple additive index of HA GEBVs (models described in [20]), weighted towards growth in the Waikato environment, which is considered most challenging for ryegrass growth [32,33]:
HA index = 0.3 × (Waikato standard GEBV) + 0.3 × (Waikato severe GEBV) + 0.2 × (Manawatu severe GEBV) + 0.1 × (Manawatu standard GEBV) + 0.1 × (Canterbury standard GEBV).
Both DTH GEBV and HA index GEBV were calculated for 970 individuals, but, due to either a nil endophyte status or seedling mortality, selections were confined to a total of 795 individuals (Table 1). Prior to selection, 15 individuals were randomly taken from each population to create a control (Non-selection group). Within the remainder of each selection population, the top 10% (High GEBV group) and bottom 10% (Low GEBV group) were identified for each of DTH and HA index, and 15 individuals were randomly selected from within each group for poly-crossing to enable progeny testing. The same Non-selection group was used for both HA and DTH in each selection population, so a total of 20 polycrosses were completed (four populations × two traits x High GEBV, Low GEBV; plus four populations × Non-selection groups) under isolation during spring 2016 at Palmerston North, New Zealand. Maternal HS family seed was harvested from individual plants within each polycross and balanced bulks made by combining equal seed quantities from all HSs to create a synthetic population (Syn1) for each of the 20 selection groups (hereafter referred to as SGs).

2.3. Evalaution Trials

Field trials for both DTH and HA were established at AgResearch Ruakura in Waikato (37.78° S, 175.32° E) and AgResearch Grasslands in Manawatu (40.21° S, 175.37° E), New Zealand. In both trials, soil fertility levels were adjusted to ensure that nutrients were not limiting plant growth. Nitrogen was applied (15–30 kg N/ha) at each defoliation. Superphosphate fertilizer (8.8 kg P/ha) was applied in late autumn each year. Plants in both HA and DTH trials were defoliated by sheep grazing whenever they reached the 2–3 leaf stage of development, except (a) when harvests were taken in the HA trials, in which case the plants were defoliated manually (see below), and (b) in the DTH trials from 8 September to 31 December, when the trials were closed to grazing to allow flowering to proceed.
For DTH, 25 random plants per SG were transplanted into spaced plant field trials in May 2017, at 40 cm spacing between plants in a row-column design with 45 repeated clonal checks (three check plants × 15 clones). DTH was measured in every plant as the number of days after 22 October until five fully-emerged flower heads were observed, in both 2017 and 2018. For HA index selections, the experimental SGs and two check cultivars were direct-drilled as 2 m rows (0.6 g seed per row) in a row-column design with n = 4 replicates. Eight discrete harvests (Table S1) were completed at each site by manual cutting, drying, and weighing of herbage to determine grams of DM per 2 m row, following the methodology described in [20]. HA was determined as the mean g DM per row across all harvests.
For DTH and HA trials, data were analysed by a linear mixed model, using the variance component analysis procedure residual maximum likelihood (REML) option in DeltaGen software v 0.03 (http://agrubuntu.cloudapp.net/PlantBreedingTool/) [34]. For DTH repeated clonal checks, year, location, and SG were treated as fixed effects, while rows and columns were treated as random. For HA, repeated checks, location, harvest date, and SG were treated as fixed effects, while replicates, rows, and columns were treated as random. The final SG values were generated as best linear unbiased estimates (BLUEs) [35].

3. Results and Discussion

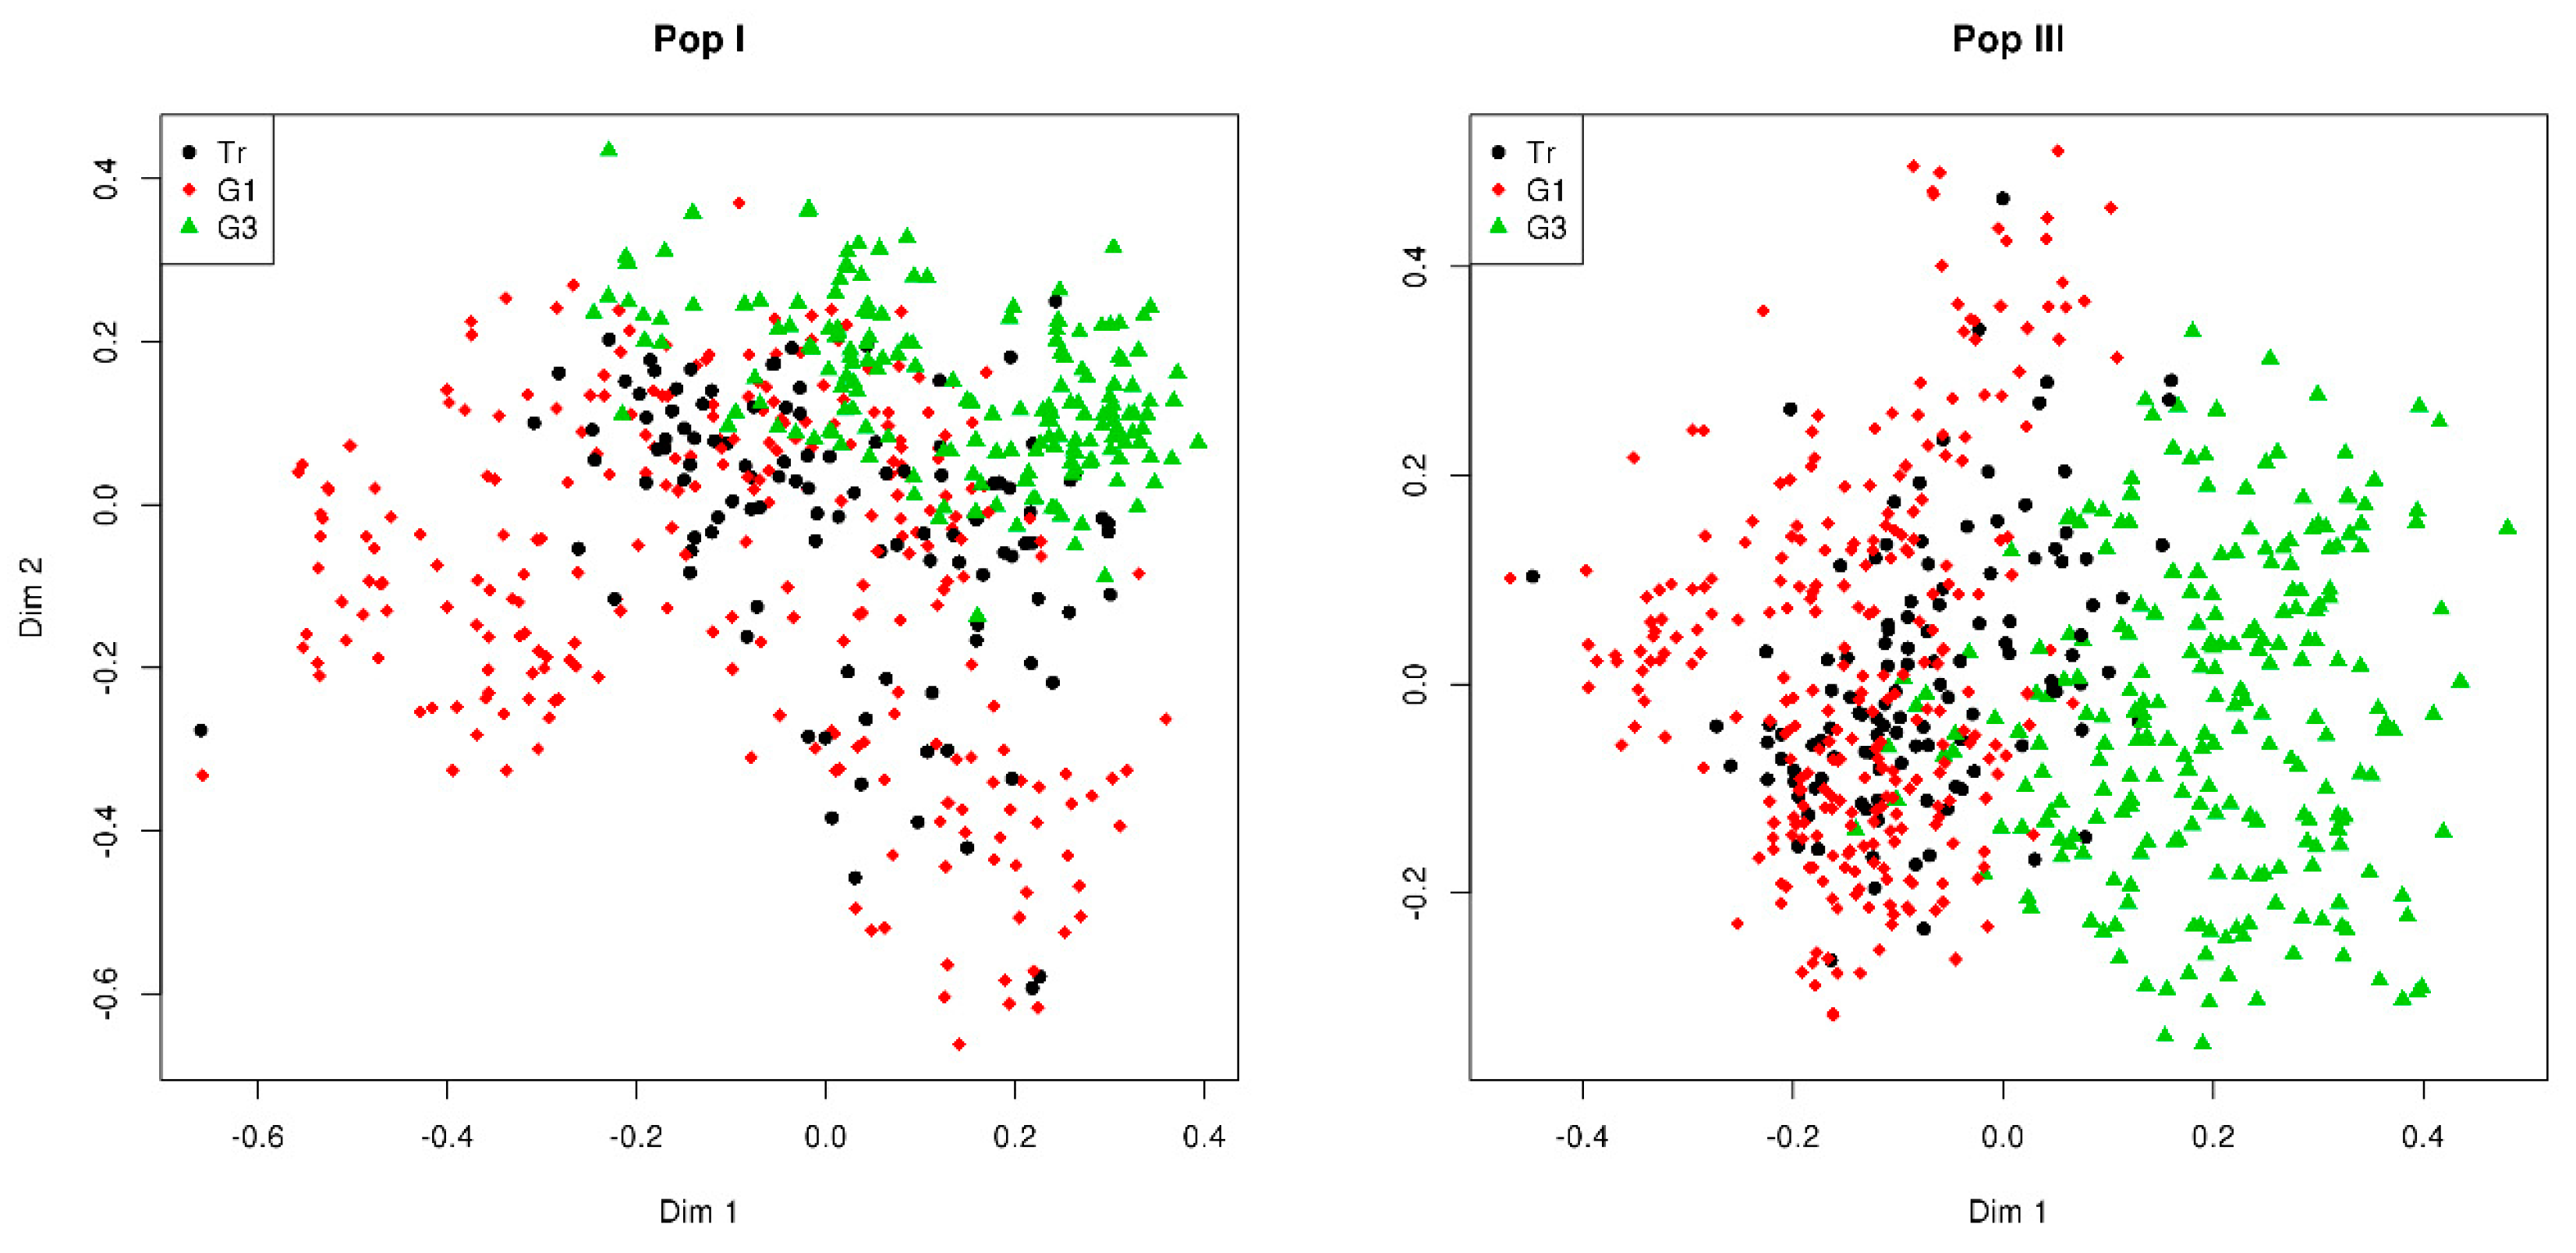
3.1. GBS Data and GEBVs

Genotypes were called jointly amongst training set and selection population individuals and used to construct a genomic relationship matrix (Table S2) based on 777 k SNPs. Selection populations showed close genetic alignment to their training set progenitors (Figure 1), but the G3 populations were more distal than the G1 populations, most noticeably for Pop III. This was reflected in the mean relatedness coefficients estimated for selection populations and their training set counterparts (Table 1), with relatedness to the training set generation declining by 7% from training to G1 and by 26% from training to G3, in both Pop I and Pop III. Within-population genomic diversity was assessed based on the mean relatedness coefficient amongst individuals within the population. This was reduced in G1 and G3 generations for both Pop I and Pop III relative to the training generation, with a greater reduction in G3 (Table 1). The decline in genetic diversity in the G3 populations is likely a result of selection imposed (for non-DM yield traits) between the training and G3 generations in both sets of material, as previously observed in ryegrass populations under selection [36]. The decrease in diversity between training and G1 generations was presumably affected by selection being focused on only six of the 112–121 HS families represented in the training generations of Pop I and III.
GEBVs for five HA traits (mean HA under Waikato standard summer defoliation, Waikato severe summer defoliation, Manawatu standard and severe summer defoliation, and Canterbury standard summer defoliation) and DTH were successfully generated for 970 individuals, using previously defined KGD-GBLUP prediction models for those traits. At this point, a total of 175 individuals were discarded from the selection process due to mortality or because they returned a negative endophyte immunoblot result (Table 1). Following GEBV-directed selection, poly-crossing, and seed harvest, progeny HS families were bulked into Low GEBV, Non-selected, and High GEBV selection groups (SGs) for each selection population x trait combination (n = 20 SGs in total; Non-selected SG’s were shared for the two traits). The SGs were subsequently placed in field evaluation trials for the measurement of DTH or HA. Polycrosses yielded between 29.4 and 143.9 g seed (mean = 78.1 g), approximately equivalent to 15,000 and 72,000 seeds (mean = 39,000), assuming a thousand-seed weight of 2 g.

3.2. Phenotypic Evaluation of Divergent Genomic Selections

3.2.1. Genomic Selection for DTH

Days-to-heading (DTH) was investigated in this study as a test trait characterized by a moderate-high heritability [25,37], in contrast to the low-moderate heritability trait—DM yield [38,39]. Days-to-heading was measured in the SGs over two consecutive years at both Manawatu and Waikato sites and DTH BLUE values were estimated for each SG (Low GEBV, High GEBV, and Non-selected) from each of the four selection populations, across sites and years. Assuming successful divergent genomic selection, the expected selection response is a ranking of High GEBV > Non-selected > Low GEBV. A trend of High GEBV > Low GEBV was observed in all of the selection populations, but the magnitude of the response varied amongst the populations (Figure 2). However, Non-selected SGs did not consistently rank between High GEBV and Low GEBV SGs in three of the populations and this asymmetry in the selection response is discussed further below. Statistically significant (p < 0.05) differences between High and Low GEBV SGs were detected in both G1 populations (6.3–9.1 days; 31%–61%), while smaller, non-significant (p > 0.05) differences were observed in their G3 counterparts (4.1 days in both; 13%–19%). While the latter is suggestive of a multi-generational genomic selection response, the apparent decline from G1 (direct offspring of the training set) to G3 (advanced generation) does indicate a decay in the predictive ability of the model. This decay was apparently associated with an increased genetic distance from the training set to G1 to G3, inferred from the mean relatedness (Table 1). The accuracy of genomic prediction models has often been observed to decrease with an increased genetic distance or number of meioses from the training set [40,41,42,43]. This is likely exacerbated by the use of GBLUP as the statistical method for conducting genomic prediction, in conjunction with the small training set size (n = 517) [20]. The GBLUP method principally exploits genomic relationships, which decay faster over generations than the more generationally-persistent linkage disequilibrium (LD) between SNPs and quantitative trait loci (QTL) [43,44]. The diminished response observed in the G3 populations may also have been affected by the level of available genetic variation in these populations, which was apparently lower than that of their G1 counterparts, based on estimates of within-population relatedness (Table 1).
In certain selection populations, when comparing Low and High GEBV SGs to the performance of the Non-selected SG, the selection response was asymmetric. For example, in Pop I G1, genomic selection was most effective in increasing DTH, with no significant reduction in DTH in the Low GEBV relative to the Non-selected SG. The reverse was observed for Pop III G1, with no significant increase in DTH in the High GEBV relative to the Non-selected SG (Figure 2). This may reflect differences between Pop I and Pop III in terms of heterozygosity or fixation at key QTL that affect late and early heading, respectively. This pattern of response was most pronounced when considering data from the Manawatu site alone, while the pattern was present, but diminished, at Waikato (Figure S2). Waikato was one of the two locations in which the DTH genomic prediction model was trained, whereas Manawatu was not [20].
The lack of a significant selection response towards later heading in Pop III G1 is also interesting when placed alongside the fact that the mean DTH of the Pop III G3 population was significantly (p < 0.05) higher compared to its Pop III G1 counterpart (+6.8 days between Non-selected SGs; Figure 2). The higher DTH in Pop III G3 is consistent with the fact that phenotypic recurrent selection for later heading had been undertaken between G1 and G3 in the conventional breeding program (Dr Richard George, pers comm). This indicates that genetic variance for later heading must be present in Pop III G1, but for some reason, it was not captured by the genomic prediction model and therefore, there was no shift to a higher DTH in Pop III G1 when GS was applied. This may be a consequence of the relatively small, multi-population training set used to develop the prediction model—later-heading families from Pop III may not have been sufficiently represented in the training set. It may also be that large-effect QTL for the heading date were not in LD or linkage with SNPs in the training set and therefore not captured in the prediction model, although this seems less likely given the high density of SNPs used in the genomic prediction model. Although it has yet to be adequately demonstrated using real data [25], the use of non-GBLUP statistical prediction approaches, such as Bayesian models, which assume non-uniform SNP-specific variances, may be more effective for traits such as DTH, for which the genetic architecture is understood to include large-effect QTL [45]. The phenotypic selection response observed in Pop III G3 may also have been influenced by non-additive genetic effects [25] that were not accounted for in a genomic prediction model based on additive genetic variance.

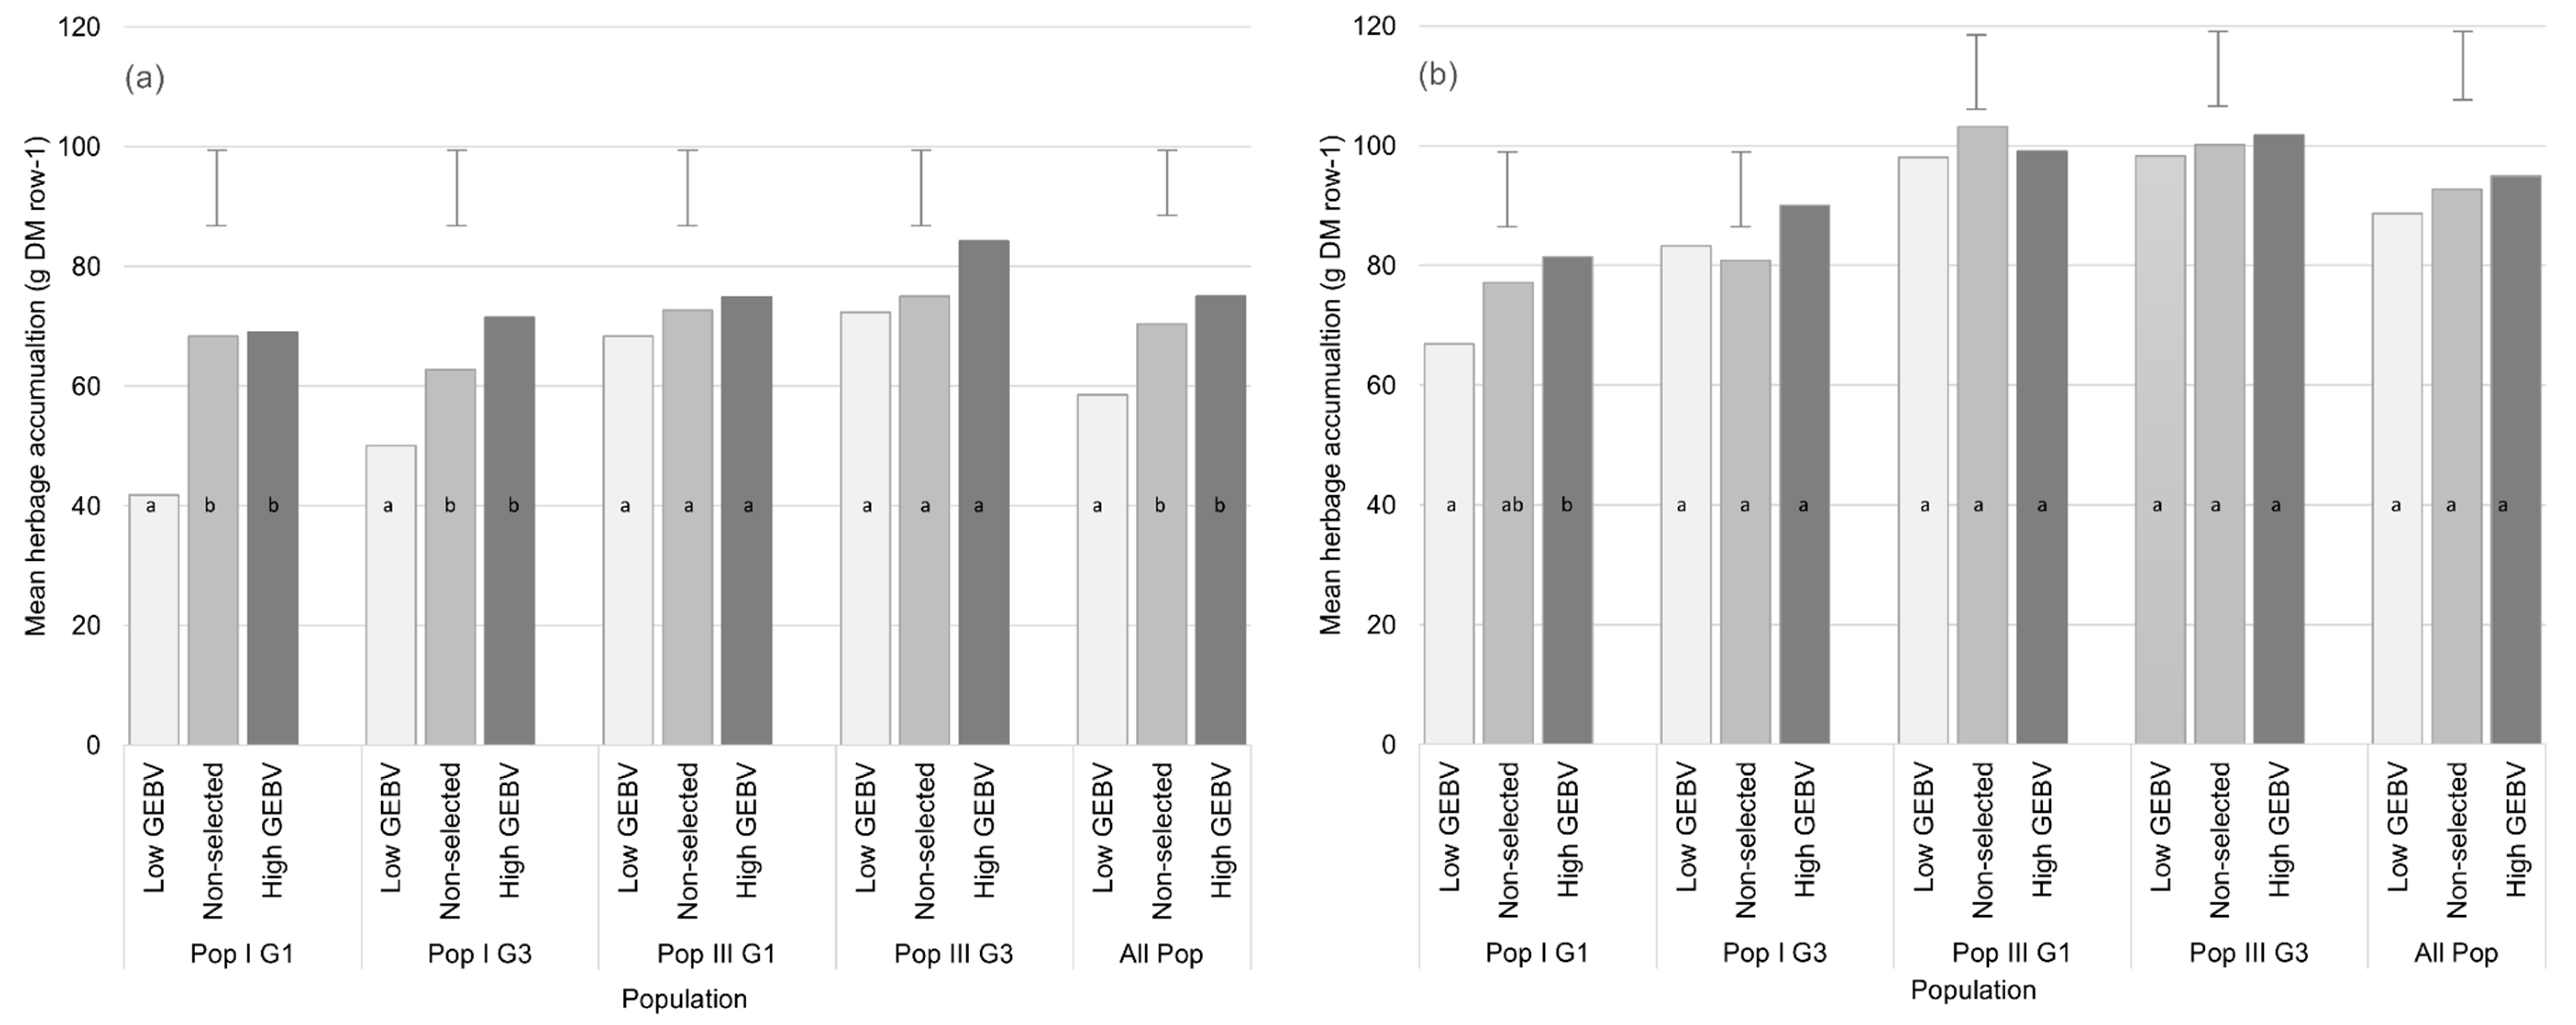
3.2.2. Genomic Selection for HA

Herbage accumulation (HA) harvests were completed at both locations, at seven (Waikato) or eight (Manawatu) seasonal time points, between January and October 2019 (Table S1). The timing of harvests was not consistently aligned between sites and therefore, the assessment of the genomic selection response here focuses on HA BLUEs estimated for each SG (Low GEBV, High GEBV, and Non-selected) across all harvests, within the respective locations. This was completed for each selection population individually, as well as for the four populations combined (All Pop).
Based on the All Pop analysis, SGs performed better overall in the Manawatu environment compared with Waikato, based on the mean HA at the respective sites (Figure 3, Table 2). The response to divergent GS for HA also showed an apparent effect of the environment. In the All Pop analysis, significant (p < 0.05) differences in HA amongst High GEBV, Low GEBV, and Non-selected SGs were detected at the Waikato site, but not Manawatu (Figure 3, Table 2), and the expected ranking of High GEBV > Non-selected > Low GEBV was observed at Waikato only. As with DTH, there was an asymmetric nature evident in the genomic selection response at Waikato, albeit considerably influenced by one of the four selection populations—Pop I G1 (see below). At Waikato, the High GEBV SGs performed significantly (p < 0.05) better than the Low GEBV SGs (+28%), and the Non-selected SG was also significantly (p < 0.05) higher than the Low GEBV (+20%) (Table 2). However, the difference between the High GEBV and Non-selected SGs was small and non-significant (+7%; p > 0.05). In addition to the potential underlying causes outlined for DTH above, asymmetry in the selection response for HA may also have been influenced by non-additive genetic effects, such as heterosis, which were not accounted for in the genomic prediction model, but which may be significant for the Syn1 generation studied here.
At Waikato, the expected response to selection was also observed when the four populations were considered individually (Figure 3, Table 2). Strong responses occurred in both Pop I G1 and Pop I G3, with significant (p < 0.05) HA increases of 65% and 43% between the Low and High GEBV SGs of the respective populations. As noted above, the selection response in Pop I G1 was highly asymmetric, with no discernable difference between the High GEBV and Non-selected SGs. In Pop I G3, there was a similarly asymmetric selection response, but the Non-selected SG was more clearly intermediate compared to the Low and High GEBV groups, despite only being significantly different (p < 0.05) to the Low GEBV SG. Overall, these data indicate a stronger effect of genomic selection for reducing DM yield than for increasing DM yield. The expected ranking of SGs was also observed for both of the Pop III selection populations at Waikato, but differences amongst High GEBV, Low GEBV, and Non-selected SGs were not statistically significant (p > 0.05). At Manawatu, a directional response to GS was only observed in one of the four populations—Pop I G1 (Figure 3)—although differences amongst the SGs in that population were statistically non-significant (p > 0.05).
Our research is aligned to the paradigm of breeding for DM yield for broad adaptation across agricultural environments. However, a unified multi-environment HA genomic prediction model was not available for testing in this experiment, because at the training stage across-environment, adjusted means for HA were not successfully generated, largely due to the influence of significant genotype-by-environment interactions [20]. Instead, we conducted GS using a weighted index of GEBVs for HA performance in each of the five individual training environments (Equation (1)) and this index was substantially weighted (60%) towards Waikato environments. The difference in the selection response observed between the two locations, with a significant response seen in Waikato but not Manawatu, most likely reflects the weighting of the GEBV index and emphasizes the importance of phenotyping the training set within the target environment(s) [46]. In [20], it was noted that developing a model for the genomic prediction of HA across all New Zealand environments may be difficult to achieve, due to genotype-by-environment interactions, and the results here also reflect that it may not be feasible to set breeding for DM yield broad adaptation as a principle breeding goal. The comparatively low predictive abilities of the HA prediction models [20] applied (see below) are also likely to have influenced the overall selection responses observed for HA. This was likely affected by both the small size and the composite nature of the training set [23]. Future optimization of genomic selection should focus on increasing the training set size and a careful consideration of its composition [22] with regards to relatedness to the intended selection population(s). Expansion of the size of training sets for DM yield should be possible, with the advent of non-destructive sensor-based tools for measuring DM yield in plots [47,48], set to overcome phenotyping bottlenecks.
Our results, for HA as well as DTH, also indicated an overall difference in the selection response between Pop I and Pop III, with Pop I showing larger differentials between the Low and High GEBV SGs in both G1 and G3 (Figure 3, Table 2). This suggests an influence of the genetic background on the GS response, although the underlying basis for this is not readily explained. Both Pop I and Pop III were equally represented in the original training set. The predictive abilities of the five HA prediction models, estimated by cross-validation in the training set [20], were not markedly different for the two populations, ranging from r = 0.08 to 0.30 in Pop I (mean r = 0.18) and r = 0.05 to 0.27 (mean r = 0.16) in Pop III. Although we assume that the predictive ability in the current study is principally underpinned by the exploitation of genomic relatedness amongst individuals [20], the extent of LD in the respective populations might also contribute to the selection response differences observed between Pop I and Pop III. Global LD was estimated to be considerably lower in Pop III (366 bp at r2 = 0.25) compared to Pop I (1506 bp) in the training set generation [20], and this trend may be expected to have carried through to the generations used for GS, as indicated by the mean relatedness estimates (Table 1).

4. Conclusions

This study shows that GS can be effective in perennial ryegrass to improve traits with contrasting genetic architectures, including dry matter yield. The variation in the observed response to genomic selection highlights the importance of target environment selection for training prediction models, the influence of relatedness between the training set and selection populations, and a contribution of genetic background. Indicative GS responses observed in the G3 selection populations, which were generationally more distant to the training set, suggests that genomic selection may be effective over multiple cycles of recurrent selection, even when a small, composite population of plants is used to train the genomic prediction models. However, this, and the underlying causes for asymmetry and population-specificity in genomic selection responses, require further investigation.

Supplementary Materials

The following are available online at https://www.mdpi.com/2073-4395/10/3/340/s1: Figure S1: Schematic showing the relationship between the perennial ryegrass training and selection populations used in this study. G1 = offpsring generation of the training set; G3 = advanced generation resulting from two cycles of conventional selection (for non-DM yield traits) and recombination. Training set populations Pop II, IV, and V were not subject to genomic selection in this study; genetic relationships amongst training set populations are described in [20]; Figure S2: Days-to-heading for Low GEBV, High GEBV, and Non-selected selection group (SG) progeny samples (n = 25 per SG) generated by genomic selection from four populations (Pop I G1, Pop I G3, Pop III G1, and Pop III G3). Data are BLUEs across two seasons, for the performance at the two locations (a) Waikato and (b) Manawatu. Within each population, SG bars with different letters are significantly different (p < 0.05) based on least significant difference (L.S.D 0.05); Figure S3: Herbage accumulation (from n = 8 seasonal harvests across two environments) measured as the dry matter yield per plot, for Low GEBV, High GEBV, and Non-selected selection group (SG) progenies, generated by genomic selection from four populations (Pop I G1, Pop I G3, Pop III G1, and Pop III G3), and combined across all populations (All Pop). Data are BLUEs for the average performance across two locations (Waiakto and Manawatu). Within each population, SG bars with different letters are significantly different (p < 0.05), as supported by least significant difference (L.S.D 0.05) error bars; Table S1: Schedule of measurements undertaken for herbage accumulation (HA, recorded as the dry matter yield per 2 m row) and days-to-heading (DTH, recorded as the number of days after 22 October) in trials located at Waikato and Manawatu; Table S2: Genomic relationship matrix.csv; Table S3: Genotypic (σ2g), genotype-by-harvest (σ2gh), genotype-by-location (σ2gl), and experimental error (σ2ε) variance components and their associated standard errors (± SE) when analysed based on the selection group (Low GEBV, Non-selected, and High GEBV × four selection populations) and by selection category (selection groups combined across all populations) for mean herbage accumulation within- and across-location. Italicized numbers indicate a non-significant (p > 0.05) variance component.

Author Contributions

M.J.F., B.A.B., S.G., and M.Z.Z.J. conceived and designed the experiments; J.S., D.L.R., S.W.H., R.G., and M.J.F. performed the experiments; M.J.F., M.C., S.G., and M.Z.Z.J. analysed the data; M.J.F., M.C., B.A.B., and M.Z.Z.J. wrote the paper. All authors have read and agreed to the published version of the manuscript.

Funding

This research was funded by Pastoral Genomics: PSTG1501, Ministry of Business, Innovation and Employment: C10X1306.

Acknowledgments

The research was funded by (1) Pastoral Genomics (grant number PSTG1501), a joint venture co-funded by DairyNZ; Beef + Lamb New Zealand; Dairy Australia; AgResearch Ltd.; Barenbrug Agriseeds Ltd.; Grasslands Innovation Ltd.; and the Ministry of Business, Innovation and Employment, New Zealand (MBIE); (2) MBIE programme “Genomics for Production and Security in a Biological Economy” (grant number C10X1306); and (3) AgResearch Core Funding. We thank Alan Stewart and Derek Woodfield (Grasslands Innovation Ltd.), for access and advice on the ryegrass germplasm used for this study. We thank Ken Dodds (AgResearch) and an anonymous reviewer for their useful comments that helped to improve the quality of this manuscript.

Conflicts of Interest

The authors declare no conflicts of interest.

References

  1. Williams, W.; Easton, H.; Jones, C. Future options and targets for pasture plant breeding in New Zealand. N. Z. Agric. Res. 2007, 50, 223–248. [Google Scholar] [CrossRef] [Green Version]
  2. Thorrold, B.S.; Doyle, P.T. Nature or nurture–forces shaping the current and future state of dairy farming in New Zealand and Australia. In Meeting the Challenges for Pasture Based Dairying, Proceedings of the 3rd Australasian Dairy Science Symposium; University of Melbourne: Melbourne, VIC, Australia, 18–20 September 2007. [Google Scholar]
  3. McEvoy, M.; O’Donovan, M.; Shalloo, L. Development and application of an economic ranking index for perennial ryegrass cultivars. J. Dairy Sci. 2011, 94, 1627–1639. [Google Scholar] [CrossRef] [PubMed]
  4. O’Donovan, M.; McHugh, N.; McEvoy, M.; Grogan, D.; Shalloo, L. Combining seasonal yield, silage dry matter yield, quality and persistency in an economic index to assist perennial ryegrass variety selection. J. Agric. Sci. 2017, 155, 556–568. [Google Scholar] [CrossRef]
  5. Chapman, D.; Bryant, J.; Olayemi, M.; Edwards, G.; Thorrold, B.; McMillan, W.; Kerr, G.A.; Judson, G.; Cookson, T.; Moorhead, A.; et al. An economically based evaluation index for perennial and short-term ryegrasses in New Zealand dairy farm systems. Grass Forage Sci. 2017, 72, 1–21. [Google Scholar] [CrossRef]
  6. Leddin, C.; Jacobs, J.; Smith, K.; Giri, K.; Malcolm, B.; Ho, C. Development of a system to rank perennial ryegrass cultivars according to their economic value to dairy farm businesses in south-eastern Australia. Anim. Prod. Sci. 2018, 58, 1552–1558. [Google Scholar] [CrossRef]
  7. Wilkins, P.W.; Humphreys, M.O. Progress in breeding perennial forage grasses for temperate agriculture. J. Agric. Sci. 2003, 140, 129–150. [Google Scholar] [CrossRef]
  8. Easton, H.S.; Amyes, J.M.; Cameron, N.E.; Green, R.B.; Kerr, G.A.; Norriss, M.G.; Stewart, A.V. Pasture plant breeding in New Zealand: Where to from here? N. Z. Grassl. Assoc. 2002, 64, 173–179. [Google Scholar]
  9. McDonagh, J.; O’Donovan, M.; McEvoy, M.; Gilliland, T.J. Genetic gain in perennial ryegrass (Lolium perenne) varieties 1973 to 2013. Euphytica 2016, 212, 187–199. [Google Scholar] [CrossRef] [Green Version]
  10. Sampoux, J.-P.; Baudouin, P.; Bayle, B.; Béguier, V.; Bourdon, P.; Chosson, J.-F.; Deneufbourg, F.; Galbrun, C.; Ghesquière, M.; Noël, D.; et al. Breeding perennial grasses for forage usage: An experimental assessment of trait changes in diploid perennial ryegrass (Lolium perenne L.) cultivars released in the last four decades. Field Crop. Res. 2011, 123, 117–129. [Google Scholar] [CrossRef]
  11. Ray, D.K.; Mueller, N.D.; West, P.C.; Foley, J.A. Yield trends are insufficient to double global crop production by 2050. PLoS ONE 2013, 8, e66428. [Google Scholar] [CrossRef] [Green Version]
  12. Humphreys, M.O. The contribution of conventional plant breeding to forage crop improvement. In Proceedings of the 18th International Grassland Congress, Winnipeg, and Saskatoon, SK, Canada, 8–17 June 1997. [Google Scholar]
  13. Casler, M.D.; Brummer, E.C. Theoretical expected genetic gains for among-and-within-family selection methods in perennial forage crops. Crop Sci. 2008, 48, 890–902. [Google Scholar] [CrossRef]
  14. Conaghan, P.; Casler, M.; McGilloway, D.; O’Kiely, P.; Dowley, L. Genotype × environment interactions for herbage yield of perennial ryegrass sward plots in Ireland. Grass Forage Sci. 2008, 63, 107–120. [Google Scholar] [CrossRef]
  15. Casler, M.D. Genetic variation within eight populations of perennial forage grasses. Plant Breed. 1998, 117, 243–249. [Google Scholar] [CrossRef]
  16. Hayward, M.D.; Vivero, J.L. Selection for yield in Lolium perenne. II. performance of spaced plant selections under competitive conditions. Euphytica 1984, 33, 787–800. [Google Scholar] [CrossRef]
  17. Waldron, B.L.; Robins, J.G.; Peel, M.D.; Jensen, K.B. Predicted efficiency of spaced-plant selection to indirectly improve tall fescue sward yield and quality. Crop Sci. 2008, 48, 443–449. [Google Scholar] [CrossRef]
  18. Hayes, B.J.; Cogan, N.O.; Pembleton, L.W.; Goddard, M.E.; Wang, J.; Spangenberg, G.C.; Forster, J.W. Prospects for genomic selection in forage plant species. Plant Breed. 2013, 132, 133–143. [Google Scholar] [CrossRef]
  19. Meuwissen, T.H.E.; Hayes, B.J.; Goddard, M.E. Prediction of total genetic value using genome-wide dense marker maps. Genetics 2001, 157, 1819–1829. [Google Scholar]
  20. Faville, M.J.; Ganesh, S.; Cao, M.; Jahufer, M.Z.Z.; Bilton, T.P.; Easton, H.S.; Ryan, D.L.; Trethewey, J.A.K.; Rolston, M.P.; Griffiths, A.G.; et al. Predictive ability of genomic selection models in a multi-population perennial ryegrass training set using genotyping-by-sequencing. Theor. Appl. Genet. 2018, 131, 703–720. [Google Scholar] [CrossRef] [Green Version]
  21. Lin, Z.; Wang, J.; Cogan, N.O.I.; Pembleton, L.W.; Badenhorst, P.; Forster, J.W.; Spangenberg, G.C.; Hayes, B.J.; Daetwyler, H.D. Optimizing resource allocation in a genomic breeding program for perennial ryegrass to balance genetic gain, cost, and inbreeding. Crop Sci. 2017, 57, 243–252. [Google Scholar] [CrossRef]
  22. Grinberg, N.F.; Lovatt, A.; Hegarty, M.; Lovatt, A.; Skøt, K.P.; Kelly, R.; Blackmore, T.; Thorogood, D.; King, R.D.; Armstead, I.; et al. Implementation of genomic prediction in Lolium perenne (L.) breeding populations. Front. Plant Sci. 2016, 7, 133. [Google Scholar] [CrossRef] [Green Version]
  23. Arojju, S.K.; Cao, M.; Zulfi Jahufer, M.Z.; Barrett, B.A.; Faville, M.J. Genomic predictive ability for foliar nutritive traits in perennial ryegrass. G3 Genes Genomes Genet. 2019. [Google Scholar] [CrossRef] [PubMed] [Green Version]
  24. Fè, D.; Ashraf, B.H.; Pedersen, M.G.; Janss, L.; Byrne, S.; Roulund, N.; Lenk, I.; Didion, T.; Asp, T.; Jensen, C.S.; et al. Accuracy of genomic prediction in a commercial perennial ryegrass breeding program. Plant Genome 2016, 9. [Google Scholar] [CrossRef] [PubMed] [Green Version]
  25. Fè, D.; Cericola, F.; Byrne, S.; Lenk, I.; Ashraf, B.H.; Pedersen, M.G.; Roulund, N.; Asp, T.; Janss, L.; Jensen, C.S.; et al. Genomic dissection and prediction of heading date in perennial ryegrass. BMC Genom. 2015, 16, 1–15. [Google Scholar] [CrossRef] [PubMed] [Green Version]
  26. Pembleton, L.W.; Inch, C.; Baillie, R.C.; Drayton, M.C.; Thakur, P.; Ogaji, Y.O.; Spangenberg, G.C.; Forster, J.W.; Daetwyler, H.D.; Cogan, N.O.I. Exploitation of data from breeding programs supports rapid implementation of genomic selection for key agronomic traits in perennial ryegrass. Theor. Appl. Genet. 2018, 131, 1891–1902. [Google Scholar] [CrossRef] [Green Version]
  27. Anderson, C.B.; Franzmayr, B.K.; Hong, S.W.; Larking, A.C.; van Stijn, T.C.; Tan, R.; Moraga, R.; Faville, M.J.; Faville, A.G. Protocol: A versatile, inexpensive, high-throughput plant genomic DNA extraction method suitable for genotyping-by-sequencing. Plant Methods 2018, 14, 75. [Google Scholar] [CrossRef]
  28. Hahn, H.; Huth, W.; Schöberlein, W.; Diepenbrock, W.; Weber, W.E. Detection of endophytic fungi in Festuca spp. by means of tissue print immunoassay. Plant Breed. 2003, 122, 217–222. [Google Scholar] [CrossRef]
  29. Glaubitz, J.C.; Casstevens, T.M.; Lu, F.; Harriman, J.; Elshire, R.J.; Sun, Q.; Buckler, E.S. TASSEL-GBS: A high capacity genotyping by sequencing analysis pipeline. PLoS ONE 2014, 9, e90346. [Google Scholar] [CrossRef]
  30. Byrne, S.L.; Nagy, I.; Pfeifer, M.; Armstead, I.; Swain, S.; Studer, B.; Mayer, K.; Campbell, J.D.; Czaban, A.; Hentrup, S.; et al. A synteny-based draft genome sequence of the forage grass Lolium perenne. Plant J. 2015, 84, 816–826. [Google Scholar] [CrossRef]
  31. Dodds, K.G.; McEwan, J.C.; Brauning, R.; Anderson, R.M.; van Stijn, T.C.; Kristjánsson, T.; Clarke, S.M. Construction of relatedness matrices using genotyping-by-sequencing data. BMC Genom. 2015, 16, 1047. [Google Scholar] [CrossRef] [Green Version]
  32. Lee, J.M.; Thom, E.R.; Chapman, D.F.; Wynn, K.; Waugh, D.; Rossi, L.; Faville, M.J.; Bell, N.L.; McNeill, M.R. High perennial ryegrass seeding rates do not negatively impact pasture sward persistence. Grass Forage Sci. 2017. [Google Scholar] [CrossRef]
  33. Lee, J.M.; Thom, E.R.; Waugh, C.D.; Bell, N.L.; McNeill, M.R.; Wilson, D.J.; Chapman, D.F. Trajectory and causes of decline in the botanical composition of dairy-grazed pasture in the Waikato. J. N. Z. Grassl. 2017, 79, 83–88. [Google Scholar]
  34. Jahufer, M.Z.Z.; Luo, D. DeltaGen: A comprehensive decision support tool for plant breeders. Crop Sci. 2018, 58, 1118–1131. [Google Scholar] [CrossRef] [Green Version]
  35. Galwey, N.W. Introduction to Mixed Modelling: Beyond Regression and Analysis of Variance; John Wiley & Sons, Ltd.: West Sussex, UK, 2006. [Google Scholar]
  36. Gallagher, J.A.; Turner, L.B.; Cairns, A.J.; Farrell, M.; Lovatt, J.A.; Skøt, K.; Armstead, I.P.; Humphreys, M.O.; Roldan-Ruiz, I. Genetic differentiation in response to selection for water-soluble carbohydrate content inperennial ryegrass (Lolium perenne L.). Bioenergy Res. 2015, 8, 77–90. [Google Scholar] [CrossRef] [Green Version]
  37. Byrne, S.L.; Conaghan, P.; Barth, S.; Arojju, S.K.; Casler, M.; Michel, T.; Velmurugan, J.; Milbourne, D. Using variable importance measures to identify a small set of SNPs to predict heading date in perennial ryegrass. Sci. Rep. 2017, 7, 3566. [Google Scholar] [CrossRef]
  38. Frandsen, K.J. Variability and inheritance of digestibility in perennial ryegrass (Lolium perenne), meadow fescue (Festuca pratensis) and cocksfoot (Dactylis glomerata). Acta Agric. Scand. 1986, 36, 241–263. [Google Scholar] [CrossRef]
  39. Fè, D.; Pedersen, M.G.; Jensen, C.S.; Jensen, J. Genetic and environmental variation in a commercial breeding program of perennial ryegrass. Crop Sci. 2015, 55, 631–640. [Google Scholar] [CrossRef] [Green Version]
  40. Clark, S.A.; Hickey, J.M.; Daetwyler, H.D.; van der Werf, J.H.J. The importance of information on relatives for the prediction of genomic breeding values and the implications for the makeup of reference data sets in livestock breeding schemes. Genet. Sel. Evol. 2012, 44, 4. [Google Scholar] [CrossRef] [Green Version]
  41. Scutari, M.; Mackay, I.; Balding, D. Using genetic distance to infer the accuracy of genomic prediction. PLoS Genet. 2016, 12, e1006288. [Google Scholar] [CrossRef]
  42. Wientjes, Y.C.J.; Veerkamp, R.F.; Calus, M.P.L. The effect of linkage disequilibrium and family relationships on the reliability of genomic prediction. Genetics 2013, 193, 621. [Google Scholar] [CrossRef] [Green Version]
  43. Habier, D.; Tetens, J.; Seefried, F.-R.; Lichtner, P.; Thaller, G. The impact of genetic relationship information on genomic breeding values in German Holstein cattle. Genet. Sel. Evol. 2010, 42, 5. [Google Scholar] [CrossRef] [Green Version]
  44. Habier, D.; Fernando, R.L.; Dekkers, J.C.M. The impact of genetic relationship information on genome-assisted breeding values. Genetics 2007, 177, 2389–2397. [Google Scholar] [CrossRef] [PubMed] [Green Version]
  45. Arojju, S.K.; Barth, S.; Milbourne, D.; Conaghan, P.; Velmurugan, J.; Hodkinson, T.R.; Byrne, S.L. Markers associated with heading and aftermath heading in perennial ryegrass full-sib families. BMC Plant Biol. 2016, 16, 160. [Google Scholar] [CrossRef] [PubMed] [Green Version]
  46. Heslot, N.; Jannink, J.-L.; Sorrells, M.E. Perspectives for genomic selection applications and research in plants. Crop Sci. 2015, 55, 1–12. [Google Scholar] [CrossRef]
  47. Ghamkhar, K.; Irie, K.; Hagedorn, M.; Hsiao, J.; Fourie, J.; Gebbie, S.; Hoyos-Villegas, V.; George, R.; Stewart, A.; Inch, C.; et al. Real-time, non-destructive and in-field foliage yield and growth rate measurement in perennial ryegrass (Lolium perenne L.). Plant Methods 2019, 15, 72. [Google Scholar] [CrossRef] [PubMed]
  48. Wang, J.; Badenhorst, P.; Phelan, A.; Pembleton, L.; Shi, F.; Cogan, N.; Spangenberg, G.; Smith, K. Using sensors and unmanned aircraft systems for high-throughput phenotyping of biomass in perennial ryegrass breeding trials. Front. Plant Sci. 2019, 10. [Google Scholar] [CrossRef] [PubMed]
Figure 1. Multi-dimensional scaling (MDS) plot based on the distance metric (1-GRM) for Pop I and Pop III training generation (Tr) and selection (G1 and G3) populations. Note that the full training set used to derive the prediction models contained three additional populations (Pop II, IV, and V), which are not represented in these figures.
Agronomy 10 00340 g001
Figure 2. Days-to-heading for Low genomic estimated breeding value (GEBV), High GEBV, and Non-selected selection group (SG) progeny samples (n = 25 per SG) generated by genomic selection from four populations (Pop I G1, Pop I G3, Pop III G1, and Pop III G3). Data are best linear unbiased estimates (BLUEs) across two seasons and two locations (Waikato and Manawatu, New Zealand). Within each population, SG bars with different letters are significantly different (p < 0.05), as supported by least significant difference (L.S.D 0.05) error bars.
Agronomy 10 00340 g002
Figure 3. Herbage accumulation measured as dry matter yield per plot, for Low GEBV, High GEBV, and Non-selected selection group (SG) progenies generated by genomic selection from four populations (Pop I G1, Pop I G3, Pop III G1, and Pop III G3), and combined across all populations (All pop). Data are BLUEs for performance at (a) Waikato (from n = 7 seasonal harvests) and (b) Manawatu (from n = 8 seasonal harvests). Within each population, SG bars with different letters are significantly different (p < 0.05), as supported by least significant difference (L.S.D 0.05) error bars.
Agronomy 10 00340 g003
Table 1. Summary data for selection populations Pop I G1 and G3 and Pop III G1 and G3, alongside their training set counterparts (Pop I and Pop III training). GEBV = genomic estimated breeding value.
PopulationTotal
Pop I TrainingPop I G1Pop I G3Pop III TrainingPop III G1Pop III G3
No. Plants with GEBV-278177-280235970
No. Plants Available for Selection-238167-253137795
Mean Coefficient of Relatedness 1
Within Population0.1750.1990.2340.1070.1290.172-
To Training Set0.1750.1630.1370.1070.1000.084-
1 Twice the estimated kinship coefficient: ‘Within Population’ refers to the mean of off-diagonal pairwise coefficients amongst individuals in the population; ‘To Training Set’ refers to the mean of off-diagonal pairwise coefficients between individuals in the selection population and those in the training set counterpart (Pop I or Pop III training).
Table 2. Summary of mean herbage accumulation (HA) data for High, Low, and Non-selected selection group (SG) progenies in four populations and averaged across all four populations (All Pop). Data are BLUEs for performance in two evalaution environments (Waikato n = 7 harvests; Manawatu n = 8 harvests), as well as across both environments (combined). Under Selection Response, differences between pairs of SG are: ns = not signifcant (p > 0.05); * = significant at p < 0.05.
LocationPopulationMean HA, g DM Row−1 (± SE)L.S.D0.05Selection Response, g DM Row−1 (%)
High GEBVNon-SelectedLow GEBVHigh-LowHigh-Non-SelectedNon-Selected-Low
WaikatoPop I G169.0 (5.35)68.3 (5.27)41.8 (5.39)12.727.2 * (65%)0.7 ns (1.0%)26.5 * (63%)
Pop I G371.5 (5.32)62.8 (5.37)50.1 (5.40)12.721.4 * (43%)8.7 ns (14%)12.7 ns (25%)
Pop III G174.9 (5.83)72.7 (5.32)68.3 (5.35)12.76.6 ns (10%)2.2 ns (3%)4.4 ns (6%)
Pop III G384.2 (5.40)75.0 (5.40)72.3 (5.33)12.711.9 ns (16%)9.2 ns (12%)2.7 ns (4%)
All Pop75.0 (2.33)70.4 (3.17)58.5 (3.22)11.016.5 * (28%)4.6 ns (7%)11.9 * (20%)
ManawatuPop I G181.4 (4.65)77.1 (4.71)66.9 (4.62)12.514.5 * (22%)4.3 ns (6%)10.2 ns (15%)
Pop I G390.0 (4.74)80.8 (4.62)83.3 (4.64)12.56.7 ns (8%)9.2 ns (11%)−2.5 ns (3%)
Pop III G199.0 (4.72)103.2 (4.63)98.1 (4.69)12.50.9 ns (1%)−4.2 ns (4%)5.1 ns (5%)
Pop III G3101.8 (4.64)100.2 (4.70)98.3 (4.70)12.53.5 ns (4%)1.6 ns (2%)1.9 ns (2%)
All Pop94.9 (2.40)92.8 (2.41)88.7 (2.38)11.46.2 ns (7%)2.1 ns (2%)4.1 ns (5%)
CombinedPop I G175.6 (6.43)73.2 (6.45)52.8 (6.52)12.222.8 * (43%)2.4 ns (3%)20.4 * (39%)
Pop I G383.0 (6.49)72.1 (6.45)67.3 (6.46)12.215.7 * (23%)10.9 ns (15%)4.8 ns (7%)
Pop III G185.9 (6.37)84.0 (6.39)82.0 (6.39)12.23.9 ns (5%)1.9 ns (2%)2.0 ns (2%)
Pop III G391.1 (6.40)85.7 (6.38)84.3 (6.40)12.26.8 ns (8%)5.4 ns (6%)1.4 ns (2%)
All Pop81.5 (5.43)76.8 (5.45)69.4 (5.43)11.812.1 * (17%)4.7 ns (6%)7.4 ns (11%)

