Evolution of Hay Meadows between 1956, 1986, and 2016 and Its Relation to the Characteristics and Location of the Parcels in the Valley of the River Esera (Pyrenees, Spain)


Abstract
1. Introduction
2. Materials and Methods
2.1. Area of Study
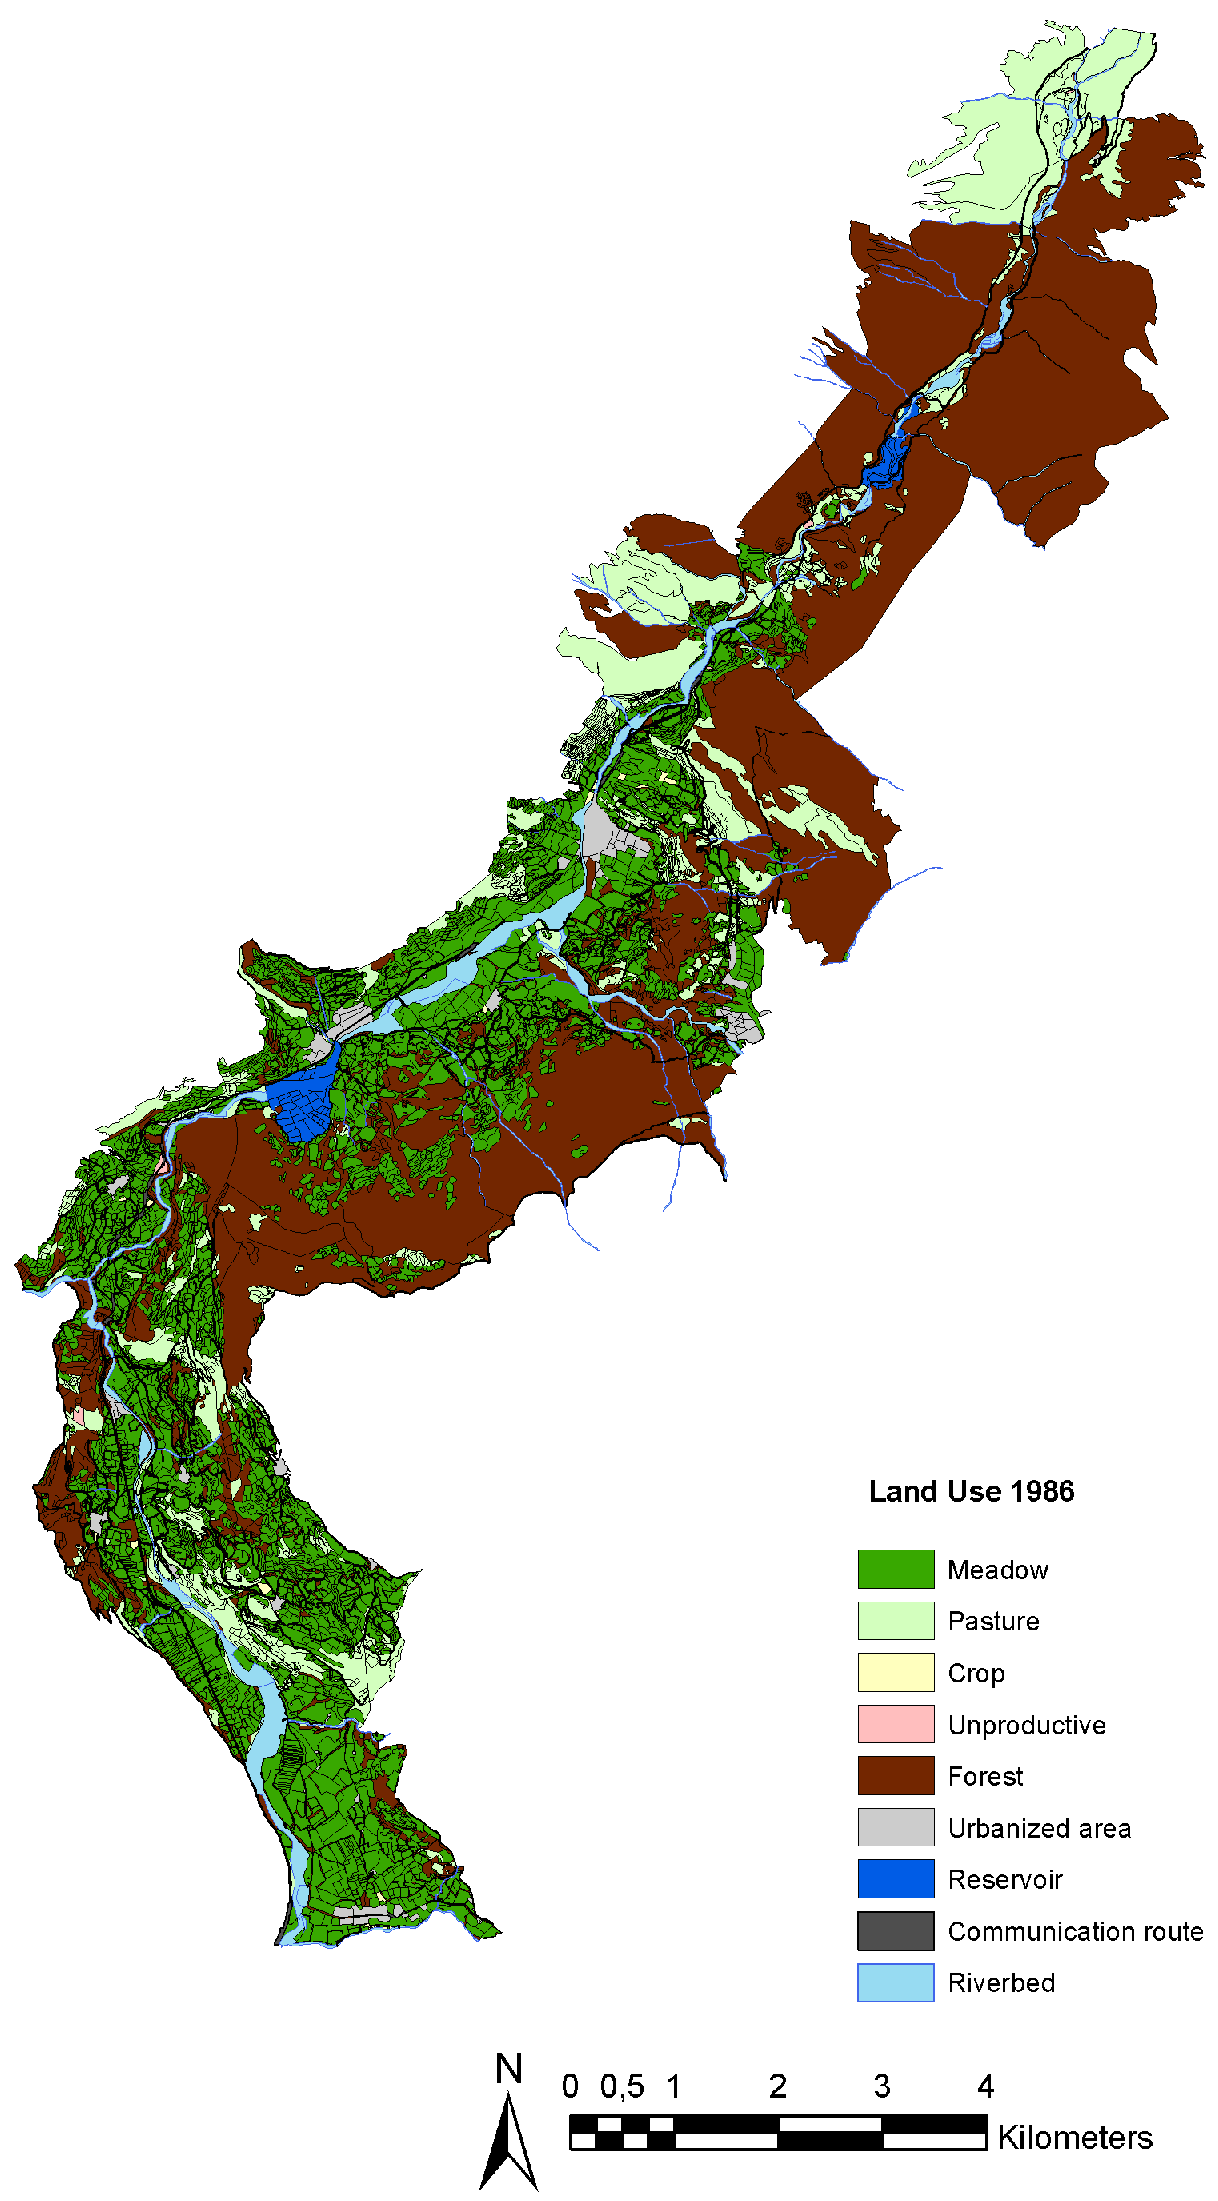
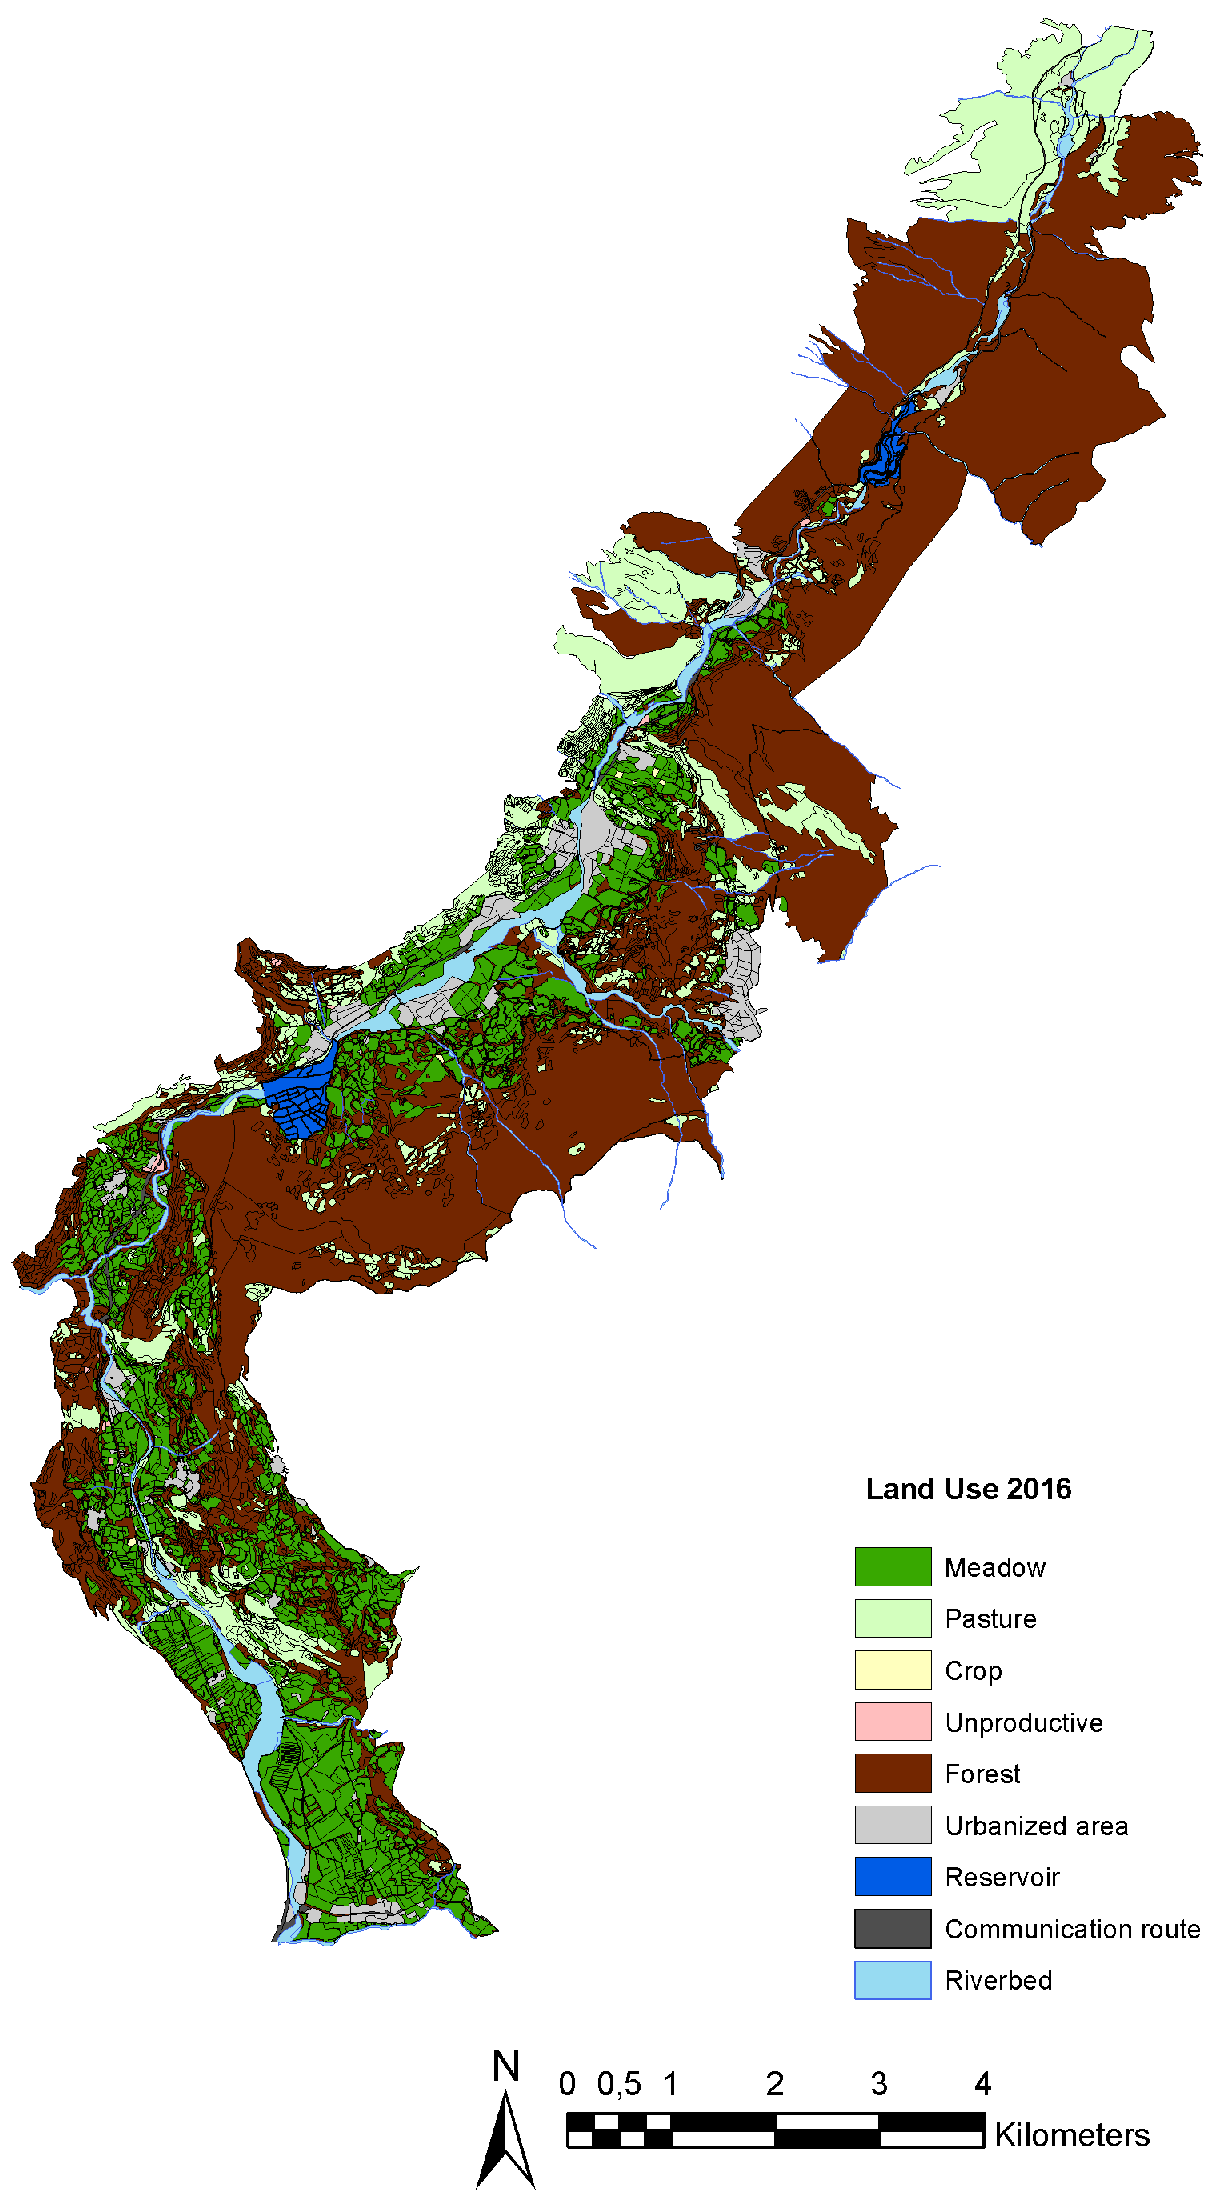
2.2. Cartography
3. Results
3.1. Land Use Surfaces by Years
3.2. Characterization of the Fields of Meadows and Crops
3.3. Evolution of Land Use Surface
3.4. Analysis of Changes or Persistence of Meadows and Crops and the Characteristics of the Parcels
3.4.1. Comparison of the Characteristics of the 1956 Crop Parcels That Have Changed to Meadows versus Those That Have Been Transformed to Pasture and Forest in 1986
3.4.2. Comparison of the Characteristics of the 1956 Meadow Parcels That Have Been Maintained as a Meadow against Those That Have Been Transformed into Pasture and Forest in 1986
3.4.3. Comparison of the Characteristics of the 1986 Meadow Parcels That Have Been Maintained as a Meadow against Those That Have Been Transformed into Pasture and Forest in 2016
4. Discussion
5. Conclusions
Supplementary Materials
Author Contributions
Funding
Acknowledgments
Conflicts of Interest
References
- Ocaña, M. Ensayo de planificación ganadera en Aragón; Institución Fernando el Católico, 671: Zaragoza, Spain, 1978; ISBN 84–00-03792–8. [Google Scholar]
- Chocarro, C.; Reiné, R. El cultivo de los prados en el Pirineo. In Pastos del Pirineo. Capítulo; Fillat, F., García González, R., Gómez García, D., Reiné, R., Eds.; Consejo Superior de Investigaciones Científicas: Madrid, Spain, 2007; Volume 10, pp. 141–158. ISBN 978-84-00-08614-5. [Google Scholar]
- Hejcman, M.; Hejcmanová, P.; Pavlů, V.; Beneš, J. Origin and history of grasslands in Central Europe—A review. Grass Forage Sci. 2013, 68, 345–363. [Google Scholar] [CrossRef]
- Dengler, J.; Janišová, M.; Török, P.; Wellstein, C. Biodiversity of Palaearctic grasslands: A synthesis. Agric. Ecosyst. Environ. 2013, 182, 1–14. [Google Scholar] [CrossRef]
- Peeters, A. Importance, evolution, environmental impact and future challenges of grasslands and grassland-based systems in Europe. Grassl. Sci. 2009, 55, 115–125. [Google Scholar] [CrossRef]
- Bouty, C.; Barbottin, A.; Martin, P. Quel devenir des surfaces en prairie permanente sur un territoire de polyculture-élevage? Innov. Agron. 2014, 39, 67–82. [Google Scholar]
- Huyghe, C.; Peeters, A.; De Vliegher, A. La prairie en France et en Europe. Colloque presentant les methodes et resultats du projet Climagie (metaprogramme ACCAF); INRA: Poitiers, France, 2015; pp. 13–23. Available online: https://hal.archives-ouvertes.fr/hal-01233899 (accessed on 10 January 2020).
- Lambin, E.F.; Geist, H.J. Land use and land cover change: Local processes and global impacts. In Global Change—The IGBP Series; Springer: Berlin/Heidelberg, Germany, 2006; ISBN 978-3540322016. [Google Scholar]
- Foley, J.A.; Defries, R.; Asner, G.P.; Barford, C.; Bonan, G.; Carpenter, S.R.; Chapin, F.S.; Coe, M.T.; Daily, G.C.; Gibbs, H.K.; et al. Global consequences of land use. Science 2005, 309, 570–574. [Google Scholar] [CrossRef] [PubMed]
- Sleeter, B.M.; Sohl, T.R.; Loveland, T.R.; Auch, R.F.; Acevedo, W.; Drummondc, M.A.; Sayler, K.L.; Stehman, S.V. Land-cover change in the conterminous United States from 1973 to 2000. Glob. Environ. Chang. 2013, 23, 733–748. [Google Scholar] [CrossRef]
- Lark, T.J.; Mueller, R.M.; Johnson, D.M.; Gibbsa, H.K. Measuring land-use and land-cover change using the U.S. department of agriculture’s cropland data layer: Cautions and recommendations. Int. J. Appl. Earth Obs. Geoinf. 2017, 62, 224–235. [Google Scholar] [CrossRef]
- Lomba, A.; Strohbach, M.; Jerrentrup, J.S.; Dauber, J.; Klimek, S.; McCracken, D.I. Making the best of both worlds: Can high-resolution agricultural administrative data support the assessment of High Nature Value farmlands across Europe? Ecol. Indic. 2017, 72, 118–130. [Google Scholar] [CrossRef]
- Bernués, A. Ganadería de montaña en un contexto global: Evolución, condicionantes y oportunidades. Pastos 2007, 37, 133–175. [Google Scholar]
- García Martínez, A.; Olaizola, A.; Bernués, A. Trajectories of evolution and drivers of change in European mountain cattle farming systems. Animal 2009, 3, 152–165. [Google Scholar] [CrossRef]
- Navarro, L.; Pereira, H. Rewilding Abandoned Landscapes in Europe. In Rewilding European Landscapes; Pereira, H., Navarro, L., Eds.; Springer: Cham, Switzerland, 2015. [Google Scholar] [CrossRef]
- Pierik, M.E.; Gusmeroli, F.; Della Marianna, G.; Tamburini, A.; Bocchi, S. Meadows species composition, biodiversity and forage value in an Alpine district: Relationships with environmental and dairy farm management variables. Agric. Ecosyst. Environ. 2017, 244, 14–21. [Google Scholar] [CrossRef]
- Pavlů, L.; Pavlů, V.; Gaisler, J.; Hejcman, M.; Mikulkaa, J. Effect of long-term cutting versus abandonment on the vegetation of a mountain hay meadow (Polygono-Trisetion) in Central Europe. Flora Morphol. Distrib. Funct. Ecol. Plants 2011, 206, 1020–1029. [Google Scholar] [CrossRef]
- Pruchniewicz, D. Abandonment of traditionally managed mesic mountain meadows affects plant species composition and diversity. Basic Appl. Ecol. 2017, 20, 10–18. [Google Scholar] [CrossRef]
- McDonald, D.; Crabtree, J.R.; Wiesinger, G.; Dax, T.; Stamou, N.; Fleury, P.; Gutierrez Lazpita, J.; Gibon, A. Agricultural abandonment in mountain areas of Europe: Environmental consequences and policy response. J. Environ. Manag. 2000, 59, 47–69. [Google Scholar] [CrossRef]
- Niedrist, G.; Tasser, E.; Lüth, C.; Dalla Via, J.; Tappeiner, U. Plant diversity declines with recent land use changes in European Alps. Plant Ecol. 2009, 202, 195–210. [Google Scholar] [CrossRef]
- Stoate, C.; Báldi, A.; Beja, P.; Boatman, N.D.; Herzon, I.; van Doorn, A.; de Snoo, G.R.; Rakosy, L.; Ramwell, C. Ecological impacts of early 21st century agricultural change in Europe—A review. J. Environ. Manag. 2009, 91, 22–46. [Google Scholar] [CrossRef]
- Zimmermann, P.; Tasser, E.; Georg Leitinger, G.; Tappeiner, U. Effects of land-use and land-cover pattern on landscape-scale biodiversity in the European Alps. Agric. Ecosyst. Environ. 2010, 139, 13–22. [Google Scholar] [CrossRef]
- Tasser, E.; Walde, J.; Tappeiner, U.; Teutsch, A.; Noggler, W. Land-use changes and natural reforestation in the Eastern Central Alps. Agric. Ecosyst. Environ. 2007, 118, 115–129. [Google Scholar] [CrossRef]
- Prévosto, B.; Kuiters, L.; Bernhardt-Römermann, M.; Dölle, M.; Schmidt, W.; Hoffmann, M.; Van Uytvanck, J.; Bohner, A.; & Kreiner, D.; Stadler, J.; et al. Impacts of Land Abandonment on Vegetation: Successional Pathways in European Habitats. Folia Geobot. 2011, 46, 303–325. [Google Scholar] [CrossRef]
- Schirpke, U.; Kohler, M.; Leitinger, G.; Fontana, V.; Tasser, E.; Tappeiner, U. Future impacts of changing land-use and climate on ecosystem services of mountain grassland and their resilience. Ecosyst. Serv. 2017, 26, 79–94. [Google Scholar] [CrossRef]
- Tokarczyk, N. Forest encrochachment on temperate mountain meadows. Scale, drivers and current research directions. Geogr. Pol. 2017, 90, 463–480. [Google Scholar] [CrossRef]
- Buitenwerf, R.; Sandel, B.; Normand, S.; Mimet, A.; Svenning, J.C. Land surface greening suggests vigorous woody regrowth throughout European semi-natural vegetation. Glob. Chang. Biol. 2018. [Google Scholar] [CrossRef]
- Van Vliet, J.; de Groot, H.L.F.; Rietveld, P.; Verburg, P.H. Manifestations and underlying drivers of agricultural land use change. Landsc. Urban Plan. 2015, 133, 24–36. [Google Scholar] [CrossRef]
- Peeters, A. Environmental impacts and future challenges of grasslands and grassland-based livestock production systems in Europe. In Grassland: A Global Resource Perspective; Ghosh, P.K., Mahanta, S.K., Singh, J.B., Pathak, P.S., Eds.; International Grassland Congress. Range Management Society of India: Jhansi, India, 2015; Available online: https://www.researchgate.net/publication/287489163_Environmental_impacts_and_future_challenges_of_grasslands_and_grassland-based_livestock_production_systems_in_Europe (accessed on 10 January 2020).
- IEEP. Alterra 2010. Reflecting Environmental Land Use Needs into EU Policy: Preserving and Enhancing the Environmental Benefits of “Land Services”: Soil Sealing, Biodiversity Corridors, Intensification/Marginalisation of Land Use and Permanent Grassland; Final Report to the European Commission, DG Environment on Contract ENVB1/ETU/2008/0030; Institute for European Environmental policy/Alterra Wageningen UR: Wageningen, The Netherlands, 2010; Available online: https://edepot.wur.nl/160020 (accessed on 10 January 2020).
- Opermann, R.; Beaufoy, G.; Jones, G. High Nature Value Farming in Europe. 35 European Countries-Experiences and Perspectives; Ubstadt-Weiher, A., Ed.; Verlag regionalkultur: Ubstadt-Weiher, Germany, 2012; Available online: http://www.verlag-regionalkultur.net/xtc/product_info.php?info=p781_High-Nature-Value-Farming-in-Europe.html (accessed on 10 January 2020).
- Cattan, A. La préservation des prairies dans la PAC: Les raisons d’une illusion. Courrier de l’environement de l’INRA 2014, 64, 91–103. Available online: https://hal.archives-ouvertes.fr/hal-01222601/file/Courrier64-Cattan-28–10-14.pdf (accessed on 10 January 2020).
- García de la Fuente, L.; Guzmán, D.; Mora, A.; Nobre, S.; Brau-Nogué, C. Informe de iniciativas existentes para promover la siega a través de los PDR y los instrumentos de la nueva PAC en la UE. Proyecto Interreg SUDOE “SOS PRADERAS”, INDUROT-Universidad de Oviedo. In Proceedings of the 27th European Grassland Federation General Meeting, Cork, Irlanda, 17–21 June 2017; Available online: https://www.sospraderas.eu/documentacion/ (accessed on 10 January 2020).
- Keenleyside, C.; Beaufoy, G.; Tucker, G.; Jones, G. High Nature Value farming throughout EU-27 and Its Financial Support under the CAP. Report Prepared for DG Environment, Contract No ENV B.1/ETU/2012/0035; Institute for European Environmental Policy: London, UK, 2014; Available online: https://ieep.eu/uploads/articles/attachments/2e7adcbd-ba75–44db-89e6–0e1669076607/HNV_and_CAP_Full_Report.pdf?v=63664509849 (accessed on 10 January 2020).
- IDEARAGÓN. Infraestructura de datos espaciales de Aragón; Instituto Geográfico de Aragón. Gobierno de Aragón: Zaragoza, Spain, 2019; Available online: http://idearagon.aragon.es/ (accessed on 10 January 2020).
- Felicísimo, A.M. Modelos Digitales del Terreno. Introducción y aplicaciones en las ciencias ambientales; Pentalfa Ediciones: Oviedo, Spain, 1994; ISBN 8478484752. [Google Scholar]
- Collantes, F. La ganadería de montaña en España, 1865–2000: Historia de una ventaja comparativa anulada. Hist. Agrar. 2003, 31, 141–167. [Google Scholar]
- Clar, E.; Pinilla, V. Path Dependence and the Modernisation of Agriculture: A Case Study of Aragon, 1955–85. Rural Hist. 2011, 22, 251–269. [Google Scholar] [CrossRef]
- Daumas, M. La vie rurale dans le haut Aragon oriental; CSIC: Madrid, Spain, 1976. [Google Scholar]
- Manrique, E.; Revilla, R.; Sáez, E. Características estructurales del sector agro-ganadero de la comarca de Ribagorza; Institución Fenando el Católico, publ. n° 1087: Zaragoza, Spain, 1987; ISBN 84-00-06527-I. [Google Scholar]
- Olaizola, A. Viabilidad económica de sistemas ganaderos de montaña en condiciones de competencia en el uso de factores productivos. Análisis de la ganadería en un valle pirenaico característico mediante técnicas multivariante y de optimización. Ph.D. Thesis, Universidad de Zaragoza, Instituto de Estudios Altoaragoneses, Huesca, Spain, 1991. [Google Scholar]
- Malandra, F.; Vitali, A.; Urbinati, C.; Garbarino, M. 70 Years of Land Use/Land Cover Changes in the Apennines (Italy): A Meta-Analysis. Forests 2018, 9, 551. [Google Scholar] [CrossRef]
- Mottet, A.; Ladet, S.; Coqué, N.; Gibon, A. Agricultural land-use change and its drivers in mountain landscapes: A case study in the Pyrenees. Agric. Ecosyst. Environ. 2006, 114, 296–310. [Google Scholar] [CrossRef]
- Sheeren, D.; Lefèbvre, J.; Ladet, S.; Balent, G.; Brame, A.; Bray, F.; Capitaine, M.; Gibon, A.; Lasseur, R.; Lasseur, J.; et al. Coévolution des paysages et des activités agricoles dans différents territoires d’élevage des montagnes françaises: Entre intensification et déprise agricole. Fourrages 2015, 222, 103–113. [Google Scholar]
- García Manteca, P.; García de la Fuente, L.; Aguiar, C.; Azevedo, J.; Reiné, R.; Ascaso, J.; Guzmán, D.; Díaz, T.E. Mountain hay meadows: Assessing the loss of surfaces and ecosystem services in Iberian areas. Restoration in the Era of Climate Change. In Proceedings of the SER Europe Conference, Reykjavik, Iceland, 9–13 September 2018; Available online: https://www.sospraderas.eu/wp-content/uploads/2019/07/Abstract-SER_GT1.pdf (accessed on 10 January 2020).
- García Manteca, P.; García de la Fuente, L.; González Iglesias, V.; Díaz González, T.E. Cartografía de los usos del suelo agropastorales en el Parque Nacional de Picos de Europa en tres periodos anuales. Bol. Cien. Nat. y Tecnol. R.I.D.E.A. 2019, 54, 195–204. [Google Scholar]
- Hinojosa, L.; Tasser, E.; Rüdisser, J.; Leitinger, G.; Schermer, M.; Lambin, E.F.; Tappeiner, U. Geographical heterogeneity in mountain grasslands dynamics in the Austrian-Italian Tyrol region. Appl. Geogr. 2019, 106, 50–59. [Google Scholar] [CrossRef]
- Fillat, F. De la trashumancia a las nuevas formas de ganadería extensiva. Estudio de los Valles de Ansó, Hecho y Benasque. Ph.D. Thesis, Universidad Politécnica de Madrid, Madrid, Spain, 1980. [Google Scholar]
- Balent, G.; Gibon, A. Transformations des pratiques collectives dans les systèmes pastoraux des Pyrénées centrales: Caractéristiques et enjeux. Aménagement et Nature 1992, 108, 10–13. [Google Scholar]
- Balent, G.; Duru, M. Influence des modes d’explotation sur les caractéristiques et l’évolution des surfaces pastorales: Cas des Pyrénées centrales. Agronomie 1984, 4, 113–124. [Google Scholar] [CrossRef]
- García Ruiz, J.M.; Lasanta, T.; Ruiz Flaño, P.; Ortigosa, L.; White, S.; González, C.; Marti, C. Land-use changes and sustainable development in mountain areas: A case study in the Spanish Pyrenees. Landsc. Ecol. 1996, 11, 267–277. [Google Scholar] [CrossRef]
- Fanlo, R.; Chocarro, C.; Massip, G.; Castelló, M. Cambios de uso en las superficies pastorales de un municipio de montaña en los últimos 50 años: El caso de Espot (Lleida). In Producción de pastos, forrajes y céspedes; Chocarro, C., Santiveri, F., Fanlo, R., Bovet, I., Lloveras, J., Eds.; Ediciones Universitat de Lleida: Lérida, Spain, 2002; pp. 591–596. ISBN 84-8409-145-7. [Google Scholar]
- Lasanta, T. The process of desertion of cultivated areas in the Central Spanish Pyrenees. Pirineos 1988, 132, 15–36. [Google Scholar]
- Tasser, E.; Tappeiner, U. Impact of land use changes on mountain vegetation. Appl. Veg. Sci. 2002, 5, 173–184. [Google Scholar] [CrossRef]
- Houet, T.; Ribiere, O.; Vacquié, L.; Vidal, F.; Galop, D. Caractérisation de la fermeture des paysages dans les Pyrénées depuis les années 1940—Application sur le Haut-Vicdessos. Sud-Ouest Européen 2012, 33, 116–126. [Google Scholar] [CrossRef]
- Cocca, G.; Sturaro, E.; Gallo, L.; Ramanzin, M. Is the abandonment of traditional livestock farming systems the main driver of mountain landscape change in Alpine areas? Land Use Policy 2012, 29, 878–886. [Google Scholar] [CrossRef]
- Vacquié, L. Modélisation prospective et échelles spatiales en montagne:application aux Pyrénées françaises; Géographie; Université Toulousele Mirail-Toulouse II: Toulouse, France, 2015; Available online: https://tel.archives-ouvertes.fr/tel-01275936 (accessed on 10 January 2020).
- Marini, L.; Scotton, M.; Klimek, S.; Isselstein, J.; Pecile, A. Effects of local factors on plant species richness and composition of Alpine meadows. Agric. Ecosyst. Environ. 2007, 119, 281–288. [Google Scholar] [CrossRef]
- Marini, L.; Fontana, P.; Klimekc, S.; Battistia, A.; Gastonb, K.J. Impact of farm size and topography on plant and insect diversity of managed grasslands in the Alps. Biol. Conserv. 2009, 142, 394–403. [Google Scholar] [CrossRef]
- Graf, R.; Müller, M.; Korner, P.; Jenny, M.; Jenny, L. 20% loss of unimproved farmland in 22 years in the Engadin, Swiss Alps. Agric. Ecosyst. Environ. 2014, 185, 48–58. [Google Scholar] [CrossRef]
- Scotton, M.; Sicher, L.; Kasal, A. Semi-natural grasslands of the Non Valley (Eastern Italian Alps): Agronomic and environmental value of traditional and new Alpine hay-meadow types. Agric. Ecosyst. Environ. 2014, 197, 243–254. [Google Scholar] [CrossRef]
- Bosshard, A. Recul des prairies a fromental Arrhenatheretum et consequences sur la biodiversite. Recherche Agronomique Suisse 2015, 6, 20–27. [Google Scholar]
- Reiné, R.; Chocarro, C.; Juárez, A.; Barrantes, O.; Ferrer, C.; Broca, A. Características de la producción herbácea en los prados de siega del Pirineo de Huesca. In La multifuncionalidad de los pastos: Producción ganadera sostenible y gestión de ecosistemas; Reiné, R., Barrantes, O., Broca, A., Ferrer, C., Eds.; Sociedad Española para el Estudio de los Pastos: Huesca, Spain, 2009; pp. 101–107. ISBN 978-84-612-9337-7. [Google Scholar]
- García Martínez, A. Dinámica reciente de los sistemas de vacuno en el Pirineo Central y evaluación de sus posibilidades de adaptación al entorno socio-económico. Ph.D. Thesis, Universidad de Zaragoza, Zaragoza, Spain, 2007. Available online: https://zaguan.unizar.es/record/2013/files/ (accessed on 10 January 2020).
- Bernués, A.; Olaizola, A. La ganadería en los Pirineos: Evolución, condicionantes y oportunidades. In Coord—Los Pirineos. Geografía, Turismo, Agricultura, Cooperación transfronteriza y Derecho; Universidad del País Vasco: Leiola, Spain, 2012; pp. 29–67. Available online: https://citarea.cita-aragon.es/citarea/bitstream/10532/2142/1/2012_342.pdf (accessed on 10 January 2020).
- Censo Agrario. 1989, 1999, 2009. Instituto Nacional de Estadística. Available online: https://www.ine.es/ (accessed on 10 January 2020).
- Directorios Ganaderos. 2008–2013. Departamento de Agricultura, Ganadería y Medio Ambiente; Gobierno de Aragón: Zaragoza, Spain, 2014. Available online: https://www.aragon.es/en/-/estadisticas-ganaderas (accessed on 10 January 2020).
- Lasanta, T.; Arnáez, J.; Pascual, N.; Ruiz Flaño, P.; Errea, M.P.; Lana Renault, N. Space–time process and drivers of land abandonment in Europe. Catena 2017, 149, 810–823. [Google Scholar] [CrossRef]
- Julien, M.P.; Alard, D.; Balent, G. Patterns of ash (Fraxinus excelsior L.) colonization in mountain grasslands: The importance of management practices. Plant Ecol. 2006, 183, 177–189. [Google Scholar] [CrossRef]
- Gartzia, M.; Alados, C.L.; Pérez Cabello, F. Assessment of the effects of biophysical and anthropogenic factors on woody plant encroachment in dense and sparse mountain grasslands based on remote sensing data. Prog. Phys. Geogr. 2014, 38, 201–217. [Google Scholar] [CrossRef]
- Nadal Romero, E.; Lasanta, T.; Cerdà, A. Integrating Extensive Livestock and Soil Conservation Policies in Mediterranean Mountain Areas for Recovery of Abandoned Lands in the Central Spanish Pyrenees. A Long-Term Research Assessment. Land Degrad. Dev. 2016, 29, 262–273. [Google Scholar] [CrossRef]
- Lasanta, T.; Vicente-Serrano, S.M. Cambios en la cubierta vegetal en el Pirineo aragonés en los últimos 50 años. Pirineos 2007, 162, 125–154. [Google Scholar] [CrossRef]
- Velli, A.; Pirola, A.; Ferrari, C. Evaluating landscape changes using vegetation and land-use maps: An integrated approach. Landsc. Res. 2018, 44, 768–781. [Google Scholar] [CrossRef]
- Gellrich, M.; Baur, P.; Koch, B.; Zimmermann, N.E. Agricultural land abandonment and natural forest re-growth in the Swiss mountains: A spatially explicit economic analysis. Agric. Ecosyst. Environ. 2007, 118, 93–108. [Google Scholar] [CrossRef]
- Chocarro, C.; Fanlo, R.; Fillat, F.; Villar, L. Sur les communautes prairiales et leur gestion dans duex vallées de Pyrénées centrales espagnoles. Colloques Phytosociologiques 1990, 14, 457–472. [Google Scholar]


| Land use | Surface (ha) | ||
|---|---|---|---|
| Years | 1956 | 1986 | 2016 |
| Meadow | 548.78 | 1655.02 | 978.29 |
| Pasture | 681.47 | 769.53 | 786.77 |
| Crop | 1374.62 | 6.96 | 2.25 |
| Unproductive | 2.31 | 3.91 | 5.92 |
| Forest | 2273.52 | 2357.96 | 2905.58 |
| Urbanized area | 35.39 | 76.81 | 196.04 |
| Reservoir | 0.00 | 51.46 | 52.99 |
| Communication route | 92.41 | 92.54 | 95.34 |
| Riverbed | 217.43 | 211.75 | 202.76 |
| Total | 5225.93 | 5225.93 | 5225.93 |
| 1956 | ||||||
| Variables | Meadow | Crop | Meadow vs. Crop | |||
| Quantitative | Mean | SD | Mean | SD | Sig. t-Student | Levene |
| Superface (ha) | 0.31 | 0.46 | 0.30 | 0.43 | ns | (a) |
| Minor polygon diameter (m) | 25.09 | 19.21 | 26.08 | 18.94 | ns | (a) |
| Altitude (m) | 1159.77 | 123.42 | 1144.87 | 155.60 | *** | (a) |
| Slope (°) | 17.32 | 8.93 | 16.30 | 9.82 | *** | (a) |
| AspEW | −0.10 | 0.63 | −0.21 | 0.63 | *** | (a) |
| AspNS | −0.08 | 0.63 | −0.04 | 0.60 | * | (a) |
| Potential radiation (KWh/m2 year) | 1298.25 | 43.02 | 1305.49 | 43.40 | *** | (a) |
| Distance routes (m) | 86.85 | 94.23 | 92.29 | 101.31 | ns | (a) |
| Qualitative | no | yes | no | yes | Sig. chi square | |
| Terrace | 1748 | 12 | 3623 | 982 | *** | |
| Contiguity pasture and forest | 849 | 911 | 2297 | 2308 | ns | |
| n = 1760 | n = 4605 | |||||
| 1986 | ||||||
| Meadow | Crop | Meadow vs. Crop | ||||
| Quantitative | Mean | SD | Mean | SD | Sig. t-Student | Levene |
| Superface (ha) | 0.30 | 0.45 | 0.26 | 0.24 | ns | (a) |
| Minor polygon diameter (m) | 26.01 | 19.34 | 28.76 | 15.12 | ns | (a) |
| Altitude (m) | 1141.35 | 148.71 | 1047.96 | 121.83 | ** | (a) |
| Slope (°) | 15.47 | 8.98 | 5.74 | 3.88 | *** | (a) |
| AspEW | −0.20 | 0.62 | −0.18 | 0.53 | ns | (a) |
| AspNS | −0.02 | 0.62 | 0.09 | 0.56 | ns | (a) |
| Potential radiation (kWh/m2 year) | 1305.51 | 42.82 | 1307.20 | 24.09 | ns | (a) |
| Distance routes (m) | 88.94 | 100.91 | 28.74 | 15.39 | ** | (a) |
| Qualitative | no | yes | no | yes | Sig. chi square | |
| Terrace | 4845 | 601 | 27 | 0 | ns | |
| Contiguity pasture and forest | 2265 | 3181 | 22 | 5 | *** | |
| n = 5446 | n = 27 | |||||
| 2016 | ||||||
| Meadow | ||||||
| Quantitative | Mean | SD | ||||
| Superface (ha) | 0.41 | 0.57 | ||||
| Minor polygon diameter (m) | 32.49 | 21.89 | ||||
| Altitude (m) | 1099.43 | 143.97 | ||||
| Slope (°) | 11.06 | 7.01 | ||||
| AspEW | −0.25 | 0.57 | ||||
| AspNS | 0.04 | 0.60 | ||||
| Potential radiation (kWh/m2 year) | 1307.58 | 37.29 | ||||
| Distance routes (m) | 62.43 | 51.97 | ||||
| Qualitative | no | yes | ||||
| Terrace | 2335 | 69 | ||||
| Contiguity pasture and forest | 925 | 1479 | ||||
| n = 2404 | ||||||
| Transformation of Crop to Meadow or Pasture and Forest. 1956–1986 | Persistence and Transformation from Meadow to Meadow or to Pasture and Forest. 1956–1986 | Persistence and Transformation from Meadow to Meadow or to Pasture and Forest. 1986–2016 | |||||||
|---|---|---|---|---|---|---|---|---|---|
| Quantitative Variables | Meadow | Pasture and forest | Sig | Meadow | Pasture and forest | Sig | Meadow | Pasture and forest | Sig |
| Superface (ha) | 0.30 | 0.22 | *** 2 | 0.30 | 0.31 | ns 1 | 0.41 | 0.21 | *** 2 |
| Minor polygon diameter (m) | 26.61 | 20.13 | *** 2 | 24.54 | 25.41 | ns 2 | 32.52 | 20.33 | *** 2 |
| Altitude (m) | 1134.17 | 1212.36 | *** 2 | 1155.62 | 1195.81 | *** 1 | 1100.11 | 1184.58 | *** 2 |
| Slope (°) | 14.98 | 25.92 | *** 2 | 16.79 | 23.23 | *** 1 | 11.11 | 19.97 | *** 2 |
| AspEW | −0.24 | −0.01 | *** 2 | −0.11 | −0.04 | ns 2 | −0.25 | −0.18 | *** 2 |
| AspNS | 0.00 | −0.36 | *** 2 | −0.07 | −0.19 | ** 2 | 0.03 | −0.05 | *** 2 |
| Potential radiation (kWh/m2 year) | 1308.15 | 1285.81 | *** 2 | 1298.57 | 1293.10 | ns 2 | 1307.60 | 1303.51 | ** 2 |
| Distance routes (m) | 90.81 | 104.83 | ** 1 | 84.7 | 109.66 | *** 1 | 62.73 | 117.84 | *** 2 |
| Transformation of Crop to Meadow or Pasture and Forest. 1956–1986 | Persistence and Transformation from Meadow to Meadow or to Pasture and Forest. 1956–1986 | Persistence and Transformation from Meadow to Meadow or to Pasture and Forest. 1986–2016 | |||||
|---|---|---|---|---|---|---|---|
| Qualitative Variable | no | yes | no | yes | no | yes | |
| Terrace | Meadow | 3286 | 594 | 1509 | 7 | 2311 | 68 |
| Pasture and forest | 247 | 388 | 200 | 5 | 2227 | 520 | |
| Sig | *** | ** | *** | ||||
| n | 3880 | 1516 | 2379 | ||||
| Contiguity pasture and forest | Meadow | 1900 | 1980 | 743 | 773 | 908 | 1471 |
| Pasture and forest | 330 | 305 | 77 | 128 | 1124 | 1623 | |
| Sig | ns | ** | * | ||||
| n | 635 | 205 | 2747 | ||||
© 2020 by the authors. Licensee MDPI, Basel, Switzerland. This article is an open access article distributed under the terms and conditions of the Creative Commons Attribution (CC BY) license (http://creativecommons.org/licenses/by/4.0/).
Share and Cite
Ascaso, J.; Reiné, R.; Barrantes, O. Evolution of Hay Meadows between 1956, 1986, and 2016 and Its Relation to the Characteristics and Location of the Parcels in the Valley of the River Esera (Pyrenees, Spain). Agronomy 2020, 10, 329. https://doi.org/10.3390/agronomy10030329
Ascaso J, Reiné R, Barrantes O. Evolution of Hay Meadows between 1956, 1986, and 2016 and Its Relation to the Characteristics and Location of the Parcels in the Valley of the River Esera (Pyrenees, Spain). Agronomy. 2020; 10(3):329. https://doi.org/10.3390/agronomy10030329
Chicago/Turabian StyleAscaso, Joaquín, Ramón Reiné, and Olivia Barrantes. 2020. "Evolution of Hay Meadows between 1956, 1986, and 2016 and Its Relation to the Characteristics and Location of the Parcels in the Valley of the River Esera (Pyrenees, Spain)" Agronomy 10, no. 3: 329. https://doi.org/10.3390/agronomy10030329
APA StyleAscaso, J., Reiné, R., & Barrantes, O. (2020). Evolution of Hay Meadows between 1956, 1986, and 2016 and Its Relation to the Characteristics and Location of the Parcels in the Valley of the River Esera (Pyrenees, Spain). Agronomy, 10(3), 329. https://doi.org/10.3390/agronomy10030329