Article

Biostimulants Application Alleviates Water Stress Effects on Yield and Chemical Composition of Greenhouse Green Bean (Phaseolus vulgaris L.)

by
Spyridon A. Petropoulos
1,*,
Ângela Fernandes
2,
Sofia Plexida
1,
Antonios Chrysargyris
3,
Nikos Tzortzakis
3,
João C. M. Barreira
2,
Lillian Barros
2 and
Isabel C. F. R. Ferreira
2,*
1
Department of Agriculture, Crop Production and Rural Environment, University of Thessaly, 38446 N. Ionia, Magnissia, Greece
2
Centro de Investigação de Montanha (CIMO), Instituto Politécnico de Bragança, Campus de Santa Apolónia, 5300-253 Bragança, Portugal
3
Department of Agricultural Sciences, Biotechnology and Food Science, Cyprus University of Technology, 3036, Lemesos, Cyprus
*
Authors to whom correspondence should be addressed.
Agronomy 2020, 10(2), 181; https://doi.org/10.3390/agronomy10020181
Submission received: 23 December 2019 / Revised: 22 January 2020 / Accepted: 25 January 2020 / Published: 27 January 2020

Abstract

:
The increasing scarcity of water demands proper water management practices to ensure crop sustainability. In this study, the effect of drought stress and biostimulants application on the yield and chemical composition of green pods and seeds of common bean (Phaseolus vulgaris L.) was evaluated. For this purpose, four commercially available biostimulant products, namely Nomoren (G), EKOprop (EK), Veramin Ca (V), and Twin-Antistress (TW), were tested under two irrigation regimes: normal irrigation (W+) and water-holding (W-) conditions. The highest increase (20.8%) of pods total yield was observed in EKW+ treatment due to the formation of more pods of bigger size compared to control treatment (CW+). In addition, the highest yield under drought stress conditions was recorded for the GW- treatment (5691 ± 139 kg/ha). Regarding the effects of biostimulants on the protein and ash content of pods, the application of VW+ treatment (first harvest of pods; 201 ± 1 and 79 ± 1 g/kg dw for proteins and ash content, respectively) and GW+ (second harvest of pods; 207.1 ± 0.1 and 68.4 ± 0.5 g/kg dw for proteins and ash content, respectively) showed the best results. For seeds, the application of GW+ treatment resulted in the highest content for fat, protein, and ash content (52.7 ± 0.1, 337 ± 1, 56 ± 1 g/kg dw) and energetic value (5474 ± 3 kcal/kg dw). γ-tocopherol was the main detected tocopherol in pods and seeds, and it was significantly increased by the application of TWW- (first harvest of pods; 6410 ± 40 μg/kg dw), VW- (second harvest of pods; 3500 ± 20 μg/kg dw), and VW+ (seeds; 39.8 ± 0.1 g/kg dw) treatments. EKW- treatment resulted in the lowest oxalic acid content for both pod harvests (26.3 ± 0.1 g/kg dw and 22.7 ± 0.2 g/kg dw for the first and second harvest of pods, respectively) when compared with the rest of the treatments where biostimulants were applied, although in all the cases, the oxalic acid content was considerably low. Fructose and sucrose were the main sugars detected in pods and seeds, respectively, while the highest content was recorded for the TWW- (first harvest of pods) and GW- (second harvest of pods and seeds) treatments. The main detected fatty acids in pods and seeds were α-linolenic, linoleic, and palmitic acid, with a variable effect of the tested treatments being observed. In conclusion, the application of biostimulants could be considered as an eco-friendly and sustainable means to increase the pod yield and the quality of common bean green pods and seeds under normal irrigation conditions. Promising results were also recorded regarding the alleviation of negative effects of drought stress, especially for the application of arbuscular mycorrhizal fungi (AMF; G treatment), which increased the total yield of green pods. Moreover, the nutritional value and chemical composition of pods and seeds was positively affected by biostimulants application, although a product specific effect was recorded depending on the irrigation regime and harvesting time (pods and seeds).

1. Introduction

The increasing concerns for food security in a rapidly growing world population has rendered the necessary intensification of agricultural production for the achievement of higher crop yield and total production. Protected vegetables cultivation is the most intensified cropping system and requires high amounts of fertilizers and pesticides [1,2]. However, despite the fact that higher fertilizer rates result in increased total yield, this practice is not always favorable when the quality of the final product is also considered. On the contrary, it is very common for excessive fertilization to stimulate vegetative growth and increase susceptibility to pathogens, which may result in increased product losses, as well as high nutrient losses due to leaching [3].
In addition, the increasing scarcity of water availability for human activities and irrigation in particular is a worldwide phenomenon and demands appropriate water management practices to ensure crop sustainability and economic activities related to water, especially in semi-arid and arid regions [4]. The use of biostimulants can diminish effects of environmental abiotic stress factors such as water stress, improve soil water-holding capacity and root conformation, and increase root growth with beneficial effects on nutrient and water use efficiency and yield; hence, the past decade has witnessed tremendous growth in the use of biostimulants in the farming sector [5,6,7]. The use of biostimulants containing arbuscular mycorrhizal fungi (AMF), saprophytic fungi, or algae extracts is considered an environmental friendly technique for the alleviation of adverse impact of osmotic stress, by increasing wáter and the nutrient uptake of crops and tolerance to biotic and abiotic stress [8,9,10].
Plant biostimulants usually consist of amino acids and peptide mixtures [11]. They also contain a wide number of bioactive compounds that are able to improve various physiological processes that stimulate plant growth and increase nutrient use efficiency without adverse effects on crop yield and final product quality, while at the same time reduce chemical fertilizers inputs [5,12]. However, the effect of biostimulants may differ from species to species, while it greatly depends on environmental factors during and after application, as well as on the dose and time of application [13,14]. For example, the application of saprophytic fungi (Trichoderma harzianum ALL-42) was associated with increased shoot biomass production and the number of lateral shoots in Phaseolus vulgaris plants due to the beneficial effects of root colonization by fungi on plant root growth [15]. On the other hand, seaweed extracts (Ascophyllum nodosum) increased the plant growth and overall yield of leafy vegetables such as spinach and lettuce [16,17,18], while in bean plants, the application of extracts enhanced root growth and plant development, especially when water stress conditions were imposed [19]. The biostimulatory activity of symbiotic bacteria such as Bacillus sp. is mostly associated with adaptation mechanisms for improved water retention though alterations in plant cell wall composition and hormones production (e.g., indole-3-acetic acid (IAA)) [6]. Therefore, environmental friendly methods such as applying biostimulants for stimulating early growth in vegetable crops and ensuring high yields are innovative agricultural practices that have to be further investigated in order to improve our understanding of their functions and the involved mechanisms of action [20].
Common bean (Phaseolus vulgaris L.) is a drought-sensitive vegetable crop, and water stress may have a detrimental effect on crop yield [21] and the chemical composition of pods and seeds [22,23]. So far, there is limited literature regarding the use of biostimulants on common bean plants, whereas various studies have tested the effects of biostimulants on other legume species, especially under drought stress conditions. In particular, the application of Pseudomonas aeruginosa GGRJ21 strain on mung bean (Vigna radiata (L.) R. Wilczek) under greenhouse and field conditions up-regulated the expression of drought stress-responsive genes, which resulted in better plant growth and development under water stress conditions [24]. Foliar application of amino acids on faba beans (Vicia faba L.) subjected to salt stress showed significant ameliorative effects that were mainly associated with the use of amino acids as carbon and nitrogen pools, which further increased photosynthetic apparatus efficiency [25]. Kumar et al. [26] reported the synergistic effects of Pseudomonas putida and Bacillus amyloliquefaciens on chickpea plants subjected to water stress through the evaluation of several traits, including the activation of plant defense and soil enzymes and plant growth parameters. Moreover, the inoculation of common bean plants with Azospirillum brasilense altered root morphology, which allowed plants to overcome water stress without increasing plant biomass compared to non-inoculated plants [27]. In another study, Klimek-Kopyra et al. [28] suggested that biostimulants application on seeds of seven winter pea cultivars (Pisum sativum L.) may increase frost tolerance through the increased germination percentage and growth rate of seedlings, although a varied response depending on biostimulant x cultivar combination was observed. In contrast, Galvão et al. [19] suggested that the application of Bacillus amyloliquefaciens BV 03 and/or the combination of B amyloliquefaciens BV 03 with A. nodosum extracts did not alleviate water deficit effects on common bean plants. According to Dourado-Neto et al. [29] the use of hormones with biostimulant activity (combination of kinetin, indole butyric acid, and gibberellic acid) on common bean plants through seed treatment, sowing, or foliar spraying may increase the number of grains per pod and grains yield. Moreover, licorice root extracts may have a beneficial role on mitigating the negative effect of salt stress on P. vulgaris plants’ growth and yield, as well as on the total soluble carbohydrates, soluble sugars, and nutrients content [30]. The combined application of salicylic acid and Moringa oleifera leaves extracts has been also reported to mitigate salinity stress effects on common bean plants through the improvement of green pods and seeds yield and the physicochemical characteristics of pods and seeds [31]. Other examples of biostimulants use on common beans crop include the application of Lolium perenne foliage extracts as potent cell defense elicitors [32] and the positive effect of aqueous extracts of moringa leaves and garlic cloves on the yield and chemical composition of snap beans [33,34].
Most of the studies regarding the mitigating effects of biostimulants to abiotic stressors refer to high salinity or nutrient deficiency stress. The main goal of this study was to record the effects of natural biostimulants on the yield, nutritional value, and chemical composition under drought conditions. For this purpose, a drought-sensitive species, namely the common bean (P. vulgaris), was selected and grown in a protected environment under water stress conditions, and the use of commercially available biostimulants products was evaluated as an environmentally friendly and sustainable method for increasing the yield and quality of end-products through the improvement of the chemical composition of the final products (pods and/or seeds) without compromising yield.

2. Materials and Methods

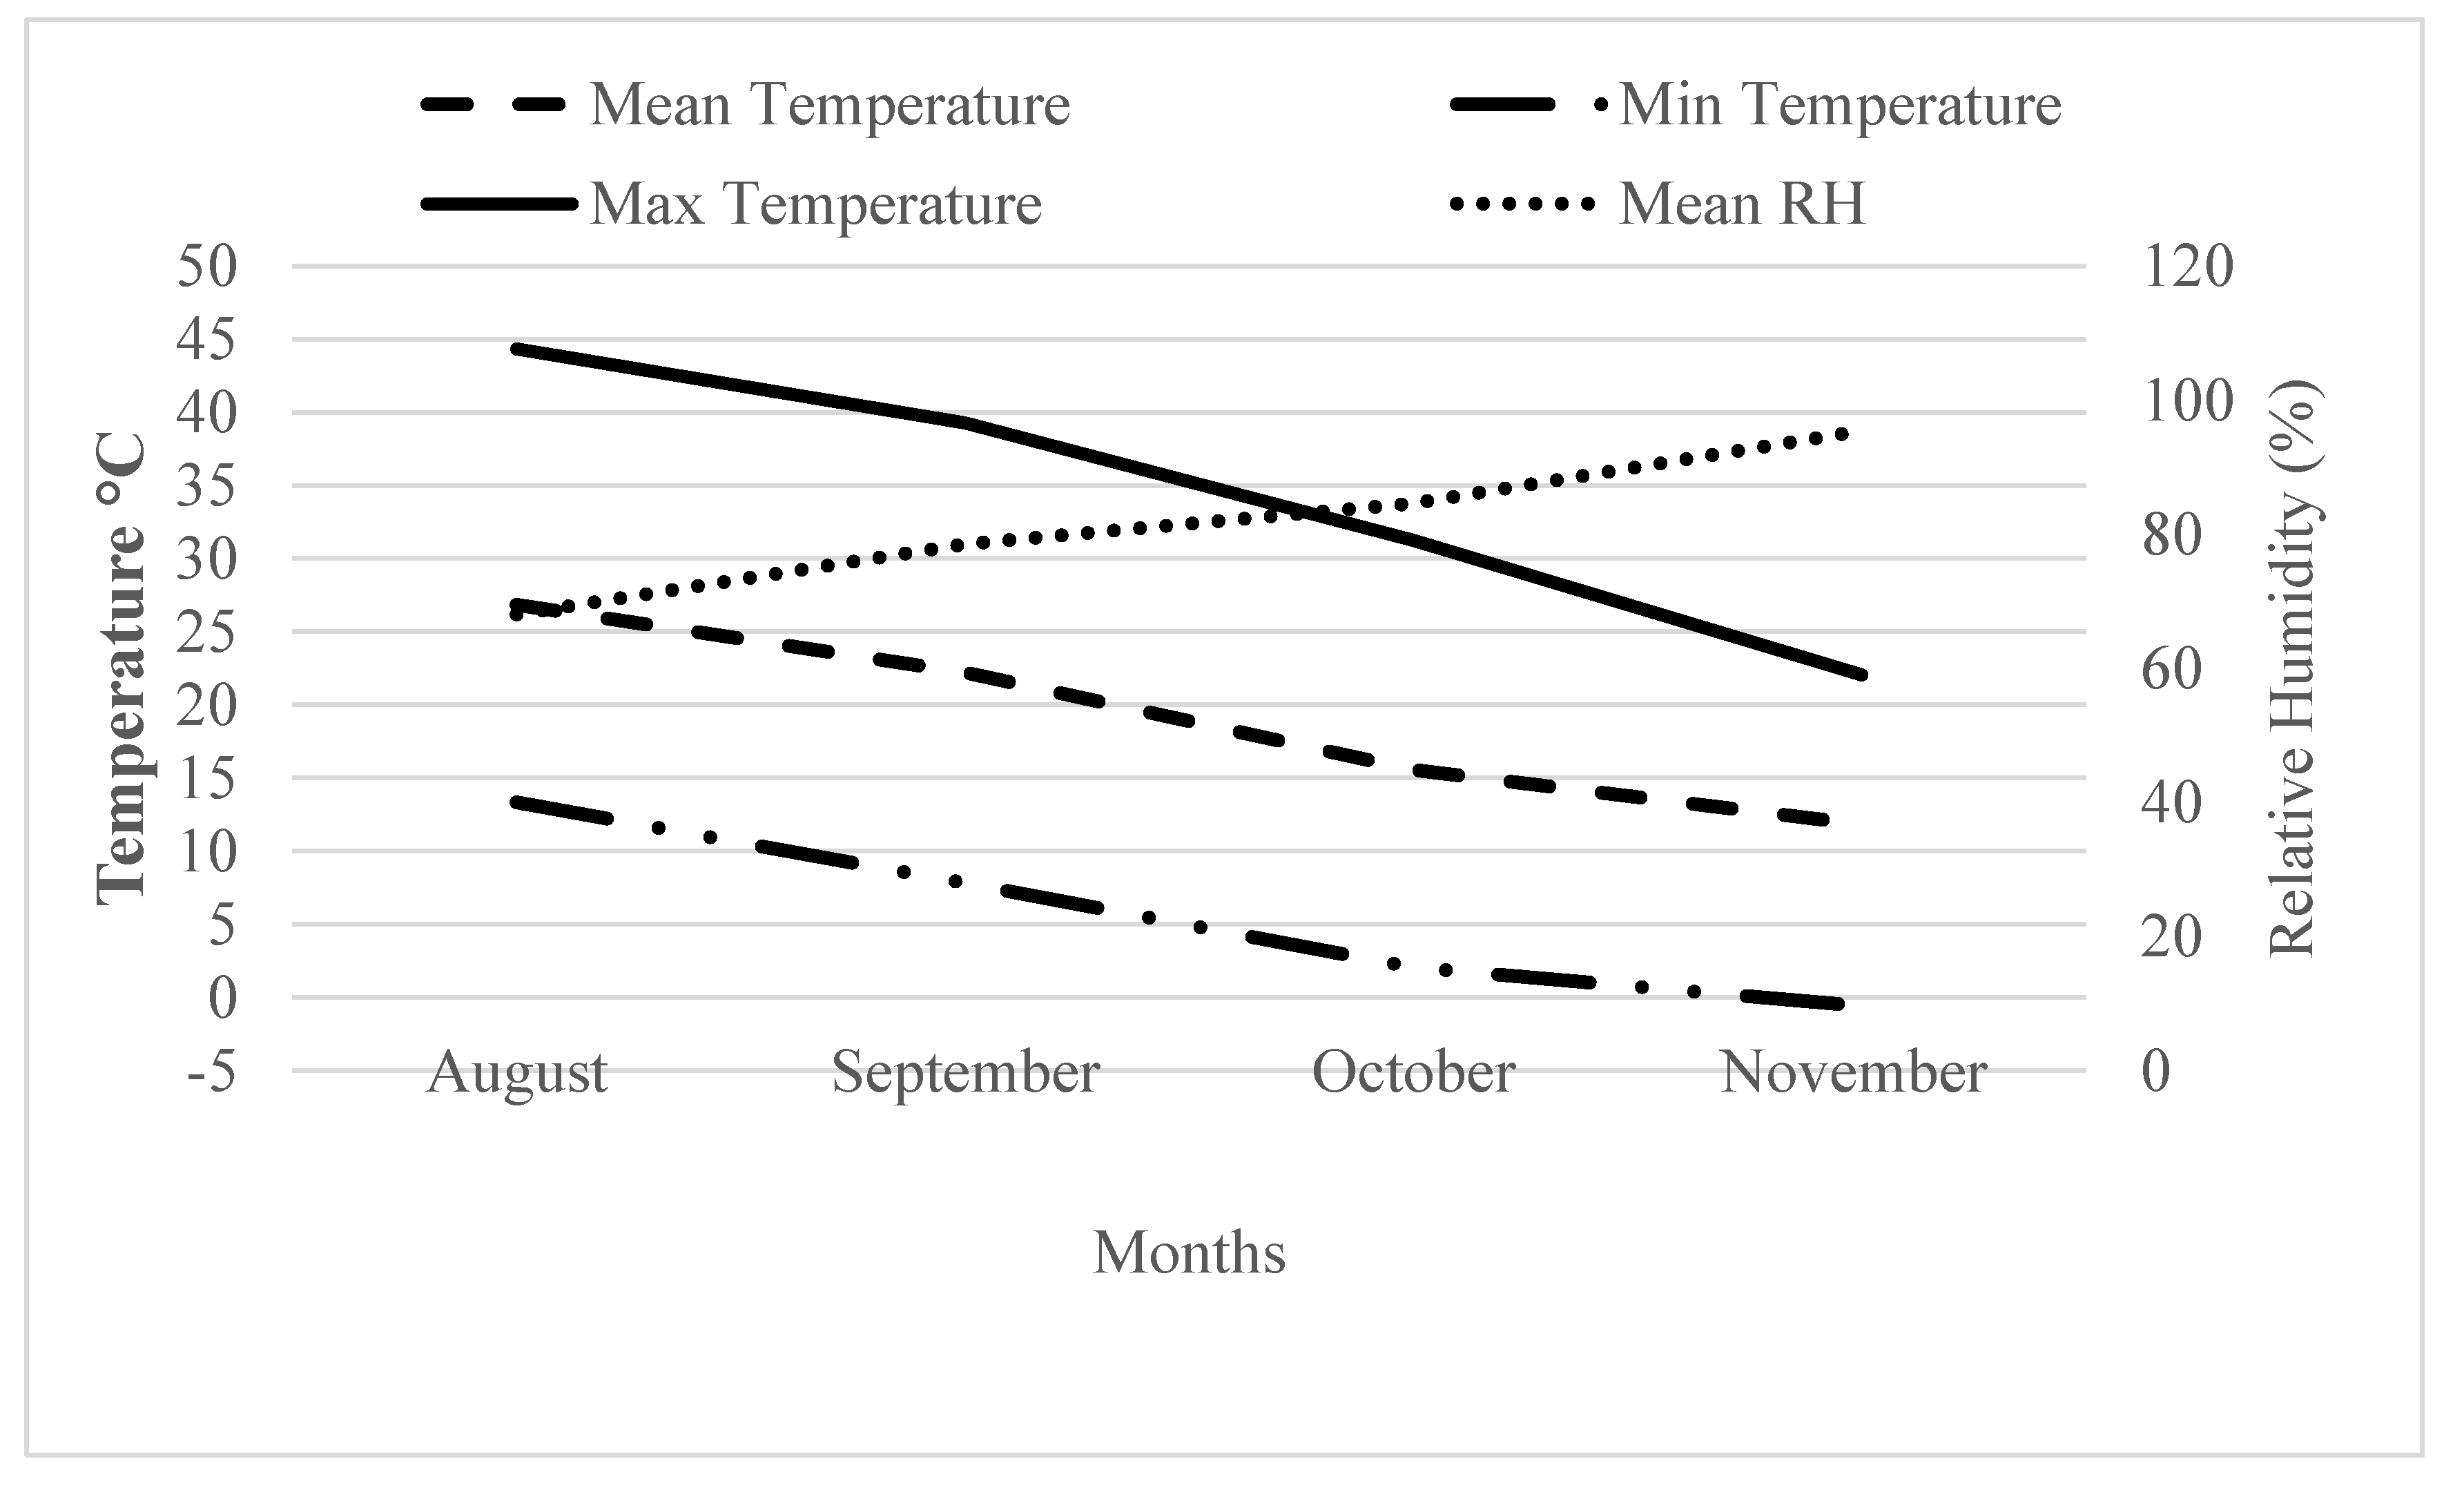
2.1. Plant Material and Growing Conditions

The experiment was carried out during the growing period of summer–autumn 2017. Sowing took place on 11 August 2017 and seeds of bean (Phaseolus vulgaris L.) were sown directly in soil within the unheated plastic greenhouse at the experimental farm of the University of Thessaly, Greece. Seeds were sown in double rows with a spacing of 50 cm between the rows, and the plant density was 2 plants/m2 (20,000 plants/ha), while each treatment consisted of 6 plants and was replicated three times (180 plants in total). The soil at 0–30 cm depth was clay (26% sand, 32% silt, and 42% clay); pH: 8.0 (1:1 soil/H2O); organic matter content: 3.1%; CaCO3: 10.8%; available P (Olsen method): 70.9 mg/kg; total N (Kjeldahl method): 1.8 g/kg; exchangeable K2O (ammonium acetate method): 195 mg/kg; electrical conductivity (ECe): 0.95 dS/m. The growth conditions throughout the experimental period are presented in Figure 1. Two factors were applied in a split-plot factorial design, namely water stress and biostimulants. Biostimulants treatments included: (1) Control (C: no biostimulants added), (2) Nomoren (G; Anthis S.A., Greece) (3) Twin-Antistress (TW; Microspore Hellas–Sacom Hellas, Greece), (4) Veramin Ca (V; Microspore Hellas–Sacom Hellas, Greece), and (5) EKOprop (EK; Anthesis S.A., Greece). Regarding the detailed composition of each product, Nomoren contains 20% arbuscular mycorrhizal fungi (AMF) (Glomus spp.). Twin-Antistress contains natural microorganisms based on Bacillus subtilis, as well as yeast and Ascophyllum nodosum extracts, as well as N (organic): 1%, organic carbon: 10%, and organic matter (<50 kDa): 30%. Veramin Ca contains an amino acid complex of vegetable origin with Aloe vera extract, and CaO: 15.6%. EKOprop contains a mixture of arbuscular mycorrhizal fungi (Glomus spp: 1%), rhizospere symbiotic bacteria (Bacillus spp., Streptomyces spp., Pseudomonas spp.,: 1.6 × 10⁹ CFU/g in total), and saprophytic fungi (Trichoderma spp.: 5 × 10⁵ CFU/g) (Table 1).
Water stress treatments were previously described by the authors and scheduled with the use of tensiometers (Irrometer-Moisture Indicator, Irrometer, Riverside, CA) including: (a) normally irrigated plants (W+) where irrigation was applied approximately twice a week and when tensiometer readings were between 10% and 15%, and (b) water-stressed plants (W-) where water holding was applied with irrigation being implemented approximately once a week and when tensiometer readings were between 40% and 50% [35,36]. Tensiometer readings are percent levels that correspond to soil moisture content ranging from field capacity (0%) to dry soil (100%). Irrigation was applied through a drip irrigation system with one dripper per plant and a water flow rate of 4.0 L/h for each dripper. The total amount of irrigation water was 350 m3/ha (17.5 L per plant) for normally irrigated plants and 210 m3/ha (10.5 L per plant) for water-stressed plants. Biostimulants were applied according to the directions for use of each product at 10, 20 and 30 days after sowing (DAS) as following: (G) was applied with irrigation water at 5 L/ha for each dose; (TW) was applied with irrigation water 5 L/ha for each dose; (V) was applied with foliar spraying at 500 g/100 L H2O for each dose; and (EK) was applied with irrigation water at 1 kg/ha for each dose. Water holding started after the second application of biostimulants (21 DAS). The harvest of green pods took place at marketable maturity at 60 DAS (first harvest) and 70 DAS (second harvest), while seeds were collected from fully mature green pods at 103 DAS. All harvests were carried out on the same plants. After harvest, the fresh and dry weight of pods, as well the fresh and dry weight of seeds, number of seeds per pod, and 100 seeds weight were recorded. The number of seeds per pod and the weight of 100 seeds was evaluated from 10 pods for each plot (30 pods per treatment). Batch samples of pods and seeds were put in deep-freezing conditions, lyophilized, ground with a mortar and pestle, and stored at freezing conditions (−80 °C) until further analyses.

2.2. Chemical Analyses

2.2.1. Nutritional Value

Sample were analyzed in terms of nutritional compounds (moisture, fat, ash, proteins, and carbohydrates) according to the Association of Analytical Communities (AOAC) methods [37]. Moisture was determined by pods and seeds drying at 105 ± 5 °C until constant weight. Crude protein was evaluated by the macro-Kjeldahl method (N × 6.25) using an automatic distillation and titration unit (model Pro-Nitro-A, JP Selecta, Barcelona, Spain), ash content was determined by incineration at 550 ± 15 °C, and the crude fat was determined by extraction with petroleum ether using a Soxhlet apparatus (Behr Labor Technik, Dusseldorf, Germany). Total carbohydrates (g/kg dw) were determined by difference according to the equation: 1000 – (g moisture + g fat + g ash + g proteins), and energy (kcal/kg dw) was determined according to the equation: 4 × (g proteins + g carbohydrates) + 9 × (g fat).

2.2.2. Minerals Composition

Mineral composition analysis was performed in forced-air dried (at 72 °C) and ground to powder pods and seeds, after dry ashing and extraction with 2 N HCl according to the method described by Chrysargyris et al. [38]. Atomic absorption spectrophotometry (PG Instruments AA500FG, Leicestershire, UK) was used for Ca, Mg, Mn, Zn, and Cu content determination, while flame photometry (Lasany Model 1832, Lasany International, Haryana, India) was used for and Na and K content determination. Nitrogen and phosphorus content were determined by Kjeldahl (Digest Automat K-439 and Distillation Kjelflex K-360, BÜCHI, Flawil, Switzerland) and spectrophotometry methods (Multiskan GO, Thermo Fisher Scientific, Waltham, Massachusetts, USA), respectively. The determination of minerals composition was performed only in pods of the second harvest and seeds. Pods of the first harvest were not evaluated due to insufficient amounts of samples for specific treatments, which did not allow a complete set of data. Results are expressed on a dry weight basis.

2.2.3. Tocopherols

Tocopherols were determined in the lyophilized samples by HPLC fluorescence, following a procedure previously described using tocol (Matreya, Pleasant Gap, Pensylvania, USA) as internal standard [39]. Tocopherols standards (α-, β-, γ-, and δ-isoforms, Sigma-Aldirch, St. Louis, MO, USA) were used for compounds identification, and quantification was assessed by the internal standard method. Results were obtained using the Clarity 2.4 software (DataApex, Prague, Czech Republic) and expressed in µg/kg dw and mg/kg dw for pods and seeds, respectively.

2.2.4. Organic Acids

Organic acids were determined in the lyophilized sample and determined by a high-performance liquid chromatography system equipped with a diode array detector (HPLC-DAD), following a procedure previously described [40]. Compounds were identified and quantified by comparison of the retention time, spectra, and peak area recorded at 245 nm and 215 nm (for ascorbic acid and remaining acids, respectively), with those obtained from commercial standards (oxalic, malic, fumaric, and ascorbic acids, Sigma-Aldrich, St. Louis, MO, USA). The results were recorded and processed using LabSolutions Multi LC-PDA software (Shimadzu Corporation, Kyoto, Japan) and were expressed in g/kg dw and mg/kg dw for pods and seeds, respectively.

2.2.5. Free Sugars

Free sugars were determined by HPLC coupled to a refractive index (RI) detector (Knauer, Smartline system 1000, Berlin, Germany) using the internal standard (IS; melezitose). The lyophilized sample was extracted using a methodology previously described [40]. Compounds were identified by comparison with standards (Sigma-Aldrich, St. Louis, MO, USA), and quantification was performed by the IS method. Results were processed using the Clarity 2.4 software (DataApex, Prague, Czech Republic) and expressed in g per kg dw.

2.2.6. Fatty Acids

Fatty acids profile was characterized after a transesterification procedure and according to the method previously described [41]. The analysis was carried out with gas-liquid chromatography with flame ionization detection (GC-FID; DANI1000, Contone, Switzerland). Fatty acids identification and quantification (Clarity DataApex 4.0 Software, Prague, Czech Republic) were performed by comparing the relative retention times of fatty acid methyl ester (FAME) peaks from samples with standards (reference standard mixture 47885-U, Sigma, St. Louis, MO, USA). Results were expressed in the percentage of each fatty acid.

2.3. Statistical Analysis

2.3.1. Experimental Layout and Statistical Treatment

The experimental design was laid out in a split plot arrangement with each main plot consisting of water stress treatments (W+ or W-), while fully randomized sub-plots comprised the biostimulants treatments. Each subplot contained 6 plants and each main plot contained 30 plants. Pod yield components were evaluated in 18 plants for each treatment (n = 18), whereas for seed yield, 30 randomly selected pods from each treatment were measured. In order to constitute a representative and adequate sample of the tested treatments, batches of several samples of pods and seeds were taken at random from each plot in order to obtain three different samples. Then, these batches were powdered to obtain homogenous samples. For each methodology, three extractions were carried out, and the analyses were performed in triplicate. Statistical analysis was conducted with the aid of Statgraphics 5.1.plus (Statpoint Technologies, Inc., Warrenton, VA, USA). Data were evaluated by a two-way analysis of variance (two-way ANOVA), and significant interactions of the tested factors (water regime and biostimulant treatment) were observed. Therefore, all the means for each pod harvest and seeds were compared separately by using the Tukey’s honestly significant difference (HSD) test (p = 0.05).

2.3.2. Linear Discriminant Analysis (LDA)

Linear discriminant analysis (LDA) was applied to evaluate the overall effects of different biostimulants, independently of water level, in each phenological stage (first and second harvest of pods and seeds). The stepwise technique, considering the Wilk’s ʎ test with the usual probabilities of F (3.84 to enter and 2.71 to be removed) for variable selection, was employed. With this procedure, it was aimed to estimate the association between the single categorical dependent variables (biostimulant treatments: C, G, TW, V, EK) and the quantitative independent variables (analyzed parameters: proximate composition, organic acids, tocopherols, sugars, fatty acids). In all cases, a leaving-one-out cross-validation procedure was carried out to assess the model performance.

3. Results and Discussion

3.1. Yield and Growth Parameters

The yield and growth characteristics of pods and seeds are presented in Table 2. Yield was positively affected by the application of EK treatment in normally irrigated plants (EKW+) where higher yields compared to the control and the rest of biostimulant treatments were observed (5284 ± 120 kg/ha, 3701 ± 88 kg/ha, and 8985 ± 196 kg/ha, for the first harvest, second harvest, and total yield, respectively). This increase in pod yield was attributed to the higher number of pods harvested from both harvests in plants treated with the specific biostimulants, while the mean pod weight was also the highest in EKW+ treatment only for aggregated results. On the contrary, the application of V treatment in water-stressed plants (VW-) resulted in the lowest yields for the first and second harvest and consequently in the total yield of green pods (2213 ± 90 kg/ha, 1749 ± 59 kg/ha, and 3962 ± 147 kg/ha for the first harvest, second harvest, and total yield, respectively). Additionally, the number of pods per plant and consequently total yield was higher in normally irrigated plants comparing to water-stressed ones, while GW- and TWW- treatments were the most effective at alleviating the negative effects of stress conditions. Similar results have been reported by Aimo et al. [42], who suggested that the Crocus sativus yield was increased after AMF application due to the higher number of flowers. This was also the case in our study, where the products containing AMF (G) or a mixture of AMF, saprophytic fungi, and rizosphere bacteria (EK) resulted in higher yields in water-stressed and normally irrigated plants, respectively. According to German et al., the inoculation of common bean plants with Azospirillum brasilense increased tap root length as well as the proportion of long and thin roots at the early growth stages, which are critical for plant adaptation to water stress conditions [27]. Moreover, Weber et al. reported an increase of fruit setting and total yield in strawberry plants as the result of Ascophyllum nodosum extracts application [43]. In the present study, the application of products containing A. nodosum extracts had a positive effect on total yield under water stress conditions (TWW-) when compared to non-biostimulant treated plants (CW-), although the product containing AMFs (GW-) was shown to be more effective. According to Arthur et al. [44], biostimulants such as seaweed extracts may contain plant hormones (cytokins and auxins) that induce flower formation. Seaweed extracts (Ascophyllum nodosum) have been also reported to have a positive effect on the plant growth of lettuce, carrot, and strawberry through increased hormone activity and K uptake [18,45,46]. Moreover, the increased yield for plants treated with biostimulants is associated with improved plant tolerance to abiotic stress conditions, which according to Battacharyya et al. [47] could be attributed to various protective mechanisms such as the regulation of related genes, the accumulation of osmolytes, the improvement in water-use efficiency, and other effects on the plant rhizosphere. Moreover, Ahmad et al. [10] reported that the inoculation of Indian mustard plants with Trichoderma harzianum alleviated osmotic stress effects through the activation of plant antioxidant mechanisms.
Regarding the weight of 100 seeds, the highest value was observed for the EK treatment under water stress conditions (EKW-), while normally irrigated plants with no added biostimulants (CW+) presented the lowest values (122 ± 2 and 101 ± 2 for EKW- and CW+ treatments, respectively) (Table 2). Moreover, the weight of 100 seeds and number of seeds per pod were higher and lower, respectively, for water-stressed plants regardless of biostimulants treatment when compared to the control treatment of normally irrigated plants, indicating that water stress may affect the fertilization process and consequently the number of seeds per pod. The beneficial use of plant-growth promoting rhizobacteria under water stress conditions has been also reported by Sarma and Saikia [24], who suggested that the inoculation of mung bean plants with Pseudomonas aeruginosa strains alleviated water stress effects through the scavenging of oxidative enzymes. Moreover, Korir et al. [48] reported a synergistic effect of plant growth promoting bacteria with common bean rhizobia that enhanced plant growth and development, while Farouk and Abdul Qados [49] suggested that folic acid application increased the seed yield and chemical composition of pea plants (Pisum sativum).

3.2. Nutritional Value

The nutritional value of the pods and seeds is presented in Table 3. The application of biostimulants did not have a beneficial effect on the moisture content of pods in the first harvest when compared with the control treatment for either normally irrigated (CW+) or water-stressed plants (CW-). Similar trends were observed under prolonged water stress (second harvest), while for normally irrigated plants, the VW+ treatment resulted in the highest moisture content values. For both harvests, the lowest values were recorded for pods harvested from water-stressed plants treated with the V treatment (VW-). These findings could be probably attributed to a functional allocation equilibrium where under biostimulant treatments, plants allocated resources and biomass in fruit; thus, a reduction in moisture content (or similarly an increased dry matter content) was observed [50]. Moreover, plants under stress tend to accumulate minerals and metabolites as a means to maintain high water potential [5]. However, considering that these trends were observed both in water-stressed and normally irrigated plants highlights the need for further investigation. On the other hand, the moisture content of seeds was beneficially affected by the various biostimulants in plants grown under water stress conditions, especially for G treatment (GW-), where the highest values were observed. Regarding the rest of the nutritional value parameters, a varied effect of biostimulants and irrigation treatments was observed in terms of fat, protein, ash, and carbohydrates content and the energetic value of pods and seeds. In particular and for the first harvest of pods, protein, ash content, and energetic value were beneficially affected under the normal irrigation regime, while carbohydrates content was the highest for water-stressed plants with no added biostimulants. Similarly, a beneficial effect of GW+ treatment on protein and ash content was observed for the pods of the second harvest, whereas fat and carbohydrates content were the highest for water-stressed plants that received no biostimulants (CW-) or the G treatment (GW-). The energetic value was the highest for normally irrigated plants that received no biostimulants. Seeds’ nutritional value was beneficially affected by the application of G treatment under normal irrigation conditions (GW+) when proteins, fat, and ash content were considered, whereas EK and G treatments increased energetic value under the same irrigation treatments (5468 ± 6 kcal/kg dw and 5474 ± 3 kcal/kg dw, respectively). The highest carbohydrates content values were recorded for normally irrigated plants where no biostimulant or the V treatment was applied (CW+ and VW+, respectively), as well as for water-stressed plants that received the EK treatment (EKW-). Significant differences were also observed between normally irrigated and water-stressed plants in a biostimulant treatment-specific manner, although no direct comparisons between the corresponding treatments were performed due to the presence of significant interactions among the tested factors. Nevertheless, it is worth highlighting the beneficial effects of biostimulants on the protein content of green pods under water stress conditions compared to the corresponding control treatment (CW-). The effect of biostimulants on plant metabolism and the quality of end-products has been previously reported by Colla et al. [51], while Przygocka-Cyna and Grzebisz [52] have associated the use of biostimulants with the improvement in plant nutrient uptake and therefore with the better nutritional value of the end products. Moreover, according to Elsheikh et al., the inoculation of faba bean (Vicia faba) plants with arbuscular mycorrhiza increased the protein content in the seeds, regardless of irrigation conditions, suggesting the improved nutritional status of plants as the main reason for this increase [53]. Similarly, Farouk and Abdul Qados [49] suggested that folic acid and hydrogen peroxide application may improve the nutritional value of pea seeds through the increase of protein and carbohydrates content, while Elsheikh and Mohamedzein reported that the inoculation of groundnut with Glomus sp. and Bradyrhizobium sp. increased the protein content of seeds. Regarding the biostimulatory activity of seaweed extracts, Kocira et al. [54] and Castellanos-Barriga et al. [55] reported contrasting effects of Ecklonia maxima and Ulva lactuca extracts on the nutritional value of common bean (P. vulgaris) and mung bean (Vigna radiata) seeds, respectively. These differences in the literature reports highlight the variable biostimulatory effects of seaweed extracts, which contain a wide range of compounds associated with improved plant nutrient uptake, phytohormone-like activities, tolerance to abiotic stressors, and the modulatory effects of plant metabolism and physiology [47].

3.3. Mineral Composition

The mineral composition of pods and seeds is presented in Table 4. The combination of biostimulants application and irrigation regime had a varied effect on mineral content of pods and seeds with no specific trends being observed. In particular, the application of V treatment under water stress conditions (VW-) increased the nitrogen content of pods without being significantly different from normally irrigated control plants (CW+). Similarly, the highest values of nitrogen content in seeds were recorded for GW- and TWW-. Positive effects were observed for K content in the pods of normally irrigated plants that received G treatment (GW+), whereas no significant differences were observed in the K content of seeds for the tested treatments. EKW+ and GW+ resulted in the highest values for P content in pods and seeds, respectively, whereas contrasting effects of the irrigation regime × TW treatment combination were observed on Ca content where TWW- and TWW+ increased its content in pods and seed, respectively. The Na content of pods was the highest when EK treatment was applied regardless of the irrigation regime, while similar results were observed in seeds for the control and V treatment. The Mg content of pods and seeds increased when no biostimulants or the V treatment were applied on water-stressed plants, respectively. Moreover, the Cu content of pods was beneficially affected by the EK treatment, regardless of the irrigation regime, whereas for seeds, the highest values were recorded for the TWW+ treatment. Regarding the Zn content, the highest values in pods and seeds were observed for the EKW+ and VW- treatments, respectively. Finally, the Mn content of pods increased when V and G treatments were applied, regardless of the irrigation regime, whereas for seeds, the application of biostimulants had a negative effect on Mn content when compared to control treatments (CW- and CW+). The impact of biostimulants on the nutrient content of agricultural products could be attributed to the fact that they usually contain various minerals in their composition [5]. Mineral uptake from plants may help in maintaining high stomatal conductance and leaf water potential; therefore, biostimulants may improve the nutritional status of plants and induce tolerance to abiotic stress factors such as drought stress [56]. In addition, according to Chrysargyris et al. [18], the application of Ascophyllum nodosum seaweed extracts alleviated the negative effects of K deficiency on lettuce plants, while the beneficial effect of AMFs as biostimulants has been associated with higher P uptake from plants [57]. This was the case in our study under normal irrigation conditions where the P content of pods was the highest for the EK treatment. The results from the study of Colla et al. [58] confirm the beneficial effect of biostimulant application on the Ca content of tomato fruit for the seaweed extracts treatment, which was also observed in our study for TW treatment, regardless of the irrigation regime. Moreover, it has been reported in several studies that the inoculation of plants with mixtures of bacteria has better results in nutrient mobilization and uptake compared to inoculation with a single bacterium [26], which was also the case in our study where EK treatment increased the P, Na, Cu, and Zn content in the pods of normally irrigated plants.

3.4. Tocopherols

The main detected tocopherols in pods were γ-tocopherol, followed by α-tocopherol, while seeds contained mainly γ-tocopherol and less amounts of δ- and α-tocopherol (Table 5). The application of TW treatment resulted in a significant increase of γ-tocopherol (104% and 18.3% for the TWW+ and TWW- treatments, respectively) and total tocopherols (82.3% and 19.4% for the TWW+ and TWW- treatments, respectively) in the pods of the first harvest compared to the control treatments (CW+ and CW-). In contrast, the application of G treatment had a negative effect on the γ-tocopherol content in pods of the first harvest under water stress conditions (reduced by 45.7%), while EK treatment resulted in the lowest content of α-tocopherol for the same irrigation regime (1800 ± 40 μg/kg dw). In the second harvest, the highest values for γ- and total tocopherols were recorded for the VW- treatment (3500 ± 20 μg/kg dw and 5250 ± 10 μg/kg dw, respectively), while pods from the control treatment (CW-) contained the highest amounts of α-tocopherol (1810 ± 20 μg/kg dw). In addition, drought stress increased the individual and total tocopherols content for all the biostimulant treatments, except for G treatment, where normally irrigated plants had a higher content of tocopherols compared to water-stressed ones. The observed increase of tocopherols in pods under prolonged water stress conditions could be attributed to the induction of self-defense mechanisms by biostimulants application and the production of antioxidant compounds such as tocopherols [59]. However, the variable effects of the tested biostimulants indicate a diverse plants x biostimulant interaction, as well as the induction of different mechanisms in each combination depending on the biostimulant composition and the severity of stress [60]. Therefore, although in the first harvest TWW- treatment induced tocopherols biosynthesis as a non-enzymatic antioxidant mechanism, under prolonged stress conditions, VW- (second harvest) and VW+ (seeds) treatments were beneficial to tocopherols content. Regarding seeds, the presence of α- and γ-tocopherol has been previously reported in common bean seeds by Kan et al. [61]. In our study, γ-, δ-, and the total tocopherols content was the highest under normal irrigation conditions and for those plants that did not receive biostimulants or the V treatment was applied. In contrast, EK treatment had a negative effect on tocopherols content under water stress conditions. According to the literature, Ca and amino acids supplementation (as in the case of V treatment in our study) may induce the biosynthesis of non-enzymatic antioxidants such as tocopherols and increase tolerance against drought stress [62,63,64,65].

3.5. Organic Acids

The main detected organic acids in pods were malic and oxalic acid, while ascorbic acid was detected in less amounts in specific treatments of the first harvest (Table 6). On the other hand, malic and oxalic acid were the main organic acids detected in seeds, followed by ascorbic acid and traces of fumaric acid. The application of the VW+ treatment resulted in the highest content of oxalic and malic acid and total organic acids in pods of the first harvest (26.3 ± 0.1 g/kg dw, 23.1 ± 0.1 g/kg/dw, and 49.4 ± 0.1 g/kg/dw, respectively). Similarly, in the second harvest, the highest content of oxalic and malic acid was recorded for the GW+ and VW- treatments (22.7 ± 0.2 g/kg/dw and 24.6 ± 0.2 g/kg/dw, respectively), while total organic acids content was most abundant in the GW+ treatment (46.9 ± 0.1 g/kg/dw). Regarding seeds, VW- treatment resulted in the highest content of oxalic and malic acid, and total organic acids (752 ± 1 mg/kg/dw, 1440 ± 40 mg/kg/dw, and 2780 ± 30mg/kg/dw, respectively), whereas the highest amounts of ascorbic acid were detected in GW+ treatment (715 ± 4 mg/kg dw). Considering the antinutritional properties of oxalic acid, it is worth mentioning that EKW- treatment resulted in the lowest content for both pod harvests when compared with the rest of the treatments where biostimulants were applied, although in all the cases, the oxalic acid content was considerably low. On the other hand, in the case of seeds, the application of EKW+ and TWW+ treatments significantly reduced the oxalic acid content compared to the control and the rest of the biostimulant treatments. Although there are reports in the literature that suggest that organic acids increase under stress conditions, according to Zushi and Matsuzoe [66], this increase could be attributed only to a concentration effect due to the increase in dry matter content under stress conditions. According to other studies, the composition of biostimulants may significantly affect the organic acids composition, especially those biostimulant products that contain microorganisms such as Twin-Antistress and EKOprop in our study [36,67]. However, although the total organic acids content of pods harvested from water-stressed plants was in general higher in biostimulant-treated plants compared to the control treatment (CW-), the application of the EKW- treatment resulted in a significant reduction of organic acids content. This finding is reflected to the reduced total pod yield for this treatment (see Table 2), suggesting a non-effective alleviating mechanism against water stress related to biostimulant product composition. Moreover, the effect of V treatment on the oxalic acid content of seeds under water stress conditions (VW-) could be attributed to Ca addition, which is associated with calcium oxalate formation for the removal of excessive calcium or oxalic acid [67].

3.6. Free Sugars

The sugars composition of pods and seeds is presented in Table 6. The main detected sugar in the pods of both harvests was fructose, followed by glucose and sucrose, whereas in seeds, only sucrose was detected. Similarly with our study, Kan et al. [61] detected sucrose as the main sugar in common bean seeds, while they also detected the presence of glucose; this difference could be attributed to the different harvesting stages (fully dried seeds comparing to fully developed green seeds in our study), which may affect hydrolysis and the transformation of sugars after harvest [68]. In the first harvest, the highest content of individual and total sugars were recorded in TWW- (fructose: 198 ± 1 g/kg dw), CW- (glucose: 135 ± 5 g/kg dw; total sugars: 333 ± 7 g/kg dw), and VW- (sucrose: 7.6 ± 1 g/kg dw) treatments. Under prolonged water stress (second harvest), the application of G treatment (GW-) resulted in the highest content of fructose, glucose, and total sugars (232 ± 7 g/kg dw, 140 ± 7 g/kg dw, and 380 ± 10 g/kg dw, respectively), while the sucrose content was the highest for the TWW- treatment (15.3 ± 0.8 g/kg/dw). Similarly, the highest content of sucrose in seeds was recorded for the GW- treatment (22.9 ± 0.7 g/kg dw). The low levels of sucrose in pods could be attributed to the inhibitory activity of hexose sugars (fructose and glucose) to sucrose synthase activity [68]. Moreover, for most of the tested biostimulants and control treatments, the total and individual sugars content was higher in water-stressed plants than normally irrigated plants, especially for G treatment—that resulted in the highest total sugars content, which could be associated with osmoprotective effects against water stress [69]. Considering the involvement of soluble sugars in plant defense mechanisms as well as in the regulation of stress and growth-related genes, the findings of our study suggest an efficient defense mechanism against water stress for the AMF-containing biostimulant product (G treatment), as already justified by the increased pods yield under water stress conditions for the same treatment (see Table 2). According to the literature, inoculation with AMF is associated with increased soluble sugars content in Ipomea batatas and Vigna subterranea under drought stress, since sugars may serve as organic carbon pools to be used for photosynthates and biomass production [70]. Apart from the osmoregulatory role of sugars in plant defense mechanisms against stress, sucrose content is also related with secondary metabolites biosynthesis, which may also contribute to the overall non-enzymatic tolerance of plants under stress [71].

3.7. Fatty Acids

The main fatty acids composition is presented in Table 7. Seventeen individual fatty acids were detected in pods and seeds regardless of the irrigation treatment and harvest (data not shown). Pods were abundant in α-linolenic (C18:3n3), linoleic (C18:2n6c), and palmitic acid (C16:0) followed by stearic (C18:0), oleic (C18:1n9c), behenic (C22:0), and lignoceric acid (C24:0), which were detected in lower amounts. Similarly, in seeds, the most abundant fatty acids were α-linolenic, linoleic, and palmitic acid, followed by stearic and oleic acid. In the first harvest of pods, GW- and EKW- treatments had a beneficial effect on palmitic and linoleic acid content in water-stressed plants (25.6 ± 0.3% and 35.02 ± 0.01%, respectively), whereas in normally irrigated plants, TWW+ treatment resulted in the highest content of α-linolenic acid (42.76 ± 0.06%). In the second harvest, fatty acids composition showed a varied response, with control and TW treatment resulting in the highest content of linoleic and palmitic acid for normally irrigated plants (43.3 ± 0.1% and 28.90 ± 0.06, respectively), whereas α-linolenic acid content was the highest for the GW- treatment (34.33 ± 0.09%). For seeds, the highest amounts of α-linolenic, linoleic and palmitic acid were recorded in the treatments of GW-, CW+, and VW+ (59.08 ± 0.02%, 29.54 ± 0.02%, and 11.86 ± 0.03%, respectively). Polyunsaturated fatty acids (PUFA) were the most abundant fatty acids class, followed by saturated (SFA) and monounsaturated fatty acids (MUFA) in both seeds and pods due to the high amounts of α-linolenic and linoleic acids. Overall, the ratios of PUFA/SFA and n-6/n-3 fatty acids were higher than 0.45 and lower than 4.0 for all the tested treatments, respectively, which according to Petropoulos et al. [72] is indicative for the good nutritional value of a food product. Moreover, the increase of PUFAs under water stress conditions comparing to the control treatment (CW-) for all the biostimulant treatments except for GW- (first harvest) and EKW- (second harvest) treatments indicates the stimulation of plant antioxidant mechanisms which effectively quenched the reactive oxygen species (ROS) that appear after stress initiation and induce lipid peroxidation and decrease fatty acids content [10,73]. Fatty acids may also serve as organic carbon pools to be used for photosynthates and biomass production [70]. Therefore, considering that inoculation with AMFs and bacteria induces synergistic effects between plants and symbionts that may improve plant nutrient and water uptake, this could be the reason for the increased content of fatty acids.

3.8. LDA Analysis

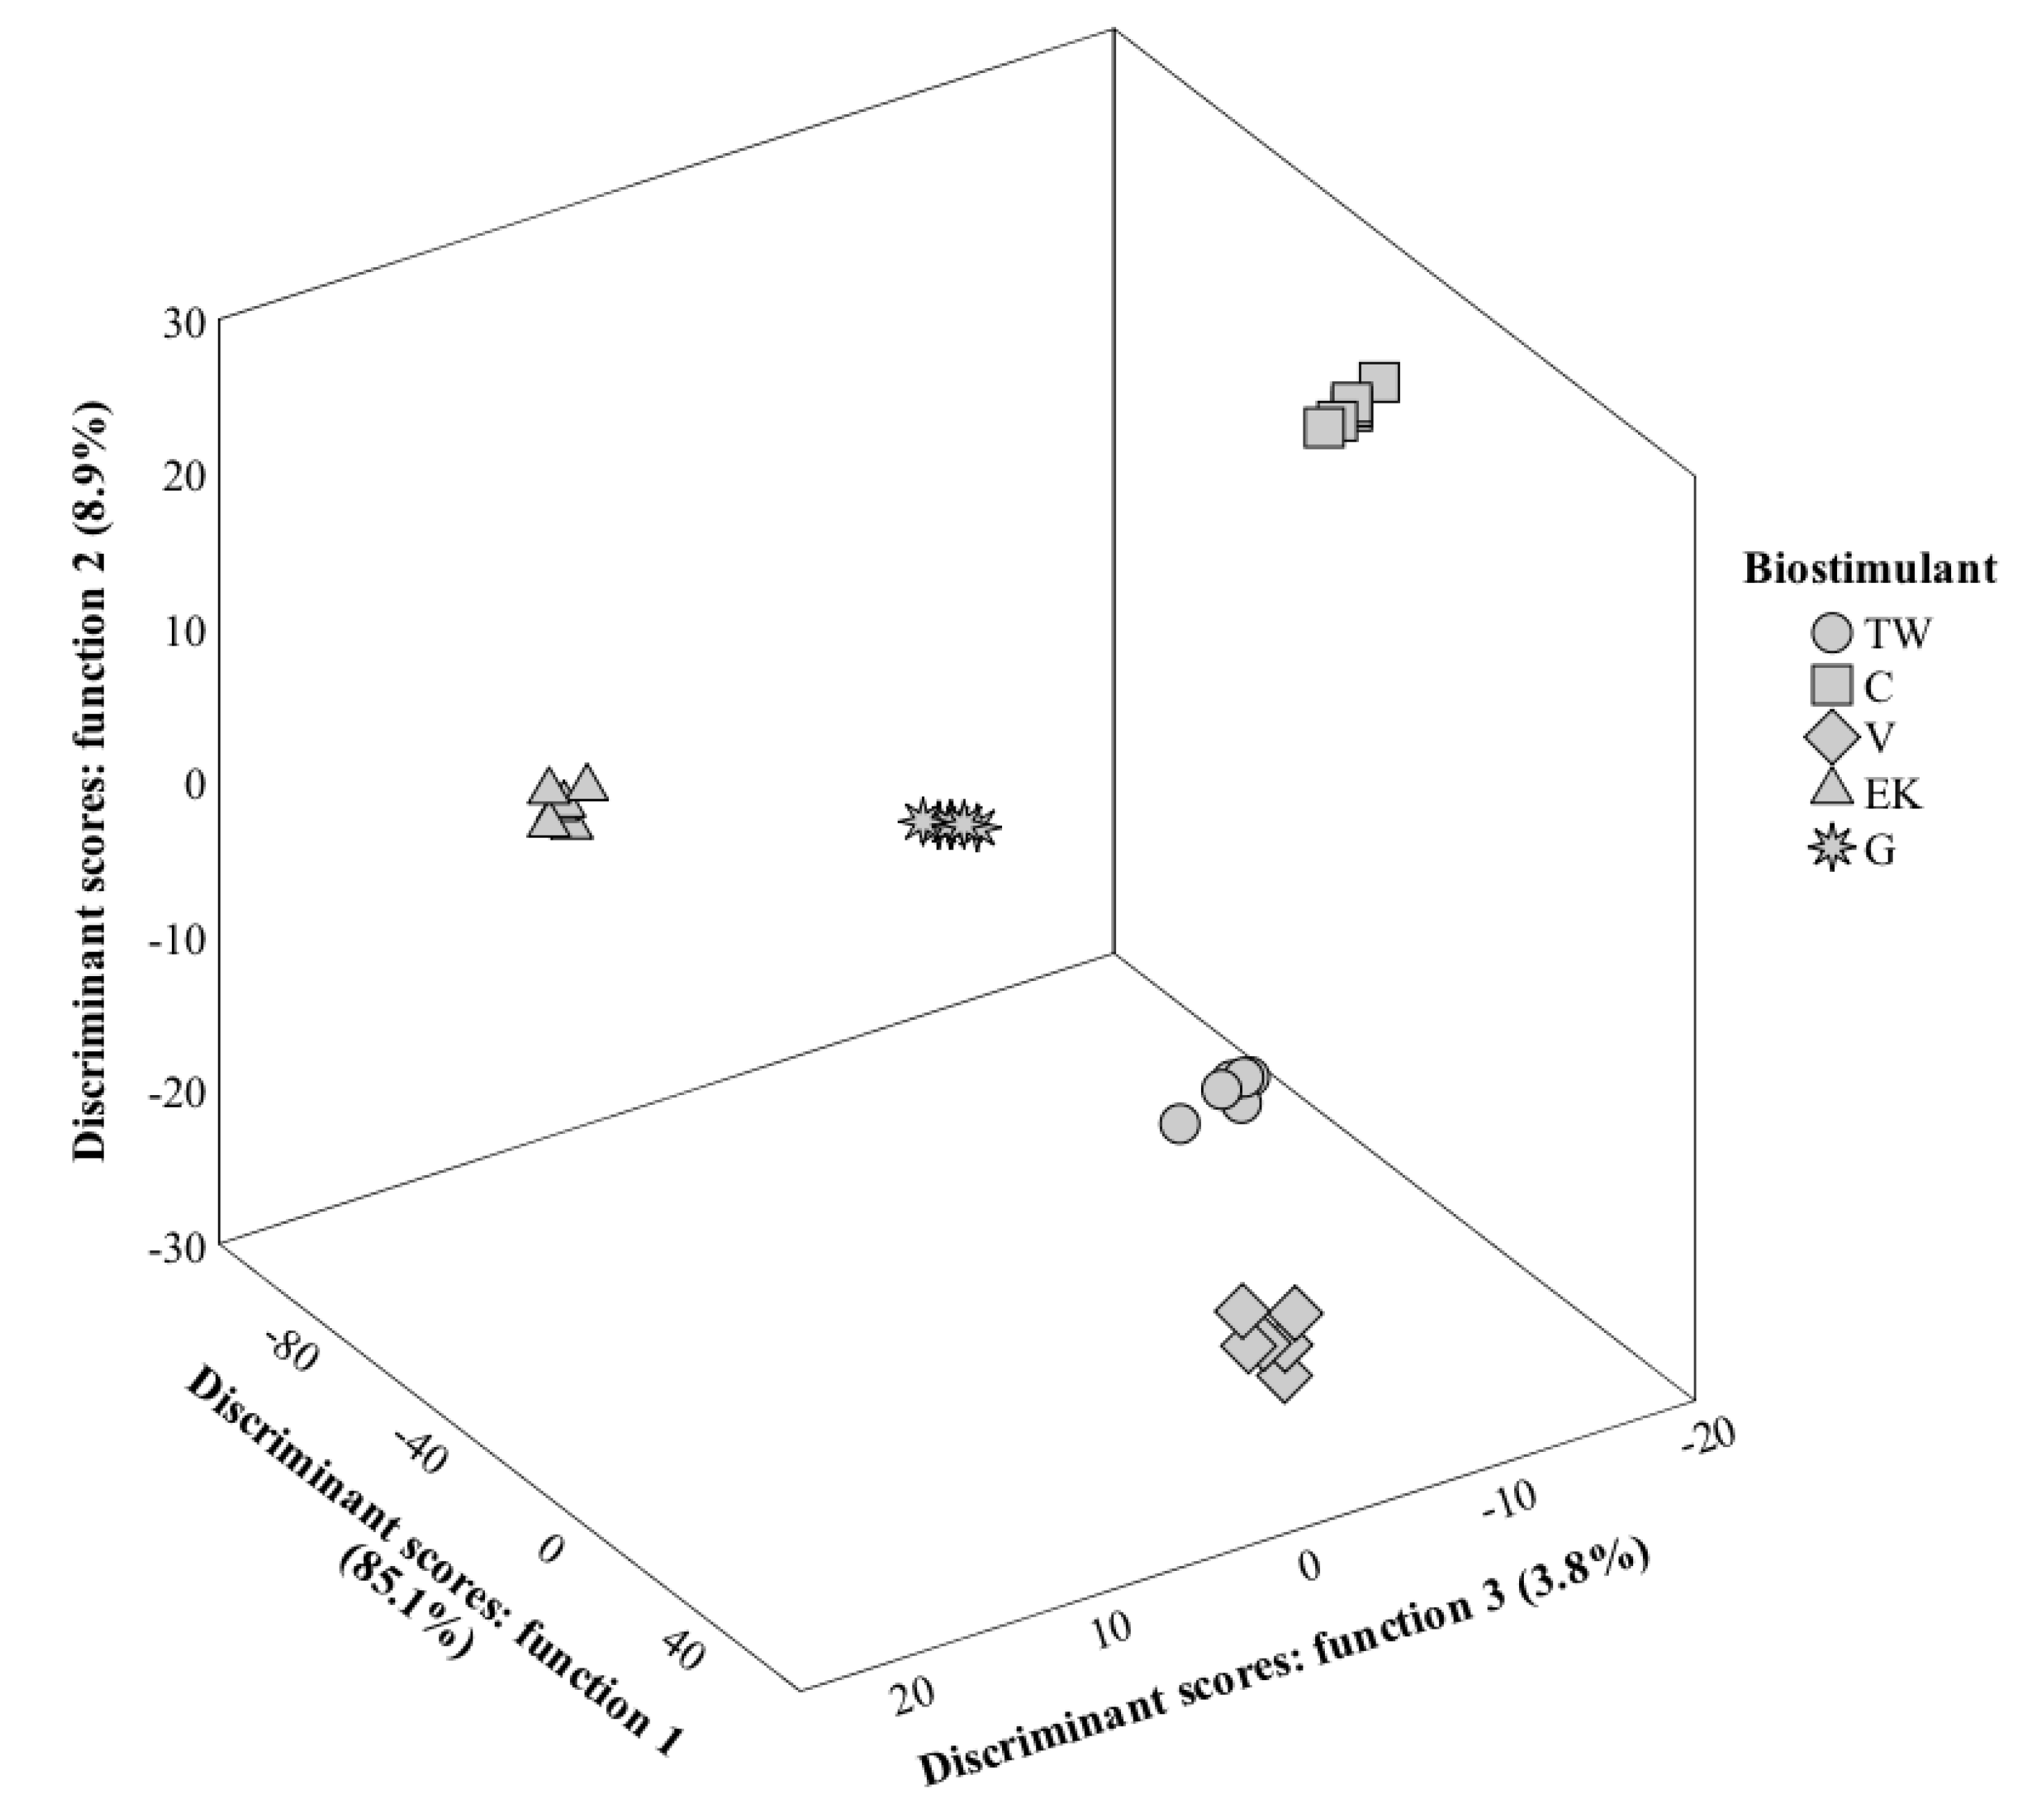
3.8.1. First Harvest

In the first harvest, the linear discriminant analysis (LDA) selected PUFA, C17:0, ascorbic acid, glucose, α-tocopherol, C16:1, C14:0, C16:0, carbohydrates, and C22:1 as variables with discriminant ability, which is equivalent to say that these were the parameters showing the most profound changes in result of using different biostimulants (Figure 2). Function 1 separated primarily samples treated with G, which was placed in the farthest position in the negative side of the axis; in turn, the biostimulants with the most similar effect according to this function (which was the most important, as it included 85.1% of the observed variance) were V and TW. In turn, Function 2 separated mainly C samples, which was mostly due to their higher contents in carbohydrates and glucose (in this case, specifically in W- samples). The most noticeable effect of Function 3 was the individualization of markers corresponding to EK samples, which was mostly due to the levels of PUFA, C16:0, and C14:0.

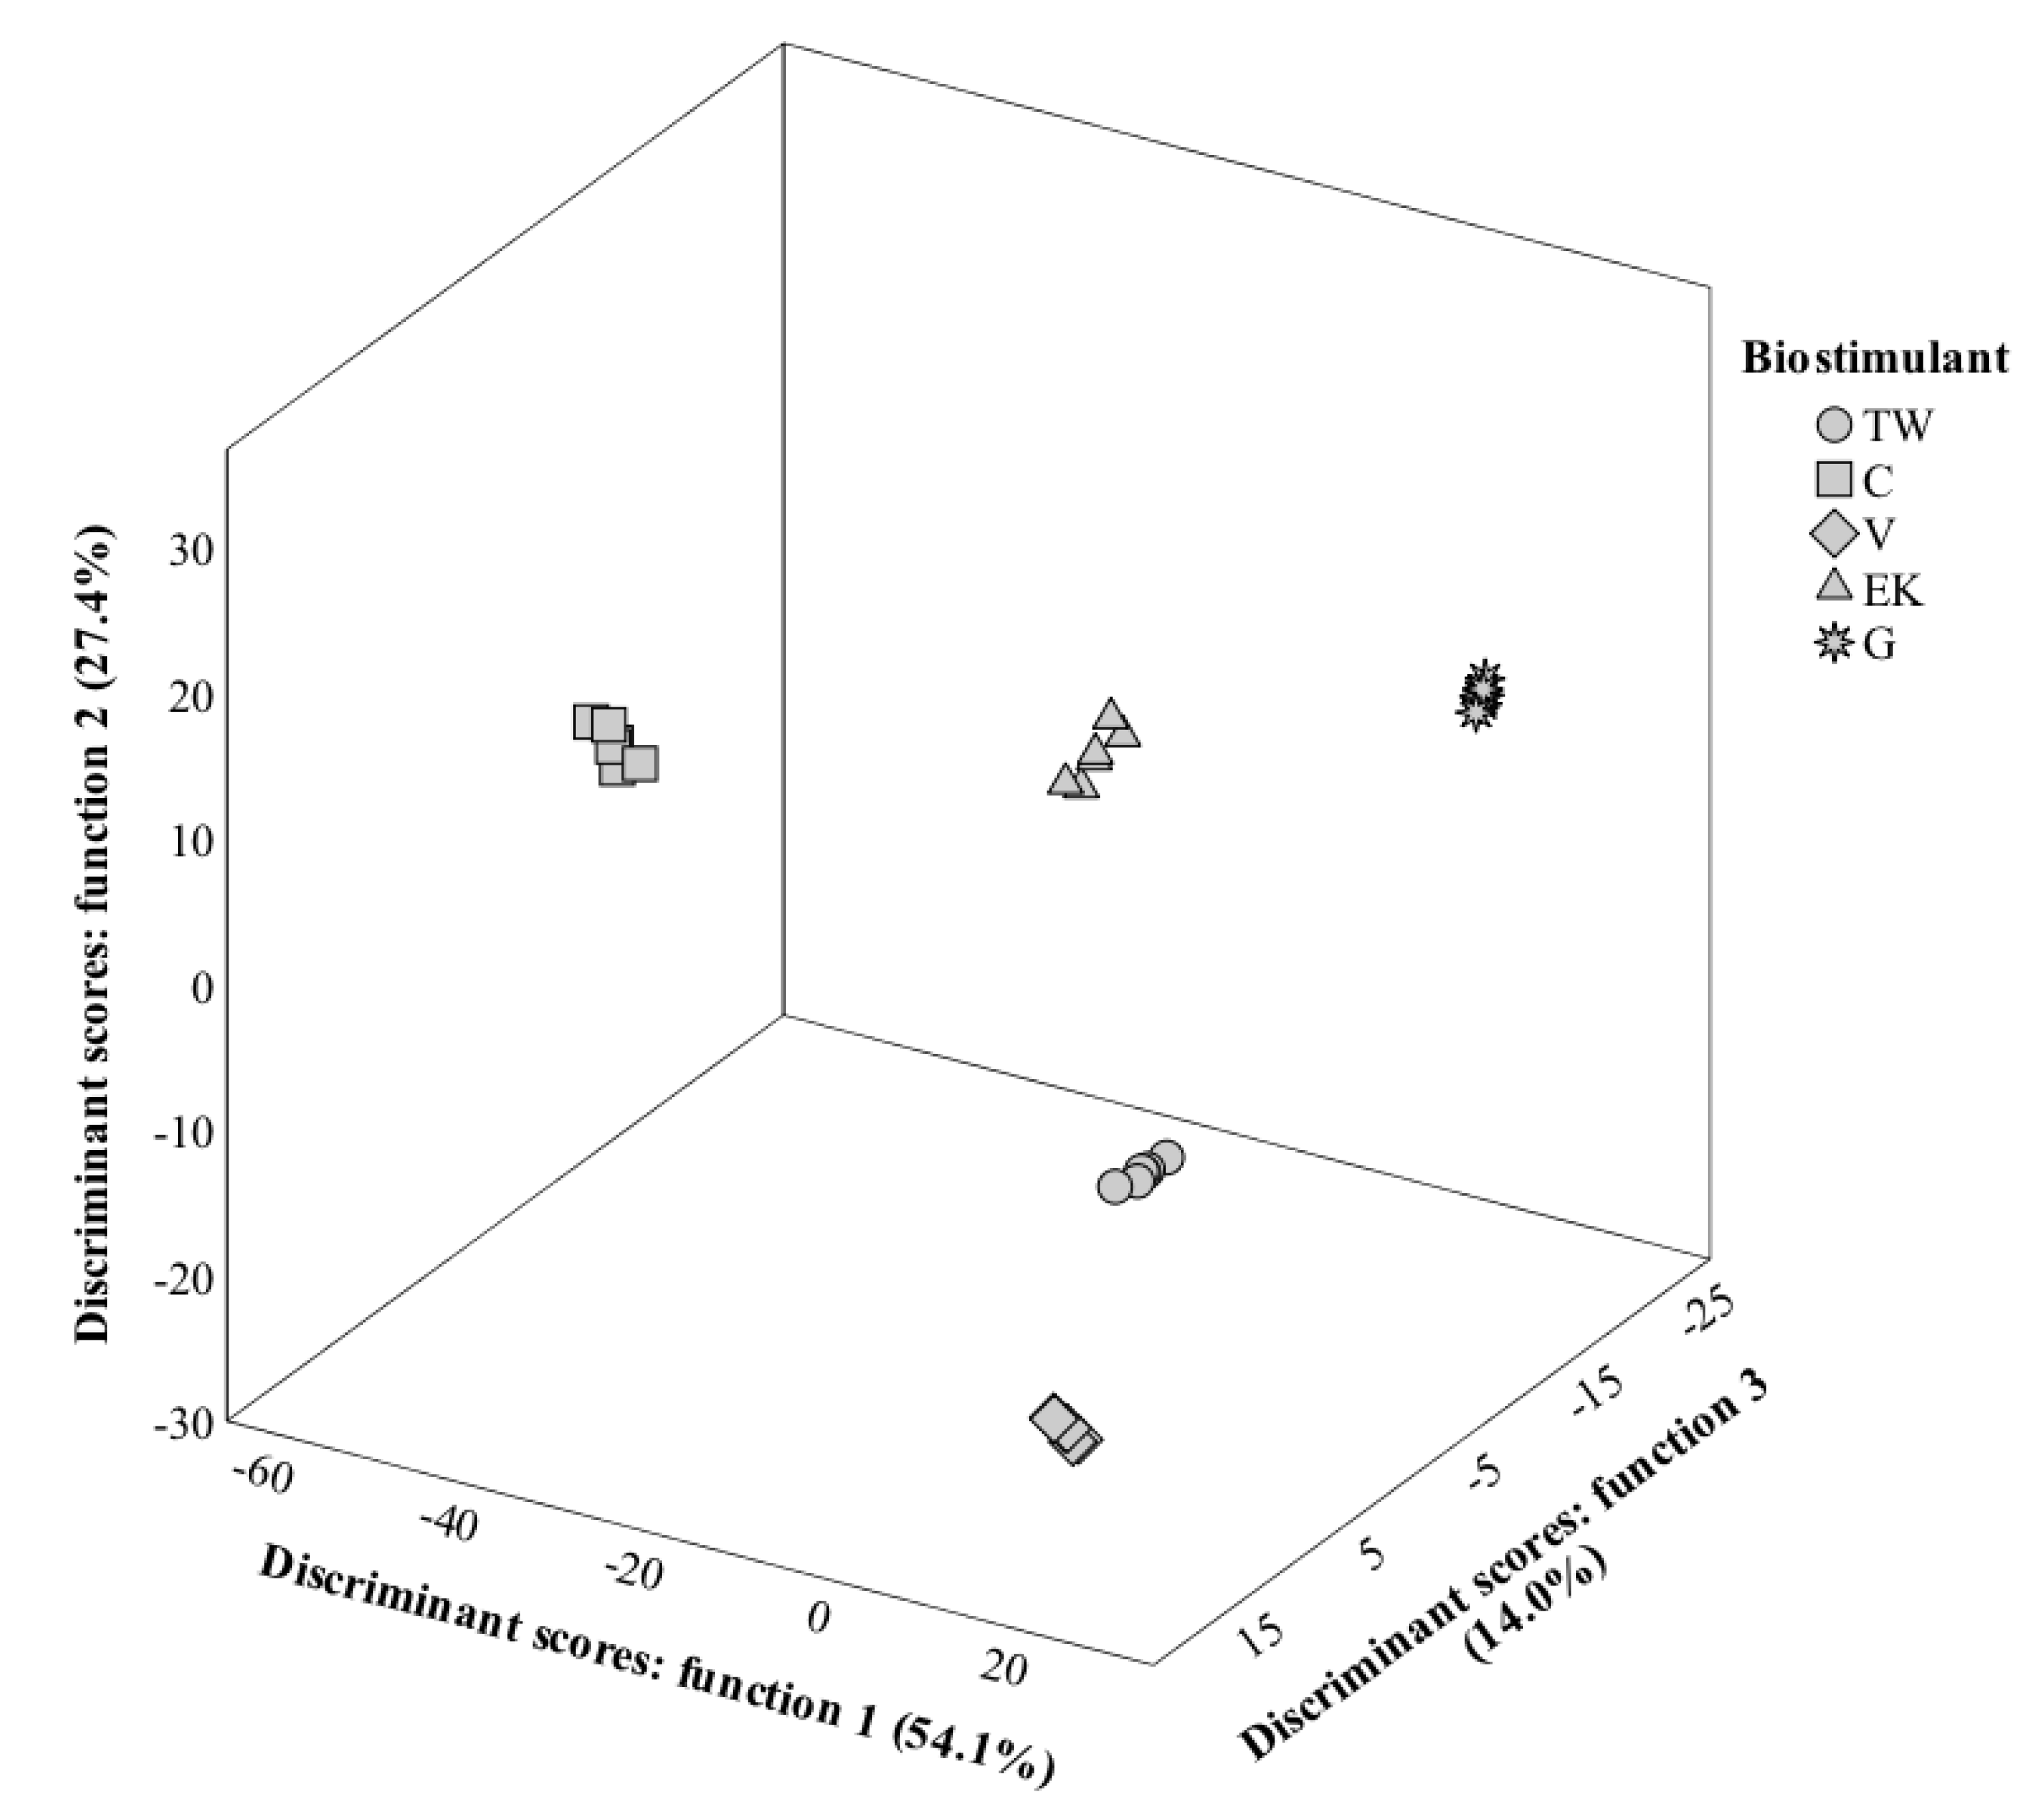
3.8.2. Second Harvest
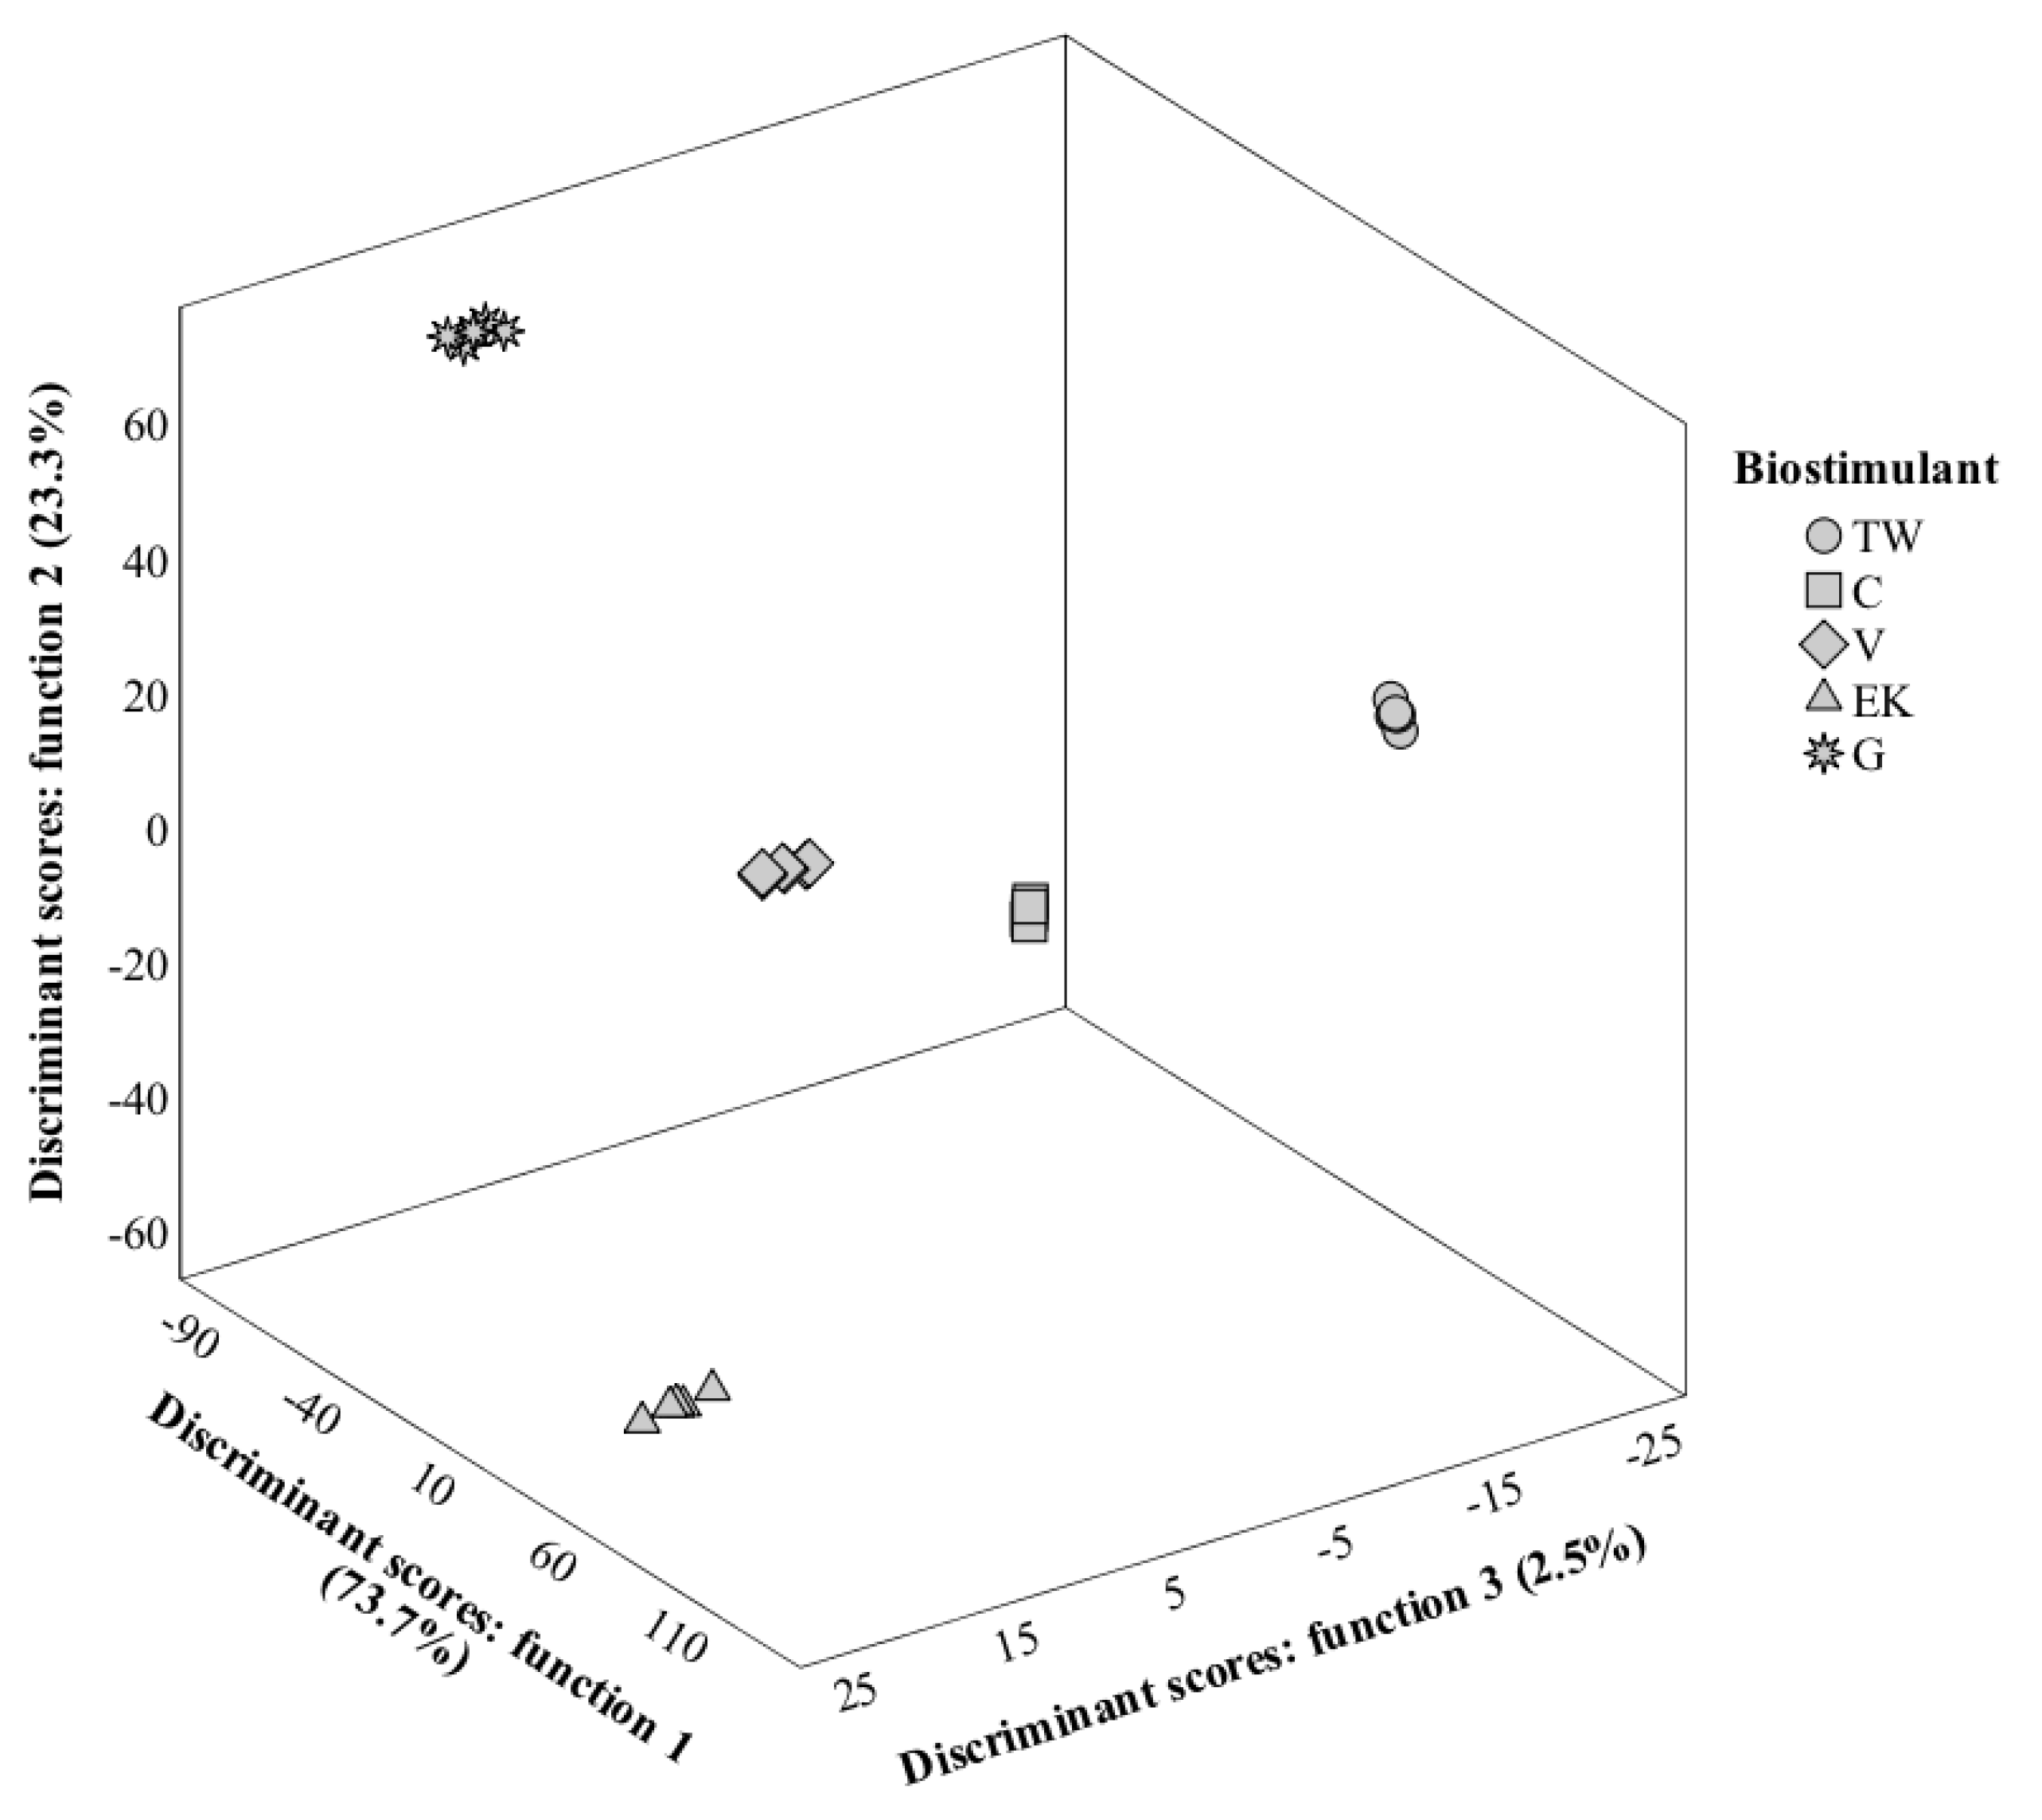
Concerning the second harvest, the LDA selected C22:0, fructose, organic acids, C21:0, proteins, C16:1, C24:0, C20:1, C18:0, C18:1n9c, MUFA, and sugars as the variables with the highest differences as a result of using different biostimulants (highest discriminant ability) (Figure 3). Function 1 was especially effective in separating samples treated with TW or EK, which was mostly due to their higher C18:1n9c contents (regardless of the irrigation treatment). On the other hand, Function 2 separated samples treated with G, which was placed in the farthest position in comparison to control samples. Considering all the functions together, it was possible to conclude that the biostimulant treatment V was the one that induced the least differences in comparison to the control.

3.8.3. Seeds

The effects of the tested biostimulants on seeds were also more pronounced for fatty acids, as indicated by the variables classified as being discriminant: C20:1, C20:0, sucrose, C22:1, lipids, C17:0, C15:0, organic acids, PUFA, C16:0, C18:2n6c, and C16:1 (Figure 4). According to Function 1, all biostimulants had similar effects (markers are almost vertically aligned), while untreated samples (C) were completely individualized (negative side of the axis); among the selected variables, the one showing the highest correlation with this function was C20:1, which showed higher percentages in C samples, independently of water level. Function 2, in turn, was mostly correlated to C16:1 and sucrose, contributing mainly to separate samples treated with EK, while Function 3 was more highly correlated with lipids content, contributing to separate samples treated with G.
In all the former LDAs, the classification performance was 100% accurate both for originally grouped cases as well as for cross-validated ones.

4. Conclusions

The results of the present study showed a varied effect of biostimulants and water treatments on pod yield and the quality of common bean green pods and seeds, while significant differences were also observed between normally irrigated and water-stressed plants in a biostimulants treatment-specific manner. Promising results were also recorded regarding the alleviation of negative effects of drought stress where the application of arbuscular mycorrhizal fungi (AMF; G treatment) increased the crop yield of green beans. Moreover, the nutritional value and chemical composition of pods and seeds was positively affected by biostimulants application, although a product specific effect was recorded depending on the irrigation regime and harvesting time (pods and/or seeds). In conclusion, the application of biostimulants could be considered as an eco-friendly and sustainable tool to increase the pod yield and quality of common bean green pods and seeds under normal irrigation and/or drought stress conditions. Considering that the tested biostimulants contain beneficial microorganisms such as AMF, symbiotic rizosphere bacteria, and saprophytic fungi, its application not only could benefit crops but it could also improve soil properties and preserve soil quality. However, future research is needed to investigate in depth the mechanisms of action of biostimulant product, the application dose efficiency, as well as the most effective application regime and the possible effect of genotype x biostimulants interactions.

Author Contributions

S.A.P. conceived and designed the research, administered and supervised the project, carried out the cultivation, wrote the original draft, and reviewed and edited the final manuscript; A.F. performed chemical analyses, data curation, and methodology; S.P. carried out the cultivation and prepared the original draft; A.C. performed chemical analyses, data curation, and methodology; N.T. performed chemical analyses, data curation, prepared the original draft, and edited the final manuscript; J.C.M.B. performed the LDA analysis of the data and the interpretation of the statistical analysis results; L.B. performed chemical analyses, data curation, and methodology, wrote the original draft, and reviewed and edited the final manuscript; I.C.F.R.F. obtained funding, administered and supervised the project, and reviewed and edited the final manuscript. All authors have read and agreed to the published version of the manuscript.

Funding

The authors are grateful to the Foundation for Science and Technology (FCT, Portugal) and FEDER under Programme PT2020 for financial support to CIMO (UID/AGR/00690/2013), A. Fernandes and L. Barros contract.

Conflicts of Interest

The authors declare no conflict of interest.

References

  1. Huang, Z.A.; Jiang, D.A.; Yang, Y.; Sun, J.W.; Jin, S.H. Effects of nitrogen deficiency on gas exchange, chlorophyll fluorescence, and antioxidant enzymes in leaves of rice plants. Photosynthetica 2004, 42, 357–364. [Google Scholar] [CrossRef]
  2. Zhao, D.; Reddy, K.R.; Kakani, V.G.; Reddy, V.R. Nitrogen deficiency effects on plant growth, leaf photosynthesis, and hyperspectral reflectance properties of sorghum. Eur. J. Agron. 2005, 22, 391–403. [Google Scholar] [CrossRef]
  3. Liebman, M.; Davis, A.S. Integration of soil, crop and weed management in low-external-input farming systems. Weed Res. 2000, 40, 27–47. [Google Scholar] [CrossRef] [Green Version]
  4. Postel, S.L. Entering an era of water scarcity: The challenges ahead. Ecol. Appl. 2000, 10, 941–948. [Google Scholar] [CrossRef]
  5. Bulgari, R.; Cocetta, G.; Trivellini, A.; Vernieri, P.; Ferrante, A. Biostimulants and crop responses: A review. Biol. Agric. Hortic. 2015, 31, 1–17. [Google Scholar] [CrossRef]
  6. Van Oosten, M.J.; Pepe, O.; De Pascale, S.; Silletti, S.; Maggio, A. The role of biostimulants and bioeffectors as alleviators of abiotic stress in crop plants. Chem. Biol. Technol. Agric. 2017, 4, 1–12. [Google Scholar] [CrossRef] [Green Version]
  7. Ziosi, V.; Zandoli, R.; Di Nardo, A.; Biondi, S.; Antognoni, F.; Calandriello, F. Biological activity of different botanical extracts as evaluated by means of an array of in vitro and in vivo bioassays. Acta Hortic. 2012, 1009, 61–66. [Google Scholar] [CrossRef]
  8. Abdel Latef, A.A.H.; Chaoxing, H. Does inoculation with Glomus mosseae improve salt tolerance in pepper plants? J. Plant Growth Regul. 2014, 33, 644–653. [Google Scholar] [CrossRef]
  9. Abu Seif, Y.I.; El-Miniawy, S.E.D.M.; Abu El-Azm, N.A.I.; Hegazi, A.Z. Response of snap bean growth and seed yield to seed size, plant density and foliar application with algae extract. Ann. Agric. Sci. 2016, 61, 187–199. [Google Scholar] [CrossRef]
  10. Ahmad, P.; Hashem, A.; Abd-Allah, E.F.; Alqarawi, A.A.; John, R.; Egamberdieva, D.; Gucel, S. Role of Trichoderma harzianum in mitigating NaCl stress in Indian mustard (Brassica juncea L) through antioxidative defense system. Front. Plant Sci. 2015, 6, 1–15. [Google Scholar] [CrossRef] [Green Version]
  11. Halpern, M.; Bar-Tal, A.; Ofek, M.; Minz, D.; Muller, T.; Yermiyahu, U. The use of biostimulants for enhancing nutrient uptake. Adv. Agron. 2015, 130, 141–174. [Google Scholar]
  12. Koleška, I.; Hasanagić, D.; Todorović, V.; Murtić, S.; Klokić, I.; Paradiković, N.; Kukavica, B. Biostimulant prevents yield loss and reduces oxidative damage in tomato plants grown on reduced NPK nutrition. J. Plant. Interact. 2017, 12, 209–218. [Google Scholar] [CrossRef] [Green Version]
  13. Rouphael, Y.; Franken, P.; Schneider, C.; Schwarz, D.; Giovannetti, M.; Agnolucci, M.; De Pascale, S.; Bonini, P.; Colla, G. Arbuscular mycorrhizal fungi act as biostimulants in horticultural crops. Sci. Hortic. (Amsterdam). 2015, 196, 91–108. [Google Scholar] [CrossRef]
  14. Kunicki, E.; Grabowska, A.; Sękara, A.; Wojciechowska, R. The effect of cultivar type, time of cultivation, and biostimulant treatment on the yield of spinach (Spinacia oleracea L.). Folia Hortic. 2010, 22, 9–13. [Google Scholar] [CrossRef] [Green Version]
  15. Pereira, J.L.; Queiroz, R.M.L.; Charneau, S.O.; Felix, C.R.; Ricart, C.A.O.; Lopes Da Silva, F.; Steindorff, A.S.; Ulhoa, C.J.; Noronha, E.F. Analysis of Phaseolus vulgaris response to its association with Trichoderma harzianum (ALL-42) in the presence or absence of the phytopathogenic fungi Rhizoctonia solani and Fusarium solani. PLoS ONE 2014, 9, 1–23. [Google Scholar] [CrossRef]
  16. Rouphael, Y.; Giordano, M.; Cardarelli, M.; Cozzolino, E.; Mori, M.; Kyriacou, M.C.; Bonini, P.; Colla, G. Plant-and seaweed-based extracts increase yield but differentially modulate nutritional quality of greenhouse spinach through biostimulant action. Agronomy 2018, 8, 126. [Google Scholar] [CrossRef] [Green Version]
  17. Xu, C.; Leskovar, D.I. Effects of A. nodosum seaweed extracts on spinach growth, physiology and nutrition value under drought stress. Sci. Hortic. (Amsterdam) 2015, 183, 39–47. [Google Scholar] [CrossRef]
  18. Chrysargyris, A.; Xylia, P.; Anastasiou, M.; Pantelides, I.; Tzortzakis, N. Effects of Ascophyllum nodosum seaweed extracts on lettuce growth, physiology and fresh-cut salad storage under potassium deficiency. J. Sci. Food Agric. 2018, 98, 5861–5872. [Google Scholar] [CrossRef]
  19. Galvão, Í.M.; dos Santos, O.F.; de Souza, M.L.C.; de Jesus Guimarães, J.; Kühn, I.E.; Broetto, F. Biostimulants action in common bean crop submitted to water deficit. Agric. Water Manag. 2019, 225, 105762. [Google Scholar] [CrossRef]
  20. De Pascale, S.; Rouphael, Y.; Colla, G. Plant biostimulants: Innovative tool for enhancing plant nutrition in organic farming. Eur. J. Hortic. Sci. 2018, 82, 277–285. [Google Scholar] [CrossRef]
  21. Karimzadeh Soureshjani, H.; Nezami, A.; Kafi, M.; Tadayon, M. Responses of two common bean (Phaseolus vulgaris L.) genotypes to deficit irrigation. Agric. Water Manag. 2019, 213, 270–279. [Google Scholar] [CrossRef]
  22. Hummel, M.; Hallahan, B.F.; Brychkova, G.; Ramirez-Villegas, J.; Guwela, V.; Chataika, B.; Curley, E.; McKeown, P.C.; Morrison, L.; Talsma, E.F.; et al. Reduction in nutritional quality and growing area suitability of common bean under climate change induced drought stress in Africa. Sci. Rep. 2018, 8, 1–11. [Google Scholar] [CrossRef] [PubMed]
  23. Arruda, I.M.; Moda-Cirino, V.; Koltun, A.; dos Santos, O.J.A.P.; Moreira, R.S.; Moreira, A.F.P.; Gonçalves, L.S.A. Physiological, biochemical and morphoagronomic characterization of drought-tolerant and drought-sensitive bean genotypes under water stress. Physiol. Mol. Biol. Plants 2018, 24, 1059–1067. [Google Scholar] [CrossRef] [PubMed]
  24. Sarma, R.K.; Saikia, R. Alleviation of drought stress in mung bean by strain Pseudomonas aeruginosa GGRJ21. Plant. Soil 2014, 377, 111–126. [Google Scholar] [CrossRef]
  25. Sadak, M.S.; Abdelhamid, M.T.; Schmidhalter, U. Effect of foliar application of aminoacids on plant yield and some physiological parameters in bean plants irrigated with seawater. Acta Biol. Colomb. 2015, 20, 141–152. [Google Scholar]
  26. Kumar, M.; Mishra, S.; Dixit, V.; Kumar, M.; Agarwal, L.; Chauhan, P.S.; Nautiyal, C.S. Synergistic effect of Pseudomonas putida and Bacillus amyloliquefaciens ameliorates drought stress in chickpea (Cicer arietinum L.). Plant. Signal. Behav. 2016, 11, 1–9. [Google Scholar] [CrossRef] [Green Version]
  27. German, M.A.; Burdman, S.; Okon, Y.; Kigel, J. Effects of Azospirillum brasilense on root morphology of common bean (Phaseolus vulgaris L.) under different water regimes. Biol. Fertil. Soils 2000, 32, 259–264. [Google Scholar] [CrossRef]
  28. Klimek-Kopyra, A.; Kliszcz, A.; Ślizowska, A.; Kot, D. Application of biostimulants influences shoot and root characteristics of seedlings of winter pea (Pisum sativum L.). Acta Agrobot. 2019, 72, 1–8. [Google Scholar] [CrossRef]
  29. Dourado-Neto, D.; Dario, G.J.A.; Barbieri, A.P.P.; Martin, T.N. Biostimulant action on agronomic efficiency of corn and common beans. Biosci. J. 2014, 30, 371–379. [Google Scholar]
  30. Rady, M.M.; Desoky, E.S.M.; Elrys, A.S.; Boghdady, M.S. Can licorice root extract be used as an effective natural biostimulant for salt-stressed common bean plants? S. Afr. J. Bot. 2019, 121, 294–305. [Google Scholar] [CrossRef]
  31. Rady, M.M.; Mohamed, G.F. Modulation of salt stress effects on the growth, physio-chemical attributes and yields of Phaseolus vulgaris L. plants by the combined application of salicylic acid and Moringa oleifera leaf extract. Sci. Hortic. (Amsterdam) 2015, 193, 105–113. [Google Scholar] [CrossRef]
  32. Selby, C.; Carmichael, E.; Sharma, H.S.S. Bio-refining of perennial ryegrass (Lolium perenne): Evaluation of aqueous extracts for plant defence elicitor activity using French bean cell suspension cultures. Chem. Biol. Technol. Agric. 2016, 3, 1–7. [Google Scholar] [CrossRef] [Green Version]
  33. Elzaawely, A.A.; Ahmed, M.E.; Maswada, H.F.; Xuan, T.D. Enhancing growth, yield, biochemical, and hormonal contents of snap bean (Phaseolus vulgaris L.) sprayed with moringa leaf extract. Arch. Agron. Soil Sci. 2017, 63, 687–699. [Google Scholar] [CrossRef]
  34. Elzaawely, A.A.; Ahmed, M.E.; Maswada, H.F.; Al-Araby, A.A.; Xuan, T.D. Growth traits, physiological parameters and hormonal status of snap bean (Phaseolus vulgaris L.) sprayed with garlic cloves extract. Arch. Agron. Soil Sci. 2018, 64, 1068–1082. [Google Scholar] [CrossRef]
  35. Petropoulos, S.A.; Taofiq, O.; Fernandes, Â.; Tzortzakis, N.; Ciric, A.; Sokovic, M.; Barros, L.; Ferreira, I.C. Bioactive properties of greenhouse-cultivated green beans (Phaseolus vulgaris L.) under biostimulants and water-stress effect. J. Sci. Food Agric. 2019, 99, 6049–6059. [Google Scholar] [CrossRef] [PubMed]
  36. Pereira, C.; Dias, M.I.; Petropoulos, S.A.; Plexida, S.; Chrysargyris, A.; Tzortzakis, N.; Calhelha, R.C.; Ivanov, M.; Stojković, D.; Soković, M.; et al. The Effects of Biostimulants, Biofertilizers and Water-Stress on Nutritional Value and Chemical Composition of Two Spinach Genotypes (Spinacia oleracea L.). Molecules 2019, 24, 4494. [Google Scholar] [CrossRef] [Green Version]
  37. AOAC International. Official Methods of Analysis of AOAC International; Horwitz, W., Latimer, G., Eds.; AOAC International: Gaithersburg, MD, USA, 2016. [Google Scholar]
  38. Chrysargyris, A.; Nikolaidou, E.; Stamatakis, A.; Tzortzakis, N. Vegetative, physiological, nutritional and antioxidant behavior of spearmint (Mentha spicata L.) in response to different nitrogen supply in hydroponics. J. Appl. Res. Med. Aromat. Plants 2017, 6, 52–61. [Google Scholar] [CrossRef]
  39. Pereira, C.; Barros, L.; Carvalho, A.M.; Ferreira, I.C.F.R. Use of UFLC-PDA for the analysis of organic acids in thirty-five species of food and medicinal plants. Food Anal. Methods 2013, 6, 1337–1344. [Google Scholar] [CrossRef]
  40. Barros, L.; Pereira, E.; Calhelha, R.C.; Dueñas, M.; Carvalho, A.M.; Santos-Buelga, C.; Ferreira, I.C.F.R. Bioactivity and chemical characterization in hydrophilic and lipophilic compounds of Chenopodium ambrosioides L. J. Funct. Foods 2013, 5, 1732–1740. [Google Scholar] [CrossRef]
  41. Barros, L.; Pereira, C.; Ferreira, I.C.F.R. Optimized analysis of organic acids in edible mushrooms from Portugal by Ultra-Fast Liquid Chromatography and Photodiode Array Detection. Food Anal. Methods 2013, 6, 309–316. [Google Scholar] [CrossRef]
  42. Aimo, S.; Gosetti, F.; D’Agostino, G.; Gamalero, E.; Gianotti, V.; Bottaro, M.; Gennaro, M.C.; Berta, G. Use of arbuscular mycorrhizal fungi and beneficial soil bacteria to improve yield and quality of saffron (Crocus sativus L.). Acta Hortic. 2010, 159–164. [Google Scholar] [CrossRef]
  43. Weber, N.; Schmitzer, V.; Jakopic, J.; Stampar, F. First fruit in season: Seaweed extract and silicon advance organic strawberry (Fragaria×ananassa Duch.) fruit formation and yield. Sci. Hortic. (Amsterdam) 2018, 242, 103–109. [Google Scholar] [CrossRef]
  44. Arthur, G.D.; Stirk, W.A.; Van Staden, J. Effect of a seaweed concentrate on the growth and yield of three varieties of Capsicum annuum. S. Afr. J. Bot. 2003, 69, 207–211. [Google Scholar] [CrossRef]
  45. Alam, M.Z.; Braun, G.; Norrie, J.; Hodges, D.M. Effect of Ascophyllum extract application on plant growth, fruit yield and soil microbial communities of strawberry. Can. J. Plant. Sci. 2013, 93, 23–36. [Google Scholar] [CrossRef]
  46. Alam, M.Z.; Braun, G.; Norrie, J.; Mark Hodges, D. Ascophyllum extract application can promote plant growth and root yield in carrot associated with increased root-zone soil microbial activity. Can. J. Plant. Sci. 2014, 94, 337–348. [Google Scholar] [CrossRef] [Green Version]
  47. Battacharyya, D.; Babgohari, M.Z.; Rathor, P.; Prithiviraj, B. Seaweed extracts as biostimulants in horticulture. Sci. Hortic. (Amsterdam) 2015, 196, 39–48. [Google Scholar] [CrossRef]
  48. Korir, H.; Mungai, N.W.; Thuita, M.; Hamba, Y.; Masso, C. Co-inoculation effect of rhizobia and plant growth promoting rhizobacteria on common bean growth in a low phosphorus soil. Front. Plant. Sci. 2017, 08, 1–10. [Google Scholar] [CrossRef] [Green Version]
  49. Farouk, S.; Abdul Qados, A.M.S. Enhancing seed quality and productivity as well as physio-anatomical responses of pea plants by folic acid and/or hydrogen peroxide application. Sci. Hortic. (Amsterdam) 2018, 240, 29–37. [Google Scholar] [CrossRef]
  50. Poorter, H.; Nagel, O. The role of biomass allocation in the growth response of plants to different levels of light, CO2, nutrients and water: A quantitative review. Aust. J. Plant. Physiol. 2000, 27, 595–607. [Google Scholar]
  51. Colla, G.; Nardi, S.; Cardarelli, M.; Ertani, A.; Lucini, L.; Canaguier, R.; Rouphael, Y. Protein hydrolysates as biostimulants in horticulture. Sci. Hortic. (Amsterdam) 2015, 196, 28–38. [Google Scholar] [CrossRef]
  52. Przygocka-Cyna, K.; Grzebisz, W. Effect of biofertilizers on nutrient uptake by vegetables grown in a short cropping sequence. J. Elem. 2018, 23, 807–823. [Google Scholar] [CrossRef]
  53. Elsheikh, E.A.E.; El Tinay, A.H.; Fadul, I.A. Effect of nutritional status of faba bean on proximate composition, anti-nutritional factors and in vitro protein digestibility (IVPD). Food Chem. 1999, 67, 379–383. [Google Scholar] [CrossRef]
  54. Kocira, A.; Świeca, M.; Kocira, S.; Złotek, U.; Jakubczyk, A. Enhancement of yield, nutritional and nutraceutical properties of two common bean cultivars following the application of seaweed extract (Ecklonia maxima). Saudi, J. Biol. Sci. 2018, 25, 563–571. [Google Scholar] [CrossRef] [PubMed] [Green Version]
  55. Castellanos-Barriga, L.G.; Santacruz-Ruvalcaba, F.; Hernández-Carmona, G.; Ramírez-Briones, E.; Hernández-Herrera, R.M. Effect of seaweed liquid extracts from Ulva lactuca on seedling growth of mung bean (Vigna radiata). J. Appl. Phycol. 2017, 29, 2479–2488. [Google Scholar] [CrossRef]
  56. Mancuso, S.; Azzarello, E.; Mugnai, S.; Briand, X. Marine bioactive substances (IPA extract) improve foliar ion uptake and water stress tolerance in potted Vitis vinifera plants. Adv. Hortic. Sci. 2006, 20, 156–161. [Google Scholar]
  57. Gosling, P.; Mead, A.; Proctor, M.; Hammond, J.P.; Bending, G.D. Contrasting arbuscular mycorrhizal communities colonizing different host plants show a similar response to a soil phosphorus concentration gradient. New Phytol. 2013, 198, 546–556. [Google Scholar] [CrossRef]
  58. Colla, G.; Cardarelli, M.; Bonini, P.; Rouphael, Y. Foliar applications of protein hydrolysate, plant and seaweed extracts increase yield but differentially modulate fruit quality of greenhouse tomato. HortScience 2017, 52, 1214–1220. [Google Scholar] [CrossRef]
  59. Huang, D.; Ou, B.; Rior, R.L. The chemistry behind antioxidant capacity assays. J. Agric. Food Chem. 2005, 53, 1841–1856. [Google Scholar] [CrossRef]
  60. Kellős, T.; Tímár, I.; Szilágyi, V.; Szalai, G.; Galiba, G.; Kocsy, G. Stress hormones and abiotic stresses have different effects on antioxidants in maize lines with different sensitivity. Plant. Biol. 2008, 10, 563–572. [Google Scholar] [CrossRef]
  61. Kan, L.; Nie, S.; Hu, J.; Wang, S.; Bai, Z.; Wang, J.; Zhou, Y.; Jiang, J.; Zeng, Q.; Song, K. Comparative study on the chemical composition, anthocyanins, tocopherols and carotenoids of selected legumes. Food Chem. 2018, 260, 317–326. [Google Scholar] [CrossRef]
  62. Elkelish, A.A.; Alnusaire, T.S.; Soliman, M.H.; Gowayed, S.; Senousy, H.H.; Fahad, S. Calcium availability regulates antioxidant system, physio-biochemical activities and alleviates salinity stress mediated oxidative damage in soybean seedlings. J. Appl. Bot. Food Qual. 2019, 92, 258–266. [Google Scholar]
  63. El-Bassiouny, H.M.S.; El-Monem, A.A.A.; Abdallah, M.M.-S.; Soliman, K.M. Role of arbuscular mycorrhiza, α-tocopherol and nicotinamide on the nitrogen containing compounds and adaptation of sunflower plant to Water stress. Biosci. Res. 2018, 15, 2068–2088. [Google Scholar]
  64. Laxa, M.; Liebthal, M.; Telman, W.; Chibani, K.; Dietz, K.J. The role of the plant antioxidant system in drought tolerance. Antioxidants 2019, 8. [Google Scholar] [CrossRef] [PubMed] [Green Version]
  65. Casadesús, A.; Polo, J.; Munné-Bosch, S. Hormonal effects of an enzymatically hydrolyzed animal protein-based biostimulant (pepton) in water-stressed tomato plants. Front. Plant. Sci. 2019, 10, 1–11. [Google Scholar] [CrossRef] [PubMed] [Green Version]
  66. Zushi, K.; Matsuzoe, N.; Kitano, M. Developmental and tissue-specific changes in oxidative parameters and antioxidant systems in tomato fruits grown under salt stress. Sci. Hortic. (Amsterdam) 2009, 122, 362–368. [Google Scholar] [CrossRef]
  67. Palmieri, F.; Estoppey, A.; House, G.L.; Lohberger, A.; Bindschedler, S.; Chain, P.S.G.; Junier, P. Chapter Two - Oxalic acid, a molecule at the crossroads of bacterial-fungal interactions. Adv. Appl. Microbiol. 2019, 106, 49–77. [Google Scholar]
  68. Weber, H.; Borisjuk, L.; Wobus, U. Sugar import and metabolism during seed development. Trends Plant. Sci. 1997, 2, 169–174. [Google Scholar] [CrossRef]
  69. Rathinasabapathi, B. Metabolic engineering for stress tolerance: Installing osmoprotectant synthesis pathways. Ann. Bot. 2000, 86, 709–716. [Google Scholar] [CrossRef]
  70. Begum, N.; Qin, C.; Ahanger, M.A.; Raza, S.; Khan, M.I.; Ashraf, M.; Ahmed, N.; Zhang, L. Role of Arbuscular Mycorrhizal Fungi in Plant Growth Regulation: Implications in Abiotic Stress Tolerance. Front. Plant. Sci. 2019, 10, 1–15. [Google Scholar] [CrossRef] [Green Version]
  71. Rosa, M.; Prado, C.; Podazza, G.; Interdonato, R.; González, J.A.; Hilal, M.; Prado, F.E. Soluble sugars-metabolism, sensing and abiotic stress. A complex network in the life of plants. Plant. Signal. Behav. 2009, 4, 388–393. [Google Scholar] [CrossRef] [Green Version]
  72. Petropoulos, S.; Ntatsi, G.; Levizou, E.; Barros, L.; Ferreira, I. Nutritional profile and chemical composition of Cichorium spinosum ecotypes. LWT - Food Sci. Technol. 2016, 73, 95–101. [Google Scholar] [CrossRef]
  73. López-Bucio, J.; Pelagio-Flores, R.; Herrera-Estrella, A. Trichoderma as biostimulant: Exploiting the multilevel properties of a plant beneficial fungus. Sci. Hortic. (Amsterdam) 2015, 196, 109–123. [Google Scholar] [CrossRef]
Figure 1. Environmental conditions (mean, max, and min temperature and mean relative humidity (RH)) throughout the experimental period.
Agronomy 10 00181 g001
Figure 2. Canonical discriminant functions coefficients defined from the evaluated parameters plotted to show the effect of biostimulants treatments on Phaseolus vulgaris green pods of the first harvest under different irrigation regimes (normal irrigation and water stress).
Agronomy 10 00181 g002
Figure 3. Canonical discriminant functions coefficients defined from the evaluated parameters plotted to show the effect of biostimulants treatments on Phaseolus vulgaris green pods of the second harvest under different irrigation regimes (normal irrigation and water stress).
Agronomy 10 00181 g003
Figure 4. Canonical discriminant functions coefficients defined from the evaluated parameters plotted to show the effect of biostimulants treatments on Phaseolus vulgaris seeds under different irrigation regimes (normal irrigation and water stress).
Agronomy 10 00181 g004
Table 1. Detailed composition and application guides for the tested biostimulants.
ProductCompositionApplication MethodDose
Nomoren (G)20% of arbuscular mycorrhizal fungi (AMF) (Glomus spp.)Irrigation water5 L/ha
Twin-Antistress (TW)Natural microorganisms based on Bacillus subtilis, and yeast and Ascophyllum nodosum extracts, as well as N (organic): 1%, organic carbon: 10%, and organic matter (<50 kDa): 30%Irrigation water5 L/ha
Veramin Ca (V)Amino acid complex of vegetable origin with Aloe vera extract, and CaO: 15.6%Foliar spraying500 g/100 L H2O
EKOprop (EK)Mixture of arbuscular mycorrhizal fungi (Glomus spp: 1%), rhizospere symbiotic bacteria (Bacillus spp., Streptomyces spp., Pseudomonas spp.; 1.6 × 10⁹ CFU/g in total), and saprophytic fungi (Trichoderma spp.: 5 × 10⁵ CFU/g)Irrigation water1 kg/ha
Table 2. Yield and growth characteristics of bean plants in relation to water stress and biostimulants application (mean ± SD).
1st Harvest2nd HarvestTotal
TreatmentNumber of Pods/PlantMean Pod Weight (g)Yield (kg/ha)Number of Pods/PlantMean Pod Weight (g)Yield (kg/ha)Number of Pods/PlantMean Pod Weight (g)Yield (kg/ha)100 Seeds Weight (g)Seeds per Pot
CW+ ¥24 ± 1c9 ± 1b4296 ± 105d17 ± 4c9 ± 1b3138 ± 43c41 ± 4d9 ± 1c7434 ± 120d101 ± 2f5.4 ± 0.5a
VW+26 ± 2b9.7 ± 0.6a4933 ± 154b18 ± 1b9 ± 1b3318 ± 89b44 ± 4b10 ± 1b8311 ± 233b112 ± 3d4.8 ± 0.9b
EKW+27 ± 1a9.7 ± 0.8a5284 ± 120a18.6 ± 0.8a10 ± 1a3701 ± 88a46 ± 3a10 ± 2a8985 ± 196a108 ± 2e5.0 ± 0.8b
GW+26 ± 2b9 ± 1b4621 ± 85.0c16.4 ± 0.8c10 ± 2a3318 ± 81b42 ± 2c9 ± 1c7939 ± 160c116 ± 2b5.5 ± 0.9a
TWW+24 ± 2c8 ± 1d3799 ± 109e17.5 ± 0.9c10 ± 2a3357 ± 96b42 ± 3c9 ± 1c7156 ± 187e116 ± 2b5.5 ± 0.9a
CW-14 ± 3f8.8 ± 0.9c2456 ± 75h13 ± 3f9 ± 2b2435 ± 77e27 ± 2h9 ± 1c4891 ± 137h114 ± 3bc5.0 ± 0.9b
VW-14 ± 2f8 ± 1d2213 ± 90i12.0 ± 0.6g7.3 ± 0.8d1749 ± 59f26 ± 2i7.8 ± 0.8f3962 ± 147j115 ± 3b4.4 ± 0.5c
EKW-16.7 ± 0.8e8 ± 1d2515 ± 50h14.1 ± 0.9e8 ± 2c2147 ± 62c31 ± 2g7.6 ± 0.7g4662 ± 80i122 ± 2a5.0 ± 0.6b
GW-20.2 ± 0.9d8 ± 1d3172 ± 79f15 ± 1d8 ± 2c2519 ± 81de36 ± 2e8 ± 1e5691 ± 139f113 ± 3cd5.1 ± 0.5b
TWW-16.7 ± 0.8e8.2 ± 0.8d2748 ± 64g15.4 ± 0.8d8 ± 2c2603 ± 71d32 ± 2f8.3 ± 0.9d5351 ± 127g114 ± 2bc5.0 ± 0.7b
¥ W+: indicates normal irrigation regime; W-: indicates water-holding irrigation regime; C: Control; V: Veramin Ca; EK: EKOprop; G: Nomoren; TW: Twin-Antistress. Means in the same column followed by different Latin letters are significantly different according to Tukey’s honestly significant difference (HSD) test (p = 0.05).
Table 3. Nutritional (g/kg dw) and energetic value (kcal/kg dw) of the studied pods and seeds of beans in relation to irrigation regime (mean ± SD).
1st Harvest of Pods
TreatmentMoisture (%)FatProteinsAshCarbohydratesEnergy
CW+ ¥96.4 ± 0.7a48.2 ± 0.8e165 ± 6h59.6 ± 0.4h728 ± 3b4630 ± 20f
VW+94.2 ± 0.4c45.6 ± 0.6g201 ± 1a79 ± 1a674 ± 2i4821 ± 3a
EKW+95.0 ± 0.6b48 ± 2e197 ± 4b73.7 ± 0.2b681 ± 1h4790 ± 20b
GW+92.5 ± 0.7de53.7 ± 0.2b174.5 ± 0.1e71.6 ± 0.5c700 ± 1f4658 ± 1e
TWW+93 ± 1d50.1 ± 0.5c193 ± 3c70 ± 3d688 ± 1g4760 ± 10c
CW-93 ± 2d49.4 ± 0.8cd150 ± 02i66 ± 2f735 ± 2a4553 ± 8h
VW-88 ± 1g48.7 ± 0.8de181.5 ± 0.5d67 ± 1e703 ± 2e4713 ± 1d
EKW-93 ± 1d45.5 ± 0.3g169.5 ± 0.4g61 ± 1g724 ± 1c4665 ± 1e
GW-89.4 ± 0.8f47 ± 3f171.6 ± 0.3f66 ± 2f715 ± 1d4671 ± 9e
TWW-92 ± 1e67 ± 1a173.2 ± 0.1e69.5 ± 0.1d690 ± 1g4599 ± 3g
2nd Harvest of pods
CW+91 ± 1b27.1 ± 0.2e204.6 ± 0.3b49.6 ± 0.7cd719 ± 1f4915 ± 2a
VW+92 ± 2a32 ± 2d174 ± 1e56.9 ± 0.8b737 ± 1e4739 ± 2f
EKW+91.1 ± 0.5b37.1 ± 0.2b195.9 ± 0.3c51 ± 1c716 ± 1f4831 ± 2d
GW+90.7 ± 0.4c34 ± 2c207.1 ± 0.1a68.4 ± 0.5a690 ± 1g4898 ± 5b
TWW+90 ± 2d27.3 ± 0.2e175 ± 1e49 ± 2d748 ± 1d4768 ± 2e
CW-91.1 ± 0.5b43 ± 2a150.2 ± 0.1h49 ± 1d758 ± 1c4580 ± 6g
VW-87.6 ± 0.8f32 ± 2d174.3 ± 0.2e52 ± 2c741 ± 3e4742 ± 4f
EKW-89 ± 1e21.4 ± 0.7f189.2 ± 0.4d45 ± 1e745 ± 1d4861 ± 1c
GW-90 ± 2d18 ± 1h164.0 ± 0.4g49 ± 2d769 ± 1a4747 ± 5f
TWW-90 ± 1d19.8 ± 0.8g171 ± 1f45 ± 2e764 ± 1b4776 ± 2e
Seeds
CW+69.8 ± 0.3a40.0 ± 0.1c305 ± 6e51.4 ± 0.5cd604 ± 4a5360 ± 20g
VW+66.7 ± 0.7d37 ± 1d310.2 ± 0.2d53 ± 2b600 ± 2a5403 ± 5f
EKW+67.7 ± 0.9b33.2 ± 0.1g320 ± 2b53 ± 2b593 ± 3c5468 ± 6ab
GW+67 ± 2c52.7 ± 0.1a337 ± 1a56 ± 1a554 ± 1e5474 ± 3a
TWW+66.3 ± 0.7e45 ± 3b317.6 ± 0.1c49.7 ± 0.1f588 ± 2d5410 ± 7e
CW-62 ± 1g40.2 ± 0.1c322.7 ± 0.1b51 ± 1de587 ± 1d5453 ± 1c
VW-65.8 ± 0.9f35 ± 2e320.2 ± 0.1b51.7 ± 0.3c593 ± 2c5461 ± 6b
EKW-67.3 ± 0.6c34 ± 1f317 ± 1c48.1 ± 0.8g601 ± 1a5448 ± 6c
GW-69.8 ± 0.5a34 ± 1f317.1 ± 0.4c50.9 ± 0.4e598 ± 1b5450 ± 2c
TWW-66.2 ± 0.4e35.1 ± 0.6e316.5 ± 0.4c50 ± 1f598 ± 1b5442 ± 3d
¥ W+: indicates normal irrigation regime; W-: indicates water-holding irrigation regime; C: Control; V: Veramin Ca; EK: EKOprop; G: Nomoren; TW: Twin-Antistress. Means in the same column and the same harvest (first and second harvest of pods and seeds) followed by different Latin letters are significantly different according to Tukey’s honestly significant difference (HSD) test (p = 0.05).
Table 4. Mineral composition of the studied pods (second harvest) and seeds of beans in relation to the irrigation regime, expressed on a dry weight basis (mean ± SD).
Pods
TreatmentN (g/kg)K (g/kg)P (g/kg)Na (g/kg)Ca (g/kg)Mg (mg/kg)Cu (mg/kg)Zn (mg/kg)Mn (mg/kg)
CW+ ¥26.9 ± 0.3a17.7 ± 0.3c6.3 ± 0.4b0.05 ± 0.03c6.6 ± 1.6e104 ± 5h138 ± 17c24 ± 1d4.1 ± 0.4b
VW+24.6 ± 0.2b18.7 ± 0.4b4.2 ± 0.4e0.07 ± 0.06c4.3 ± 0.9h235 ± 17c78 ± 18e29 ± 2c4.5 ± 0.7a
EKW+24.6 ± 0.3b19.1 ± 0.3b7.3 ± 0.2a0.16 ± 0.02a5.4 ± 0.7g131 ± 21g205 ± 18a38 ± 4a3.8 ± 0.4c
GW+23.0 ± 0.5cd20.0 ± 0.4a6.2 ± 0.4b0.07 ± 0.03c6.1 ± 1f219 ± 46d170 ± 15b21 ± 1e4.5 ± 0.1a
TWW+23.2 ± 0.8c19.0 ± 0.5b4.2 ± 0.4e0.17 ± 0.03a10.7 ± 3.2c314 ± 6b162 ± 19b33 ± 3b4.0 ± 0.5bc
CW-22.4 ± 0.3e16.7 ± 0.3d5.2 ± 0.7d0.03 ± 0.01d4 ± 1.3h341 ± 16a98 ± 18d29 ± 2c3.8 ± 0.2c
VW-26.5 ± 0.5a15.1 ± 0.2f6.0 ± 0.2c0.14 ± 0.02b11.5 ± 3.5b171 ± 12e46 ± 16f28 ± 2c4.2 ± 0.8ab
EKW-23.2 ± 0.2c17.9 ± 0.6c5.5 ± 0.1d0.16 ± 0.08a8.5 ± 2.6d147 ± 8f200 ± 27a28 ± 3c3.8 ± 0.5c
GW-21.5 ± 0.1f17.1 ± 0.8d5.3 ± 0.7d0.07 ± 0.01c10.2 ± 2.3c311 ± 14b169 ± 21b21.8 ± 0.3e4.4 ± 0.3a
TWW-22.8 ± 0.5d16.1 ± 0.3e5.9 ± 0.2c0.06 ± 0.01c13.2 ± 4.7a311 ± 35b145 ± 12c20 ± 3e4.1 ± 0.2b
Seeds
CW+42.9 ± 0.3b1.6 ± 0.2a13.3 ± 1.4b0.18 ± 0.08a11.1 ± 2.3e7 ± 1f158 ± 45c13 ± 2g5 ± 1a
VW+41.3 ± 0.4d1.6 ± 0.3a9.4 ± 1.8g0.16 ± 0.05a6.8 ± 1.7f11 ± 3cd99 ± 38e21 ± 1b0.5 ± 0.2g
EKW+41.9 ± 0.8c1.6 ± 0.2a12.7 ± 2.3c0.05 ± 0.01b10.9 ± 1.4e6 ± 3fg193 ± 11b13 ± 2g4.4 ± 0.9cd
GW+41.9 ± 0.1c1.7 ± 0.3a14.0 ± 6.6a0.05 ± 0.01b12.6 ± 2.5c5 ± 4g165 ± 15c18 ± 3cd3.5 ± 0.4e
TWW+41.9 ± 0.1c1.6 ± 0.3a8.0 ± 0.9h0.03 ± 0.01b15.2 ± 1.5a13 ± 1b199 ± 39a17 ± 3de4.6 ± 0.4bc
CW-39.5 ± 0.3e1.6 ± 0.4a10.0 ± 2.5f0.15 ± 0.04a10.9 ± 2.4e10.0 ± 0.6de120 ± 50d13 ± 1g5.1 ± 0.3a
VW-42.8 ± 0.5b1.6 ± 0.1a7.2 ± 0.5i0.15 ± 0.06a3.7 ± 1.3g15 ± 3a90 ± 8f22.6 ± 0.3a2 ± 1f
EKW-42.2 ± 0.8c1.6 ± 0.9a11.9 ± 2.6d0.03 ± 0.01b11.7 ± 1.7d2.9 ± 0.3h190 ± 49b16 ± 2ef4.2 ± 0.3d
GW-44.7 ± 0.2a1.6 ± 0.6a11.0 ± 1.2e0.04 ± 0.01b14.1 ± 1.3b9.2 ± 0.6e168 ± 30c19.2 ± 0.9c4.2 ± 0.4d
TWW-44.7 ± 0.2a1.6 ± 0.1a7.5 ± 1.2hi0.04 ± 0.01b12.3 ± 3.7c12 ± 2bc160 ± 43c15.1 ± 0.2f4.8 ± 0.5b
¥ W+: indicates normal irrigation regime; W-: indicates water-holding irrigation regime; C: Control; V: Veramin Ca; EK: EKOprop; G: Nomoren; TW: Twin-Antistress. Means in the same column and the same plant part (pods and seeds) followed by different Latin letters are significantly different according to Tukey’s honestly significant difference (HSD) test (p = 0.05).
Table 5. Composition in tocopherols of the studied pods (µg/kg dw) and seeds (mg/kg dw) of beans in relation to the irrigation regime (mean ± SD).
Treatmentα-Tocopherolγ-TocopherolTotal Tocopherols
1st Harvest of Pods
CW+ ¥770 ± 20f2970 ± 20i3740 ± 10i
VW+880 ± 40c4880 ± 30f5760 ± 10f
EKW+930 ± 30b5230 ± 50d6160 ± 20d
GW+306 ± 3g4020 ± 60g4330 ± 50g
TWW+760 ± 20f6060 ± 90b6820 ± 70b
CW-798 ± 3e5416 ± 1c6214 ± 3c
VW-810 ± 30d4990 ± 50e5800 ± 90e
EKW-278 ± 3i3910 ± 30h4190 ± 20h
GW-290 ± 20h2940 ± 60j3240 ± 80j
TWW-1010 ± 10a6410 ± 40a7420 ± 30a
2nd Harvest of pods
CW+288 ± 6g1560 ± 60i1840 ± 60i
VW+236 ± 6h1670 ± 10h1900 ± 10h
EKW+266 ± 3g1530 ± 30j1800 ± 40j
GW+508 ± 6e3280 ± 20b3790 ± 30d
TWW+160 ± 10i1940 ± 40g2100 ± 30g
CW-1810 ± 20a2820 ± 30d4630 ± 50b
VW-1750 ± 20b3500 ± 20a5250 ± 10a
EKW-720 ± 20d2440 ± 20e3160 ± 10e
GW-326 ± 8f2000 ± 40f2320 ± 50f
TWW-1210 ± 10c3090 ± 20c4300 ± 40c
Seeds
α-Tocopherolγ-Tocopherolδ-TocopherolTotal Tocopherols
CW+0.96 ± 0.01a39.1 ± 0.1b2.48 ± 0.03a42.5 ± 0.1a
VW+0.52 ± 0.01c39.8 ± 0.1a2.28 ± 0.01b42.7 ± 0.1a
EKW+0.50 ± 0.01c38.5 ± 0.1c1.95 ± 0.02f40.9 ± 0.1c
GW+0.52 ± 0.01c36.7 ± 0.1d2.21 ± 0.03c39.5 ± 0.1d
TWW+0.53 ± 0.02c38.4 ± 0.1c2.01 ± 0.03e41.0 ± 0.1c
CW-0.46 ± 0.01d36.1 ± 0.1e2.16 ± 0.05d38.7 ± 0.1e
VW-0.57 ± 0.01b35.4 ± 0.1f1.91 ± 0.02f38.0 ± 0.1f
EKW-0.96 ± 0.05a32.0 ± 0.1h1.48 ± 0.02g34.5 ± 0.1h
GW-0.59 ± 0.02b39.0 ± 0.1b1.91 ± 0.02f41.5 ± 0.1b
TWW-0.45 ± 0.02d34.7 ± 0.1g2.14 ± 0.08d37.3 ± 0.1g
¥ W+: indicates normal irrigation regime; W-: indicates water-holding irrigation regime; C: Control; V: Veramin Ca; EK: EKOprop; G: Nomoren; TW: Twin-Antistress. Means in the same column and the same harvest (1st and 2nd pod harvests and seeds) followed by different Latin letters are significantly different according to Tukey’s honestly significant difference (HSD) test (p = 0.05).
Table 6. Composition in organic acids and sugars of the studied pods and seeds of beans in relation to the irrigation regime (mean ± SD).
Oxalic Acid (g/kg dw)Malic Acid (g/kg dw)Ascorbic Acid (g/kg dw)Total Organic Acids (g/kg dw)Fructose (g/kg dw)Glucose (g/kg dw)Sucrose (g/kg dw)Total Sugars (g/kg dw)
Treatment1st Harvest of pods
CW+ ¥14.0 ± 0.1h18.4 ± 0.2dtr32.5 ± 0.1h151 ± 4f84.5 ± 0.1g5.8 ± 0.4b241 ± 4h
VW+26.3 ± 0.1a23.1 ± 0.1atr49.4 ± 0.1a168 ± 5e90 ± 2fnd257 ± 7f
EKW+21.8 ± 0.2c20.4 ± 0.5c0.10 ± 0.01b42.4 ± 0.4b194 ± 3b107 ± 3cnd301 ± 6c
GW+19.3 ± 0.1e21.7 ± 0.4btr41.0 ± 0.3d173 ± 0d85 ± 3g4.7 ± 0.3d263 ± 4e
TWW+23.2 ± 0.1b18.1 ± 0.2de0.5 ± 0.1a41.8 ± 0.3c173 ± 1d101 ± 2d3.5 ± 0.1f277 ± 2d
CW-18.5 ± 0.1f16.5 ± 0.2f0.50 ± 0.03a35.5 ± 0.1f194 ± 2b135 ± 5a4.3 ± 0.1e333 ± 7a
VW-17.0 ± 0.1g20.6 ± 0.4c0.10 ± 0.01b37.7 ± 0.4e153 ± 8f84 ± 6g7.6 ± 0.1a250 ± 10g
EKW-16.4 ± 0.1g17.9 ± 0.3etr34.3 ± 0.3g171 ± 4d106 ± 3c3.1 ± 0.3g280 ± 8d
GW-20.9 ± 0.1d16.7 ± 0.1ftr37.7 ± 0.2e184 ± 2c94 ± 6e3.1 ± 0.3g281 ± 8d
TWW-21.2 ± 0.1cd20.4 ± 0.3c0.50 ± 0.01a42.1 ± 0.4bc198 ± 1a110 ± 3b5.2 ± 0.4c314 ± 3b
2nd Harvest of pods
CW+¥10.9 ± 0.1d15.0 ± 0.4htr25.9 ± 0.4h170 ± 2e82 ± 4g3.5 ± 0.4e256 ± 6h
VW+10.7 ± 0.1e17.8 ± 0.1dtr28.5 ± 0.1f180 ± 2d91 ± 2f2.4 ± 0.2f273 ± 4f
EKW+10.5 ± 0.1f17.4 ± 0.1etr28.0 ± 0.1g181 ± 4d101 ± 3d4.3 ± 0.2d287 ± 6d
GW+22.7 ± 0.2a24.1 ± 0.3btr46.9 ± 0.1a195 ± 1b105 ± 1c1.76 ± 0.01g301 ± 1c
TWW+8.9 ± 0.2h16.4 ± 0.3gtr25.3 ± 0.4j170 ± 1e106 ± 3c3.5 ± 0.7e280 ± 3e
CW-10.9 ± 0.2d20.6 ± 0.3ctr31.5 ± 0.1d180 ± 5d96 ± 2e14 ± 2b290 ± 9d
VW-9.9 ± 0.2g24.6 ± 0.2atr34.5 ± 0.4c162 ± 6f90 ± 3f13.1 ± 0.5c265 ± 9g
EKW-8.3 ± 0.1i17.1 ± 0.2ftr25.5 ± 0.3i191 ± 3c110 ± 10b13.3 ± 0.9c318 ± 14b
GW-16.3 ± 0.1b20.4 ± 0.2ctr36.8 ± 0.2b232 ± 7a140 ± 7a4.2 ± 0.4d380 ± 10a
TWW-13.2 ± 0.1c17.3 ± 0.3etr30.6 ± 0.4e163 ± 4f77 ± 3h15.3 ± 0.8a256 ± 8h
Seeds
Oxalic acid (mg/kg dw)Malic acid (mg/kg dw)Ascorbic acid (mg/kg dw)Fumaric acid (mg/kg dw)Total organic acids (mg/kg dw)Sucrose (g/kg dw)Total sugars (g/kg dw)
CW+¥224 ± 3g1170 ± 20c657 ± 6btr2050 ± 30d19.5 ± 0.3c19.5 ± 0.3c
VW+293 ± 1f1383 ± 7b612 ± 3ctr2290 ± 10b19.3 ± 0.9c19.3 ± 0.9c
EKW+185 ± 8h970 ± 30d524 ± 2etr1680 ± 40f22.3 ± 0.5b22.3 ± 0.5b
GW+600 ± 10b910 ± 60e715 ± 4atr2220 ± 60c16.6 ± 0.5f16.6 ± 0.5f
TWW+185 ± 3h316 ± 3h488 ± 9gtr990 ± 20i18.9 ± 0.4d18.9 ± 0.4d
CW-530 ± 10dtr530 ± 10etr1040 ± 40h19.2 ± 0.6c19.2 ± 0.6c
VW-752 ± 1a1440 ± 40a580 ± 10dtr2780 ± 30a15.5 ± 0.7g15.5 ± 0.7g
EKW-579 ± 8c690 ± 30f515 ± 7ftr1780 ± 40e17.1 ± 0.5e17.1 ± 0.5e
GW-530 ± 10dtr396 ± 3itr964 ± 1j22.9 ± 0.7a22.9 ± 0.7a
TWW-440 ± 10e490 ± 20g449 ± 9htr1380 ± 20g15 ± 1h15 ± 1h
¥ W+: indicates normal irrigation regime; W-: indicates water-holding irrigation regime; C: Control; V: Veramin Ca; EK: EKOprop; G: Nomoren; TW: Twin-Antistress. Means in the same column and the same harvest (1st and 2nd pod harvests and seeds) followed by different Latin letters are significantly different according to Tukey’s honestly significant difference (HSD) test (p = 0.05). Tr: traces.
Table 7. The main fatty acids composition (%) of the studied pods and seeds of common bean (mean ± SD).
CW+ ¥VW+EKW+GW+TWW+CW-VW-EKW-GW-TWW-
1st Harvest of pods
C16:021.72 ± 0.04d20.87 ± 0.07f19.35 ± 0.05i24.1 ± 0.1b18.4 ± 0.1j23.55 ± 0.06c19.9 ± 0.1h20.26 ± 0.05g25.6 ± 0.3a21.18 ± 0.09e
C18:05.30 ± 0.01c4.87 ± 0.01d3.95 ± 0.01g9.81 ± 0.02a3.65 ± 0.01h5.35 ± 0.03c4.23 ± 0.02f4.27 ± 0.01f5.59 ± 0.03b4.48 ± 0.01e
C18:1n9c1.75 ± 0.02d1.34 ± 0.01g1.51 ± 0.01f2.08 ± 0.01b1.60 ± 0.01e1.79 ± 0.01d1.72 ± 0.01d2.18 ± 0.01a1.93 ± 0.01c1.53 ± 0.01f
C18:2n6c27.60 ± 0.03f28.69 ± 0.04d28.65 ± 0.01d26.98 ± 0.01g29.94 ± 0.03b28.52 ± 0.05d28.60 ± 0.01d32.02 ± 0.01a27.74 ± 0.08e29.33 ± 0.04c
C18:3n338.50 ± 0.01f39.53 ± 0.04d42.21 ± 0.04b32.62 ± 0.01j42.76 ± 0.06a35.51 ± 0.02h41.36 ± 0.06c36.83 ± 0.05g33.1 ± 0.1i38.7 ± 0.1e
C22:01.27 ± 0.03b0.96 ± 0.09d0.82 ± 0.01f1.06 ± 0.06c0.77 ± 0.01g1.47 ± 0.05a0.86 ± 0.03e0.88 ± 0.05e1.46 ± 0.05a0.99 ± 0.02d
C24:01.09 ± 0.02f1.29 ± 0.02c1.15 ± 0.01e1.03 ± 0.02g1.04 ± 0.01g1.32 ± 0.04c1.24 ± 0.02d1.12 ± 0.02ef1.56 ± 0.02a1.39 ± 0.01b
SFA31.06 ± 0.03d29.33 ± 0.02e26.80 ± 0.07h37.64 ± 0.03a25.02 ± 0.07h33.35 ± 0.08c27.62 ± 0.06g27.87 ± 0.06f35.9 ± 0.2b29.42 ± 0.06e
MUFA2.75 ± 0.06c2.30 ± 0.05f2.18 ± 0.02g2.62 ± 0.01d2.17 ± 0.01g2.43 ± 0.01e2.26 ± 0.02f3.12 ± 0.01a2.99 ± 0.02b2.25 ± 0.01f
PUFA66.19 ± 0.03f68.37 ± 0.07e71.02 ± 0.05b59.74 ± 0.02i72.81 ± 0.08a64.22 ± 0.09g70.12 ± 0.07c69.01 ± 0.07d61.1 ± 0.2h68.33 ± 0.06e
2nd Harvest of pods
C16:018.8 ± 0.2g26.81 ± 0.08b22.4 ± 0.1d21.4 ± 0.1e28.90 ± 0.06a23.6 ± 0.1c17.09 ± 0.06i23.6 ± 0.1c19.1 ± 0.2f17.7 ± 0.1h
C18:04.38 ± 0.03f9.68 ± 0.02a4.81 ± 0.01d4.00 ± 0.01g6.78 ± 0.01b5.35 ± 0.02c3.69 ± 0.01h5.30 ± 0.03c4.68 ± 0.03e4.38 ± 0.01f
C18:1n9c1.48 ± 0.01h1.71 ± 0.01f1.75 ± 0.01f1.46 ± 0.01h2.29 ± 0.01b1.68 ± 0.01g1.95 ± 0.01e2.13 ± 0.01d2.21 ± 0.02c2.82 ± 0.01a
C18:2n6c28.46 ± 0.02d24.80 ± 0.01g28.46 ± 0.04d28.89 ± 0.05c26.04 ± 0.02f28.39 ± 0.01d32.46 ± 0.02b28.03 ± 0.04e34.33 ± 0.09a28.41 ± 0.01d
C18:3n343.3 ± 0.1a31.42 ± 0.01h35.0 ± 0.1g40.02 ± 0.07d29.67 ± 0.01i36.12 ± 0.03e40.43 ± 0.07c35.08 ± 0.03g35.63 ± 0.07f42.78 ± 0.02b
C22:00.64 ± 0.02h1.1 ± 0.1c1.7 ± 0.1a1.04 ± 0.04d0.927 ± 0.005f0.95 ± 0.02e1.18 ± 0.06b1.68 ± 0.06a0.46 ± 0.01i0.720 ± 0.008g
C24:00.901 ± 0.008f1.32 ± 0.01a1.03 ± 0.01e1.17 ± 0.02d1.27 ± 0.05b1.22 ± 0.03c0.91 ± 0.02f1.20 ± 0.04cd0.930 ± 0.006f0.84 ± 0.01g
SFA26.1 ± 0.1h40.95 ± 0.03a31.75 ± 0.02e29.1 ± 0.1f40.23 ± 0.09b32.94 ± 0.05d24.3 ± 0.1j33.6 ± 0.1c26.8 ± 0.2g25.50 ± 0.07i
MUFA1.93 ± 0.01h2.63 ± 0.04e4.6 ± 0.2a1.78 ± 0.01i3.90 ± 0.07b2.37 ± 0.03g2.52 ± 0.01f2.99 ± 0.02d3.08 ± 0.02c3.06 ± 0.02c
PUFA71.9 ± 0.1b56.42 ± 0.01i63.6 ± 0.1g69.1 ± 0.1e55.87 ± 0.02j64.68 ± 0.02f73.1 ± 0.1a63.43 ± 0.09h70.2 ± 0.2d71.44 ± 0.05c
Seeds
C16:011.60 ± 0.04b11.86 ± 0.03a11.16 ± 0.06c10.46 ± 0.04i10.73 ± 0.05g10.93 ± 0.04d10.58 ± 0.01h10.83 ± 0.05f10.89 ± 0.01e10.38 ± 0.02j
C18:02.61 ± 0.01b2.69 ± 0.01a2.19 ± 0.01h2.25 ± 0.01g2.10 ± 0.01i2.54 ± 0.01c2.38 ± 0.01e2.43 ± 0.01d2.33 ± 0.01f2.27 ± 0.01g
C18:1n9c2.35 ± 0.01b1.80 ± 0.01d1.95 ± 0.02c1.54 ± 0.01h1.58 ± 0.02g2.56 ± 0.01a1.70 ± 0.01e1.63 ± 0.01f1.46 ± 0.01i1.79 ± 0.01d
C18:2n6c29.54 ± 0.02a25.28 ± 0.01e27.36 ± 0.03b26.00 ± 0.01c24.89 ± 0.03h24.97 ± 0.01f25.84 ± 0.01d24.31 ± 0.03j24.52 ± 0.01i24.93 ± 0.02g
C18:3n351.48 ± 0.03i55.96 ± 0.02g55.54 ± 0.02h57.75 ± 0.05d58.41 ± 0.05c56.88 ± 0.01f57.46 ± 0.04e58.72 ± 0.03b59.08 ± 0.02a58.77 ± 0.03b
SFA16.15 ± 0.06b16.66 ± 0.01a14.63 ± 0.05f14.32 ± 0.03h14.45 ± 0.01g15.30 ± 0.02c14.66 ± 0.03f15.07 ± 0.07d14.78 ± 0.01e14.15 ± 0.02i
MUFA2.72 ± 0.01a2.02 ± 0.02e2.39 ± 0.03b1.84 ± 0.01f2.17 ± 0.06c2.77 ± 0.01a1.97 ± 0.02e1.82 ± 0.01f1.59 ± 0.01g2.08 ± 0.02d
PUFA81.13 ± 0.05i81.32 ± 0.03h82.98 ± 0.02f83.84 ± 0.05a83.39 ± 0.07d81.93 ± 0.01g83.37 ± 0.05d83.11 ± 0.06e83.63 ± 0.01c83.77 ± 0.04b
C16:0 palmitic acid, C18:0 stearic acid, C18:1n9c oleic acid, C18:2n6c linoleic acid, C18:3n3 c, C22:0 behenic acid, C24:0 lignoceric acid; SFA: saturated fatty acids; MUFA: monounsaturated fatty acids; PUFA: polyunsaturated fatty acids; n6/n3: ratio of omega-6/omega-3 fatty acids. ¥ W+: indicates normal irrigation regime; W-: indicates water-holding irrigation regime; C: Control; V: Veramin Ca; EK: EKOprop; G: Nomoren; TW: Twin-Antistress. Means in the same row followed by different Latin letters are significantly different according to Tukey’s honestly significant difference (HSD) test (p = 0.05).

