1. Introduction
In the case of peaches and nectarines, the available genetic biodiversity allowed for the development of new varieties that allow progress in the form of new business opportunities [
1]. In the last decade, new varieties emerged that ripen earlier and are more resistant and productive. In Spain, the implementation of these varieties and the increase in cultivation area led to increases in production to a maximum of 1,800,000 tons in 2017 [
2]. However, this increase in production was not accompanied by an increase in consumption due to, among other factors, the lack of organoleptic quality of these new varieties [
3].
In Spain, this decoupling between production and the demand for peaches and nectarines resulted in a crisis in the production sector in 2017. One of the options for improving this sector is to implement actions aimed at increasing consumption, such as (1) implementing “super sweet” varieties with a minimum soluble solid content of 11 °Brix, since sweetness is generally the main parameter that defines the acceptance of the product by the consumer [
1,
4,
5], and (2) offering the consumer mature fruits for consumption in the supermarket line, marketed as “ready to eat” [
6].
One of the main destinations of peaches and nectarines produced in Spain is countries in northern Europe. Some supermarket chains in these countries are interested in distributing “ready-to-buy” (firmness between 26.7 and 35.6 Newtons, N) fruits from their logistics centers such that, after receiving them in the store and a short shelf-life period in the supermarket, the fruits reach the level of firmness corresponding to the state “ready to eat” (between 8.9 and 13.3 N) [
1], i.e., they intend to differentiate themselves by offering the consumer a fruit with high organoleptic quality directly in the line of supermarkets, forcing producers to ensure the product arrives in conditions of adequate maturity for consumption [
7].
Peaches and nectarines ripen and then deteriorate rapidly at room temperature. Therefore, cold storage, control atmospheres, or ethylene management are used to slow down these processes. The optimum temperature range for the storage of peaches and nectarines is 0–3 °C [
4]. If the fruits are intended to be “ready to eat”, they are not stored for long periods of times at low temperatures and, therefore, there is a decreased risk of cold damage, such as “wooliness”, a disorder characterized by a low juice content in fruits [
8,
9]. In these fruits, it is generally necessary to apply pre-ripening protocols which increase the organoleptic quality by making the fruits juicier and more aromatic [
10]. These protocols use different time and temperature combinations that are validated for traditional varieties, but which show deficiencies with new varieties, resulting in less juicy fruits and fruits with gummy textures [
3].
During normal ripening, the flesh firmness decreases and the respiration, ethylene emission, and pectolytic enzyme activity increase. Polygalacturonase activity increases and pectin esterase activity decreases along with an increase in water-soluble pectin; these changes coincide with the greatest loss of flesh firmness and with an increase in extractable juice content [
11,
12]. The firmness of the equatorial zone of peaches and nectarines is a good indicator of ripening. The standardized Magness–Taylor’s test (MT) is routinely used by companies to identify “ready-to-eat” batches [
13]; this test is carried out using a standard cylindrical probe with convex tip, where the maximum force necessary to press the probes into the pulp of the fruit (after removing the skin) at a known depth and speed is recorded as the MT force (F
MT). However, it is noted that the categorization of the lots according to their firmness is not sufficient to adequately identify ripe fruits, that is, those that are soft and juicy among other descriptors [
4,
14], as demanded by the consumers of the commercial category “ready to eat”. However, for the determination of juiciness, there is no procedure generally accepted by the stakeholders in the logistic chain. Although several research works were carried out with the objective of specifying instrumental procedures for the estimation of juiciness, including mechanical [
8,
15,
16], spectroscopic [
17,
18,
19], and sensory [
4,
10] approaches, none are developed to date that sufficiently address the requirements of the industry.
The objective of this work is to study instrumental procedures, based on optical and mechanical properties, for the objective evaluation of juiciness in new varieties of peaches and nectarines subjected to different postharvest treatments aimed at obtaining “ready-to-eat” fruits. The aim is to define protocols for easy implementation in the different scenarios of the value chain and the establishment of thresholds for the classification of “ready-to-eat” fruits of high commercial value.
2. Materials and Methods
Peaches and nectarines (
Prunus persica L. Batsch) of white and yellow pulp (
Table 1) were used for the tests. This plant material was grown in the northwestern region of Murcia (Spain) during the 2018 and 2019 seasons and was supplied directly after harvest by the producing company, Frutas Esther, S.A. The test period ranged from week 21 (second half of May) to week 39 (second half of September). The tested varieties were new varieties with a high content of soluble solids called “super sweet”, which are used to obtain “ready-to-eat” fruits. A total of 2166 fruits were used, of which 1367 corresponded to the 2018 season (485 were peaches and 882 were nectarines) and 799 to the 2019 season (399 peaches and 400 nectarines).
Intact and sound fruits of commercial “extra” class, once calibrated (A, diameter 67–73 mm) in Frutas Esther (Murcia), were sent by refrigerated transport to the Laboratorio de Propiedades Físicas y Técnicas Avanzadas en Agroalimentación of the Universidad Politécnica de Madrid (LPF-TAGRALIA, Madrid, Spain), where they were tested. Each of the varieties was tested at the time of reception in the laboratory (one day after harvesting) and after the postharvest protocol was implemented (in LPF-TAGRALIA).
During the 2018 season, different postharvest protocols were applied, characterized by always including an initial cooling period at 3 °C (90% relative humidity (RH)) (C), which could continue with an intermediate pre-ripening stage (P) in a chamber at 20 °C (90% RH), followed by a short cooling period at 2 °C (90% RH) (Cpost), and ending with a shelf life at 20 °C (SL) of variable duration. The total duration of the postharvest treatment applied to the fruits was very variable, ranging between six and 14 days, depending on the combination and duration of the periods C, P, Cpost, and SL used in each case. The different combinations of postharvest treatments used for each of the tested varieties were always aimed at achieving a maximum range of variation in the juiciness levels of the fruits. From the results of the 2018 season, the postharvest protocols that resulted in higher levels of juiciness were selected to be implemented in the 2019 season. These protocols consisted of an initial cooling period of 72 h at 3 °C (90% RH) (C), followed by an intermediate pre-ripening stage (P) in a chamber at 20 °C (90% RH) until FMT of 30 N, followed by a short cooling period (24 h) at 2 °C (90% RH) (Cpost), and ending with a shelf life at 20 °C (SL) until FMT of 13 N. The tests were performed after reception in the laboratory (H) and after the Cpost and SL periods.
On each test day, individual fruits were characterized for their weight (P, kg) as determined using a precision balance (ADP 720/L, Adam Equipment Co. Ltd., Kingston, Milton Keynes, United Kingdom), soluble solid content (SSC, °Brix) as determined from a few drops of juice using a digital refractometer (Palette PR-101, ATAGO CO., LTD., Tokyo, Japan), and instrumental firmness as determined using a motorized desktop penetrometer specific to fruits (FTA Model GS-15, Guss, Strand, South Africa). This equipment has a basic control of the measurement parameters that allowed us to perform the standardized Magness–Taylor test; the maximum force (FMT) was recorded in N.
To determine the juiciness and water content of the fruits, the following reference tests were carried out:
Water content of the fruits (W, %): The percentage of water over fresh weight of the fruits was determined by drying approximately 20 g of pulp (P0) in an oven (Conterm Poupinel, JP SELECTA SA, Abrera, Barcelona, Spain) at 103 °C to constant weight (Pf) and using the expression cm.
Instrumental juiciness (Ajuice, cm
2): Quantification of the easily extractable juice from the pulp was carried out by confined compression test on a cylindrical pulp sample of 1.4 cm in height and 1.4 cm in diameter. The sample was confined in a disc with the same size that the pulp sample [
20]. The compression was performed using a specific implement adapted for use in the FTA penetrometer. In this test, the juice is collected on standardized absorbent paper following the compression of fruit sample to a deformation depth of 2 mm (season 2018) or 5 mm (season 2019). Instrumental juiciness is defined as the wet area (cm
2) on the paper. The area is determined by scanning each paper, segmenting the image, and calculating the REGIONPROPS of the segmented object using the MATLAB
® image analysis package. Three repetitions were performed per fruit.
Sensory juiciness (Juiciness): A sensory analysis was carried out by means of a tasting panel consisting of three expert tasters, previously trained to evaluate the descriptors “juiciness” and “crunchiness” in the fruits. A scale of 0–9 points was used, with the value of zero corresponding to the lowest presence of the descriptor in the sample and nine to the maximum presence. The average value of the scores of the three tasters was used to define the sensory juiciness of each fruit.
In addition, the NIR spectrum of reflectance was acquired in the equatorial zone of each fruit on the most colored face. A desktop spectrophotometer (PMA 11, Hamamatsu Photonics K.K., Shizuoka, Japan) with a range of 896–1684 nm and a spectral resolution of 3 nm was used. In the acquisition of the spectra, the integration time was adjusted to ensure an optimal spectral pattern in all spectra, with a relative reflectance of at least 0.6 at the peak of greatest intensity. The corresponding absorbance spectra were obtained and, from them, models of estimation of instrumental juiciness were generated through the application of partial least squares regressions (PLS). Models were obtained with the spectra without any preprocessing, and models with the preprocessed spectra were obtained by means of the standard normal variate procedure (SNV), in which each spectrum is centered with respect to its average value and divided by its standard deviation [
21]. The goodness of each estimation model was evaluated through the coefficient of correlation (
r), standard error of calibration (SEC), standard error of cross-validation (SECV), ratio of the prediction to deviation (RPD), number of latent variables (LV), and slope.
In summary, each of the fruits was weighed, its near-infrared (NIR) spectrum was obtained, and the Magness–Taylor test was performed. Three samples of the colored face of the fruit were taken for the instrumental juiciness test; approximately 20 g of pulp was taken for determination of W (%), three portions of pulp were taken to perform the sensory analysis, and a few drops of juice were collected for determination of SSC.
All data analyses were performed using MATLAB R2015a (The MathWorks, Natick, MA, USA) and Statistica 13.3 (TIBCO Software Inc., Palo Alto, CA, USA) software.
3. Results
3.1. General Overview of the Samples
The postharvest protocols applied to the different batches of peaches and nectarines were aimed at generating the maximum variability of the variables studied, which are shown in
Table 2. The average content of soluble solids was above 11 °Brix in both peaches and nectarines in both seasons, corresponding to these “super sweet” varieties. The coefficient of variation (CV) in nectarines practically doubled that of peaches, since the nectarines reached an SSC that exceeded 25 °Brix compared to the maximum 20 °Brix recorded in the case of peaches.
The water content of fruits was the variable with the lowest CV among those studied. Nectarines had a CV around 4.8%, which was almost double that of peaches (CVW ≈ 2.5%). However, the CVs corresponding to the variables related to free juiciness were much higher. Instrumental juiciness ranged between 1 and 13 cm2 in nectarines and between 1 and 15 cm2 in peaches in the 2018 season. This maximum value of this range expanded around 1.5 cm2 as a result of the change in the protocol that increased the compression strain in the instrumental juiciness test. The CV remained slightly higher in the case of peaches (around 60.7% in both seasons) than in nectarines (52.2%), due to the greater instrumental juiciness achieved by the varieties of peaches tested (around 3 cm2 more at maximum values). This same trend was maintained in sensory juiciness with a CV in peaches of 43.9% and 38.6% in nectarines.
The greatest range of variation (above 90 N) and the highest CV (above 64%) were reached in the variable corresponding to FMT firmness, which were the expected results when testing fruits from one day after harvesting until after postharvest treatments for the production of “ready-to-buy” and “ready-to-eat” fruits.
3.2. Identification of the Ready-to-Eat Fruits in the 2018 Season
The analysis of correlations between the variables shows that there was a strong negative correlation between the variable W (%) and °Brix with a value of r = −0.91 in the nectarines and r = −0.77 in peaches. This could result from increasing the water content in the fruit, which meant soluble solids were less concentrated in the solution, which decreased the value of °Brix measured. However, the water content of the fruits was not correlated with their level of juiciness, whether sensory or instrumental. Sensory juiciness and instrumental juiciness had a significant and slightly positive correlation of r = 0.48 in nectarines and r = 0.61 in peaches. Both variables had, in the case of peaches and nectarines, a significant negative correlation (r between −0.5 and −0.77) with the FMT variable. This level of correlation indicated that, as fruit softening occurred, both instrumental juiciness and sensory juiciness increased.
For the identification of “ready-to-eat” fruits, a panel of experts defined the optimal fruits for consumption as those fruits that are sufficiently soft, with F
MT less than 20 N [
16], and juicy (high sensory juiciness), with a juiciness score above six. Considering these limits, we proposed the establishment of three categories of firmness: hard fruits (F
MT ≥ 40 N), soft fruits (F
MT < 20 N), and intermediate firmness fruits for those between both thresholds, as well as three categories of sensory juiciness: fruits of high juiciness with sensory score ≥6, low juiciness with a sensory score <4, and intermediate juiciness for those between the two limits. When this categorization was applied to the whole population of peaches and nectarines of the 2018 season, it was found that, of the 1367 fruits tested, only 33% had F
MT < 20 N, and only 21% were able to develop high sensory juiciness (≥6 points) after the different types of postharvest protocols were implemented. Regardless of the variety, the fruits that reached these limits of firmness and juiciness were those subjected to a postharvest protocol that included pre-ripening and shelf life.
The analysis of instrumental juiciness of fruits categorized as soft and juicy indicated that the average juice area in peaches and nectarines belonging to this class was 4.55 (±2.35) cm
2 and 4.50 (±2.24) cm
2, respectively (
Table 3).
In addition, the calculation of the 10th percentile indicated that 90% of soft and sensory juicy fruits had an area of juice above 2.25 cm
2 in peaches and 2.26 cm
2 in nectarines.
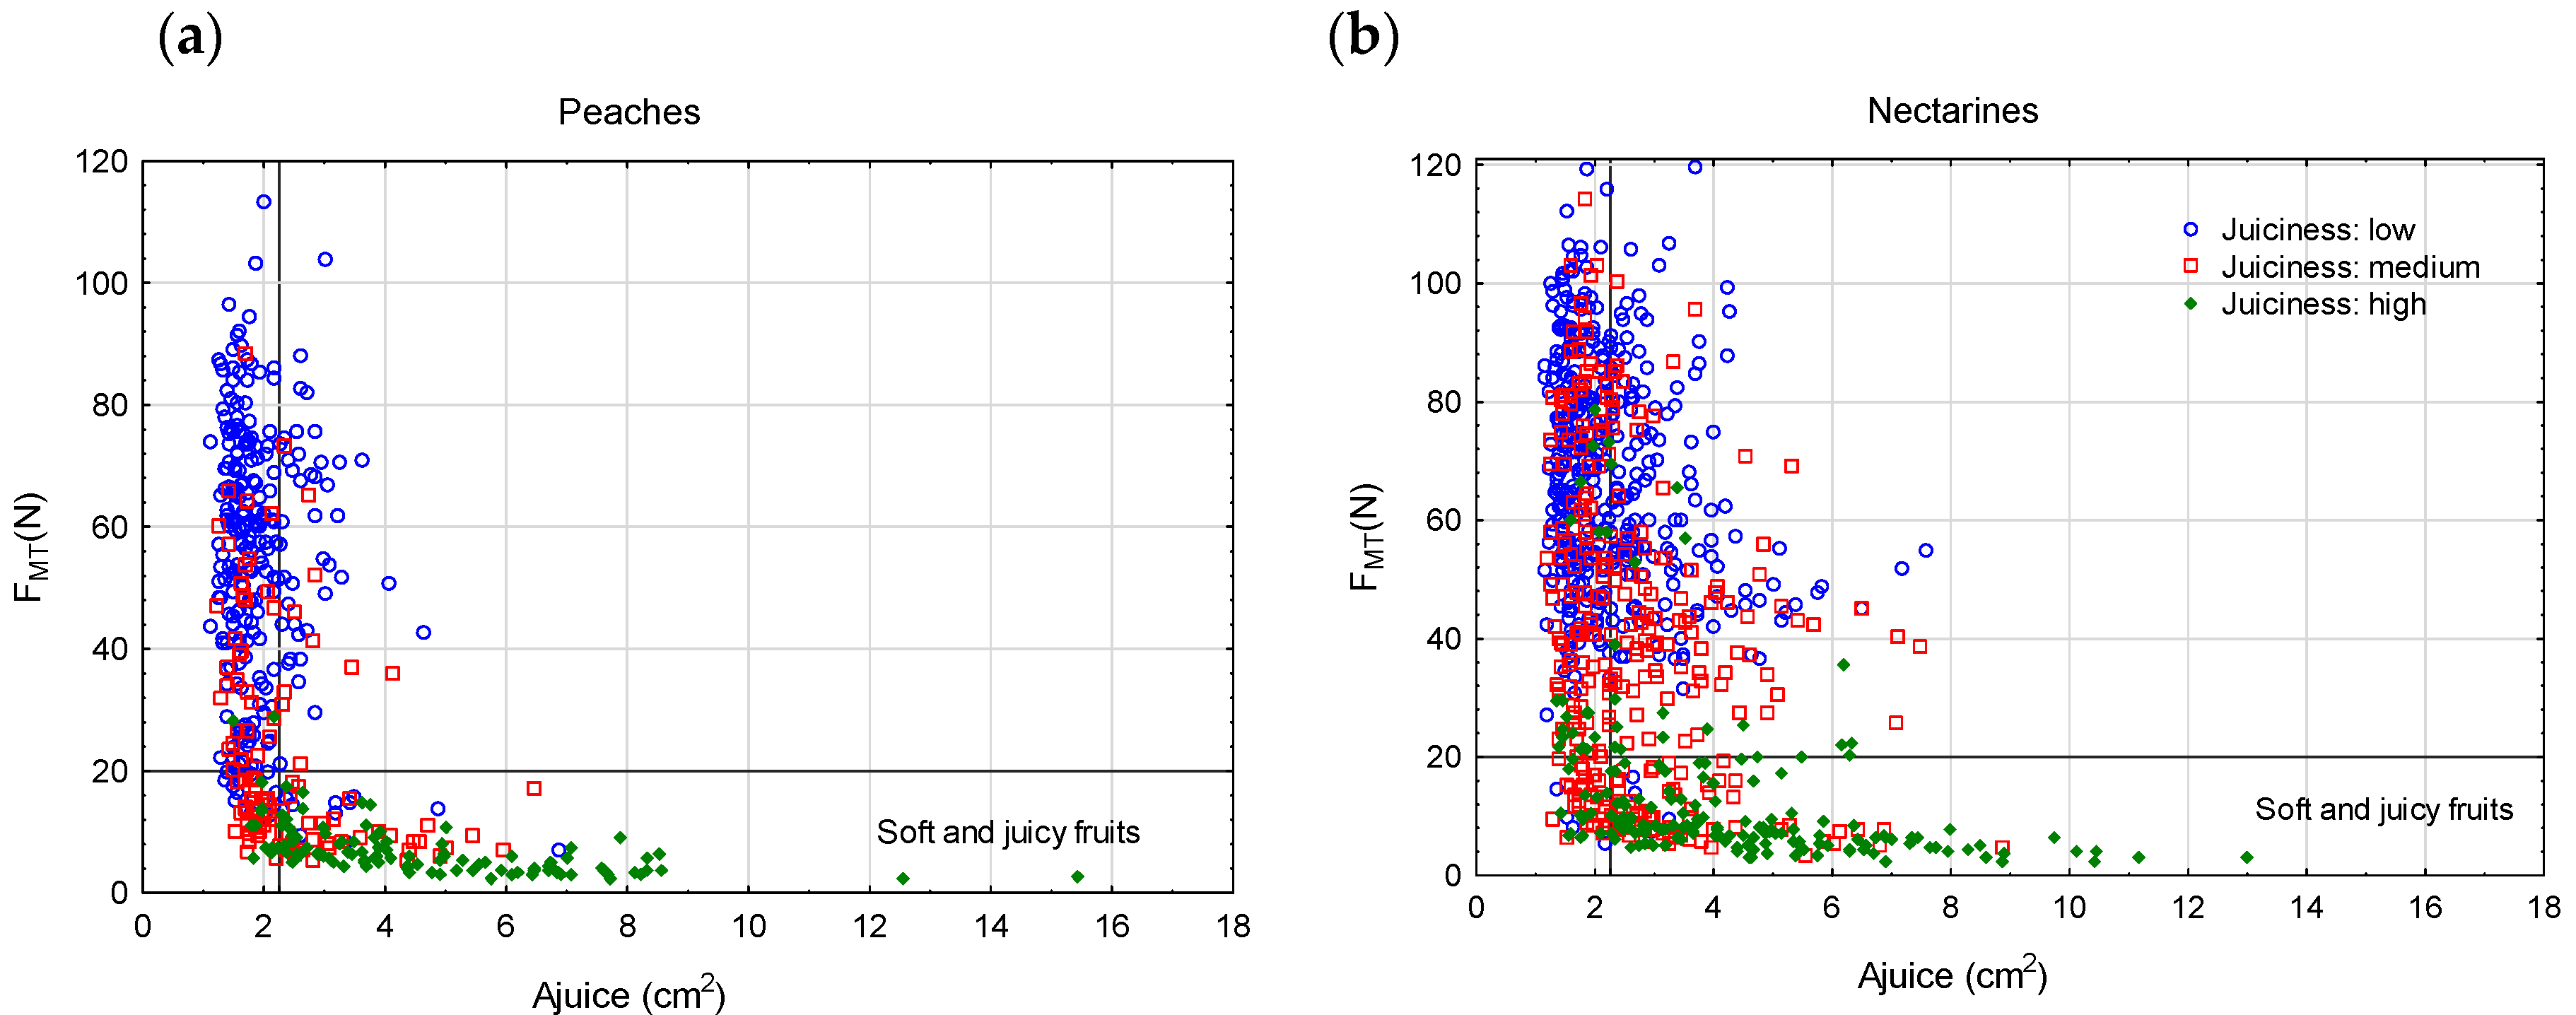
Figure 1 shows the representation of F
MT (N) versus instrumental juiciness (cm
2) of all peaches (left) and nectarines (right). In this figure, each individual is identified according to the category of sensory juiciness to which it belongs. As seen in
Figure 1, soft fruits (F
MT < 20 N) with instrumental juiciness greater than 2.25 cm
2 in peaches and 2.26 cm
2 in nectarines were delimited in the lower right quadrant. As seen in that quadrant of
Figure 1, fruits categorized as having high sensory juiciness (green dots) were 88.4% in the case of peaches and 72.0% in the case of nectarines.
Figure 1 also shows that the instrumental juiciness test was not very discriminating for fruits in the stages of low and medium sensory juiciness. Therefore, in the 2019 season, the protocol for determining instrumental juiciness was modified by increasing the deformation in the compression test from 2 to 5 mm.
3.3. Identification of the Ready-to-Eat Fruits in the 2019 Season
In the 2019 season, the correlation analysis between the variables W (%) and °Brix confirmed that there was a strong negative correlation between the two, with a value of r = −0.80 in nectarines and r = −0.79 in peaches. It was also corroborated that the water content of the fruits was not correlated with their level of juiciness, whether instrumentally determined or sensorially determined. The change in the protocol for determining instrumental juiciness allowed the range of variation of the juice areas to be increased, significantly improving the correlation between the variables instrumental juiciness and sensory juiciness, which now reached a greater positive correlation with r = 0.68 in nectarines and r = 0.82 in peaches. Both variables also had a greater negative correlation with the FMT variable with a correlation coefficient r between −0.69 and −0.76.
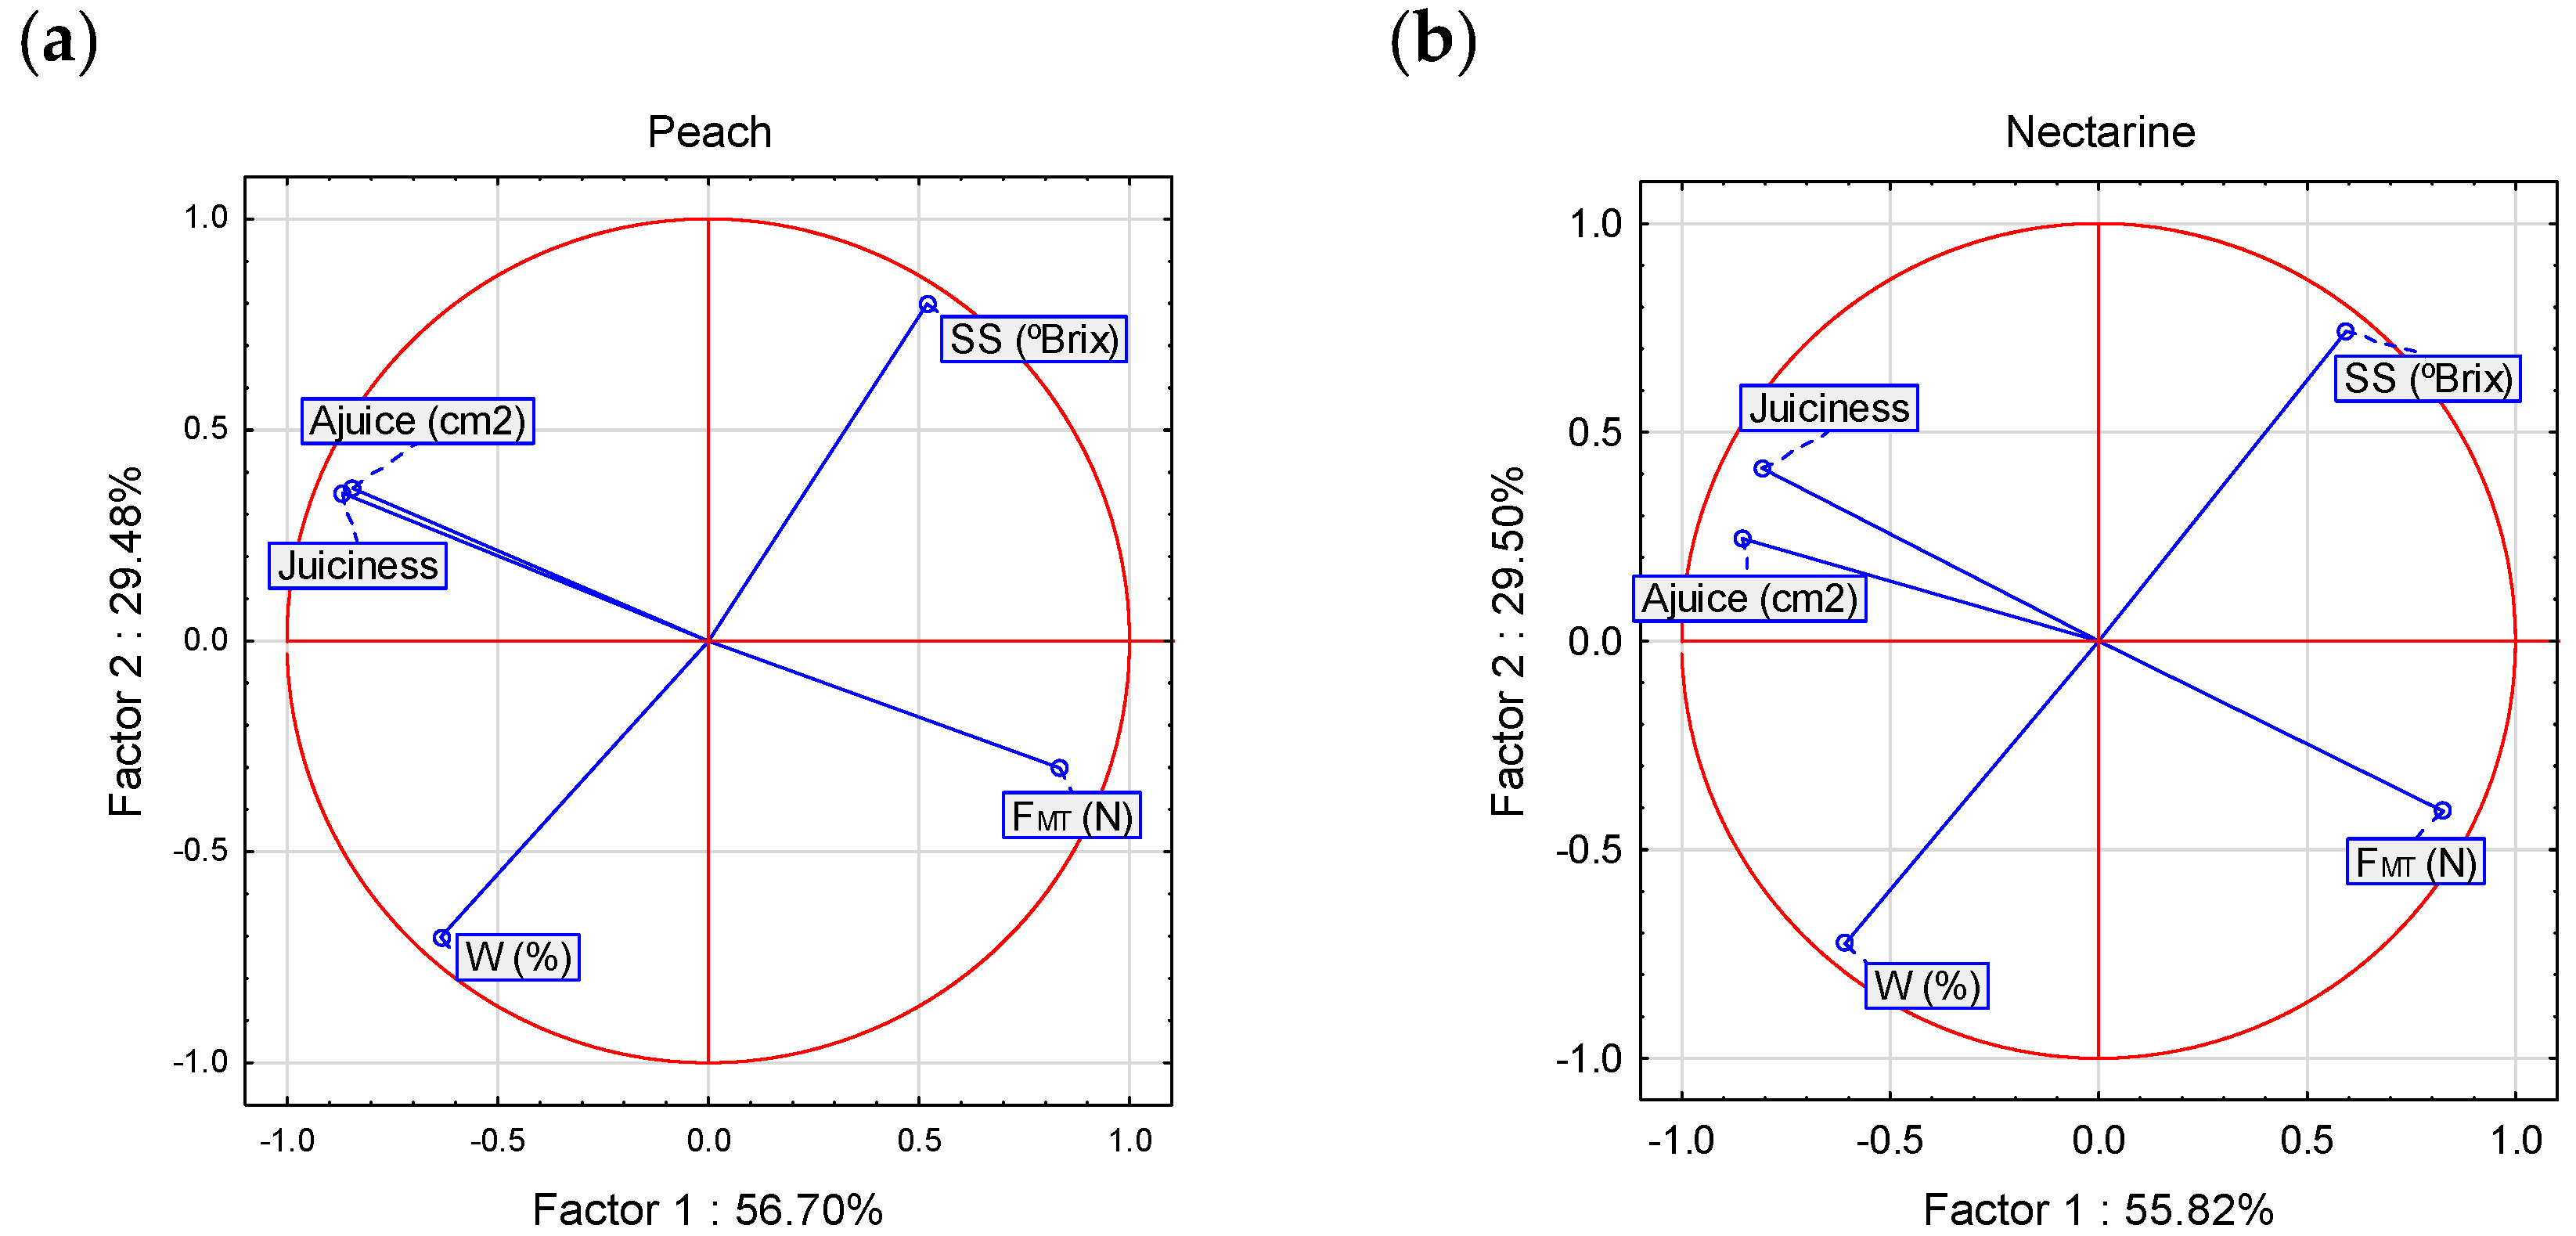
Figure 2 shows the principal component analysis (PCA) for peaches and nectarines from the 2019 season that summarizes the correlations between the studied variables. In both products, it was observed that the variables
W (%) and °Brix were aligned at opposite ends of the same axis. This axis was practically perpendicular, that is, independent of the axis constituted by the contributions of the variables sensory juiciness and instrumental juiciness (overlapping) and diametrically opposed to the F
MT variable.
Applying to the 2019 season the same categorization described in the previous section for the identification of soft fruits with high sensory juiciness, it was observed that, of the 799 fruits tested, 57% evolved to reach FMT < 20 N, and 46% were capable of developing a high sensory juiciness (≥6 points). The increase in the proportion of soft fruits and fruits of high sensory juiciness in this season compared to that of 2018 was due to the fact that, in 2019, the postharvest protocols that were identified in the 2018 season as the most suitable for obtaining “ready-to-eat” fruits were prioritized.
The analysis of instrumental juiciness of fruits categorized as soft and juicy shows that the average juice area in peaches and nectarines belonging to this class increased to 10.26 (±3.01) cm
2 and 8.29 (±2.52) cm
2, respectively. In addition, the calculation of the 10th percentile indicated that 90% of soft and sensory juicy fruits had an area of juice above 5.8 cm
2 in peaches and 5.4 cm
2 in nectarines (
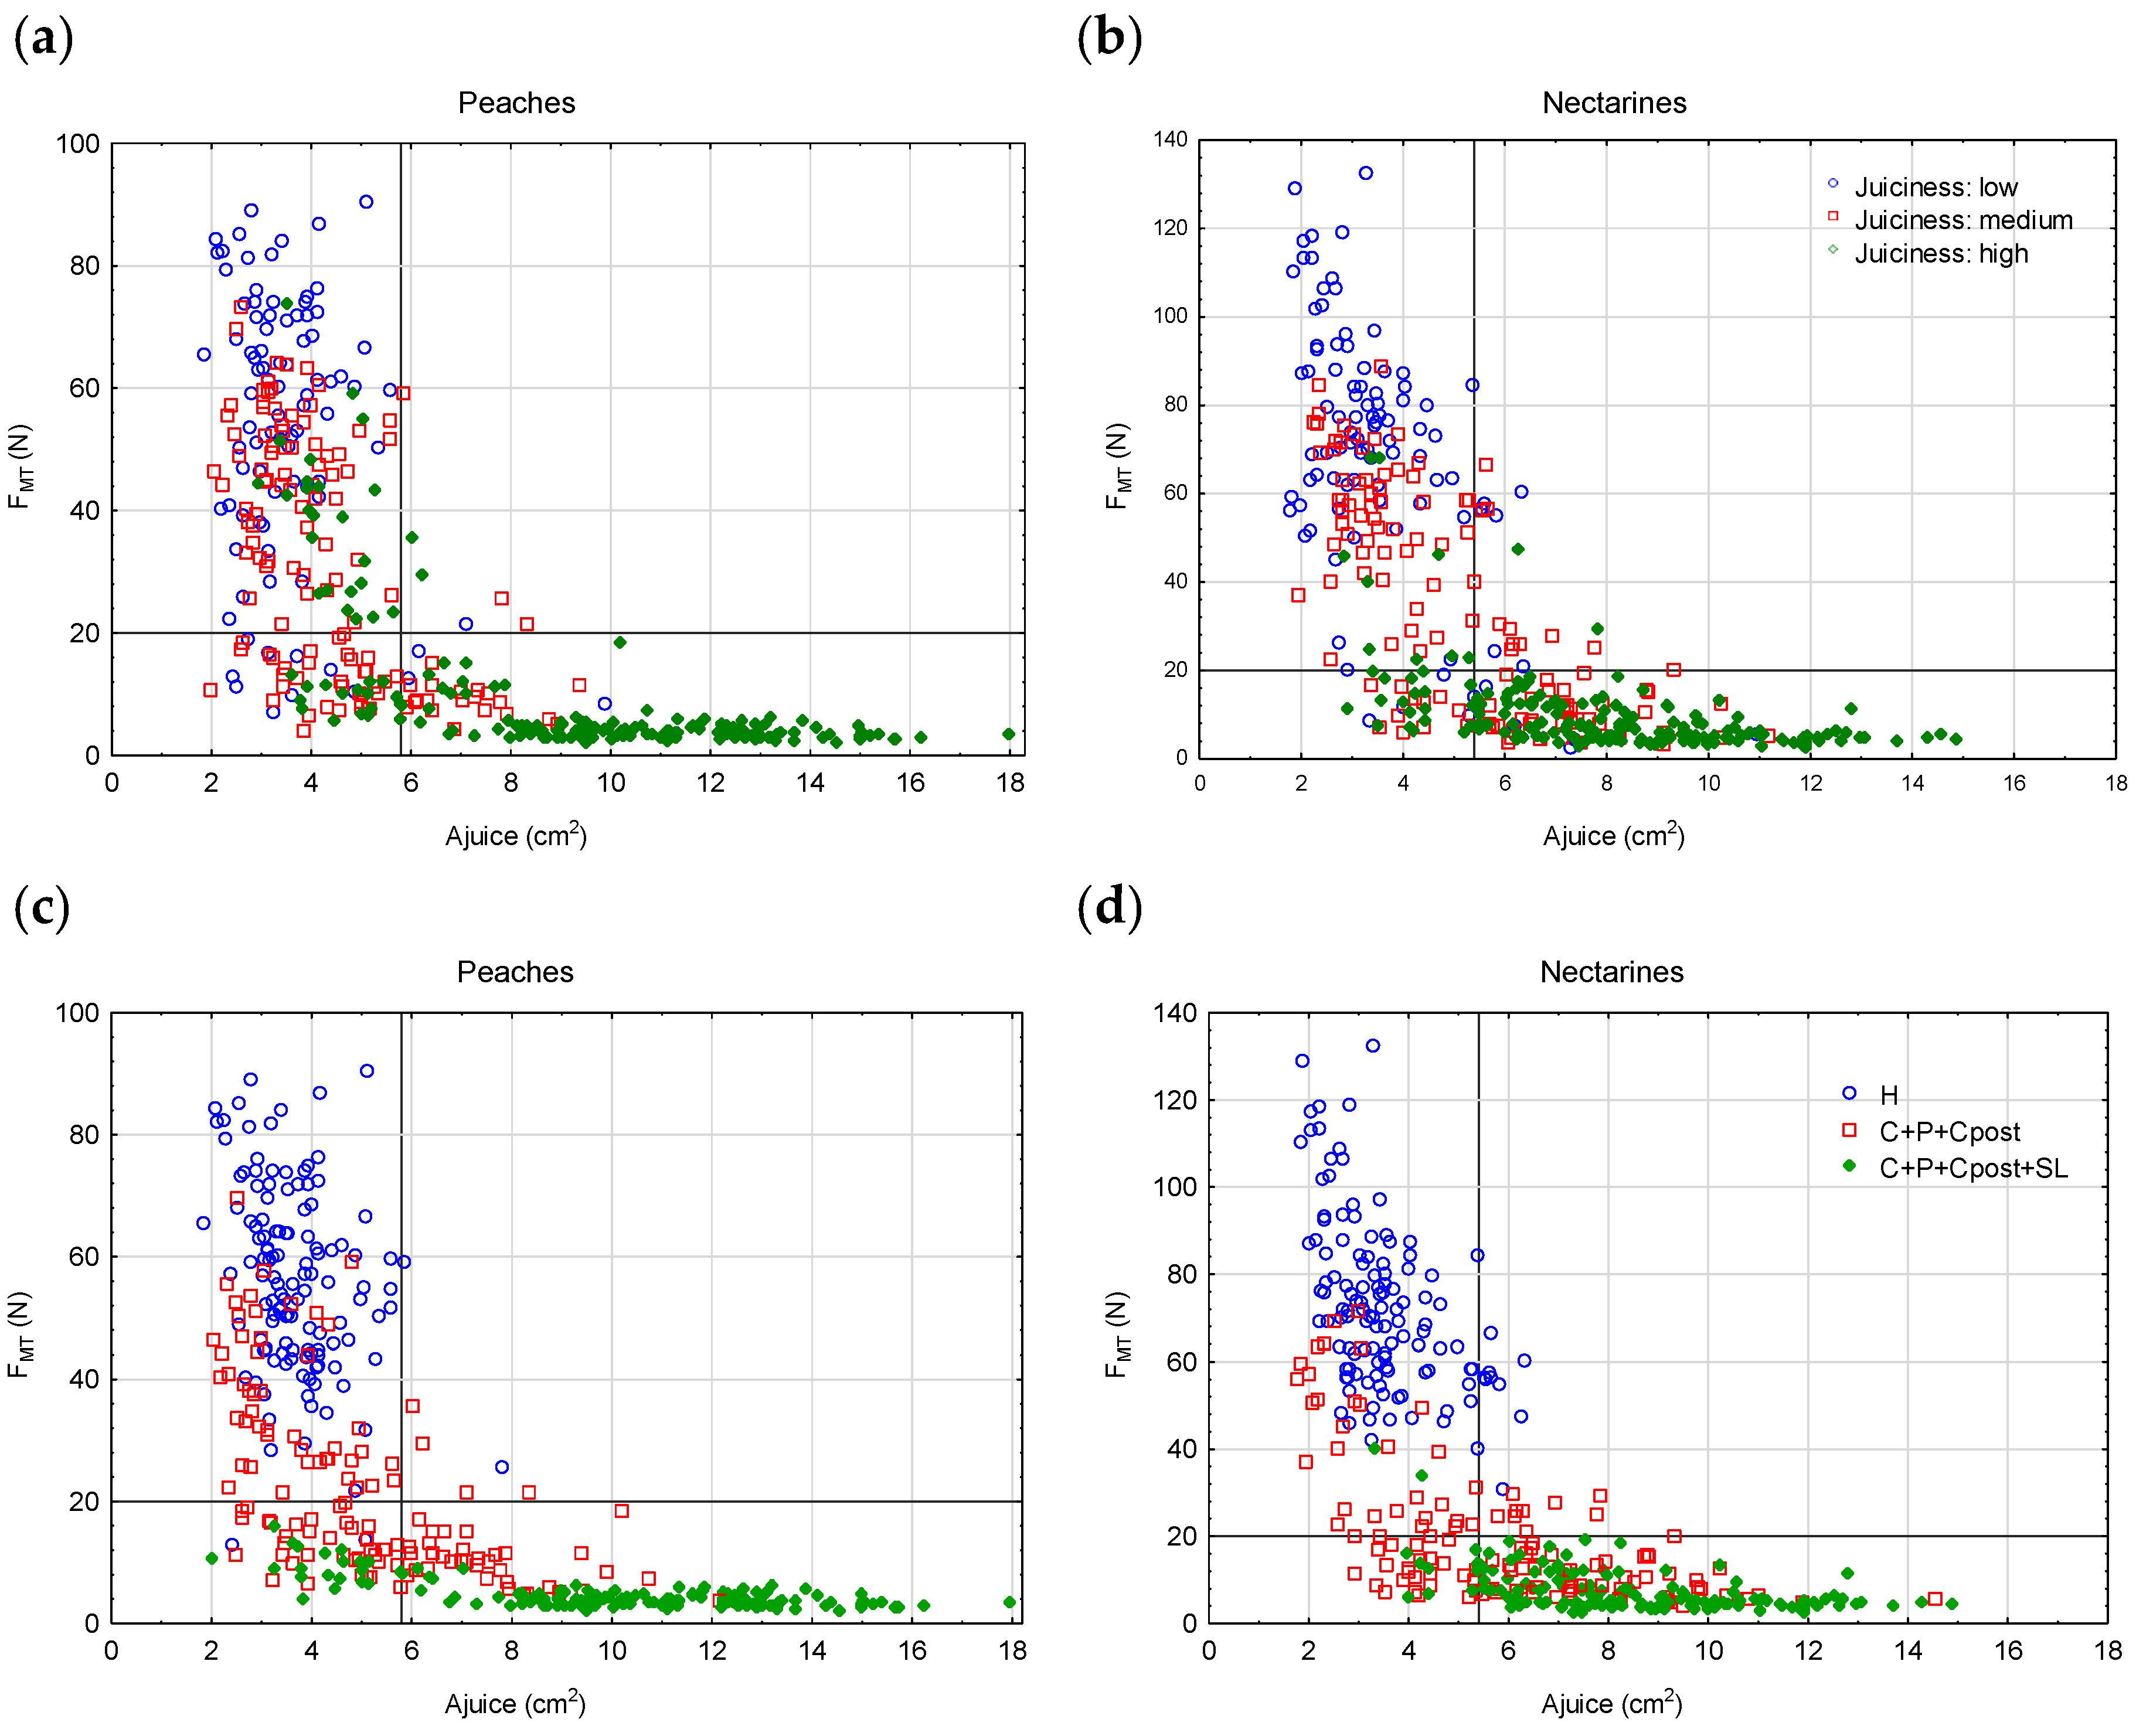
Table 3). In
Figure 3a,b, the soft fruits (F
MT < 20 N) with instrumental juiciness higher than the 10th percentile calculated for peaches and nectarines of the 2019 season are shown in the lower right quadrant. It was observed again that the fruits categorized as higher in sensory juiciness (green dots) were preferably located, 79% in the case of peaches and 85.0% in the case of nectarines, in said quadrant. On the other hand,
Figure 3 shows that, below the value of the 10th percentile marked for instrumental juiciness, the variability of the juice areas corresponding to the fruits of low and medium sensory juiciness was significantly increased, an effect sought by changing the protocol for the determination of instrumental juiciness by increasing the deformation from 2 to 5 mm.
Figure 3 c,d, show that, for the most part, fruits with SL were located in the lower right quadrant.
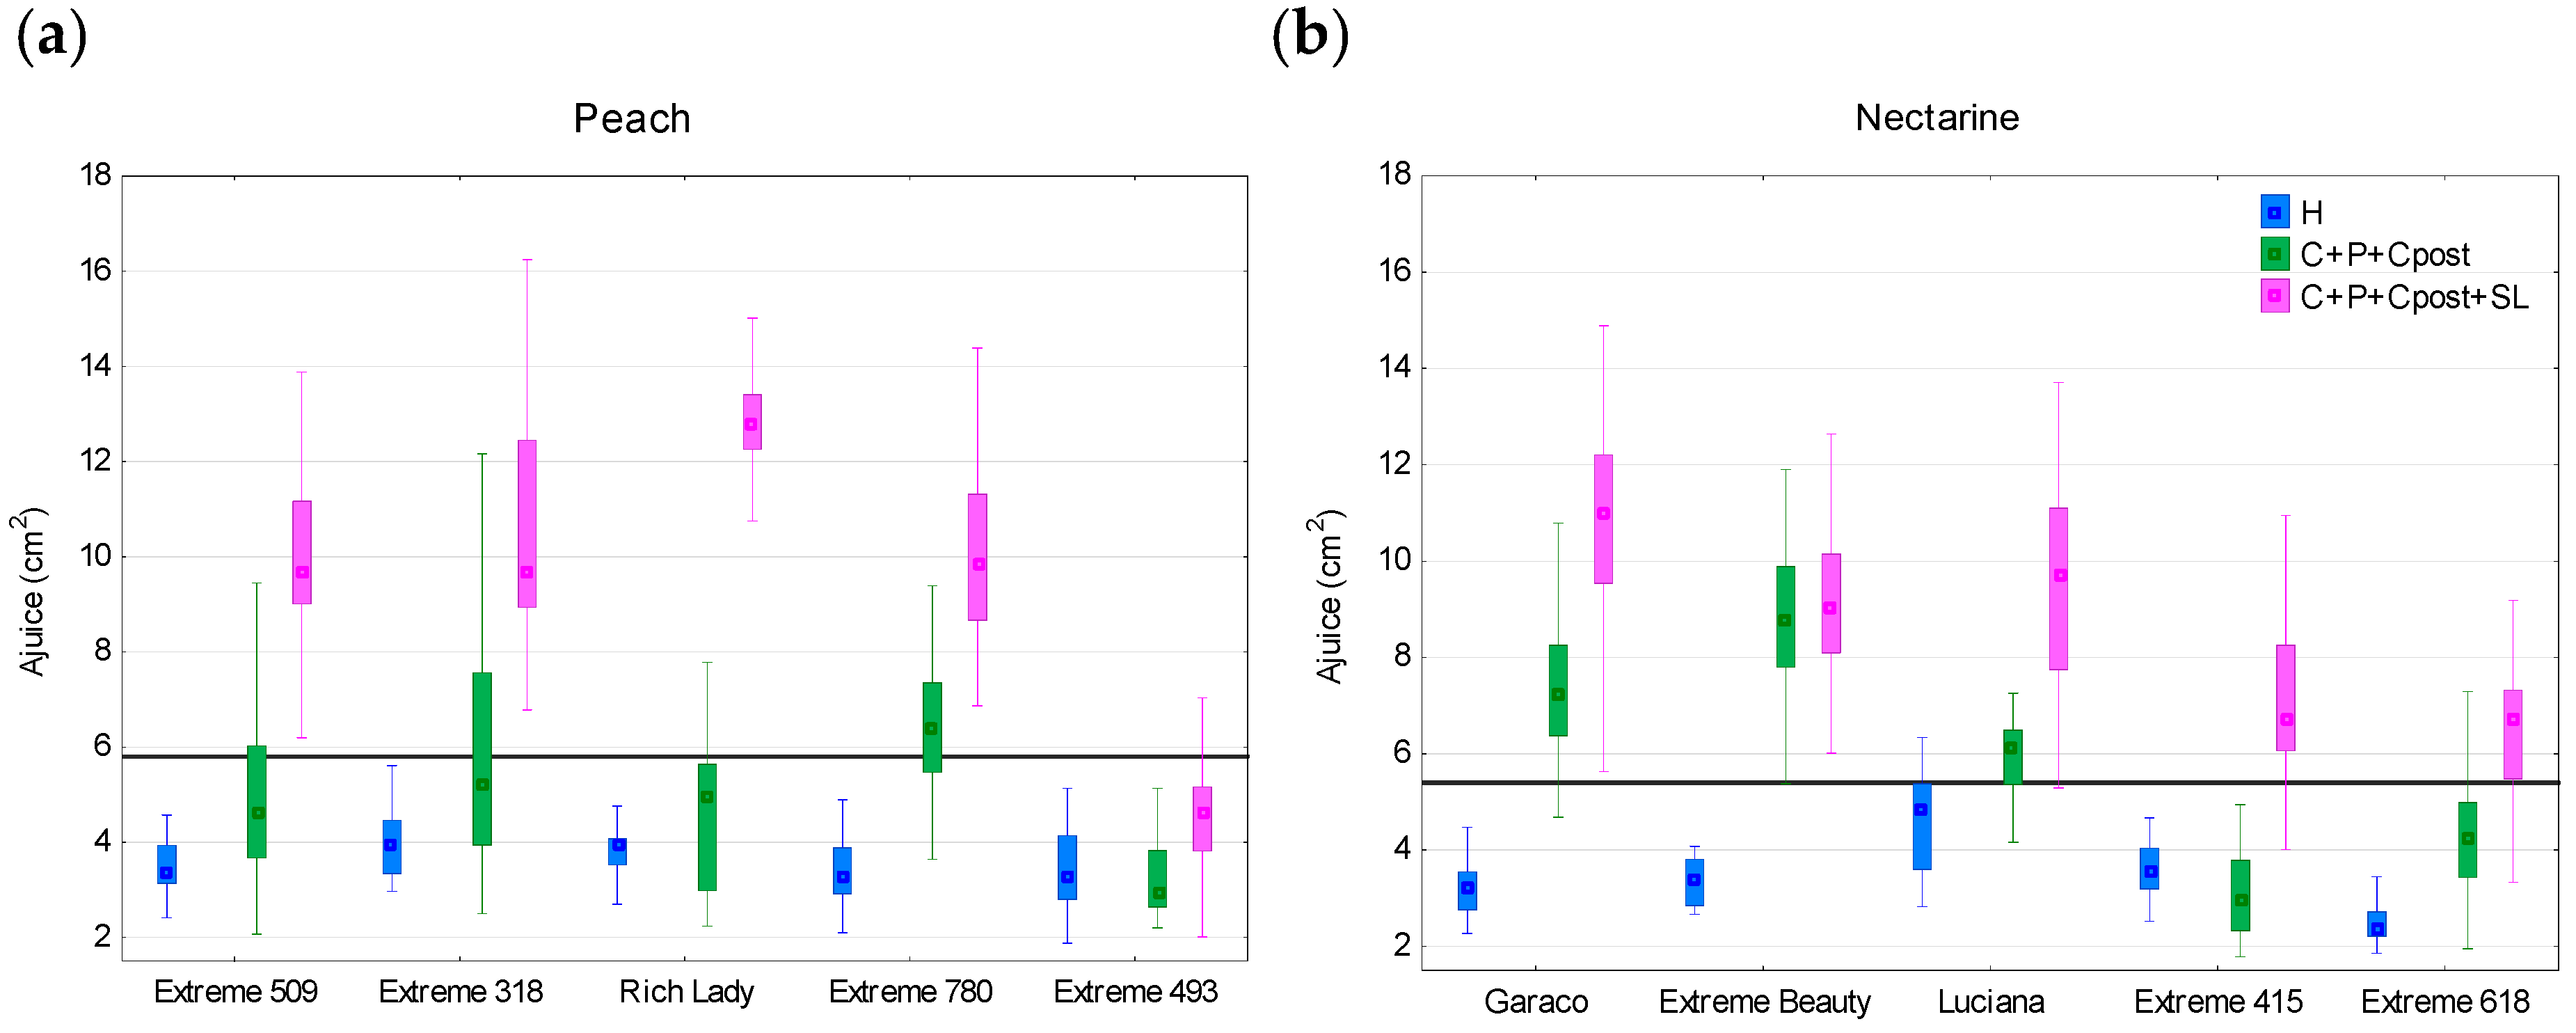
Figure 4 shows the box-and-whiskers plot (median, interquartile range, and maximum and minimum) of Ajuice variable for each variety categorized by postharvest protocols for peaches (
a) and nectarines (
b). It was observed that in the peach varieties the median of the population with the protocol C + P + Cpost (green box) was below the limit of 5.8 cm
2, except for the Extreme 780 variety (median value of 6.4 cm
2). However, in nectarines, three of the five varieties studied had a median value greater than the limit of 5.4 cm
2 after the same protocol. The Extreme Beauty variety showed very similar instrumental juiciness values after the C + P + Cpost protocol, as well as after the protocol that also included SL. The average increase in the value of the median of Ajuice after the pre-ripening protocol with respect to the initial values (blue box, H) was 36.14% in peaches and 73.7% in nectarines, while the Ajuice increased by 174.4% in peaches and 149.5% in nectarines after the period of shelf life. However, the behavior among the varieties was unequal; specifically, the late harvest varieties (harvest date in September) Extreme 493 and Extreme 618 barely showed increases in their Ajuice after the postharvest protocols. The evaluation of a high number of varieties and the application of different pre-ripening protocols allowed obtaining a wide range in the instrumental juiciness (
Figure 4), with values of medians from 1.9 to 16.2 cm
2 for peaches and from 1.9 to 14.9 cm
2 for nectarines.
3.4. NIR Estimation Models, Season 2019
This section includes only the data corresponding to the 2019 season in which the instrumental test for the determination of juiciness was more segregating for the low-juiciness fruits.
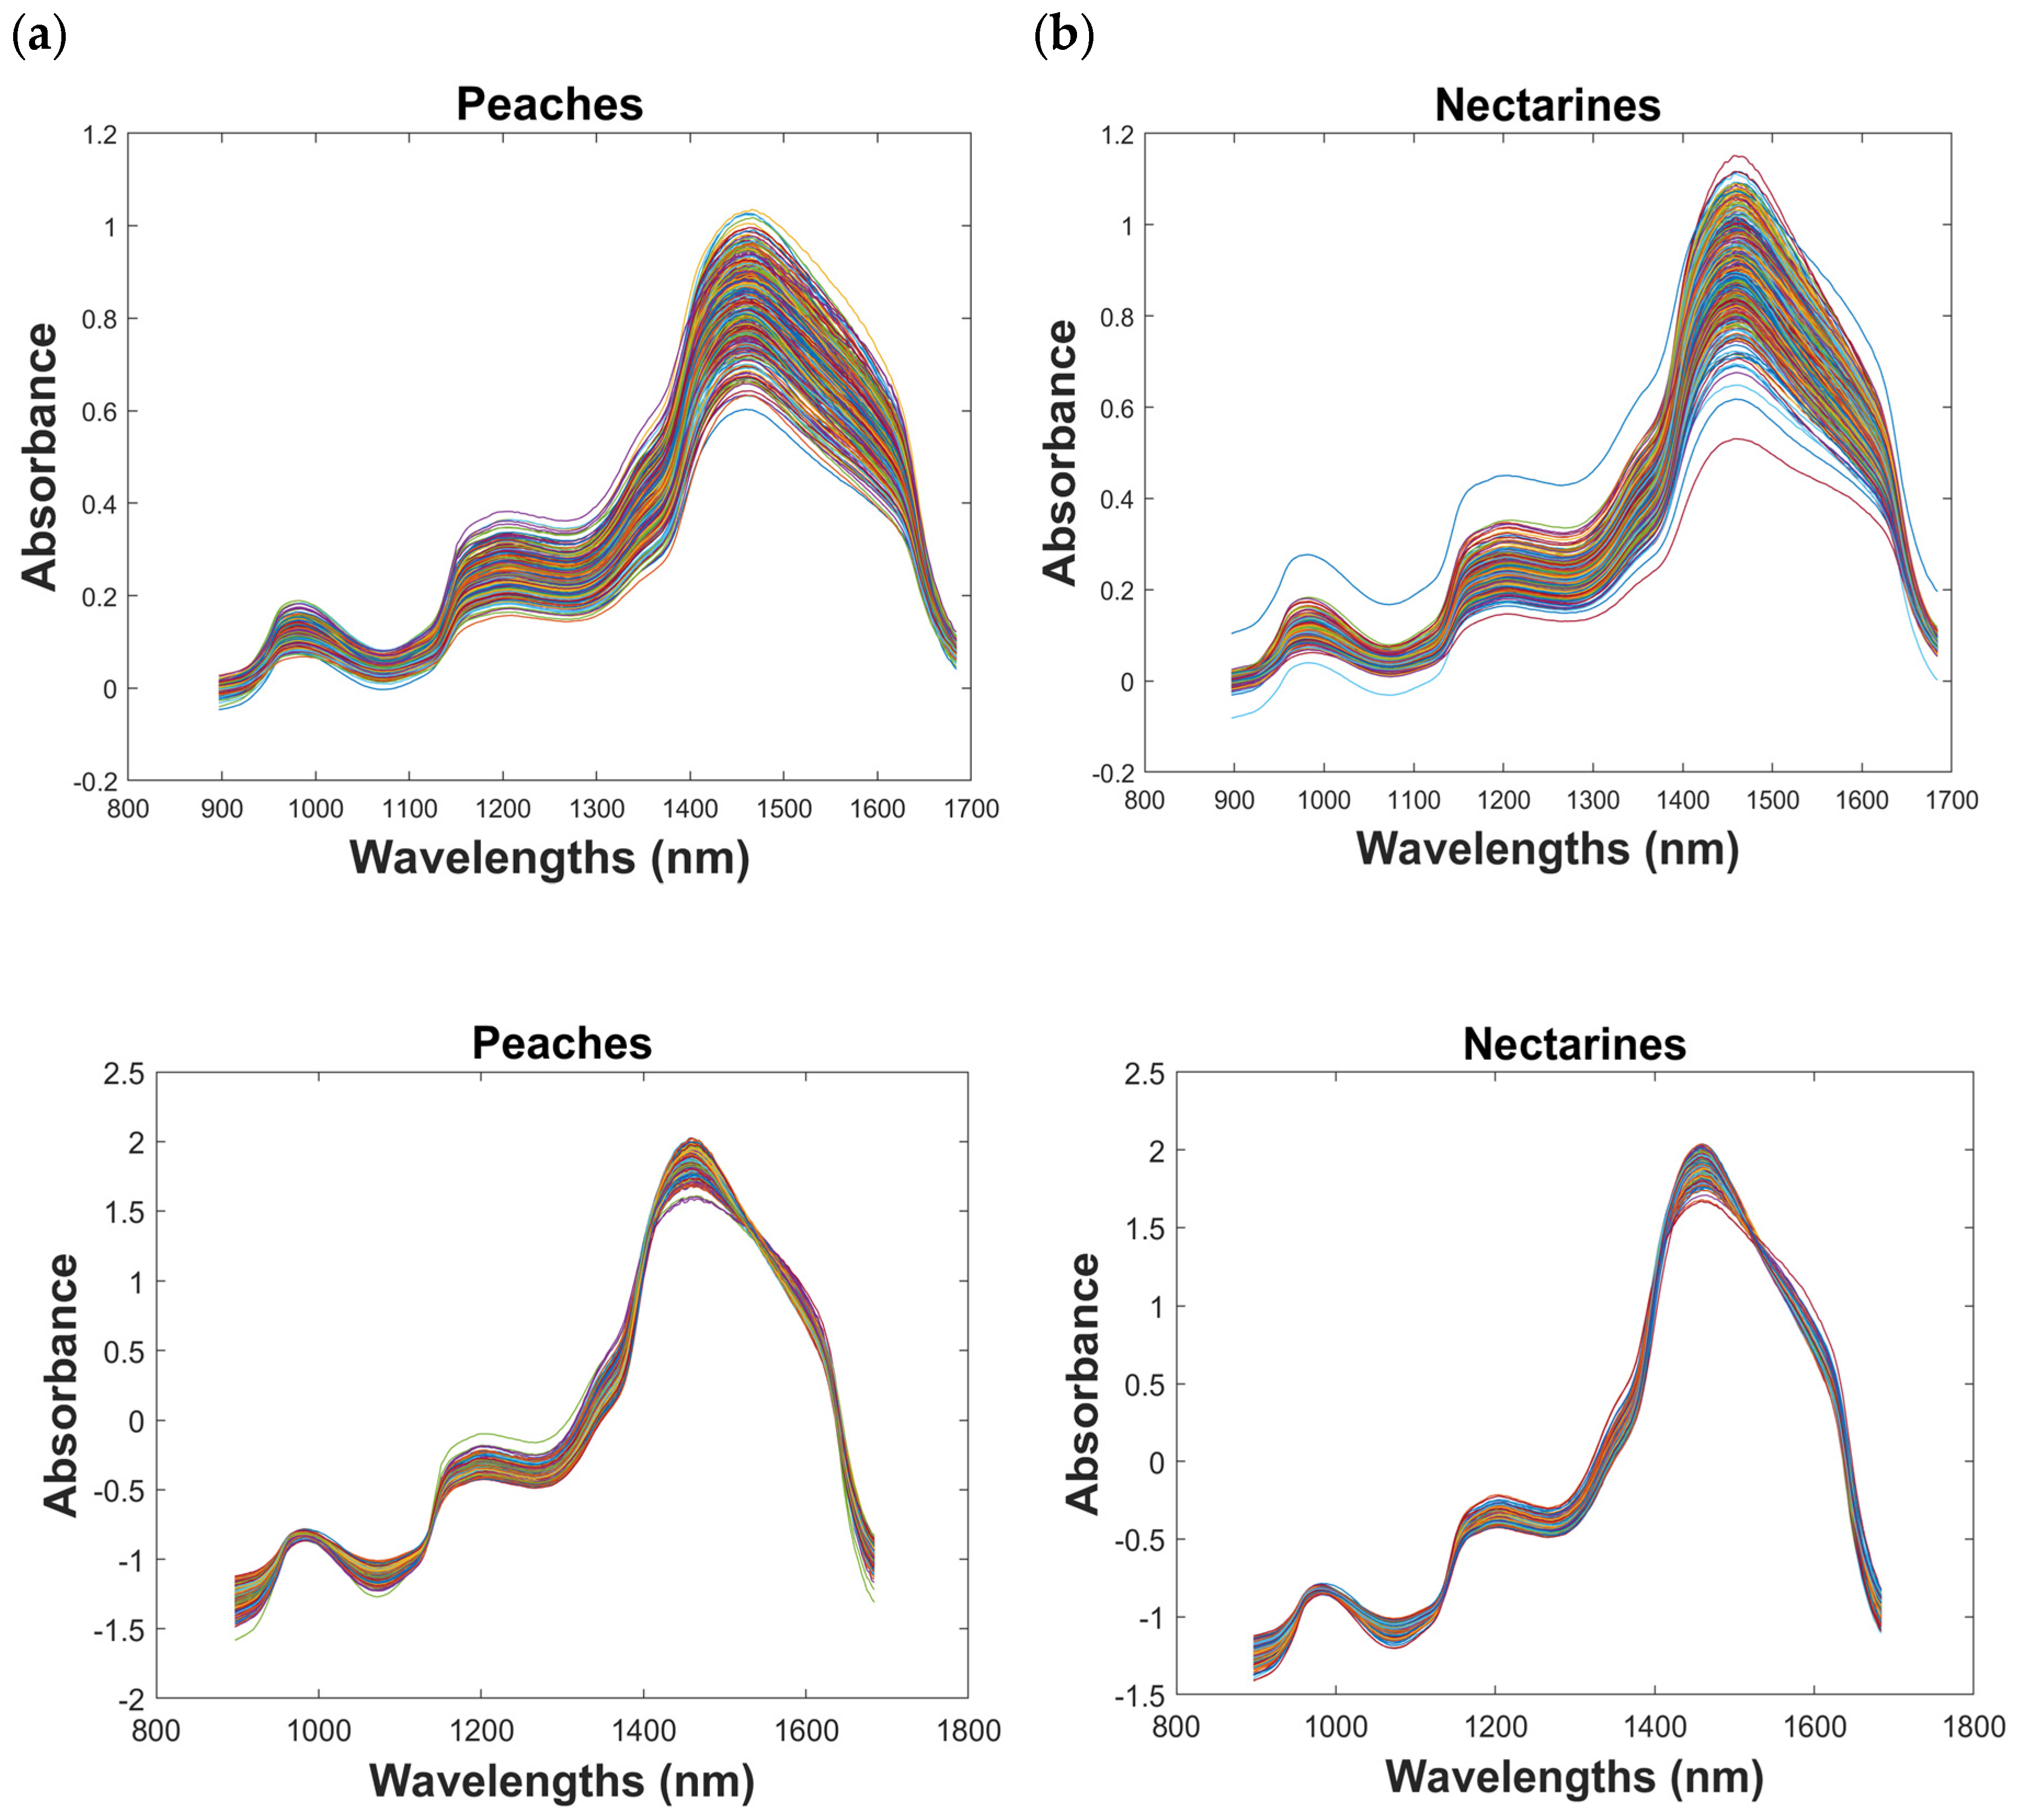
Figure 5 shows the absorbance spectra of (a) peaches and (b) nectarines without preprocessing (first row) and with application of SNV preprocessing (second row). In the non-preprocessed spectra, a greater dispersion was observed, especially between 1400 and 1500 nm, where the absorbance varied between 0.6 and 1. This variability in the intensity of the absorbance was reduced by applying SNV. The spectral pattern of these fruits was characterized by presenting the main absorption peaks around 975, 1194, and 1462 nm, in line with previous work on stone fruits [
22], showing a strong prevalence of the spectral signature of water, which is expected in biological systems with high water content (above 80%) [
23].
The multiple comparison test of acquisition times for the three categories of sensory juiciness showed that there were significant differences (p < 0.05) between the acquisition times of low- and medium-juiciness groups vs. the acquisition times of the high-juiciness group. This indicates that, as the fruits evolved toward greater juiciness, the acquisition times necessary for the spectra to reach a reflectance of at least 0.6 at their peak of greatest intensity increased (from an average value of 24 ms to an average value of 36 ms for the fruits of low and high juiciness, respectively).
Table 4 shows the coefficient of correlation (
r), standard error of calibration (SEC), standard error of cross-validation (SECV), ratio of prediction to deviation (RPD), number of latent variables (LV), and slope for each model estimating the instrumental juiciness. The best performances were obtained with raw spectra (without preprocessing) for both peaches and nectarines. The coefficients of correlation were 0.86 and 0.83 for peaches and nectarines, respectively; that is, the explained variances of the models were 74% and 69%, with SECV below 2 cm
2, and the RPD between 1.5 and 2, which could indicate that the model estimations were not very precise, and that the model could only segregate between high and low values [
24].
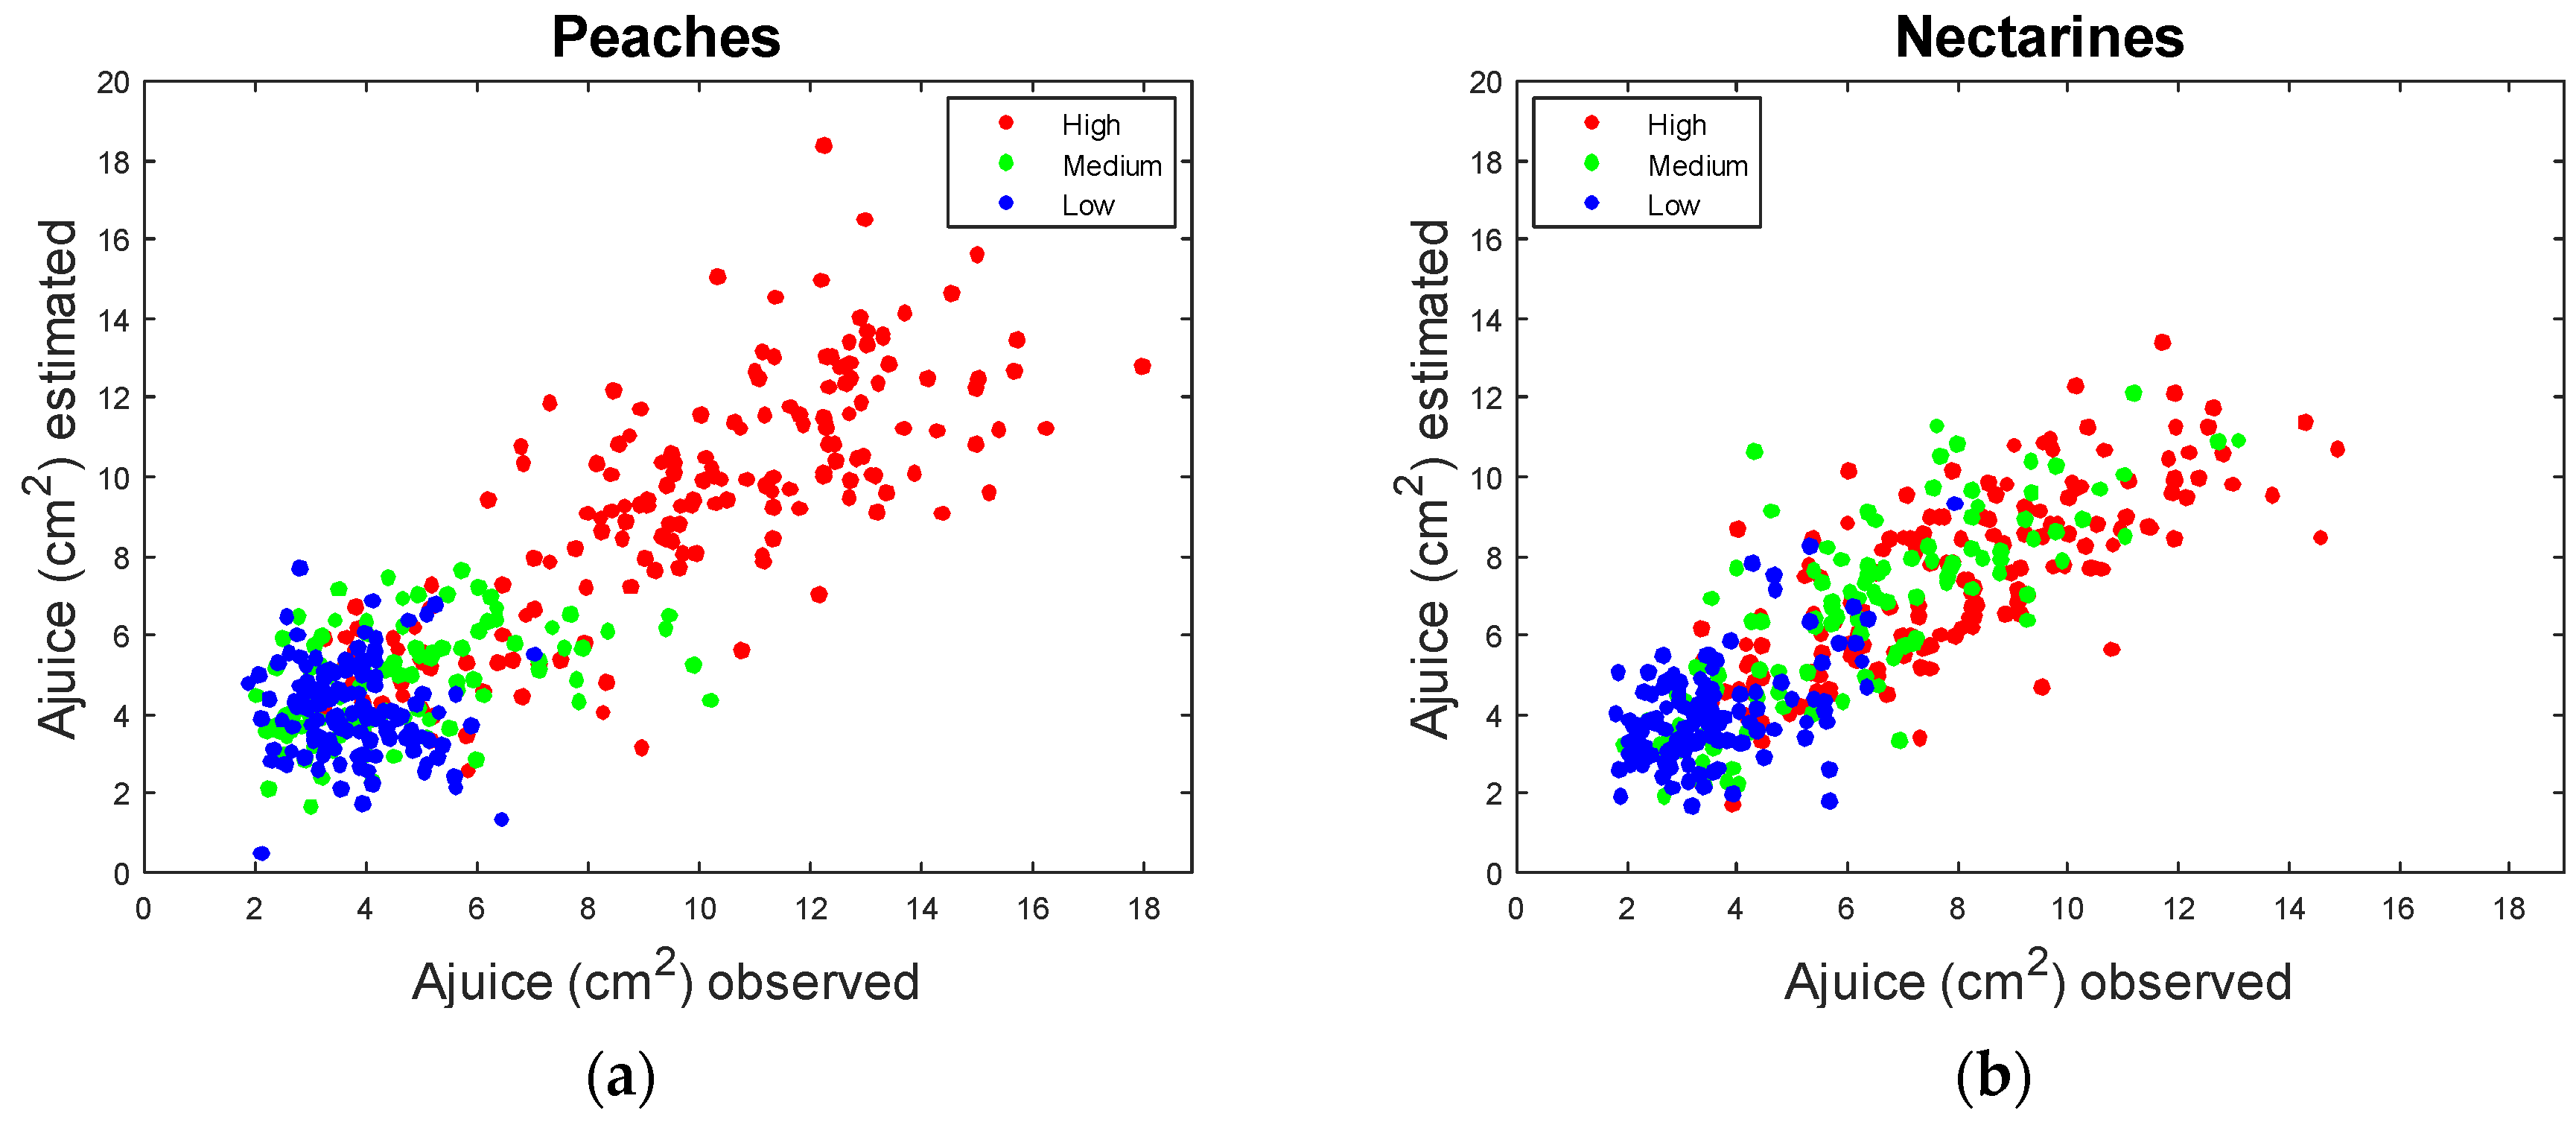
Figure 6 shows the scatterplots of instrumental juiciness (cm
2) observed vs. instrumental juiciness (cm
2) estimated by the NIR models. The three categories of sensory juiciness of fruits—high, medium, and low—are indicated by the colors of the points.
The percentage of peaches showing instrumental juiciness greater than 5.8 cm2 (Ajuice > 5.8 cm2) and that were estimated with values of Ajuice > 5.8 cm2 was 85%; fruits with correctly estimated Ajuice < 5.8 cm2 was 87%. For nectarines, taking 5.4 cm2 as the segregation value, the corresponding percentages of well-classified fruits were 87% and 86%, respectively.
4. Discussion
In the reviewed literature, no work was found in which the water content and instrumental and sensory juiciness of the same fruits were determined. In this work, the lack of correlation observed between the moisture content and the juiciness variables corroborates the assertion that the juiciness has more to do with the availability and state of the water in the fruits than with the
W% of water. The lack of juiciness is due to the retention of water by the cellular structures of the fruit [
18]. No correlation was found either between the soluble solid content and the juiciness and firmness variables of the fruits. Cano-Salazar et al. [
4] described that the perception of sweetness is influenced by the texture of the fruit. Thus, softer fruits that release more juice allow for a better appreciation of sweetness. These authors pointed out that there is a slight positive correlation between sensory juiciness and sensory sweetness (
r = 0.6); however, the PCA carried out in their work shows that the correlation of sensory juiciness with soluble solid content was much lower (they did not report the value of
r), similar to what was found in this article.
Regarding the negative correlation found between the juiciness variables and the firmness variable, Infante et al. [
10] found the same trend in the September Sun variety of peaches, observing that, especially in fruits subjected to a pre-ripening protocol, the softening of the fruits was accompanied by an increase in instrumental juiciness and sensory juiciness. Contador et al. [
25] achieved the same results in peaches and nectarines of different varieties from those considered in this study, confirming a negative correlation between sensory juiciness and the parameters that characterize the instrumental textural profile of the fruits (none of the two works provided the value of the correlation coefficient
r).
There are not many works in the literature that performed determinations of instrumental juiciness and sensory juiciness on the same fruit. Infante et al. [
16] carried out an estimation of instrumental juiciness by compressing samples of peach pulp (Elegant Lady, O’Henry, and Ross varieties) between two compression cylinders and collecting the juice extracted in an absorbent paper. In this work, they also evaluated the sensory juiciness of each of the samples. The comparison between instrumental juiciness and sensory juiciness showed correlation coefficients between 0.87 and 0.96, depending on the variety. Contador [
25] used the same method to determine instrumental juiciness in four varieties of peaches and nectarines. The projection of the variables in the PCA they performed showed the proximity between instrumental and sensory juiciness, indicating that there was some correlation between the two, although they did not provide the value of the correlation coefficient
r. The correlations reported by Infante et al. [
16] were similar to those found for peaches in the present work (
r = 0.82, 2019 season), in which a much larger population and all varieties were considered together. This would indicate that the method proposed in this work for the evaluation of instrumental juiciness has a potential application similar to that proposed by Reference [
16], with the advantage of being easier to implement at quality-control laboratories, using the same motorized penetrometer for this test as the one that can be used to carry out the standard Magness–Taylor test.
Despite the fact that visible (Vis)/NIR spectroscopy was extensively applied to stone fruit in the literature [
26], there are few references that focused specifically on assessing the juiciness of each fruit. Ortiz et al. [
17] focused their research on woolly peaches, that is, soft and non-juicy fruits, a type of physiopathy that was not present in the samples handled in the present work. Ortiz et al. reported low correlation coefficients between any variable related to juiciness and the corresponding estimate based on NIR spectroscopy; alternatively, they presented a discriminant model in three juiciness categories, obtaining a percentage of 72% of well-classified fruit, a performance slightly worse than that achieved in the present article. To explain the best results obtained when considering the NIR absorbance spectra without applying any preprocessing, the fact that juiciness is considered as a textural attribute can be used (Contador et al. [
25]). SNV is a common method in NIR spectroscopy applications to correct the effects of light scattering, a phenomenon in which the electromagnetic radiation is scattered by small particles, bubbles, droplets, microorganelles, cells, fibers, density fluctuations, etc. [
27]. During peach and nectarine ripening, these factors change. The evolution of pulp structure affects macroscopic properties such as rheological behavior, transport properties, and the distribution of gases and water, as well as their connectivity and mobility through the pores [
28]. In sound fruits, the cell-wall enzyme activity during ripening decreases adhesion between fruit cells and turgor, and increases the propensity of cells to rupture, which results in softer pulp. Zhou et al. [
12] described that, during ripening, juice is present in the cell-wall fracture surface, being easily extractable.
In many applications, the evolution of these factors implies an interfering variation not related to the property that is to be estimated; however, in our study, these structural changes during ripening seemed to contain information related to the texture and, consequently, to the juiciness. Therefore, although the spectral pattern of a fruit is strongly determined by its water content, the NIR spectrum without preprocessing contains information not only of the chemical composition but also of the physical configuration of the sample [
23]. A nondestructive procedure is, thus, offered that would allow for the categorization of peaches and nectarines according to their juiciness status throughout the different stages of their postharvest.


