Article

Estimating Soybean Radiation Use Efficiency Using a UAV in Iowa

1
Department of Plant Pathology and Microbiology, Iowa State University, Ames, IA 50011, USA
2
Department of Agronomy, Iowa State University, Ames, IA 50011, USA
*
Author to whom correspondence should be addressed.
Agronomy 2020, 10(12), 2002; https://doi.org/10.3390/agronomy10122002
Submission received: 19 November 2020 / Revised: 9 December 2020 / Accepted: 17 December 2020 / Published: 20 December 2020
(This article belongs to the Special Issue Remote Sensing in Agriculture)

Abstract

:
Radiation use efficiency (RUE) is difficult to estimate and unreasonable to perform on a small plot scale using traditional techniques. However, the increased availability of Unmanned Aerial Vehicles (UAVs) provides the ability to collect spatial and temporal data at high resolution and frequency, which has made a potential workaround. An experiment was completed in Iowa to (i) demonstrate RUE estimation of soybean [Glycine max (L.) Merr.] from reflectance data derived from consumer-grade UAV imagery and (ii) investigate the impact of foliar fungicides on RUE in Iowa. Some fungicides are promoted to have plant health benefits beyond disease protection, and changes in RUE may capture their effect. Frogeye leaf spot severity did not exceed 2%. RUE values ranged from 0.98 to 1.07 and 0.96 to 1.12 across the entire season and the period post-fungicide application, respectively, and fell within the range of previously published soybean RUE values. Plots treated with fluxapyroxad + pyraclostrobin had more canopy cover (p = 0.078) compared to the non-treated control 133 days after planting (DAP), but yields did not differ. A “greening effect” was detected at the end of the sample collection. RUE estimation using UAV imagery can be considered a viable option for the evaluation of management techniques on a small plot scale. Since it is directly related to yield, RUE could be an appropriate parameter to elucidate the impact of plant diseases and other stresses on yield.

1. Introduction

Radiation use efficiency (RUE), also known as light use efficiency (LUE), is defined as the plant’s ability to convert photosynthetically active radiation (PAR) into biomass on a per unit basis [1]. This measurement of photosynthetic performance is important for crop growth modeling [2]. RUE varies between species and even among cultivars, but generally, cultivar-dependent RUE values are unavailable [3].
There is no uniform procedure for RUE estimation. Of the three commonly used methods to estimate RUE (i) from incoming radiation (RUEinc), (ii) total absorbed light (RUEtotal), and (iii) radiation absorbed by photosynthetically active vegetation (RUEgreen) [4], Tewes and Schellberg [5] made the case to have RUEgreen (Equation (1)) be the standard method. By only considering the photosynthetically active vegetation to determine the fraction of absorbed photosynthetically active radiation (fAPARgreen) (Equation (2)), RUE estimation becomes sensitive to the changes of the photosynthetically active radiation (PAR) absorption through the reproductive stages, senescence, and potentially to disease.
RUE green = DM fAPAR green × PAP inc
fAPAR green = fAPAR × ( GLAI TLAI )
RUE estimation uses in-field sensors and destructive sampling to acquire the needed components consisting of incoming radiation, reflectance data, total leaf area index (TLAI), green leaf area index (GLAI), and dry matter (DM). Sensors are placed below the canopy facing the soil for PARsoil, above the canopy facing down to gather reflectance (PARout), above the canopy facing up for PARinc, and beneath the canopy facing up to determine the PAR passing through the canopy (PARtrans). This cumbersome method makes RUE estimation on a small plot scale with various treatments unreasonable. However, applications involving Unmanned Aerial Vehicles (UAV) provides a potential workaround. Tewes and Schellberg [5] demonstrated the derivation of reflectance (PARout) for estimation of RUE in corn (Zea mays, L.) using a UAV and a consumer-grade camera. Their RUE estimations were similar to previously published values for maize [5].
Soybean (Glycine max L.) RUE values range from 0.60 to 2.53 g Mj−1 [6,7] (Table 1). RUE values are assumed to be constant. However, Gitelson et al. [8] describe facultative and constitutive changes that result in diurnal and seasonal fluctuations of RUEgreen [9]. For example, soybean plants experience stress from diseases or disorders during the growing season, which may negatively affect RUE values.
Foliar disease would be considered a constitutive property since disease development may be relatively slow and irreversible. Foliar diseases such as soybean rust (SBR) and frogeye leafspot (FLS) caused by the pathogens Phakopsora pachyrhizi Syd. and Cercospora sojina Hara, respectively, reduce green leaf area. The severity of the foliar disease often increases over the growing season. Specifically, Kumudini et al. [16] showed biomass reductions were correlated to the reduction of photosynthetically active radiation (APAR) and the RUE of non-lesion green LAI caused by SBR lesions. With respect to disease severity, the lesion area of the foliar pathogen SBR reduced APAR between 5% and 20% [16].
The use of foliar fungicides has increased since 2005 in soybean to manage foliar diseases [17]. In addition, the quinone outside inhibitor (QoI) containing fungicides have been promoted to have plant health benefits in the absence of disease, called the “greening effect” [17,18,19]. This phenomenon is described as improved photosynthetic efficiency by maintaining green leaf area to allow for additional dry matter accumulation, resulting in increased yields [20,21,22]. However, yield benefits have been inconsistent [22,23,24]. Conversely, Phillips et al. [25] cautioned that prophylactic applications of QoI fungicides increased the likelihood of developing green stem disorder (GSD).
With new technology, soybean RUE may be estimated using remote sensing. The efficient estimation may encourage the incorporation of RUE into soybean small plot research, improvements of yield models, and to evaluate the usefulness of in-season management practices. The objectives of this study were to: (i) demonstrate RUE estimation of soybean from reflectance data derived from consumer-grade UAV imagery and (ii) investigate the impact of foliar fungicides on RUE in Iowa.

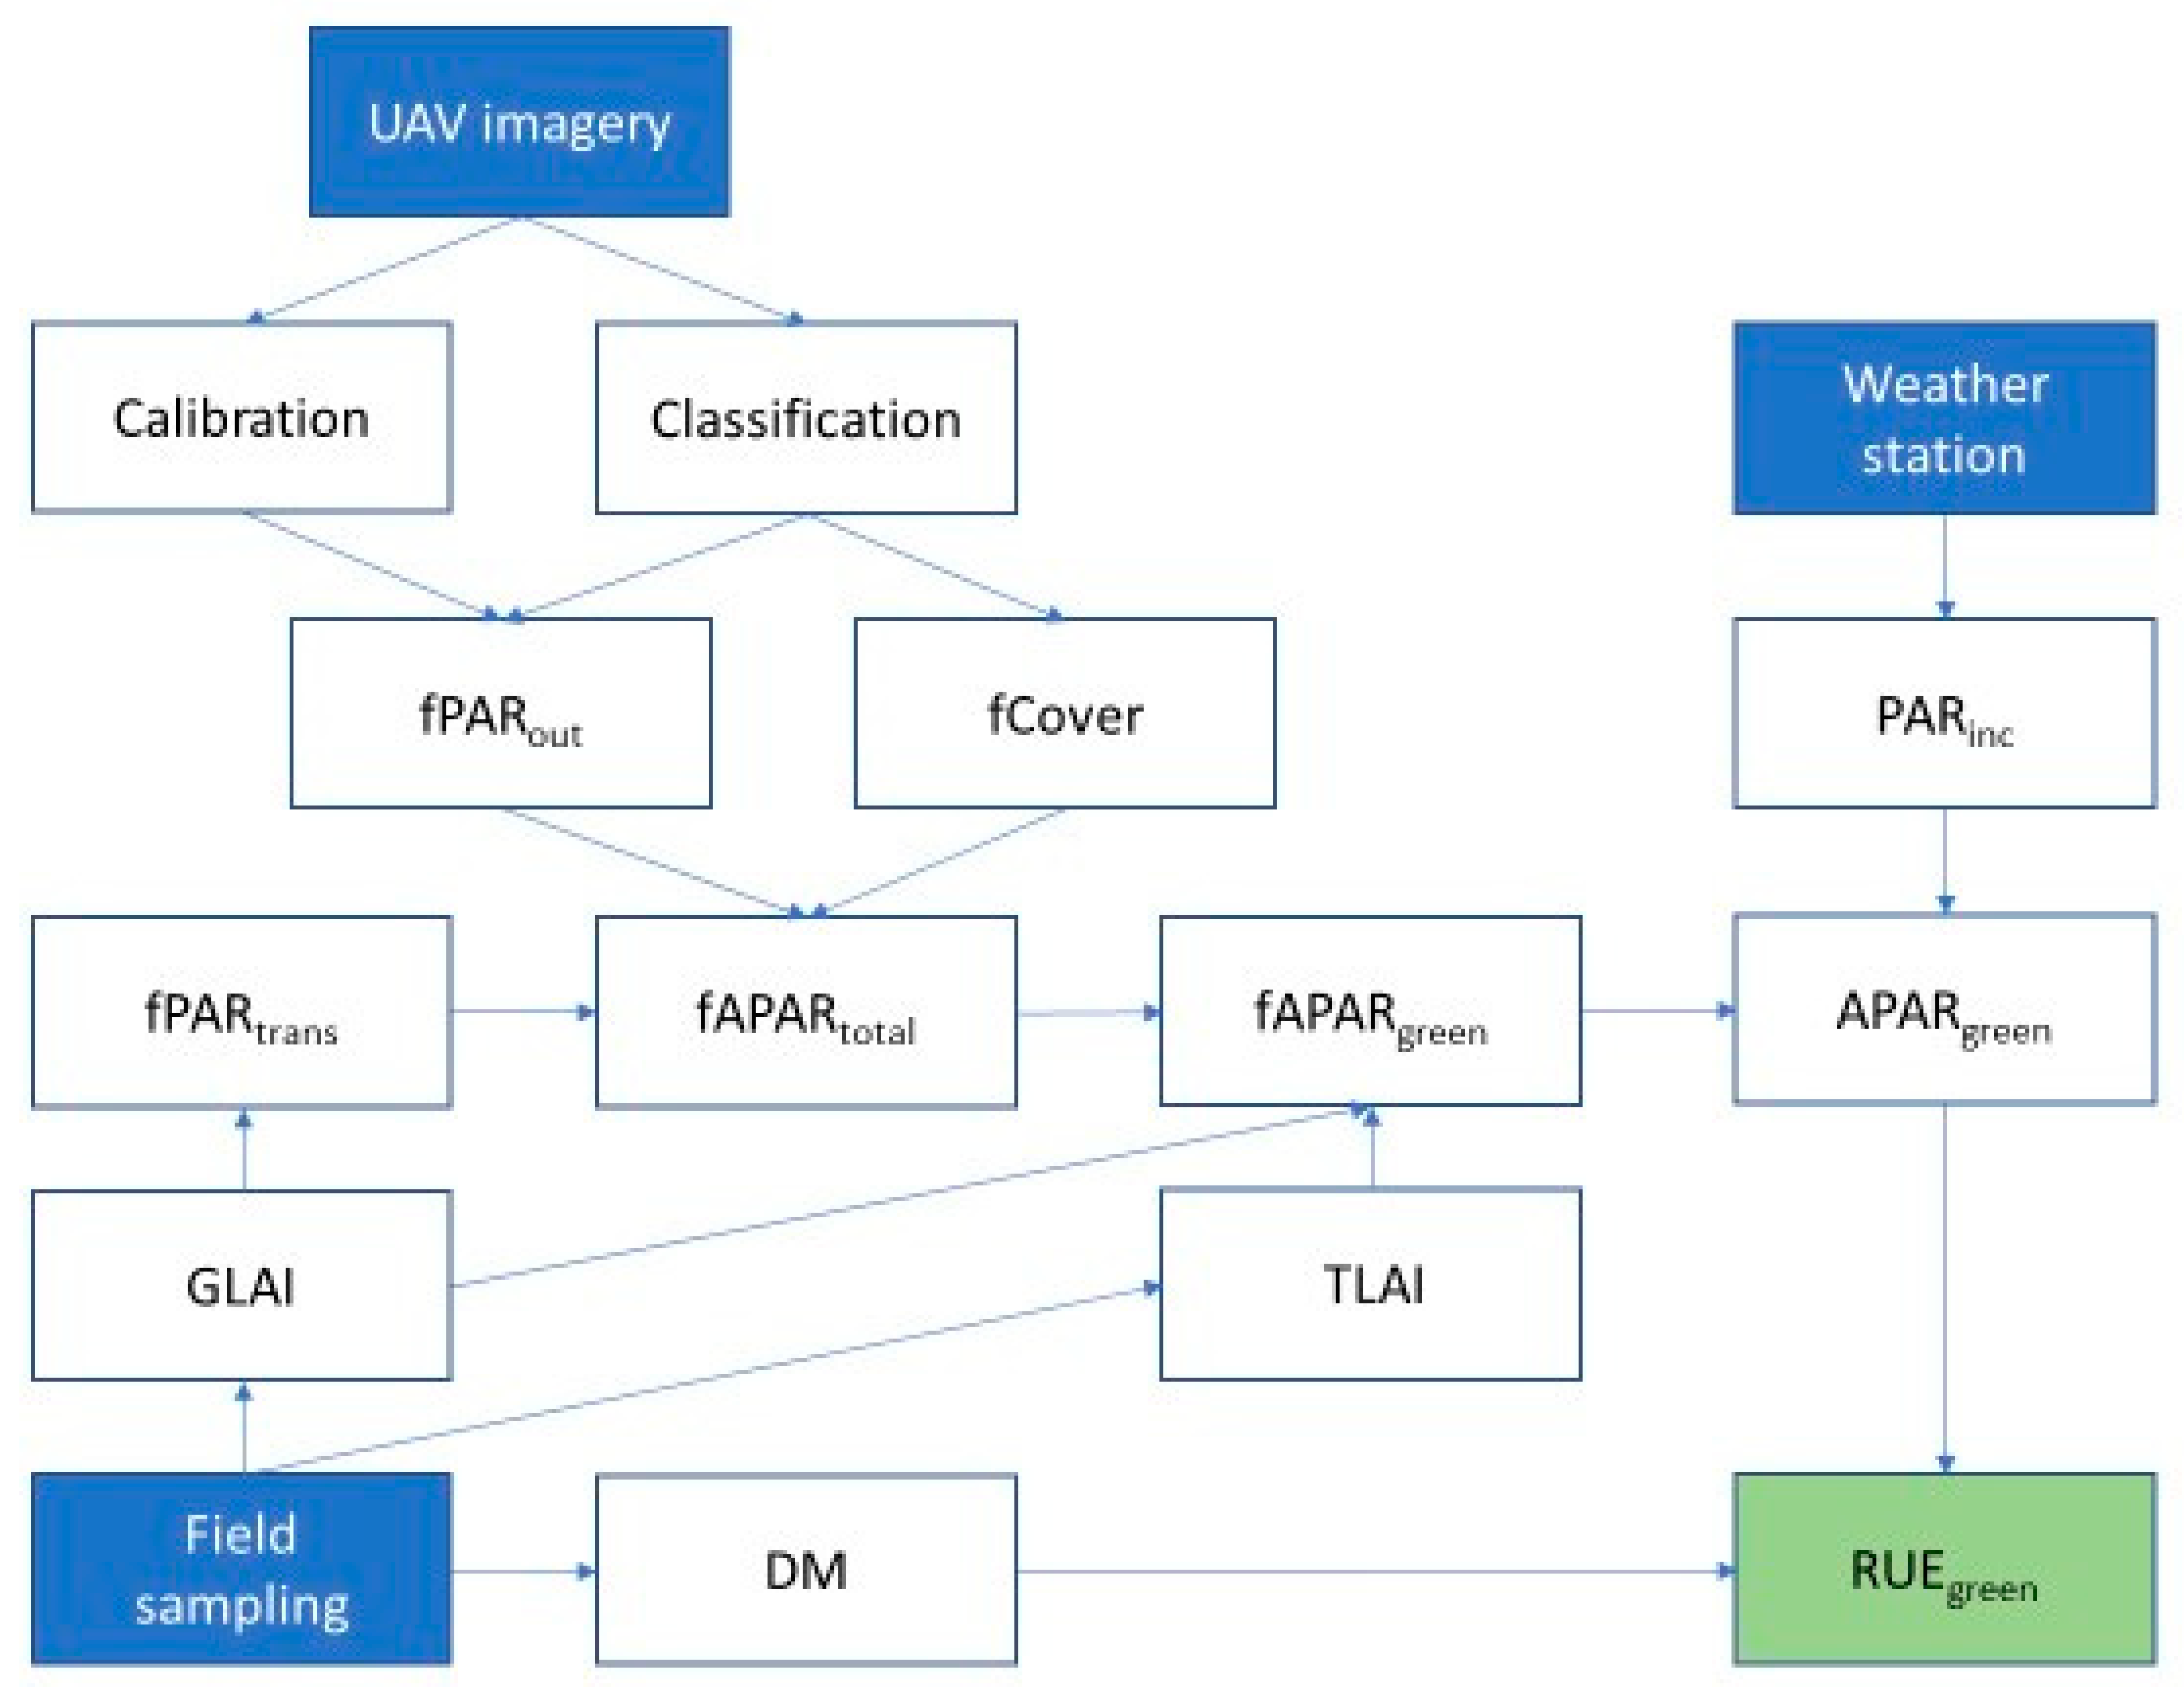
2. Materials and Methods
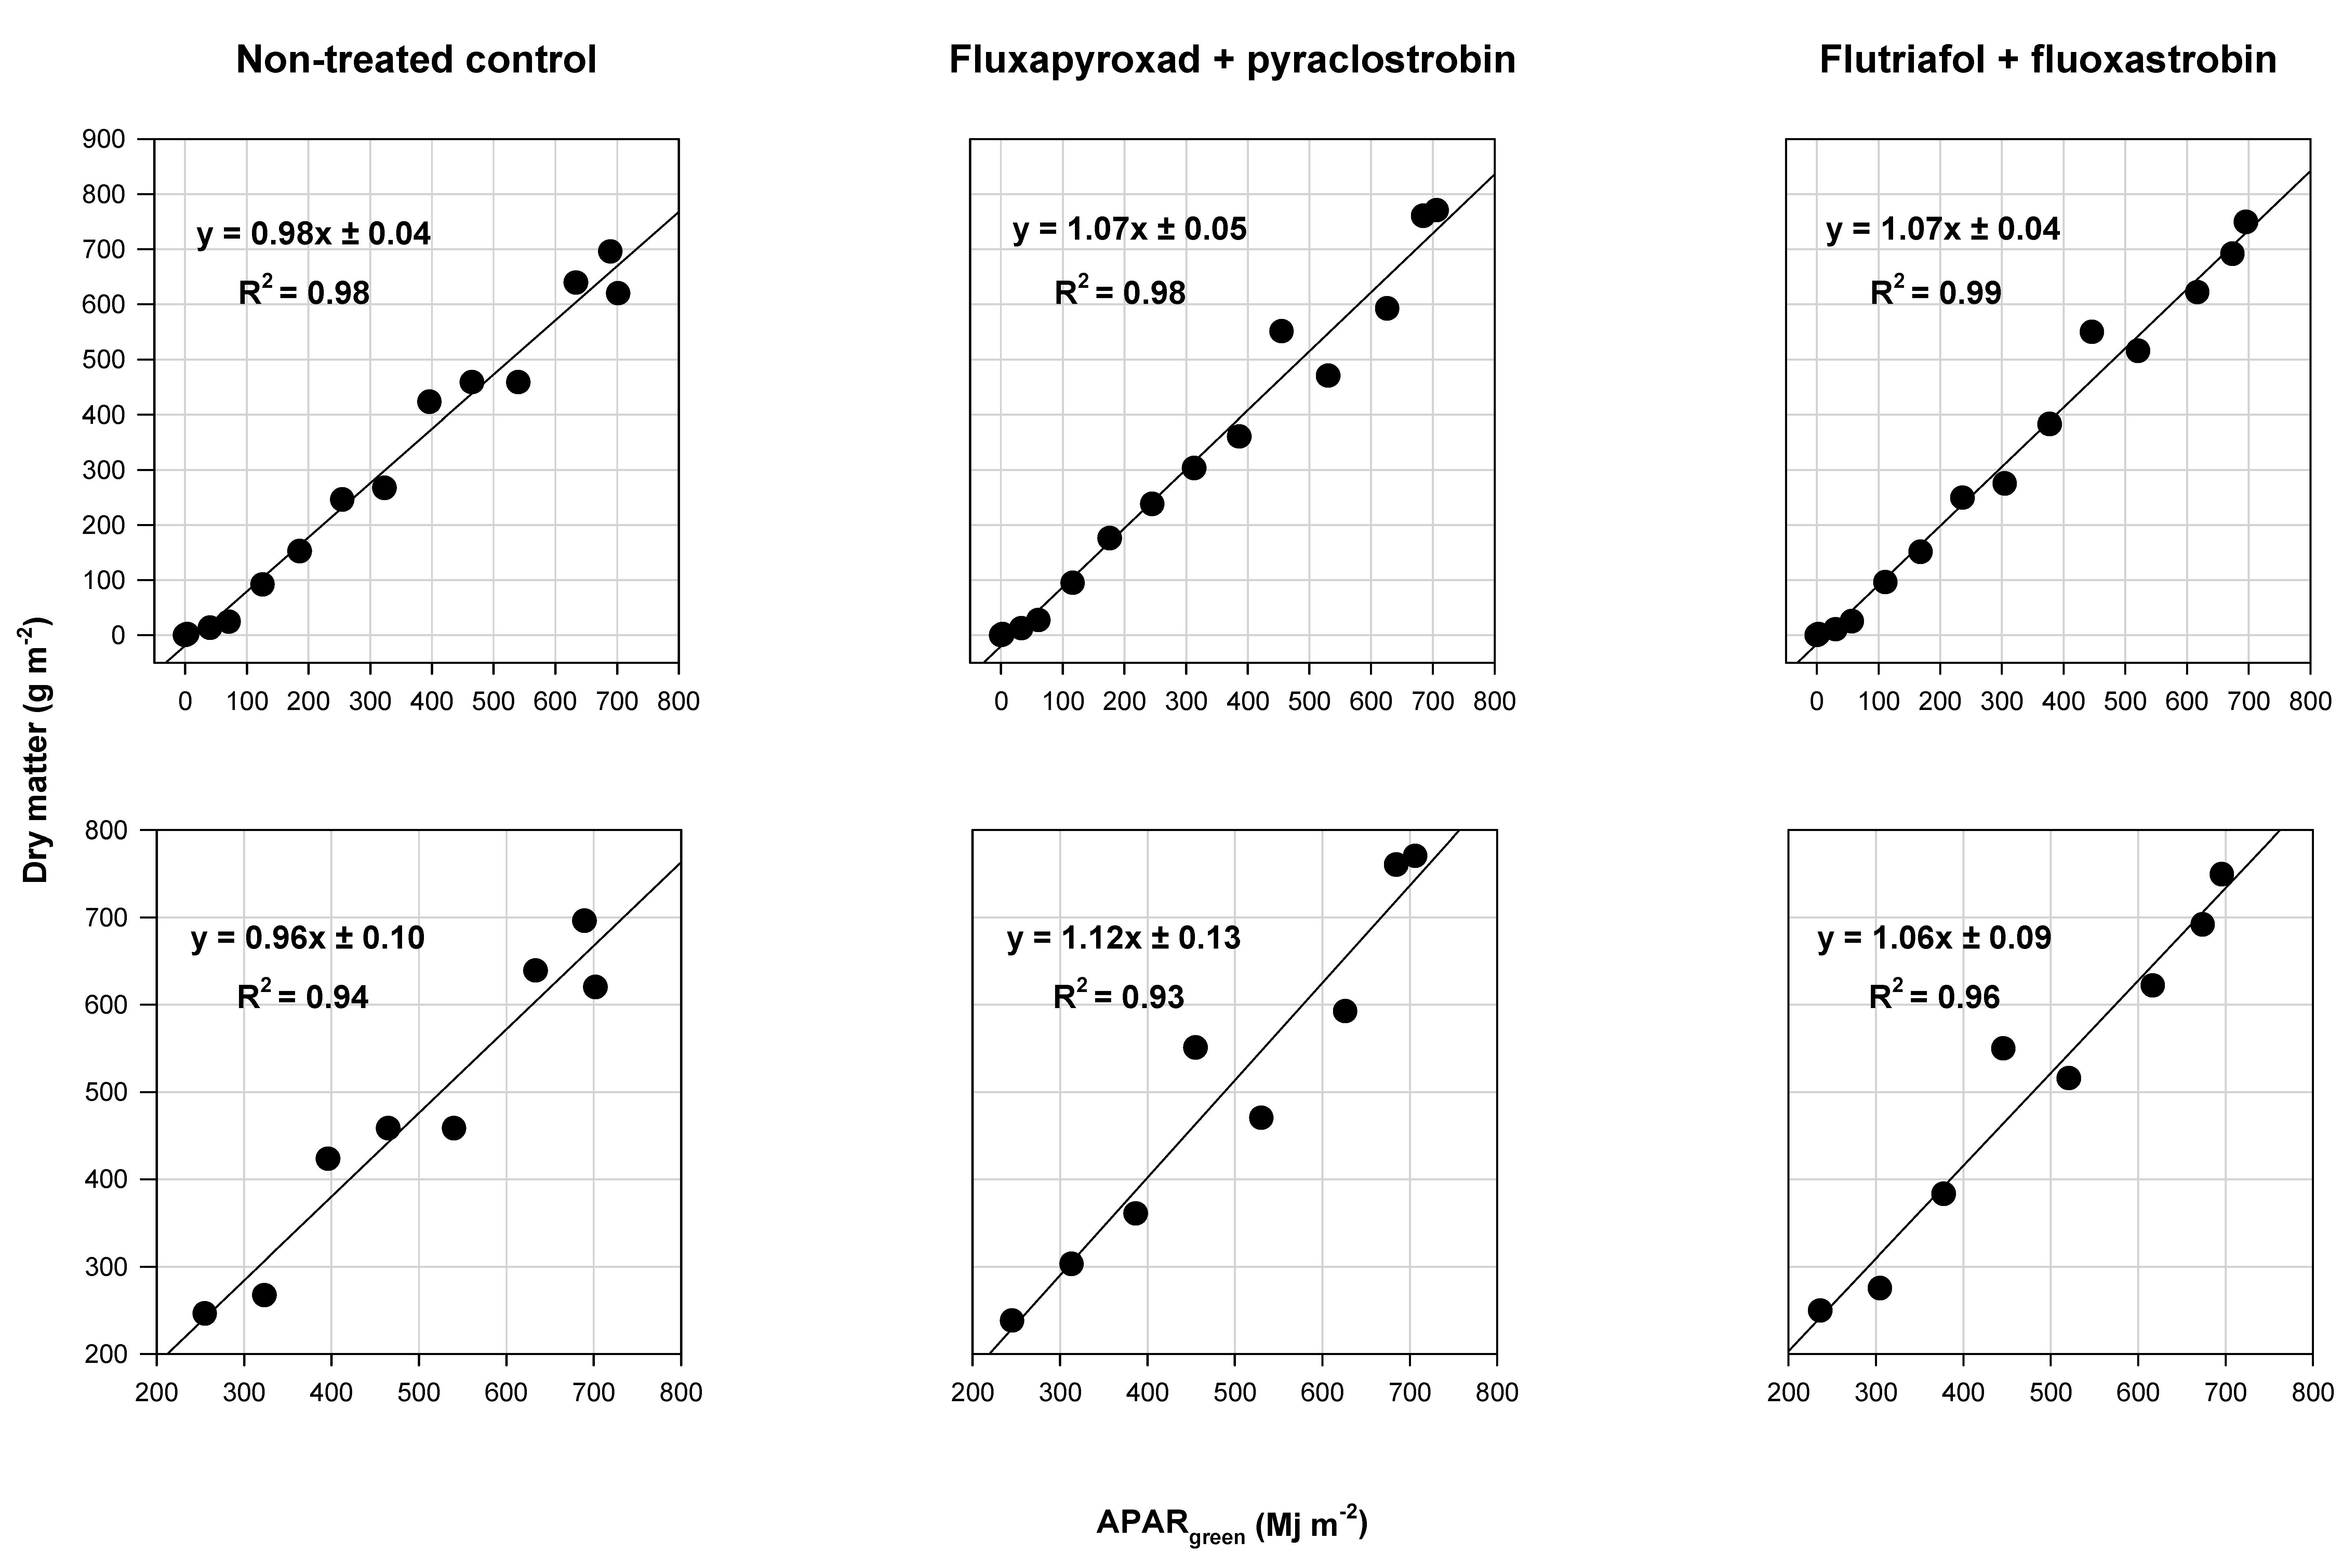
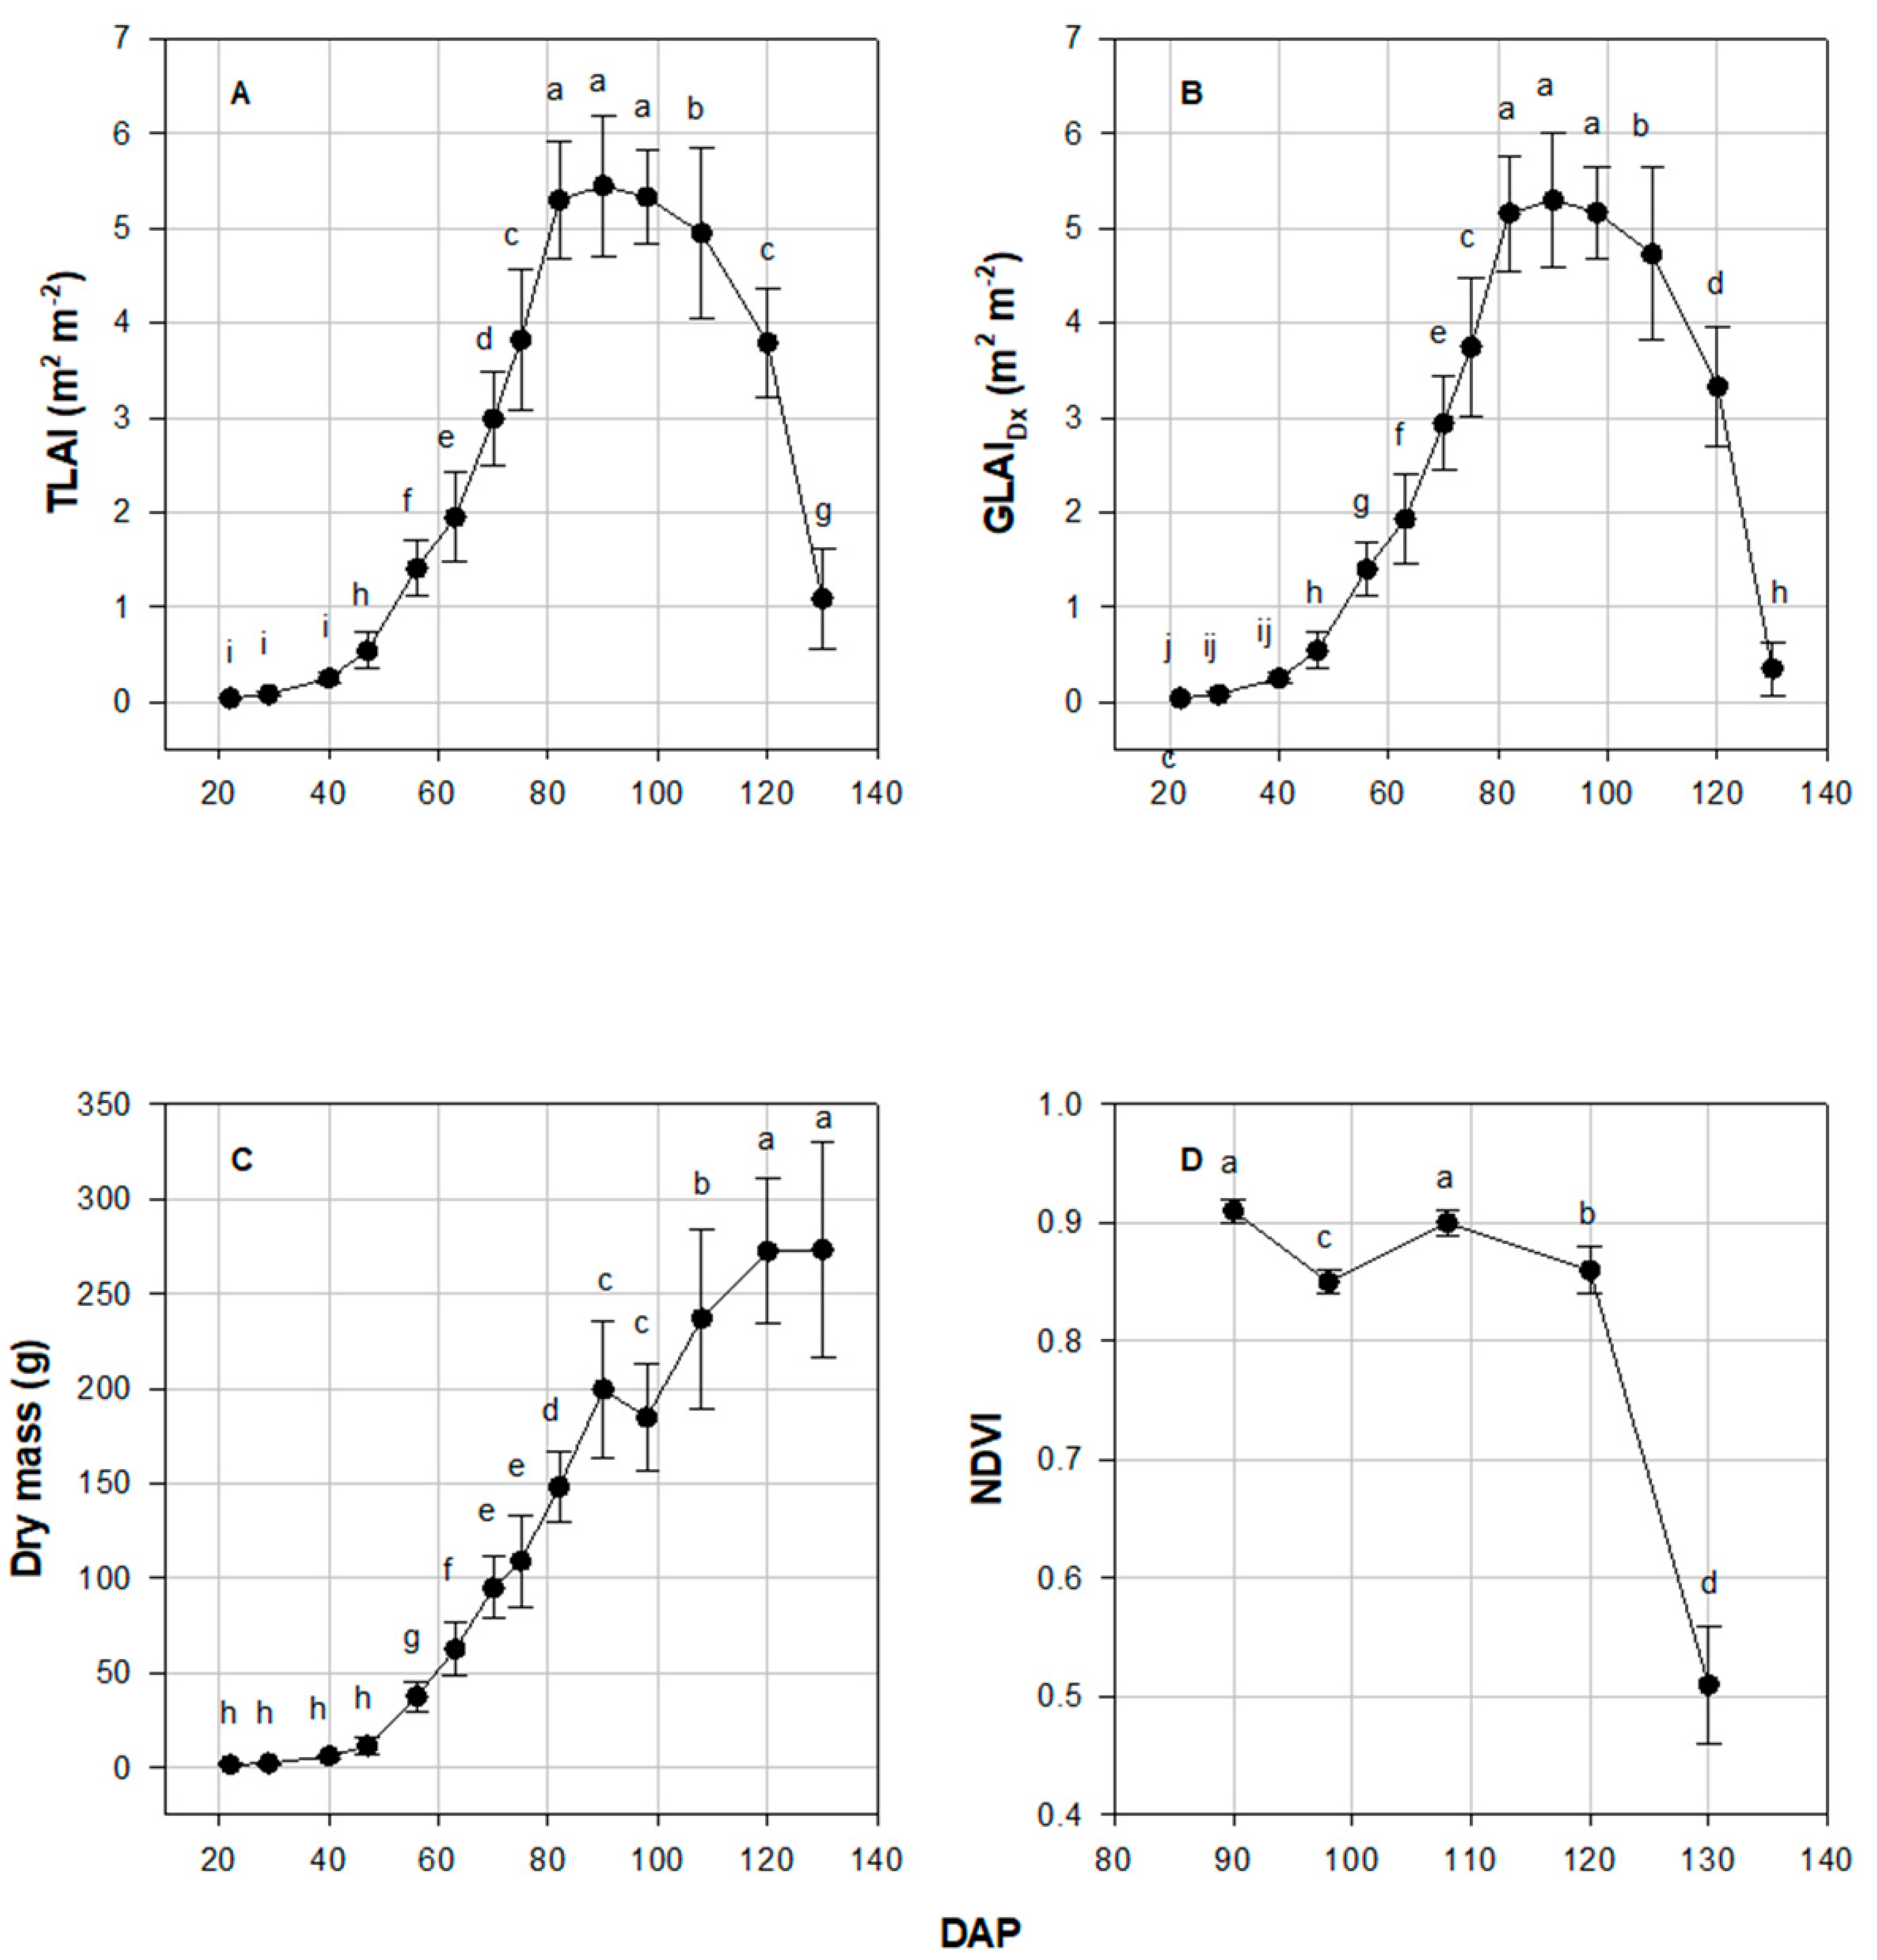
Soybean cultivar NK S29-K3X was planted near Kanawha, IA on 16 May 2019 at a rate of 395,362 seeds ha−1 in eight row plots that were 7.8-m long and spaced 76-cm apart (Table 2). Location soil type was Nicollet clay loam with a slope of 1 to 3 percent. Three fungicide treatments were organized in a randomized complete block design (RCBD) with six replications. The three treatments were (1) non-treated control, (2) fluxapyroxad + pyraclostrobin (Priaxor©, 0.05-L ha−1, BASF, Research Triangle Park, NC), and (3) flutriafol + fluoxastrobin (Preemptor©, 0.06-L ha−1, FMC Agricultural Solutions, Philadelphia, PA, USA). Pyraclostrobin and fluxastrobin are QoI (FRAC code 11) fungicides, while fluxapyroxad is a succinate dehydrogenase inhibitor (SDHI; FRAC code 7) and flutriafol is a demethylation inhibitor (DMI; FRAC code 3) fungicide. Fungicides were applied 67 days after planting at the R3 growth stage, beginning pod [26], with a self-propelled research sprayer powered by a CO2 tank that delivered fungicides using XR 11002 nozzles at 142 to 189 L ha–1 at 241 kpa. The middle two rows of each plot were harvested on 29 October 2019 to assess yield using a 2009 Almaco SPC20 research plot combine (ALMACO, Nevada, IA, USA). Yield calculations were adjusted to 13% seed moisture.
Field data were collected every 6 to 11 days from the VC through R7.5 growth stage (22–130 days after planting) [26] for a total of 14 sampling dates. At each sampling date (SD), a single 0.5-m section from one of the three outermost rows was examined. To avoid edge effects, this sampling section was kept 0.5-m from row ends and previously sampled sections [27]. From this portion of the row, total plant count, disease severity, leaf area, and dry mass data were obtained. FLS severity was determined from the upper and lower canopies of all plants and averaged for each experimental unit, a single plot. Leaf area and DM measurements were derived from a maximum of 10 plants cut at the soil line and bundled together. After cutting, plant bundles were stored in labeled plastic bags at 4 °C until further processing 2 to 10 days later.
The leaf area of the measured section of the row was determined using an LI-3100C (LI-COR, Inc., Lincoln, NE, USA). All leaves were stripped from the collected plants and separated into two groups, green and non-green (>50% non-green for any reason). A single leaf area value, consisting of the sum area of all leaves, was assigned to each green and non-green group. This partitioning allowed us to collect GreenLAI (GLAI) and YellowLAI (YLAI) values to be used in the APAR equation.
Leaf area was converted to m2 and used to estimate leaf area index (LAI; m2 m−2) based on the number of plants sampled and the number of plants in the sampled area [28]. All above-ground plant parts from each plot were dried for seven days in brown paper bags placed in drying bins with fans at 60 °C [25]. Dried samples were weighed in bags and adjusted to exclude bag weight to obtain dry matter of the entire plant including seeds (DM; Taylor Precision Products, Oak Brook, IL, Glass Digital Food Scale, model: 3842BL9).
True color aerial imagery was obtained during each collection date using a Phantom 4 ProV2.0 (DJI, Shenzhen, China), a UAV, with an onboard 2.54-cm CMOS 20 MP camera. Individual plot images were taken for the first four sampling dates at an above-ground altitude (AGL) of 9-m. Mission planning and image stitching of the remaining 10 sampling dates were completed through service acquired from DroneDeploy (DroneDeploy, San Francisco, CA, USA). The 14 min flight plan was consistent across sampling dates 9-m above ground altitude (AGL), with 75% overlap, and a flight speed of 3-m s−1. Images (~670) were uploaded to and stitched together by DroneDeploy. The resulting orthomosaic had a resolution of 0.69-cm/px and was exported as a geotiff for image processing in ArcGIS (ArcGIS Pro 2.4.2, Esri, Redlands, CA, USA).
Three 1.2-m portable fabric targets (Group 8 Technology, Inc., Provo, UT, USA) with reflectance values of approximately 3%, 13%, and 56% were placed at the field edge during each flight for calibration from digital number (DN) to reflectance (Table 3). The DN’s of each target of all three bands were extracted and averaged for each sampling date. The empirical line method [29] was used for calibration. However, since the raw target DN vs. reflectance plot showed an exponential relationship, a natural logarithm transformation of the reflectance values for the calibration targets was performed to obtain a linear relationship [30]. A line of best fit was added to the scatter plot and the resulting linear regression equation was used to convert the DNs of each band to -ln(reflectance) (Table S1). This was then converted to reflectance using the exponential term [30].
In ArcGIS (ArcGIS Pro 2.4.2), the three-band orthomosaics were converted into a single raster layer using the raster calculator and the excess green (ExG) index [31]. The resulting raster was examined manually to identify a threshold value to separate foliage from the background [32]. Using the manually identified threshold value, the raster was binarized into “foliage” and “other”. The “foliage” class contained both yellow and green soybean foliage. The “other” class contained bare soil, undecipherable shadowed area, and residue. Only the inner two rows used for yield were used in the image analysis. The binary raster was used as a mask to extract only the DNs of the “foliage” class from the three collected bands (red, green, and blue) of the respective images and orthomosaics. The fraction of foliar cover (fCover) was determined by extracting the sum of the areas of each class and determining the percent of the “foliar” class with respect to the combined total area. Plot summaries containing average DNs of each band were exported to Microsoft Excel after image processing (Figure 1).
The fAPARgreen and fAPARtotal values were calculated using Equations (2) and (3), as described by Tewes and Schellberg [5] with the exception of excluding fPARsoil from the calculations [33,34]. fPARtrans was estimated using the Lambert–Beer law equation using an extinction coefficient (k) of 0.523 [35] based on crop and row spacing. PARinc was determined by taking the total incoming solar radiation collected from a weather station near the experiment location and multiplying it by 0.5 [36]. It was assumed that the RGB camera collected bands within the range of photosynthetically active radiation (PAR; 400–700-nm). The definite integral of the running total of PAR during the growing season vs. fAPARgreen was then plotted against the DM [5]. RUE was determined from the slope value obtained by the regression equation from the plot of the sum of DM vs. the sum of APARgreen.
fAPAR total = ( 100 % fPAR out   fPAR trans ) × fCover
Disease severity ratings taken during each destructive sample date were removed from the GLAI by converting the severity rating to a 0–1 scale and multiplying this by the GLAI value (Equation (4)) [16,37]. This reduced only the GLAI by the observed percent of disease severity to result in GLAIDx. A handheld GreenSeeker (Trimble, Sunnyvale, CA, USA) was used to collect Normalized Difference Vegetation Index (NDVI) values. Values were collected on the last four sampling dates to avoid soil background noise early in the season and value saturation during full canopy. A yield row was walked with the GreenSeeker and NDVI values were recorded beginning and ending approximately 0.5m from the ends of the plot to avoid edge-effects [27].
GLAI Dx = GLAI   × ( 1 x )
Statistical analyses were performed in SAS 9.4 (SAS Institute, Cary, NC, USA). All measured variables were subjected to an analysis of variance using the Glimmix procedure. For testing the fungicide effect, fungicide treatment was set as a fixed factor while replication and days after planting (DAP) were considered random factors. Replication was nested within DAP. Least squared means (LS-means) were estimated using the Lsmeans statement in PROC GLIMMIX. Means were separated by using “PDIFF lines” option in the LSmeans statement at an α level of 0.10. Since fungicide treatments were applied after 63 DAP, a separate data set only using sampling periods after the fungicide treatment was used to determine treatment effects on collected variables using the same statistical methods. The Wyffeos slope comparison was used to determine the significance of the RUE values. The effect of fungicides was determined using orthogonal contrasts of the RUE values.

3. Results

RUE values of soybean from VC to R7.5 (22 to 130 DAP) were estimated to be 0.98, 1.07, and 1.07 g MJ−1 for the non-treated control, fluxapyroxad + pyraclostrobin, and the flutriafol + fluoxastrobin fungicide treatments, respectively (Figure 2). R2 values of the line of best fit were 0.98, 0.98, and 0.99 for the non-treated control, fluxapyroxad + pyraclostrobin, and flutriafol + fluoxastrobin treatments, respectively. RUE values from R3 to R7.5 (70 to 130 DAP) were estimated to be 0.96, 1.12, and 1.06 g MJ−1 for the non-treated control, the fluxapyroxad + pyraclostrobin, and the flutriafol + fluoxastrobin treatments, respectively (Figure 2). R2 values of the line of best fit were 0.98, 0.98, and 0.99 for the non-treated control, fluxapyroxad + pyraclostrobin, and flutriafol + fluoxastrobin treatments, respectively, from R3 to R7.5 (70–130 DAP). Orthogonal contrasts showed the estimated RUE values did not differ (p > 0.10) among the treatments within either timeframe (Table 4).
Canopy cover increased rapidly following 29 DAP, plateaued at 90 DAP, and reached a maximum coverage of nearly 100% then began to decline 120 DAP (Figure 3). An interaction (p = 0.025) was detected between treatment and DAP for the percent of foliage cover (Table 5). At 130 DAP (SD 14), the last sampling date, plots treated with fluxapyroxad + pyraclostrobin had approximately 10% more foliage cover than the non-treated control (p < 0.1; Table 5). Foliar cover of the flutriafol + fluoxastrobin treatment was approximately 5% greater (p > 0.1) than the non-treated control (Table 5).
DAP effect was significant (p ≤ 0.001) for TLAI, GLAIDx, DM, and NDVI values. The TLAI reached a maximum value of 5.45 at 90 DAP (SD 10; Figure 4A). At 82, 90, and 98 DAP (SD 9, 10, and 11), TLAI did not differ (Figure 4A). The TLAI decreased after 90 DAP. TLAI at 108 DAP and later were all significantly less than that at 98 DAP (Figure 4A). GLAIDx reached a maximum value of 5.30 at 90 DAP (SD 10; Figure 4B). Samples collected after 90 DAP showed significantly diminishing GLAIDx (Figure 4B). Average DM was not significantly different between the first four sampling dates and was relatively low. It sharply increased beginning 49 DAP and continued to increase up to the last sampling date (Figure 4). The greatest NDVI values were measured at 0.91, at 90 DAP (SD 10; Figure 4D). The value was significantly less than 130 DAP (SD 14) than the previous four sampling dates, with a value of 0.51.
A treatment by date interaction (p = 0.025) was seen for FLS severity. FLS was not observed until 108 DAP (SD 12). Severity was low, not exceeding 2% during the entire experiment. However, the non-treated control had significantly more FLS on the SD 13 than either of the fungicide treatments on the same date (Table 6). FLS severity of the non-treated control was numerically, however not significantly (p = 0.358), less on the last sampling date (130 DAP) than either fungicide treatment (Table 6). Treatment had a significant (p < 0.001) effect on yield (Table 6). The non-treated control and the fluxapyroxad + pyraclostrobin treatment had greater yields than the flutriafol + fluoxastrobin treatment by approximately 134.5 kg ha−1 (Table 6). p-values of date, treatment, and the date*treatment interaction for all variables can be viewed in Table S2.

4. Discussion

This is the first study to estimate soybean RUE using consumer-grade UAV imagery. Our robust data set, albeit a single year, was built by using six replications collected every 6–11 days, as Tewes and Schellberg [5] did with corn RUE estimation. Using this technology, we could estimate the impact of certain QoI-containing fungicides on RUE at low levels of FLS severity in Iowa.
Littleton et al. [38] and Muchow [6] reported RUE declined during pod fill. Muchow et al. [2] postulated that the decline of RUE was due to leaf drop and a reduction in specific leaf nitrogen. Here, the RUE values of the non-treated control and the flutriafol + fluoxastrobin treatment were slightly less for the post-fungicide application timeframe beginning at R3 (beginning pod), while the RUE values for fluxapyroxad + pyraclostrobin treatment were numerically greater for the post-fungicide application timeframe beginning at R3 (beginning pod) compared to the season long estimated RUE values.
The RUE values of the non-treated control of both the season-long and the post-fungicide sampling periods were numerically, but not significantly, less than the fungicide treatments for the same sampling periods. The beneficial effect of these fungicides was not captured with the estimated RUE values. Our sampling dates may not have captured the main benefit of the “greening effect”, which extends the period of photosynthetic activity by the leaves [39].
At the last sampling date (130 DAP), canopy cover of the fluxapyroxad + pyraclostrobin treatment was significantly greater than the control. This significant retention of canopy cover in the fluxapyroxad + pyraclostrobin treatment did not contribute enough to impact the TLAI or DM. However, we did not collect fallen leaves to be included with the DM and LAI measurements, and we speculate this may have altered the other components of RUE enough to show an effect.
LAI values followed the typical logistic curve until senescence began [40]. The average maximum value found in this experiment was slightly lower than the range of 6 to 7 identified by Dermody et al. [41] and Tagliapietra et al. [42]. The number of plants collected for LAI determination match or exceed previous studies [2,28]. TLAI and GLAIDx plots and values were very similar. This is reasonable since the severity of FLS was low. Because soybeans overinvest in leaves, this small amount of leaf area loss is unlikely to impact yield [41,43,44,45].
Fungicide application did not have a significant effect on DM, so the entire sampling period (22–130 DAP) was analyzed similarly to the TLAI and GLAIDx. The average DM of the last two sampling dates (120 and 130 DAP) was the greatest of all the dates and not significantly different from one another. However, during these same sampling periods, TLAI, GLAIDx, and NDVI values were at their lowest (Figure 4). At the last sampling date (130 DAP), TLAI was reduced to approximately 28% of the previous date (p < 0.001; 120 DAP). In addition, the GLAIDx was approximately one-tenth of the prior date, and NDVI values were also significantly less than the prior date (p < 0.001; Figure 4). Despite these large and significant reductions in LAI, they were not enough to show a change in DM.
During June-August 2019, total precipitation was 20% less and average temperature (F°) was 0.3% below the 30-year average (http://mesonet.agron.iastate.edu). Thus, environmental conditions for FLS were not highly conducive, and severity was low. However, there was a significant effect with both fungicide treatments, showing less disease. This low level of severity did not correspond to the yield data and was not captured by the estimated RUE. Yield of the fluxapyroxad + pyraclostrobin treatment did not differ from the non-treated control, despite showing greater canopy cover at the last sampling date (p = 0.078; 130 DAP). Treatment did not have an effect on the DM or either LAI values. Perhaps the sink was reduced and resulted in an imbalance that favored the source. Thus, additional photosynthates may have been stored in the stem, which the DM measurements failed to capture. In this study, the components of the plant were not separated into individual plant parts (pods, stems, and leaves). Doing so may have provided insight into these contradictions.
The “greening effect” of the canopy cover as described by Balba [18] and Bartlett et al. [19] may have been beginning, but NDVI values collected by a handheld GreenSeeker did not detect a treatment effect. Phillips et al. [25] found that the application of pyraclostrobin + fluxapyroxad applied at R3 increased the dry mass of stems at harvest. Perhaps the potential benefit of these QoI chemistries would have developed if sampling would have been extended to include samples closer to plant maturity.
Although we do not know the exact sensitivity of the consumer-grade unmodified camera that was used in our study, our RUE estimates fell within previously estimated values. Berra et al. [46] found the consumer-grade unmodified cameras they tested covered the 400–700 nm window of PAR. Burggraaff et al. [47] found that the stock camera of the Phantom 4 Pro covered the window of PAR but with a near-infrared (NIR) cut-off of approximately 670 nm. The UAV used in this study is stated to have the same camera as the one tested by Burggraaff et al. [47]. We assumed, as Tewes and Schellberg [5] did, that our sensor captured the PAR region.

5. Conclusions

RUE estimation with the help of UAV imagery may be considered a viable option for the evaluation of management techniques on a small plot scale. Since it is directly related to yield, RUE is a more appropriate parameter to evaluate stress and management practices. This could be especially beneficial to phenotyping experiments, though these would require non-destructive methods of determining LAI and DM due to their small plot size and large plot number. Consumer-grade UAVs and imagery were intentionally used in hopes that their cost and availability would lend to the widespread adoption of RUE as a standard evaluation parameter. The application of these fungicides did not provide a yield benefit. However, the “greening effect” may have occurred as we detected significantly more canopy cover in one of the fungicide treatments while the other fungicide had numerically greater canopy cover compared to the non-treated control. If FLS would have occurred earlier or with greater severity, yield may have been significantly impacted, and the fungicide treatments may have significantly affected the RUE.

Supplementary Materials

The following are available online at https://www.mdpi.com/2073-4395/10/12/2002/s1, Table S1. Calibration equations for each date of sample collection in 2019 and band for digital number conversion to ln reflectance; Table S2. ANOVA results of all collected variables and the effect of day after planting (DAP), treatment, and their combination from the field experiment in 2019 in Iowa.

Author Contributions

Conceptualization, X.A.P. and D.S.M.; formal analysis, X.A.P. and Y.R.K.; methodology, X.A.P. and M.A.L.; resources, M.A.L. and D.S.M.; writing—original draft, X.A.P.; writing—review and editing, Y.R.K., M.A.L., and D.S.M. All authors have read and agreed to the published version of the manuscript.

Funding

This project was partially funded with soybean checkoff funds through the United Soybean Board.

Acknowledgments

We thank Stith Wiggs for planting, spraying, and harvesting. We appreciate the help from all those in the lab, and everyone who helped process plants.

Conflicts of Interest

The authors declare no conflict of interest.

References

  1. Monteith, J.L. Climate and the efficiency of crop production in Britain. Philos. Trans. R. Soc. Lond. B 1977, 281, 277–294. [Google Scholar] [CrossRef]
  2. Muchow, R.C.; Robertson, M.J.; Pengelly, B.C. Radiation-use efficiency of soybean, mungbean and cowpea under different environmental conditions. Field Crops Res. 1993, 32, 1–16. [Google Scholar] [CrossRef]
  3. Morel, J.; Bégué, A.; Todoroff, P.; Martiné, J.F.; Lebourgeois, V.; Petit, M. Coupling a sugarcane crop model with the remotely sensed time series of fIPAR to optimize the yield estimation. Eur. J. Agron. 2014, 61, 60–68. [Google Scholar] [CrossRef]
  4. Gitelson, A.A.; Gamon, J.A. The need for a common basis for defining light-use efficiency: Implications for productivity estimation. Remote Sens. Environ. 2015, 156, 196–201. [Google Scholar] [CrossRef] [Green Version]
  5. Tewes, A.; Schellberg, J. Towards Remote Estimation of Radiation Use Efficiency in Maize Using UAV-Based Low-Cost Camera Imagery. Agronomy 2018, 8, 16. [Google Scholar] [CrossRef] [Green Version]
  6. Muchow, R.C. An analysis of the effects of water deficits on grain legumes grown in a semi-arid tropical environment in terms of radiation interception and its efficiency of use. Field Crops Res. 1985, 11, 309–323. [Google Scholar] [CrossRef]
  7. Santos, J.B.; Procópio, S.D.; Silva, A.A.; Costa, L.C. Capture and utilization of solar radiation by the soybean and common bean crops and by weeds. Bragantia 2003, 62, 147–153. [Google Scholar] [CrossRef] [Green Version]
  8. Gitelson, A.A.; Peng, Y.; Arkebauer, T.J.; Schepers, J. Relationships between gross primary production, green LAI, and canopy Chlorophyll content in maize: Implications for remote sensing of primary production. Remote Sens. Environ. 2014, 144, 66–72. [Google Scholar] [CrossRef]
  9. Gamon, J.A.; Berry, J.A. Facultative and constitutive pigment effects on the Photochemical Reflectance Index (PRI) in sun and shade conifer needles. Isr. J. Plant Sci. 2012, 60, 85–95. [Google Scholar] [CrossRef]
  10. Adeboye, O.B.; Schultz, B.; Adekalu, K.O.; Prasad, K. Impact of water stress on radiation interception and radiation use efficiency of soybeans (Glycine max L. Merr.) in Nigeria. Braz. J. Sci. Technol. 2016, 3, 1–21. [Google Scholar] [CrossRef] [Green Version]
  11. Nakaseko, K.; Gotoh, K. Comparative studies on dry matter production, plant type and productivity in soybean, azuki bean and kidney bean. Jpn. J. Crop Sci. 1983, 52, 49–58. [Google Scholar] [CrossRef]
  12. Schöffel, E.R.; Volpe, C.A. Conversion efficiency of photosynthetically active adiation intercepted by soybean for the production of biomass. Braz. J. Agrometeorol. 2001, 9, 241–249. [Google Scholar]
  13. Singer, J.W.; Meek, D.W.; Sauer, T.J.; Hatfield, J.L. Variability of light interception and radiation use efficiency in maize and sobean. Field Crops Res. 2011, 121, 147–152. [Google Scholar] [CrossRef]
  14. Confalone, A.E.; Dujmovich, M.N. Influence of deficit water on the efficiency of solar radiation on soybean. Brazilian J. Agrocienc. 1999, 5, 195–198. [Google Scholar]
  15. Souza, P.J.D.O.P.D.; Ribeiro, A.; da Rocha, E.J.P.; Farias, J.R.B.; Loureiro, R.S.; Bispo, C.C.; Sampaio, L. Solar radiation use efficiency by soybean under field conditions in the Amazon region. Pesqui. Agropecu. Bras. 2009, 44, 1211–1218. [Google Scholar] [CrossRef] [Green Version]
  16. Kumudini, S.; Godoy, C.V.; Board, J.E.; Omielan, J.; Tollenaar, M. Mechanisms involved in soybean rust-induced yield reduction. Crop Sci. 2008, 48, 2334–2342. [Google Scholar] [CrossRef]
  17. Wise, K.; Mueller, D. Are fungicides no longer just for fungi? An analysis of foliar fungicide use in corn. APSnet Features 2011, 10. [Google Scholar] [CrossRef]
  18. Balba, H. Review of strobilurin fungicide chemicals. J. Environ. Sci. (China) 2007, 42, 441–451. [Google Scholar] [CrossRef]
  19. Bartlett, D.W.; Clough, J.M.; Godwin, J.R.; Hall, A.A.; Hamer, M.; Parr-Dobrzanski, B. The strobilurin fungicides. Pest Manag. Sci. 2002, 58, 649–662. [Google Scholar] [CrossRef]
  20. Morrison, M.J.; Voldeng, H.D.; Cober, E.R. Physiological changes from 58 years of genetic improvement of short-season soybean cultivars in Canada. Agron. J. 1999, 91, 685–689. [Google Scholar] [CrossRef] [Green Version]
  21. Kumudini, S.; Hume, D.J.; Chu, G. Genetic improvement in short season soybeans: I. Dry matter accumulation, partitioning, and leaf area duration. Crop Sci. 2001, 41, 391–398. [Google Scholar] [CrossRef]
  22. Kyveryga, P.M.; Blackmer, T.M.; Mueller, D.S. When do foliar pyraclostrobin fungicide applications produce profitable soybean yield responses? Plant Health Prog. 2013, 14, 6. [Google Scholar] [CrossRef] [Green Version]
  23. Bradley, K.W.; Sweets, L.E. Influence of glyphosate and fungicide coapplications on weed control, spray penetration, soybean response, and yield in glyphosate-resistant soybean. Agron. J. 2008, 100, 1360–1365. [Google Scholar] [CrossRef]
  24. Kandel, Y.R.; Mueller, D.S.; Hart, C.E.; Bestor, N.R.; Bradley, C.A.; Ames, K.A.; Giesler, L.J.; Wise, K.A. Analyses of yield and net economic response from foliar fungicide and insecticide applications to soybean in the North Central United States. Plant Health Prog. 2016, 17, 232–238. [Google Scholar] [CrossRef] [Green Version]
  25. Phillips, X.A.; Singh, A.K.; Kandel, Y.R.; Mueller, D.S. Effect of pod removal, foliar fungicides, and cultivar on green stem disorder of soybean. Agron. J. 2017, 109, 2680–2688. [Google Scholar] [CrossRef]
  26. Fehr, W.R.; Caviness, C.E. Stages of Soybean Development; Special Report 80; Iowa State University Coop. Ext. Serv.: Ames, IA, USA, 1977. [Google Scholar]
  27. Probst, A.H. Border effects in soybean nursery plots. J. Am. Soc. Agron. 1943, 35, 662–666. [Google Scholar] [CrossRef]
  28. Maitree, L.; Toyota, M. A high seed yield and associated attributes of dry matter production achieved by recent Japanese soybean cultivars. Plant Prod. Sci. 2017, 20, 193–204. [Google Scholar] [CrossRef] [Green Version]
  29. Smith, G.M.; Milton, E.J. The use of the empirical line method to calibrate remotely sensed data to reflectance. Int. J. Remote Sens. 1999, 20, 2653–2662. [Google Scholar] [CrossRef]
  30. Wang, C.; Myint, S.W. A simplified empirical line method of radiometric calibration for small unmanned aircraft systems-based remote sensing. IEEE J. Sel. Top. Appl. Earth Obs. Remote Sens. 2015, 8, 1876–1885. [Google Scholar] [CrossRef]
  31. Woebbecke, D.M.; Meyer, G.E.; Von Bargen, K.; Mortensen, D.A. Color indices for weed identification under various soil, residue and lighting conditions. Trans. Am. Soc. Agric. Eng. 1995, 38, 259–269. [Google Scholar] [CrossRef]
  32. Meyer, G.E.; Neto, J.C. Verification of color vegetation indices for automated crop imaging applications. Comput. Electron. Agric. 2008, 63, 282–293. [Google Scholar] [CrossRef]
  33. Lindquist, J.L.; Arkebauer, T.J.; Walters, D.T.; Cassman, K.G.; Dobermann, A. Maize radiation use efficiency under optimal growth conditions. Agron. J. 2005, 97, 72–78. [Google Scholar] [CrossRef] [Green Version]
  34. Tollenaar, M.; Aguilera, A. Radiation use efficiency of an old and a new maize hybrid. Agron. J. 1992, 84, 536–541. [Google Scholar] [CrossRef]
  35. Flénet, F.; Kiniry, J.R.; Board, J.E.; Westgate, M.E.; Reicosky, D.C. Row spacing effects on light extinction coefficients of corn, sorghum, soybean and sunflower. Agron. J. 1996, 88, 185–190. [Google Scholar] [CrossRef]
  36. Taiz, L.; Zeiger, E.; Møller, I.M.; Murphy, A. Plant Physiology and Development, 6th ed.; Sinauer Assotiates: Sunderland, MA, USA, 2015; ISBN 1605352551. [Google Scholar]
  37. Madden, L.V.; Nutter, F.W., Jr. Modeling crop losses at the field scale. Can. J. Plant Pathol. 1995, 17, 124–135. [Google Scholar] [CrossRef]
  38. Littleton, E.J.; Dennett, M.D.; Monteith, J.L.; Elstonff, J. The growth and development of cowpeas (Vigna unguiculata) under tropical field conditions. 2. Accumulation and partition of dry weight. J. Agric. Sci. Camb. 1979, 93, 309–320. [Google Scholar] [CrossRef]
  39. Bertelsen, J.R.; De Neergaard, E.; Smedegaard-Petersen, V. Fungicidal effects of azoxystrobin and epoxiconazole on phyllosphere fungi, senescence and yield of winter wheat. Plant Pathol. 2001, 50, 190–205. [Google Scholar] [CrossRef]
  40. Setiyono, T.D.; Weiss, A.; Specht, J.E.; Cassman, K.G.; Dobermann, A. Leaf area index simulation in soybean grown under near-optimal conditions. Field Crop Res. 2008, 108, 82–92. [Google Scholar] [CrossRef] [Green Version]
  41. Dermody, O.; Long, S.P.; DeLucia, E.H. How does elevated CO2 or ozone affect the leaf-area index of soybean when applied independently? New Phytologist 2006, 169, 145–155. [Google Scholar] [CrossRef]
  42. Tagliapietra, E.L.; Streck, N.A.; da Rocha, T.S.; Richter, G.L.; da Silva, M.R.; Cera, J.C.; Guedes, J.V.; Zanon, A.J. Optimum leaf area index to reach soybean yield potential in subtropical environment. Agron. J. 2018, 110, 932–938. [Google Scholar] [CrossRef] [Green Version]
  43. Haile, F.J.; Higley, L.G.; Specht, J.E.; Spomer, S.M. Soybean leaf morphology and defoliation tolerance. Agron. J. 1998, 90, 353–362. [Google Scholar] [CrossRef]
  44. Conley, S.P.; Abendroth, L.; Elmore, R.; Christmas, E.P.; Zarnstorff, M. Soybean seed yield and composition response to stand reduction at vegetative and reproductive stages. Agron. J. 2008, 100, 1666–1669. [Google Scholar] [CrossRef]
  45. Conley, S.P.; Pedersen, P.; Christmas, E.P. Main-stem node removal effect on soybean seed yield and composition. Agron. J. 2009, 101, 120–123. [Google Scholar] [CrossRef]
  46. Berra, E.; Gibson-Poole, S.; MacArthur, A.; Gaulton, R.; Hamilton, A. Estimation of the spectral sensitivity functions of un-modified and modified commercial off-the-shelf digital cameras to enable their use as a multispectral imaging system for UAVs. ISPRS-Int. Arch. Photogramm. Remote Sens. Spat. Inf. Sci. 2015, XL-1/W4, 207–214. [Google Scholar] [CrossRef] [Green Version]
  47. Burggraaff, O.; Schmidt, N.; Zamorano, J.; Pauly, K.; Pascual, S.; Tapia, C.; Spyrakos, E.; Snik, F. Standardized spectral and radiometric calibration of consumer camers. Opt. Express 2019, 27, 19075–19101. [Google Scholar] [CrossRef] [Green Version]
Figure 1. Radiation use efficiency (RUE) estimation workflow illustrating the components and their source, needed to derive RUEgreen. fPARout = fraction of photosynthetically active radiation reflected; fCover = percent of canopy cover; fPARtrans= fraction of photosynthetically active radiation transmitted through the canopy; GLAI = green leaf area index; TLAI = total leaf area index; DM = dry matter; fAPARtotal = the fraction of absorbed photosynthetically active radiation of all leaf tissue; fAPARgreen = the fraction of absorbed photosynthetically active radiation by only the green leaf tissue; PARinc = incoming photosynthetically active radiation; APARgreen = absorbed photosynthetically active radiation by the green leaf tissue; RUEgreen = radiation use efficiency of only the green leaf tissue.
Agronomy 10 02002 g001
Figure 2. The function of accumulated dry matter and absorbed photosynthetically active radiation by the green leaf area (APARgreen) excluding frogeye leaf spot disease severity. The top row represents sampling dates from 22 to 130 days after planting (DAP) and the bottom row represents sampling dates after fungicide application, 70 to 130 DAP. Radiation use efficiency (RUE) is the slope of the regression equation. The intercept of the equation is not shown.
Agronomy 10 02002 g002
Figure 3. The development of foliar cover across the collected sampling dates from 22 to 130 days after planting (DAP) with error bars showing standard deviation.
Agronomy 10 02002 g003
Figure 4. (A) Total Leaf Area Index (TLAI), (B) Green Leaf Area Index with disease severity removed (GLAIDx) development during the entire sampling collection time frame (22 to 130 days after planting, DAP), (C) dry mass, and (D) Normalized Difference Vegetation Index (NDVI) values collected with a handheld GreenSeeker with error bars showing standard deviation.
Agronomy 10 02002 g004
Table 1. Radiation use efficiency (RUE) of soybean estimated in previous reports.
PublicationRUE
g M−1
Muchow, 1985 [6]0.60
Muchow et al., 1993 [2]0.88
Adeboye et al., 2016 [10]1.07
Nakaseko and Gotoh, 1983 [11]1.20
Schöffel and Volpe, 2001 [12]1.23
Singer et al., 2011 [13]1.46
Confalone and Dujmovich, 1999 [14]1.92
de Souza et al., 2009 [15]1.99
Santos et al., 2003 [7]2.53
Table 2. Details of the 2019 field experiment in Kanawha, Iowa, evaluating the use of an unmanned aerial vehicle with a consumer-grade camera for the estimation of the radiation use efficiency of soybean.
DetailSpecifics
Latitude and Longitude a42°54′36.6′′ N and 93°47′33.8′′ W
CultivarNK S29-K3X
Planting Population395,362 per hectare
Plot Length7.8-m
Planting Date16 May
Emergence30 May
Fungicide application date (R3) b22 July
Harvest Date29 Oct
a Latitude and Longitude format in degrees, minutes, and seconds (DMS). b R3 = beginning of pod formation [26].
Table 3. Target mean reflectance values used for image calibration during the field experiment in Kanawha, Iowa, during 2019.
Target aAverage Reflectance b
420–700 nm420–1050 nm900–1700 nm
%
Black (3%)2.72.83.1
Gray (13%)13.412.711.2
White (56%)55.656.155.5
a Type 822–1.2-m grayscale calibration panels (Group 8 Technology, Inc., Provo, UT, USA) with average reflectance value. b The average measured reflectance values of the calibration targets using a Perkin-Elmer Lambda 1050 Spectrophotometer with a 150 mm diameter integrating sphere. Data collected by Group 8 Technology (Group 8 Technology, Inc, Provo, UT, USA).
Table 4. Single degree of freedom contrasts of radiation use efficiency (RUE) derived from the linear line of best fit added to the plot of the sum of absorbed photosynthetically active radiation (APAR) and cumulative dry mass across the entire growing season and after the application of fungicide a treatments in 2019 in Iowa.
Timeframe bTreatmentsComparisons of RUEp Value
g Mj−1
Season longNTC vs. fluxapyroxad + pyraclostrobin0.98 vs. 1.070.132
NTC vs. flutriafol + fluoxastrobin0.98 vs. 1.070.124
fluxapyroxad + pyraclostrobin vs. flutriafol + fluoxastrobin 1.07 vs. 1.070.963
Post-fungicide applicationNTC vs. fluxapyroxad + pyraclostrobin0.96 vs. 1.120.325
NTC vs. flutriafol + fluoxastrobin0.96 vs. 1.060.513
fluxapyroxad + pyraclostrobin vs. flutriafol + fluoxastrobin 1.12 vs. 1.060.733
a Treatments = Non-treated control (NTC) did not receive a fungicide application, fluxapyroxad + pyraclostrobin (Priaxor, BASF), flutriafol + fluoxastrobin (Preemptor, FMC Agricultural Solutions). b There were a total of 14 sampling dates during the growing season that ranged from 22 to 130 DAP. The season long comparisons encompassed all 14 dates while the post-fungicide application comparisons consisted of the last eight sampling dates (70–130 DAP). Fungicides were applied at 67 days after planting.
Table 5. Canopy cover (%) of sampling dates after fungicide application at growth stage R3 a in a field trial conducted in Iowa during 2019.
Canopy Cover bc
Days After Planting
Fungicide d7075829098108120130
NTC87.592.896.699.896.299.996.580.5 b
Fluxapyroxad + pyraclostrobin87.592.996.899.996.399.996.489.9 a
Flutriafol + fluoxastrobin86.592.896.399.996.299.996.985.0 ab
p value0.8640.9920.9030.6800.9800.4260.7930.078
a Growth stage R3, beginning pod [26]. b Canopy cover was determined by performing raster classification using ArcGIS (ArcGIS Pro 2.4.2) and extracting the sum of the areas of each class and determining the percent of the “foliar” class with respect to the combined total area of the center two yield rows. c Least-squares means were separated by Fishers’ protected least significant difference at α = 0.10. Numbers followed by the same letter within a column are not significantly different at α 0.10 level. d Non-treated control (NTC) did not receive a fungicide application, fluxapyroxad + pyraclostrobin (Priaxor, BASF), flutriafol + fluoxastrobin (Preemptor, FMC Agricultural Solutions).
Table 6. Frogeye leaf spot (FLS) severity and yield by fungicides applied at growth stage R3 a and date from the field experiment in 2019 in Iowa.
FLS bcYield
Days After PlantingKg ha−1
Fungicide d120130
NTC1.7a0.7a3551 a
Fluxapyroxad + pyraclostrobin1.0b1.3a3544 a
Flutriafol + fluoxastrobin1.0b1.2a3390 b
p value0.0910.358<0.001
a Growth stage R3, beginning pod [26]. b FLS severity was visually estimated from 0-100% of the 0.5-m sampling area of each plot. c Least-squares means were separated by Fishers’ protected least significant difference at α = 0.10. Numbers followed by the same letter within a column are not significantly different at α 0.10 level. d Non-treated control (NTC) did not receive a fungicide application, fluxapyroxad + pyraclostrobin (Priaxor, BASF), flutriafol + fluoxastrobin (Preemptor, FMC Agricultural Solutions).
Publisher’s Note: MDPI stays neutral with regard to jurisdictional claims in published maps and institutional affiliations.

