Article

Optimization of Main Link Lengths of Transplanting Device of Semi-Automatic Vegetable Transplanter

1
Department of Biosystems Engineering, Kangwon National University, 1 Kangwondaehak-gil, Chuncheon, Gangwon-do 24341, Korea
2
Interdisciplinary Program in Smart Agriculture, Kangwon National University, 1 Kangwondaehak-gil, Chuncheon, Gangwon-do 24341, Korea
3
Major of Bio-Industrial Machinery Engineering, Gyeongsang National University, Jinju 52828, Korea
*
Authors to whom correspondence should be addressed.
Agronomy 2020, 10(12), 1938; https://doi.org/10.3390/agronomy10121938
Submission received: 13 November 2020 / Revised: 7 December 2020 / Accepted: 7 December 2020 / Published: 9 December 2020
(This article belongs to the Special Issue Automation for Digital Farming)

Abstract

:
In this study, the lengths of the main links of the transplanting device of a semi-automatic vegetable transplanter were optimized to reduce the weight at the same planting trajectory. The theoretical planting trajectory was obtained from the kinematic analysis for the link structure of the transplanting device and verified through kinematic simulation using commercial software and actual measurement using high-speed camera. Then, the lengths of the main links that have a great influence on the planting trajectory were optimized to have a minimum total length at the same planting trajectory. A genetic algorithm was used as an optimization tool. As a result, with the optimal lengths of the main links, the same planting trajectory was maintained while reducing the total length by 18.32% compared to the conventional one. The transplanting device with the optimal main link lengths would have benefits in terms of agricultural economy by reducing manufacturing and fuel costs.

1. Introduction

Transplanting is an agricultural task of transferring and planting seedlings grown uniformly in a nursery to a field. In vegetable cultivation, the amount of labor invested in transplanting accounts for approximately 5–10% of the total production labor; however, the labor intensity is significantly high because a large number of seedlings should be planted in a short period of time [1]. A transplanter is an agricultural machine that performs transplanting and is crucial for labor reduction and timely cultivation. Vegetables that can be planted using a transplanter include soybeans, garlic, potatoes, tomatoes, cabbages, peppers, green onions, cucumbers, and onions [2]. Approximately 1,026,785,216 tonnes of these vegetables were produced globally as of 2018, accounting for approximately 56% of the total vegetable production (1,827,297,053 tonnes) [3]. However, the usage ratio of the transplanters in transplanting work is relatively low. In the Republic of Korea, only 25.8%, 15.9%, 13.1%, and 8.7% of the cultivation area are planted with the help of transplanters for soybeans, garlic, onions, and potatoes, respectively [4].
In the United States and Europe, large transplanters of a tractor-attached or self-propelled fully automatic type are used because the cultivation area per farmer is relatively large. On the other hand, in countries where the cultivation area is relatively small, such as South Korea and Japan, small transplanters of cultivator-attached or walking semi-automatic type are mainly used [5]. The transplanting device is a key element of the transplanter to plant seedlings into the ground. The performance of a transplanter, such as the working efficiency and misplanting rate, is mainly determined by the operating motion of the transplanting device [6]. The transplanting device should make an ideal planting trajectory that enables the transplanter to continuously plant seedlings with a minimum push and drag force when the hopper is inserted into the soil [7]. In the design of a transplanting device, requirements such as the target crop row spacing, planting depth, and travel speed should be considered, and dynamic and kinematic analysis should be conducted to verify the design.
Park et al. (2018) analyzed the overall structure and transplanting performance of a commercial semi-automatic vegetable transplanter [8]. Lee et al. (2016) measured the operating trajectory of the seedling pick-up device and the hopper of a fully automatic transplanter by using a high-speed camera [9]. Park et al. (2004) analyzed the planting trajectory, velocity, and acceleration of a transplanting device using a kinematic analysis software [10]. Jo et al. (2018) analyzed the link structure of a transplanting device and found the condition that the transplanted seedlings are perpendicular to the ground [11]. Liu et al. (2009) analyzed the planting trajectory of a simple four-bar linkage type transplanting device by kinematic simulation using MATLAB [12]. Most of the studies related to transplanters to date involve the analysis of kinematic and dynamic characteristics of the transplanting devices through experiments or by using dynamic/kinematic analysis software. In the usual product development process, concept and detailed design by a theoretical analysis are conducted first, and then a field or real-life experiment is conducted to verify the design. The initial design on a theoretical basis is very important to improve the completeness of the product and save development time. Therefore, theoretical analysis for the operating mechanism of a transplanting device is important for the reliable design and production of the transplanter.
Regarding design parameter optimization, genetic algorithms have been used in various fields including structural optimization due to their good performance, ease of use, and relatively short computation time. Mendi et al. (2010) optimized the dimensions of shafts, gears, and bearings of a transmission system [13]. Lee et al. (2012) optimized the major design parameters of a rocket engine, such as the combustion chamber pressure and nozzle expansion ratio [14]. Lampinen (2003) investigated an optimal design process for cam shape considering the operating mechanism [15]. Kim and Lee (2003) optimized the design parameters of a composite I-type beam [16]. Rahami et al. (2008) minimized the weight of the truss structures through design parameter optimization [17].
This study conducted a theoretical kinematic analysis of the link structure of a transplanting device for a commercial semi-automatic vegetable transplanter. Based on the analysis, optimal lengths of the main links, minimizing the total while keeping the planting trajectory the same, were determined by applying a genetic algorithm. Such an optimization can reduce the weight of a transplanting device and transplanter, thereby reducing fuel consumption and manufacturing cost and improving ease of use for weaker individuals in rural areas.

2. Materials and Methods

2.1. Semi-Automatic Vegetable Transplanter

The shape and main specifications of the semi-automatic vegetable transplanter of this study are shown in Figure 1 and Table 1, respectively. The main components of the transplanter consist of an engine that is the power source, a transmission that transmits the power of the engine to the driving wheel and transplanting device, a seedling cylinder in which seedlings are placed manually, a transplanting device to plant the seedlings supplied from the seedling cylinder into the soil, a control section that controls the operation of the transplanter, a digital plant spacing control device that adjusts the row spacing for the seedlings, a depth control device that controls the planting depth of the seedlings, and a molding wheel that covers a seedling planted in the ground with soil.
The transplanter operates as follows: A user determines the travel speed of the transplanter through the control section and supplies the seedlings to the seedling cylinders manually. The transplanter moves in the forward direction and plants the seedlings into the ground by the motion of the transplanting device. That motion makes the hopper of the transplanting device move up and down in a certain trajectory. When the hopper is at the top, it is located just below one of the seedling cylinders. At that moment, the seedling cylinder opens and drops the seedling into the hopper. When the hopper reaches the lower end, it is located at a certain depth in the ground. At that moment, the hopper is opened and the seedlings in the hopper are planted into the ground. The row spacing and planting depth suitable for the target crop can be set by the digital plant spacing control device and the depth adjustment device, respectively. The seedlings planted in the ground are covered with soil by the molding wheel installed at the rear side of the transplanter, and the transplanting work is completed.

2.2. Structure of the Transplanting Device

Figure 2 presents the shape of the transplanting device, which is a key element of the transplanter. The transplanting device consists of a cam, links, a bearing, a transplanting hopper, and other connecting elements. The engine power is transmitted to the crank to drive the entire transplanting device.
The transplanting device was expressed as a kinematic diagram in order to analyze its structure (Figure 3). The transplanting device consists of a total of 13 links, including the ground (L1), and each link is connected by a revolute joint or a sliding joint for operation (Table 2). The cam opens and closes the hopper through a contact with the bearing.

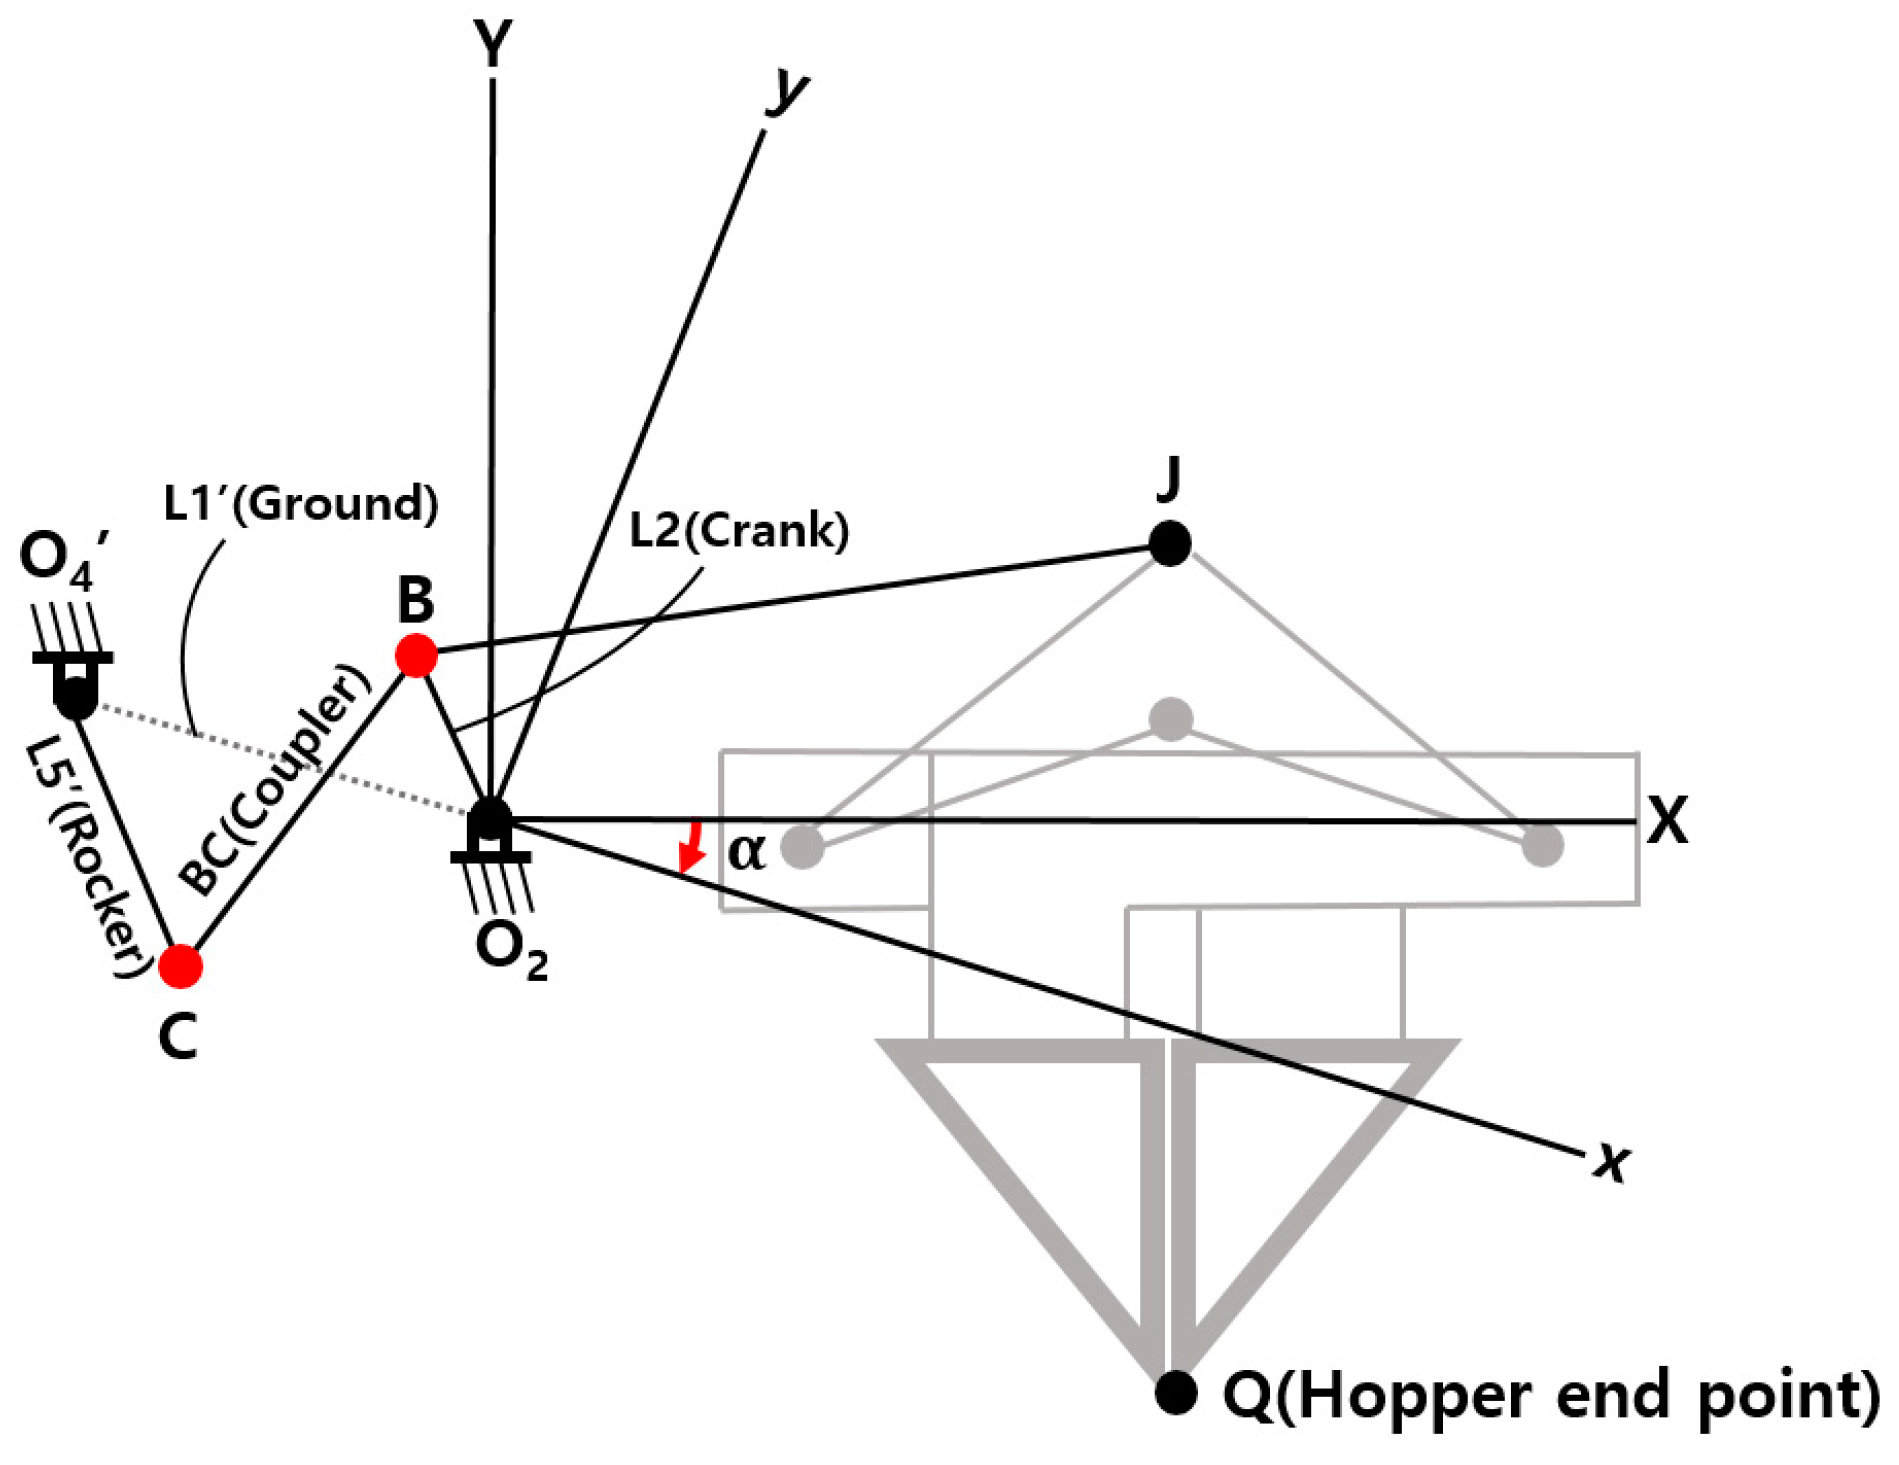
2.3. Kinematic Analysis to Determine Theoretical Planting Trajectory

The theoretical planting trajectory of the hopper was derived by analyzing the operating positions of the main links of the transplanting device. The main links related to the planting trajectory are 6 links, including the ground (L1, L2, L3, L4, L5, and L6). When the power of the engine is transmitted to the crank (L2), which is a driving part of the transplanting device, the behavior of the transplanting device is initiated by the rotational motion of the crank. L4 is a quaternary link with four joints (C, D, G, and H) and is a coupler of the parallelogram mechanism made by two links of the same length (L5, L6) and the ground. Therefore, L4 moves in a curved translational motion, and all four joints have the same trajectory (Figure 4).
L3 is a ternary link that consists of three joints (B, C, and J), and the position of joint J is determined by the positions of joints B and C; that is, when the positions of joints B and C are changed by the rotation of crank, the position of joint J is determined accordingly. Because the relative positions of joint J and the hopper end point Q are fixed, once the position of joint J is determined, the position of the hopper end point which is related to the planting trajectory can be finally determined (Figure 5).
For simplification, the virtual links (L1′, L5′) and the virtual pivot point (O4′) that make joint C have the same trajectory as the existing curve are set as shown in Figure 6. L1′ is the ground, and the positions of L5′ and O4′ can be determined by translating the link L5 to meet at point C. In this way, the two links L5 and L6 are simplified to a single link, L5′, and the two pivot points E and F are simplified to a single pivot point, O4′. The length of link L5′ is the same as that of link L5 or L6.
In this case, the position of joints B and C can be simply determined by a four-bar linkage mechanism consisting of links L1′ (ground), L2 (crank), BC ¯ (coupler), and L5′ (rocker). The fixed pivot point O2 of the crank was considered as the origin of the global coordinate system (X–Y coordinate system). For convenience of analysis, the local coordinate system (x–y coordinate system) was set so that the x-axis was aligned with the ground L1′ by rotating the global coordinate system clockwise by a certain angle (α) (Figure 7).
Regarding the four-bar linkage mechanism analysis, the input parameter is the counterclockwise angle (θ2) between the x-axis direction and the crank. The output parameter is the counterclockwise angle (θ3) between the x-axis direction and the coupler. When θ3 is determined for each θ2, the position of joints B and C in the local coordinate system can also be determined. Finally, the position of joint J and the hopper end point Q can be derived from the position of joints B and C. The value of θ3 according to θ2 can be obtained using the vector loop equation as shown in Equation (1) (Figure 8) [18].
R 2 + R 3 R 4 R 1 = 0
where
  • R 2 = vector of link O 2 B ¯ (crank);
  • R 3 = vector of link BC ¯ (coupler);
  • R 4 = vector of link O 4 C ¯ (rocker);
  • R 1 = vector of link O 2 O 4 ¯ (ground).
The position of joint J is derived by Equation (2) using the position of joint B. In the equation, the position of joint B can be obtained by using the length of the crank and angle θ2, which are known variables. The position of joint J with respect to joint B is derived from the angle (x’) between link BJ ¯ and the x-axis direction. When ∠CBJ is set to δ, x’ can be obtained from the geometrical relationship between the links. As shown in Figure 9, the figure can be rotated so that the x-axis becomes the horizontal axis, and Equation (3) can be derived based on the relationship of the angles θ2, θ3, and x’.
R J = R B + R J / B
where
  • R J = position of joint J in the local coordinate system;
  • R B = position of joint B in the local coordinate system;
  • R J / B = position of joint J relative to joint B in the local coordinate system.
θ 3 π + δ x = π
θ3 is determined by θ2, and δ is a constant; the position of joint J with respect to joint B can be calculated with a given θ2. The position of joint B and the position of joint J with respect to joint B are determined by Equations (4) and (5), respectively, by which the position of joint J is determined, as shown in Equation (6).
R B = [ R B x R B y ] = a [ c o s θ 2 s i n θ 2 ]
where
  • R B x = x-axis position of joint B in the local coordinate system;
  • R B y = y-axis position of joint B in the local coordinate system;
  • a = length of BO 2 ¯ (crank).
R J / B = [ R J / B x R J / B y ] = p [ c o s x s i n x ] = p [ c o s ( θ 3 + δ 2 π ) s i n ( θ 3 + δ 2 π ) ] = p [ c o s ( θ 3 + δ ) s i n ( θ 3 + δ ) ]
where
  • R J / B x = x-axis position of joint J with respect to B in the local coordinate system;
  • R J / B y = y-axis position of joint J with respect to B in the local coordinate system;
  • p = Length of B J ¯ .
R J = [ R J x R J y ] = [ c o s θ 2 c o s ( θ 3 + δ ) s i n θ 2 s i n ( θ 3 + δ ) ] [ a p ]
where
  • R J x = x-axis position of joint J in the local coordinate system;
  • R J y = y-axis position of joint J in the local coordinate system.
Because the rotation of the local coordinate system counterclockwise by α matches the global coordinate system, the position of joint J in the global coordinate system can be obtained using Equation (7):
[ R J X R J Y ] = [ c o s α s i n α s i n α c o s α ] [ R J x R J y ]
where
  • R J X = X-axis position of joint J in the global coordinate system;
  • R J Y = Y-axis position of joint J in the global coordinate system.
In the global coordinate system, the Y coordinate of the hopper end point Q always maintains a constant distance (320 mm) from the Y coordinate of joint J. Furthermore, the X coordinate of Q is the same as the X coordinate of joint J. Therefore, the final position of the hopper end point can be determined using the position of joint J in the global coordinate system (Equation (8)).
[ R Q X R Q Y ] = [ R J X R J Y 320 ]
where
  • R Q X = X-axis position of the hopper end point Q in the global coordinate system;
  • R Q Y = Y-axis position of the hopper end point Q in the global coordinate system.
The length and angles of the links for the existing transplanting device were obtained by measurements. The lengths of the crank ( O 2 B ¯ ), coupler ( BC ¯ ), rocker ( O 4 C ¯ ), and ground ( O 2 O 4 ¯ ) were 48.22 mm, 102 mm, 80 mm, and 105 mm, respectively; the length of link BJ ¯ and angles of α and δ were 110 mm, 22°, and 130°, respectively.

2.4. Verification of Theoretical Planting Trajectory

2.4.1. Kinematic Simulation Using Commercial Software

A kinematic simulation software (Recurdyn V8R5, Functionbay, South Korea) was used to verify the operating trajectory of the hopper end point (planting trajectory) obtained from the theoretical kinematic analysis. For the simulation, a 3D model of the transplanting device was constructed by measuring the actual dimensions of the components of the transplanting device (Figure 10). Because all elements of the transplanting device are made of steel, the values of density, Poisson’s ratio, Young’s modulus, and yield strength of 7.85 × 10³ kg/m³, 0.29, 205 GPa, and 346.5 MPa were applied, respectively [19]. The supporting frame was fixed, and the crank was set to rotate counterclockwise by reflecting the actual operating direction. The frictions between elements were ignored, and the influence of the self-weight was considered. In the simulation, the trajectory of the hopper end point was derived when the transplanting device was operated.

2.4.2. Measurement Using a High-Speed Camera

To derive an actual planting trajectory during operation, the trajectory of a hopper end point was measured by using a high-speed camera. Table 3 presents the specifications of the high-speed camera used in this study.
During the measurement, the body of the transplanter was fixed and only the transplanting device was operated. A blackout curtain was installed in the back, and a measurement marker was attached on the transplanting device to derive the planting trajectory based on the position of the marker. At this time, marker 1 was attached on the hopper end point to trace the planting trajectory, while markers 2 and 3 were attached on the fixed frame as a reference to obtain the absolute scale of the image (Figure 11a). In the measurement, the row spacing was fixed to 60 cm and the planting trajectory for one rotation of the crank was measured under four different engine rotation speeds of 1098 rpm, 1249 rpm, 1398 rpm, and 1552 rpm. The high-speed camera was set to 1024 × 1024 ppi (pixels per inch) and 500 fps (frames per second). Figure 11b presents the captured image.

2.5. Optimization Strategy for the Main Link Lengths of the Transplanting Device

We tried to find the optimal lengths of the main links to reduce the weight while maintaining the same planting trajectory as the existing transplanting device. The main links to be optimized were the crank, coupler, and rocker, as shown in Figure 7, because they are key links that determine the planting trajectory. A genetic algorithm was used as an optimization method. The genetic algorithm is one of the techniques used to solve optimization problems with a stochastic search method developed based on biological evolution [20,21].
To solve the optimal design problem of the main link lengths, based on the micro-genetic algorithm proposed by Krishnakumar [22], we used around 10 design variables and a relatively small number of populations to make large-scale computation unnecessary. The elite genes were selected based on the total main link length and used in the next generation to preserve the desired factors. The difference of micro-genetic algorithms to general genetic algorithms is that they do not take into account mutations. This is because when the genes converge to one point, they are reconstructed into the optimal gene in the group and the additional randomly generated gene, so no separate mutation computation is required [22]. Figure 12 presents the genetic algorithm process of this study.
The optimization process applied in this study is detailed as follows.
Step 1. Create the initial population
A set of crank, coupler, and rocker lengths was used to express a chromosome that was the solution set of genetic algorithms. The initial solution set (1st generation) was randomly generated at an interval of 0.01 mm within the range of ±5 mm based on the lengths of the crank, coupler, and rocker lengths of the existing transplanting device.
Step 2. Fitness evaluation
The fitness of the solution set was evaluated and the optimal set was selected. At this time, the fitness was determined from the objective function that was set to minimize the total link length. Because the links of the transplanting device were mainly subjected to axial load during operation, there was no significant change in the stress magnitude generated in each link if the cross-sectional area was retained. For minimizing the effect to static safety regarding stress magnitude, only the link lengths were set as an input parameter. Because the cross-sectional area was the same, the length ratio was the same as the weight ratio, and the condition in which the total length was minimized was the same as the condition in which the weight was minimized. Therefore, the optimal condition was to minimize the total main link length while maintaining the planting trajectory of the hopper within a specific range. The theoretical planting trajectory was used in the optimization process to confirm if the optimized transplanting device had the same planting trajectory as the existing one.
The constraint of the solution set was defined using the width and height of the planting trajectory. The limiting range was set to ±5 mm from the existing planting trajectory; that is, solution sets were included in the optimization process only when the maximum Y coordinate, the minimum Y coordinate, the maximum X coordinate, and the minimum X coordinate of the new trajectory fell within ±5 mm of the values of the existing trajectory.
Step 3. Selection and crossover
The solution sets were selected based on the fitness evaluation, and a crossover operation was conducted. According to the strategy of the micro-genetic algorithm, tournament selection was adopted as the selection operation and one-point crossover was adopted as the crossover operation [23].
Step 4. Convergence
Convergence was reviewed by including the solution sets generated through the crossover operation and the elite sets. In the micro-genetic algorithm, the nominal convergence is the step of selecting and crossing solution sets repeatedly until the difference between the sets generated from the selection and crossover operations and elite sets is below a certain level. When the termination condition is set to the maximum number of generations, the nominal convergence is generally set to 5% [24]. In this study, the degree of convergence was used as the termination criterion, so the nominal convergence was relatively relaxed and set to 10%.
Step 5. Restart
When restarting, the remaining sets except the elite sets were newly constructed using a random function. Elite sets were the result of the evolution of the last generations, and newly created sets enabled the consideration of multiple solution sets without mutation.
Step 6. Termination criteria satisfied
The above process was repeated until the termination criteria was satisfied. The termination criteria can be arbitrarily set by the user, and it was set to 10% of the nominal convergence in this study.

2.6. Methodology Overview

Using Equations (1)–(8), the theoretical planting trajectory according to the main link lengths could be obtained. The theoretical planting trajectory was verified by comparing with the trajectories from kinematic simulation using commercial software and actual measurements using a high-speed camera for the same existing transplanting device. Then, the genetic algorithm was used to optimize the main link lengths to have the minimum total length under the same planting trajectory. At this time, the theoretical planting trajectory equations were used to confirm if the planting trajectory of the optimized solution was the same with the existing one. The ANOVA (analysis of variance) was performed to check if the planting trajectories derived from the different methods were statistically the same.

3. Results

3.1. Theoretical Planting Trajectory from Kinematic Analysis

As a result of the theoretical kinematic analysis for the existing transplanting device, the hopper end point Q showed a coupler trajectory as shown in Figure 13 for one rotation of the crank, where the maximum and minimum X coordinate values were 275.62 mm and 181.48 mm, respectively, and the maximum and minimum Y coordinate values were −198.34 mm and −399.07 mm, respectively. Thus, the maximum width of the trajectory (maximum X coordinate − minimum X coordinate) was 94.14 mm, and the maximum height of the trajectory (maximum Y coordinate − minimum Y coordinate) was 200.73 mm.

3.2. Planting Trajectory from Kinematic Simulation Software

As a result of the simulation for the existing transplanting device, the trajectory of the hopper end point Q was determined as shown in Figure 14 for one rotation of the crank. The maximum and minimum X coordinate values of the trajectory were 272.92 mm and 184.88 mm, respectively, and the maximum and minimum Y coordinate values were −197.2 mm and −402.25 mm, respectively. Therefore, the maximum width of the trajectory was 88.04 mm, and the maximum height was 205.05 mm.

3.3. Planting Trajectory from High-Speed Camera Measurement

Figure 15 presents the superimposed shape of the planting trajectories for the existing transplanting device acquired from high-speed camera measurements. It presents a similar trajectory regardless of the engine speed, and a slight vibration occurs when the hopper descends. The vibration seems to be caused by the friction between components as well as the manufacturing and assembly errors.
At the engine speed of 1098 rpm, the maximum and minimum X coordinate values of the trajectory were 283.85 mm and 178.75 mm, respectively, and the maximum and minimum Y coordinate values were −195.99 mm and −400.48 mm, respectively. The maximum width of the trajectory was 105.1 mm, and the maximum height was 204.49 mm.

3.4. Verification of Theoretical Planting Trajectory

The ANOVA was performed to verify the theoretical planting trajectory. The theoretical planting trajectory was compared with the trajectories obtained from the kinematic simulation software and high-speed camera measurement. Regarding the high-speed camera measurement, the trajectory at engine speed of 1098 rpm was used. The theoretical planting trajectory was set as the independent variable, and the planting trajectories from the kinematic simulation software and high-speed camera measurement were set as the dependent variables. The probability of significance was derived by targeting the X-coordinate values for the same Y-coordinate of the independent and the dependent variables.
Figure 16 presents the superimposed planting trajectories of the three methods. Table 4 and Table 5 present the variance analysis results, by which it was found that the theoretical planting trajectory did not show statistically significant differences compared to the planting trajectories from the kinematic simulation software and high-speed camera measurement at the 5% significance level. Therefore, the result of the theoretical kinematic analysis is valid and the theoretical planting trajectory can be used in the optimization process.

3.5. Optimization Result for Main Link Lengths

In the genetic algorithm, constraints were set based on the maximum and minimum X coordinate values and the maximum and minimum Y coordinate values of the theoretical planting trajectory, which were 272.92 mm, 184.88 mm, −197.2 mm, and −402.25 mm, respectively. The final optimal solution derived from the genetic algorithm is shown in Table 6. The optimal main link lengths were 39.49 mm for the crank, 84.21 mm for the coupler, and 64.35 mm for the rocker. The reduction in the total main link length (i.e., weight reduction) was 18.32% compared to the previous one.
Because the optimal solution was determined by using the theoretical planting trajectory, it was necessary to make sure it was a feasible solution. Therefore, a kinematic simulation was performed by applying the optimal link lengths to confirm whether the optimal solution was operable. From a kinematic point of view, the operability according to link length and location can be sufficiently checked through simulation. As a result of the simulation, the transplanting device operated well without any toggle positions. Figure 17 presents the superimposed planting trajectories of the existing transplanting device and the transplanting device in which the optimal main link lengths were applied. The maximum X coordinate, minimum X coordinate, maximum Y coordinate, and minimum Y coordinate of the planting trajectory of the optimally designed transplanting device were 277.17 mm, 177.45 mm, −193.35 mm, and −401.06 mm, respectively.
Finally, an ANOVA was conducted to compare planting trajectories of existing and optimized transplanting device. The probability of significance was derived by targeting the X coordinate values corresponding to the same Y coordinate value from the two planting trajectories (Table 7). The ANOVA presented no statistically significant difference at the 5% significance level. Therefore, the transplanting device with optimal main link lengths can apparently reduce the weight while maintaining the same level of planting trajectory as the existing transplanting device.

4. Conclusions

In this study, the optimal lengths of the main links of the transplanting device were determined to reduce the weight while maintaining the same planting trajectory as the conventional one. The link structure of the transplanting device was analyzed, and the main links that have a decisive influence on the planting trajectory were selected. The theoretical planting trajectory regarding the main link lengths was obtained from kinematic analysis of the link structure and verified by comparing with the planting trajectories derived from kinematic simulation software and actual measurements. Then, the theoretical planting trajectory was used to confirm if the optimized transplanting device had the same planting trajectory as the existing one.
The genetic algorithm was used as an optimization method. It was assumed that the cross-sectional area of the links did not change, so that the length ratio of the main links was equal to the weight ratio. Therefore, the objective was to minimize the total length while maintaining the same planting trajectory as the conventional transplanting device.
As a result of the optimization, the total length of the main links was reduced by 18.32% compared to the existing transplanting device. The operability of the optimized solution was confirmed by kinematic simulation software. Therefore, using the optimized main links can reduce the weight while maintaining the same level of planting trajectory. The optimally designed transplanting device would have benefits in terms of agricultural economy by reducing manufacturing and fuel costs. The actual operability and dynamic properties such as force and stress exerted in the link structure will be studied in future research.

Author Contributions

Experiments and data analysis, S.-J.H., J.-H.P. and J.-Y.L.; writing—original draft preparation, S.-J.H.; writing—review and editing, S.-B.S. and J.-S.N. All authors have read and agreed to the published version of the manuscript.

Funding

This work was supported by the Korea Institute of Planning and Evaluation for Technology in Food, Agriculture and Forestry (IPET) through the Agriculture, Food and Rural Affairs Convergence Technologies Program for Educating Creative Global Leaders Program, funded by the Ministry of Agriculture, Food and Rural Affairs (MAFRA) (716001-7). This work was also supported by the Korea Institute of Planning and Evaluation for Technology in Food, Agriculture, Forestry (IPET) through the Advanced Production Technology Development Program, funded by the Ministry of Agriculture, Food and Rural Affairs (MAFRA) (319041-03).

Conflicts of Interest

The authors declare no conflict of interest.

References

  1. Moon, S.D.; Min, Y.B.; Park, J.C. Analysis of Working Capacity of a Hand-fed Transplanter. J. Bio-Environ. Control 1997, 6, 159–167. [Google Scholar]
  2. Kang, D.I. Design of Automatic Feeding System for Tray Seedling and Transplanting Mechanism Analysis for A Vegetable Transplanter. Ph.D. Thesis, Sungkyunkwan University, Seoul, Korea, 1993; pp. 1–2. [Google Scholar]
  3. Food and Agriculture Organization of the United Nations: Agriculture and Consumer Protection. Available online: http://www.fao.org/faostat/en/#data/QC (accessed on 10 August 2020).
  4. Korea National Statistical Office: Survey on the Use of Agricultural Machinery. Available online: https://kosis.kr/statHtml/statHtml.do?orgId=143&tblId=DT_143004N_025&vw_cd=MT_ZTITLE&list_id=K1_14&seqNo=&lang_mode=ko&language=kor&obj_var_id=&itm_id=&conn_path=MT_ZTITLE (accessed on 28 November 2020).
  5. Kang, T.G.; Kim, S.W.; Kim, Y.K.; Lee, S.H.; Jun, H.J.; Choi, I.S.; Yang, E.Y.; Jan, K.S.; Kim, H.G. Analysis of Pick-up Mechanism for Automatic Transplanter (I). J. Agric. Life Sci. 2017, 51, 187–192. [Google Scholar] [CrossRef]
  6. Shim, S.B.; Kim, Y.J.; Yang, S.H.; Lee, S.D.; Lee, D.K. A Study on Trace of Hopper of the Transplanter. Proc. Conf. Korean Soc. Agric. Mach. 2016, 21, 201–202. [Google Scholar]
  7. Park, S.H.; Cho, S.C.; Kim, J.Y.; Choi, D.K.; Kim, C.K.; Kwak, T.Y. Motion Analysis for 4bar Link Type of Transplanting Device. Proc. Conf. Korean Soc. Agric. Mach. 2004, 9, 155–159. [Google Scholar]
  8. Park, J.H.; Hwang, S.J.; Nam, J.S. Operational characteristics of a domestic commercial semi-automatic vegetable transplanter. J. Agric. Life Sci. 2018, 52, 127–138. [Google Scholar] [CrossRef]
  9. Lee, S.D.; Lee, D.K.; Kim, Y.J.; Yang, S.H.; Kim, T.Y. Trajectory Analysis of Automatic Transplanter using High-Speed Camera. Proc. Conf. Korean Soc. Agric. Mach. 2016, 21, 141–142. [Google Scholar]
  10. Park, S.H.; Cho, S.C.; Kim, J.Y.; Choi, D.K.; Kim, C.K.; Kwak, T.Y. Motion Analysis for 4bar Link and Slide Type of Transplanting Device. Proc. Conf. Korean Soc. Agric. Mach. 2004, 9, 160–164. [Google Scholar]
  11. Jo, J.S.; Okyere, F.G.; Jo, J.M.; Kim, H.T. A Study on Improving the Performance of the Planting Device of a Vegetable Transplanter. Proc. Conf. Korean Soc. Agric. Mach. 2018, 43, 202–210. [Google Scholar]
  12. Liu, T.T.; Hou, S.L.; Zhao, X.; Yin, L.J.; Yin, C.G.; Wang, Q.F. Computer Aided Analysis of Planting Mechanism of the Seedling Transplanter. Proc. Conf. Meas. Technol. Mechatron. Autom. 2009, 3, 38–41. [Google Scholar]
  13. Mendi, F.; Baskal, T.; Boran, K.; Boran, F.E. Optimization of Module, Shaft Diameter and Rolling Bearing for Spur Gear through Genetic Algorithm. Expert Syst. Appl. 2010, 37, 8050–8064. [Google Scholar] [CrossRef]
  14. Lee, S.B.; Lim, T.K.; Roh, T.S. Design Optimization of Liquid Rocket Engine Using Genetic Algorithms. J. Korean Soc. Propuls. Eng. 2012, 16, 25–33. [Google Scholar] [CrossRef]
  15. Lampinen, J. Cam Shape Optimisation by genetic algorithm. Comput. Aided Des. 2003, 35, 727–737. [Google Scholar] [CrossRef]
  16. Kim, Y.B.; Lee, J.H. Optimum design of Thin-walled I-section Composite Beams using Micro Genetic Algorithm. J. Archit. Inst. Korea Struct. Constr. 2003, 19, 69–76. [Google Scholar]
  17. Rahami, H.; Kaveh, A.; Gholipour, Y. Sizing, geometry and topology optimization of trusses via force method and genetic algorithm. Eng. Struct. 2008, 30, 2360–2369. [Google Scholar] [CrossRef]
  18. Norton, R.L. Grashof condition. Kinematics and Dynamics of Machinery, 2nd ed.; Park, Y.P., Park, C.Y., Ahn, C.W., Eds.; Kyobobook: Seoul, Korea, 2005; pp. 56–61. [Google Scholar]
  19. Juvinall, R.C.; Marshek, K.M. Machine Component Design, 5th ed.; WILEY, John Wiley & Sons, Inc.: Hoboken, NJ, USA, 2020; pp. 841–847. [Google Scholar]
  20. Hsu, C.C.; Chao, C.K.; Wang, J.L.; Lin, J. Multiobjective Optimization of Tibial Locking Screw Design Using a Genetic Algorithm: Evaluation of Mechanical Performance. J. Orthop. Res. 2006, 24, 908–916. [Google Scholar] [CrossRef] [PubMed]
  21. Lee, K.H.; Lee, G.H.; Bae, I.H.; Chong, T.H. An Optimum Design Method of Hypoid Gear by Minimizing Volume. Korean Soc. Manuf. Technol. Eng. 2007, 16, 55–61. [Google Scholar]
  22. Krishnakumar, K. Micro-genetic Algorithms for Stationary and Non-stationary Function Optimization Function. In Intelligent Control and Adaptive Systems; International Society for Optics and Photonics: Washington, DC, USA, 1989; Volume 1196, pp. 282–296. [Google Scholar]
  23. Lee, S.Y. Nondestructive Damage Identification of Free Vibrating Thin Plate Structures Using Micro-Genetic Algorithms. J. Korean Soc. Steel Constr. 2005, 17, 173–181. [Google Scholar]
  24. Lee, M.K.; Kim, C.G. Optimal Design of Laminated Stiffened Composite Structures using a parallel micro Genetic Algorithm. Compos. Res. 2008, 21, 30–37. [Google Scholar]
Figure 1. Picture of the semi-automatic vegetable transplanter used in this study.
Agronomy 10 01938 g001
Figure 2. Transplanting device of the transplanter.
Agronomy 10 01938 g002
Figure 3. Link structure of the transplanting device: (a) link configuration; (b) transplanting device overlapped with the link configuration (green line).
Agronomy 10 01938 g003
Figure 4. Trajectory of joints B, C, D, G, and H.
Agronomy 10 01938 g004
Figure 5. Trajectory of joints J and Q.
Agronomy 10 01938 g005
Figure 6. The position of the virtual links (L5′, L1′) and pivot point (O4′).
Agronomy 10 01938 g006
Figure 7. Diagram for the theoretical position analysis of the transplanting device.
Agronomy 10 01938 g007
Figure 8. Vector of the link structure for theoretical position analysis.
Agronomy 10 01938 g008
Figure 9. The parameters θ2, θ3, δ, and x’ for a theoretical position analysis in the local coordinate system.
Agronomy 10 01938 g009
Figure 10. Main components of the transplanting device in 3D modeling.
Agronomy 10 01938 g010
Figure 11. Measurement of hopper trajectory by high-speed camera: (a) positions of the markers; (b) measured trajectory.
Agronomy 10 01938 g011
Figure 12. Optimal design process for the transplanting device using the genetic algorithm.
Agronomy 10 01938 g012
Figure 13. Theoretical planting trajectory derived from kinematic analysis.
Agronomy 10 01938 g013
Figure 14. Planting trajectory derived from the kinematic simulation software.
Agronomy 10 01938 g014
Figure 15. Planting trajectories derived from the high-speed camera measurement.
Agronomy 10 01938 g015
Figure 16. Overlapping of trajectories derived from the theoretical kinematic analysis, high-speed camera measurement, and kinematic simulation software.
Agronomy 10 01938 g016
Figure 17. Overlapping of trajectories of existing and optimized conditions.
Agronomy 10 01938 g017
Table 1. Specifications of the semi-automatic vegetable transplanter.
ItemsSpecification
ModelKP-100KR
Manufacturer, nationKUBOTA, Japan
EngineTypeGasoline
Rated power (kW)2.6
Rated speed (rpm)1550
Length/width/heightmm2150/1360/1130
Weightkg280
Plant spacingmm350–900
Rated working speedkm/h1.84
Working efficiencyh/10a1.5–2.5
Table 2. Types and elements of links and joints of the transplanting device.
LinkJoint
TypeElementsTypeElements
BinaryL2, L5, L6, L7,
L10, L11, L12, L13
RevoluteA–P
TernaryL3, L9
TernaryL3, L9Sliding
QuaternaryL4, L8
GroundL1
Table 3. Specifications of the high-speed camera.
ItemsSpecification
ModelNX4-S1
Manufacturer, nationIDT, USA
Maximum resolution (ppi)1024 × 1024
Maximum frame per second (fps)1000
Pixel size (μm)13.68 × 13.68
Table 4. Results of ANOVA between the theoretical kinematic analysis and simulation.
SourceSum of SquaresDegrees of FreedomMean SquareF-Valuep-Value
Model3348.8313348.832.920.088
Error652,286.145681148.39
Corrected total655,634.98569
Table 5. Results of ANOVA between theoretical kinematic analysis and high-speed camera measurement.
SourceSum of SquaresDegrees of FreedomMean SquareF-Valuep-Value
Model1549.1711549.171.210.271
Error725,596.725681277.46
Corrected total727,145.89569
Table 6. Optimal solution derived from the genetic algorithm.
Crank (mm)Coupler (mm)Rocker (mm)Sum of Lengths (mm)Sum Reduction Ratio
39.4984.2164.35188.0518.32%
Table 7. Results of ANOVA between existing and optimized conditions.
SourceSum of SquaresDegrees of FreedomMean SquareF-Valuep-Value
Model187.6791187.6790.1480.701
Error913,317.5567181272.030
Corrected total913,505.235719
Publisher’s Note: MDPI stays neutral with regard to jurisdictional claims in published maps and institutional affiliations.

