Abstract
Some recent papers have recommended moderate intensities of defoliation in order to maximize herbage intake at different time-scales. Most of them, however, did not assess the grazing dynamics of individual tillers during the stocking period. Therefore, the objective of this work was to describe the defoliation dynamics of kikuyugrass (Pennisetum clandestinum Hochst ex. Chiov) pastures subjected to different intensities of defoliation (40, 50, 60, and 70% of the initial height). Twelve 1500 m2 plots were strip-grazed over 24 h, and the frequency and severity of defoliation of individual tillers were assessed in 40 tagged tillers per experimental unit. From these data (n = 1920), we calculated the grazed area in the upper, second, and third horizon, and the total grazed area. We found that the frequency of defoliation by leaf category (expanding, mature, and senescent) increased linearly with the intensity of defoliation, and that reductions in extended tillers could not be used as a proxy to estimate the frequency of defoliation. Moreover, 22% of the second and third horizons were already exploited with intensities of defoliation of 40%, raising the possibility that the exploitation of lower grazing horizons could be more related to stocking density and relatively independent of the grazed area.
1. Introduction
Defoliation dynamics in pastures can be characterized by both the frequency and severity of defoliation of individual tillers [1]. The frequency of defoliation (probability for each plant unit, leaf lamina, or tiller, to be defoliated) is closely related to the average stocking density used within a period of time [2]; from this perspective, Wade [3] demonstrated that the frequency of defoliation is linearly related to the stocking density (in a log–log scale). The severity of defoliation (proportion of material removed at each bite event) is influenced by factors related to the canopy structure, such as height, bulk density, and the physical barrier imposed by the presence of stems [4,5,6]. However, a fairly constant proportion of removal (around 50% of the canopy height) at each bite event has been reported [2,7].
The proposition of grazing by horizons (layers) described by Ungar [8] and Baumont et al. [9] is also relevant for understanding the grazing dynamics, mainly in pastures under intermittent stocking. According to these authors, animals seek to harvest the first horizon (upper half, composed mostly of leaves) until approximately 70–75% of this horizon has been removed; in terms of the intensity of defoliation (proportion of canopy height removal), this would correspond to a reduction of approximately 40% of the pre-grazing height [10]. As herbage depletion increases beyond these levels, animals would progressively graze lower horizons composed of higher proportions of high tensile stems/pseudostems, which impairs bite formation [4,5,6]. Under these circumstances, animals may not present efficient compensatory mechanisms to maintain the intake rate [10,11] or daily herbage intake [12,13] at higher levels.
Some recent experiments have recommended moderate intensities of defoliation to maximize herbage accumulation [14], short-term herbage intake rate [10,11], daily herbage intake [13], and animal performance [15]. Despite the relevance of such studies, most of them did not assess the dynamics of defoliation in individual tillers and the exploitation of grazing horizons. According to Wade [3], information about defoliation dynamics can be considered a key factor in understanding the plant–animal interface. Therefore, the objective of this work was to describe the defoliation dynamics of pastures subjected to different intensities of defoliation and provide some insights into management targets for pastures under intermittent stocking.
2. Materials and Methods
2.1. Site, Treatments, and Plot Management
This study was conducted in Lages, SC, Brazil (27°47′ S, 50°18′ W), from January to February 2014, on a well-established 1.8 ha kikuyugrass pasture (Pennisetum clandestinum Hochst Chiov) divided into twelve 1500 m2 plots. Kikuyugrass is a stoloniferous perennial warm-season grass, well adapted to both tropical and subtropical regions [16,17] and well known for its high yield potential, good nutritive value, and excellent response to fertilization and irrigation [17,18]. According to the Koppen climate classification, the region has a Cfb-type climate (humid subtropical under oceanic influences) with cold winters, mild summers, and well-distributed rainfall throughout the year. During the experimental period, the monthly rainfall, minimum, maximum, and average temperatures were 183.2 mm, 15.5, 26.8, and 20.2 °C, respectively. The experimental area was established in the early 1990s and has been grazed by dairy cattle since then. In December 2013, plots were mowed to a 10-cm stubble height and fertilized with 140 kg N/ha. The grazing animals used in this protocol were Holstein (Bos taurus) heifers and dry cows well adapted to human presence. Cattle received no supplementation during the experimental period.
Four intensities of defoliation (depletion of 40, 50, 60, and 70% of an initial canopy height of 25 cm) were applied following a complete randomized block design with three replicates. The pre-grazing height was chosen based on Sbrissia et al. [19]. Because a concomitant protocol was conducted in the same area [13], plots had to be divided into four daily strips, and two of them were intended for our study. Thus, during the stocking period of a given plot, animals were moved to a new grazing area every morning (08:00 a.m.) by moving front and back fences. Both the offered strip area and the number of animals were adjusted daily to achieve a 4% live weight (LW) herbage allowance (2.0% of expected intake plus 2.0% for selection/loss opportunities) above the intended stubble height (15.0, 12.5, 10.0, or 7.5 cm). Herbage samples used to calculate herbage allowance are described below. The strip area ranged between 170 and 650 m2 and the number of animals per strip ranged between 2 and 7. The canopy heights were monitored with a sward stick [20] at 50 random points per evaluation, every 3 days during regrowth, and at pre- and post-grazing in each strip during the stocking period; also, 100 compressed canopy height readings per strip were performed at pre- and post-grazing, using a rising plate meter (model F200; Farmworks®, Feilding, New Zealand).
2.2. Herbage and Leaf Lamina Mass
Pre- and post-grazing herbage samples were collected using 0.1 m2 quadrats and scissors, at five random locations per strip (totaling 10 locations per plot); however, because the new strip had not been already delimitated, these samplings were always performed on the remaining plot area. At pre-grazing, each sample was stratified into an upper portion (grazing layer) and a lower portion (pre-grazing stubble) that corresponded to the intensity of defoliation in the plot. Stratifications did not occur at post-grazing, so the collected material was only classified as stubble. After collection, fresh samples were weighed. Then, they were bulked by time point (pre- and post-grazing) and strip, and two subsamples were taken. One of them was dried using a microwave oven [21,22] to determine the dry matter content (% DM) and finally calculate the herbage allowance (kg DM/ha). The other one was separated into its constituent plant-parts (leaf, stem + sheath, and senescent tissues), dried in a forced-air oven at 65 °C for 72 h, and weighed. From these data, it was possible to calculate herbage and leaf lamina mass (kg DM/ha).
2.3. Defoliation Dynamics
Defoliation dynamics was evaluated using the tagged tiller technique [23]. For this purpose, 20 tillers were tagged with colored plastic rings along four transect lines placed on representative areas of the strips (determined by visual assessment of herbage mass and height). In addition, their leaves were numbered. These tillers were evaluated four times during the grazing period of each strip: (1) pre-grazing (at 8:00 a.m.), (2) after the first grazing session (at 12:00 noon), (3) after the second grazing session (at 6:00 p.m.), and (4) post-grazing (at 8:00 a.m. on the following day). In each assessment, leaves were classified as senescent, mature (with visible ligule), or expanding (without a visible ligule), intact or defoliated, and they had their lamina length measured. On mature or senescent leaves, the length was taken from the tip of the leaf to its ligule or to the point where the senescence process had affected, respectively. On expanding leaves, the procedure was the same except that the ligule of the last mature or senescent leaf was used as a reference [24]. Measurements of the pseudostem length were taken from the point of origin of the tagged tiller (soil level) to the ligule of the last expanded leaf, and the extended tiller length was measured by vertically arranging all of the leaves from each tiller and pulling them upwards.
The frequency and severity of defoliation were evaluated according to leaf category (expanding, mature, or senescing), tiller (as a whole), extended tiller, and pseudostem. We considered as a bite event any length reduction of these abovementioned structures. In addition, the total grazed area, the grazed area of the first (upper) horizon, the grazed areas of the second and third horizons, and the total grazed area in the lower horizons (sum of the second and third horizons) were compared. The calculations were performed as follows:
2.3.1. Frequency of Defoliation
This was calculated by the number of bite events on individual tillers by leaf category, extended tiller, or stem to the number of tagged tillers, and the evaluation period (in our case, 1 day):
Frequency of defoliation = number of defoliations events/number of tagged tillers/day.
2.3.2. Severity of Defoliation
This was calculated by dividing the length of the defoliated material (leaf category or extended tiller) and the length of the evaluated material immediately before the bite event:
Intensity of defoliation (%) = ((pre-defoliation length − post-defoliation length)/pre-defoliation length) × 100.
2.3.3. Total Grazed Area
The total grazed area (% of the total strip area) was calculated by quantifying the defoliated tillers throughout the evaluation period relative to the number of tagged tillers.
Grazed area (%) = ((number of defoliated tillers/number of tagged tillers) × 100)/day.
2.3.4. Exploitation of Grazing Horizons
To detect the exploitation of different grazing horizons throughout the grazing period, it was considered that the first bite event on a given tiller was related to the exploitation of the first (upper) horizon and that successive bite events on the same tiller were related to the exploitation in the lower strata [2,9]. Thus, the area that was grazed only once (% of the total grazed area) represented the percentage of grazing exclusively in the first horizon; the area that was grazed twice (% of the total grazed area) represented the percentage of grazing in the second horizon, and the area that was grazed three times represented the percentage of grazing in the third horizon. To this end, we used the following calculations:
Area exclusively grazed in the first horizon (% of the total grazed area) = ((number of tillers defoliated only once/number of defoliated tillers) × 100)/day
Area grazed up to the second horizon (% of total grazed area) = ((number of tillers defoliated twice/number of defoliated tillers) × 100)/day
Area grazed up to the third horizon (% of total grazed area) = ((number of tillers defoliated three times/number of defoliated tillers) × 100)/day
Furthermore, it was assumed that the total grazed area in the lower horizons (as a function of the total grazed area) represented the sum of the areas grazed up to the second and third horizons:
Total grazed area in lower horizons (% of total grazed area) = area grazed up to the second grazed horizon + area grazed up to the third horizon
2.4. Statistical Analisys
The data from each strip were considered as repetitions, arranged according to the mean of the plots, and then subjected to the Kolmogorov-Smirnov test to identify possible deviations from normality. We performed an analysis of variance (ANOVA) using the GLM (general linear model) procedure of the statistical package SAS (Statistical Analysis System, version 9.0; SAS institute Inc., Cary, NC, USA). Orthogonal polynomial contrasts were used (linear, quadratic, and cubic) to determine the nature of the responses to defoliation intensities. Equidistance between defoliation intensities was not achieved. Therefore, the coefficients were generated by PROC IML in SAS [13,25,26]. The significance level was set at 5% (p < 0.05).
3. Results
3.1. Canopy Height, Herbage Mass, and Intensity of Defoliation
The intensities of defoliation observed in our experiment were lower than those originally intended (Table 1). However, the observed intensity of defoliation increased linearly with the treatments, and the same pattern was obtained with other variables (herbage mass, leaf lamina mass, and compressed canopy height (Table 1)). In this way, the data in Table 2 and Table 3 were analyzed and presented according to the observed intensity of defoliation.

Table 1.
Some average canopy characteristics at pre- and post-grazing in kikuyugrass pastures subjected to different intensities of defoliation.
Table 2.
Frequency and severity (in each bite event) of defoliation by leaf category, pseudostem, and extended tiller in kikuyugrass pastures subjected to different intensities of defoliation.
Table 3.
Grazed area in kikuyugrass pastures subjected to different intensities of defoliation.
3.2. Defoliation Dynamics
The frequency of defoliation by leaf category was linearly related to the intensity of defoliation (Table 2). Thus, the frequency of defoliation on expanding leaves increased from 33% to 73% when the intensity of defoliation increased from 40% to 62%. For senescent leaves, the lowest frequency of defoliation was observed in plots defoliated at 40%, and it increased by 175% under more severe defoliation (62%). A similar result was observed for the frequency of defoliation of the pseudostem, which increased by 200% from the lowest to highest intensity of defoliation. Although it was not compared statistically, expanding leaves had a higher frequency of defoliation than the other categories (expanded and senescent leaves), regardless of the treatment (Table 2). When the severity of defoliation was evaluated by leaf category, only the expanded leaves differed between treatments (Table 2). On average, the extended tiller was defoliated at a severity of 36% in each bite event, regardless of treatment (Table 2).
4. Discussion
According to Lemaire and Chapman [1], grazing dynamics can be characterized by both the frequency and severity of defoliation of individual tillers. The severity of defoliation results from the bite depth and it is influenced by factors related to the canopy structure, such as height, bulk density, and the physical barrier imposed by the presence of stems [4,5,6]. Despite some controversy about the results as well as the methodology for estimating this variable, a fairly constant proportion of removal at each bite event has been reported [2,7,23,27,28,29]. According to Lemaire et al. [2], assuming that the length of the stem + pseudostem is 33% of the extended tiller, and that 35% of the extended tiller is removed during each defoliation, it is expected that on average, approximately 50% of the leaf lamina length would be removed at each bite event. In fact, in our experiment, approximately 36% of the extended tiller was removed at each bite event regardless of the intensity of defoliation (Table 2); however, a higher proportion of leaf lamina was removed across treatments (approximately 70%; Table 2). This is because (i) most of the upper leaves were fully removed at the first bite event (data not presented), increasing the overall severity of defoliation, and (ii) the extended tiller height may fail to detect a bite event (as discussed below).
Wade [3] found that increasing the stocking density resulted in a more frequent defoliation; this relationship was linear (in a log–log scale) regardless of the stocking method (continuous, rotational, or strip-grazing). Furthermore, the log–log relationship presented by this author had a slope of 0.82, indicating that if the stocking density was doubled, then the frequency of defoliation would only increase by a factor of 1.6. We also observed the same relationship (Figure 1); the slope, however, was lower (0.54) than that reported by the abovementioned author and indicates that the frequency of defoliation increased at an even smaller rate in relation to the stocking density. A possible explanation for such disproportionality is that animals apparently cease grazing at some point during the occupation period (already reported by Schmitt et al. [13]) at intensities of defoliation of 58% and 62%, thus reducing the frequency of defoliation of individual tillers. Moreover, reductions in the bite area or bite rate, because animals are led to graze into lower canopy horizons [9,30], or a greater spatial competition between animals as stocking density increases [2], may have also influenced such reductions in the frequency of defoliation.
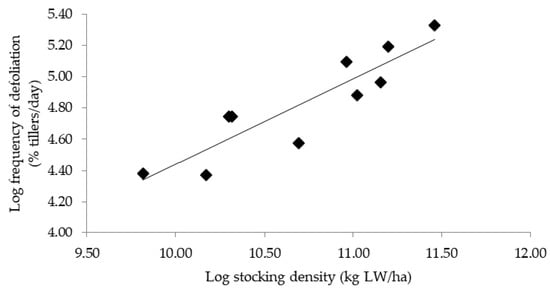
Figure 1.
Relationship between frequency of defoliation of individual tillers and stocking density in kikuyugrass pastures subjected to different intensities of defoliation (y = 0.54x − 1.05; R2 = 0.80).
We observed differences between the values of the frequency of defoliation calculated from reductions in the extended tiller height and from reductions in any leaf category, where the former was systematically lower than the latter (Figure 2). Although larger leaves are more likely to be defoliated [31], and the extended tiller is generally measured in terms of the length of these leaves, the evaluation of the frequency of defoliation based on reductions in extended tiller height can eventually fail to detect a bite event when, for example, the leaves that do not determine extended tiller height are grazed. Thus, care should be taken when interpreting the frequency of defoliation of individual tillers when the assessment is based on the extended tiller technique, as these values may be underestimated. On the other hand, estimating the frequency of defoliation from individual leaves seems to detect bite events more precisely and enables to determine the frequency of defoliation per leaf category and/or structure (e.g., stems or pseudostems). Thus, expanding or mature leaves had a higher probability of being defoliated than senescent leaves or pseudostems, regardless of the defoliation severity (Table 2). This is because expanding and matures leaves occupy the upper canopy strata, whereas senescent leaves or pseudostems are located in the lower ones. Finally, higher intensities of defoliation increased the frequency of senescent leaves and pseudostems being defoliated (Table 2), suggesting that the selection of better structures (such as expanding leaves) by the animals is limited when intensities of defoliations greater than 50% are used.
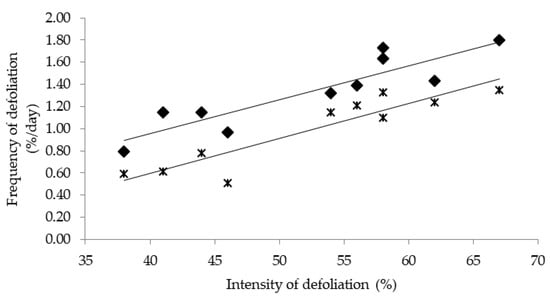
Figure 2.
Relationship between the frequency of defoliation and the intensity of defoliation detected from reductions in leaf length (♦; y = 0.03x − 0.27; R2 = 0.81) or in extended tiller length (ж; y = 0.03x − 0.65; R2 = 0.84).
Some papers have recommended intensities of defoliation of up to 40% in order to maintain the herbage intake rate [10,11] and daily herbage intake [13] at its maximum. According to these authors, beyond this point, the animals would exploit lower grazing horizons. In our paper, we found that the exploitation of lower horizons may occur before the animals defoliate around 40% of the pre-grazing height, indicating that under those circumstances, some proportion (according to our data, around 22%; Table 3) of the lower horizon could be grazed without, hypothetically, affecting the herbage intake. Moreover, assuming that the same low level of defoliation (40%) is applied in a given pasture during the growing season and that ungrazed areas are not necessarily the same, a progressive increase in the rejected areas and, consequently, in the exploitation of lower horizons could be expected. Therefore, from this perspective, the exploitation of lower grazing horizons could be more related to stocking density and relatively independent of the grazed area. Further investigations, however, should be performed to validate this hypothesis.
5. Conclusions
Based on our findings, we conclude that: (i) reductions in extended tiller height can fail to detect the frequency of defoliation and should be used with caution to draw inferences about grazing management strategies; (ii) the exploitation of lower grazing horizons may occur even when using moderate intensities of defoliation (as 40% of the pre-grazing height). Finally, further investigations should be performed considering the hypothesis that the exploitation of grazing horizons could be more related to the stocking density and relatively independent of the grazed area.
Author Contributions
Conceptualization, A.F.S., D.S., and C.M.-N.; methodology, A.F.S., D.S., and C.M.-N.; formal analysis, C.M.-N.; investigation, D.S., C.M.-N., J.D., and C.D.M.M.; data curation, C.M.-N. and J.D.; writing—original draft preparation, C.M.-N.; writing—review and editing, A.F.S., D.S., and C.M.-N.; supervision, A.F.S.; project administration, A.F.S., D.S., and C.M.-N.; funding acquisition, A.F.S. All authors have read and agreed to the published version of the manuscript.
Funding
This research was funded by FAPESC (grant number 2019 TR 584).
Conflicts of Interest
The authors declare no conflict of interest.
References
- Lemaire, G.; Chapman, D. Tissue fluxes in grazing plant communities. In The Ecology and Management of Grazing Systems, 1st ed.; Hodgson, J., Illius, A.W., Eds.; CABI Publishing: Wallingford, UK, 1996; pp. 3–36. [Google Scholar]
- Lemaire, G.; Da Silva, S.C.; Agnusdei, M.; Wade, M.; Hodgson, J. Interactions between leaf lifespan and defoliation frequency in temperate and tropical pastures: A review. Grass Forage Sci. 2009, 64, 341–353. [Google Scholar] [CrossRef]
- Wade, M.H. Factors Affecting the Availability of Vegetative Lolium Perenne to Grazing Dairy Cows with Special Reference to Sward Characteristics, Stocking Rate and Grazing Method. Ph.D. Thesis, University of Rennes, Rennes, France, 1 March 1991. [Google Scholar]
- Flores, E.R.; Laca, E.A.; Griggs, T.C.; Demment, M.W. Sward height and vertical morphological differentiation determine cattle bite dimensions. Agron. J. 1993, 85, 527–532. [Google Scholar] [CrossRef]
- Ginnett, T.F.; Dankosky, J.A.; Deo, G.; Demment, M.W. Patch depression in grazers: The roles of biomass distribution and residual stems. Funct. Ecol. 1999, 13, 37–44. [Google Scholar] [CrossRef]
- Benvenutti, M.A.; Gordon, I.J.; Poppi, D.P. The effect of the density and physical properties of grass stems on the foraging behavior and instantaneous intake rate by cattle grazing an artificial reproductive tropical sward. Grass Forage Sci. 2006, 61, 272–281. [Google Scholar] [CrossRef]
- Carvalho, P.C.F. Harry Stobbs Memorial Lecture: Can grazing behavior support innovations in grassland management? Trop. Grassl. Forrajes Trop. 2013, 1, 137–155. [Google Scholar] [CrossRef]
- Ungar, E.D. Changes in bite area and bite depth during patch depletion by cattle. In Proceedings of the IXth European Intake Workshop, North Wyke, UK, 18–20 November 1998; Gibb, M.J., Ed.; IGER: Aberystwyth, UK, 1998. [Google Scholar]
- Baumont, R.; Cohen-Salomon, D.; Prache, S.; Sauvant, D. A mechanistic model of intake and grazing behaviour in sheep integrating sward architecture and animal decisions. Anim. Feed Sci. Technol. 2004, 112, 5–28. [Google Scholar] [CrossRef]
- Mezzalira, J.C.; Carvalho, P.C.F.; Fonseca, L.; Bremm, C.; Cangiano, C.; Gonda, H.L.; Laca, E.A. Behavioural mechanisms of intake rate by heifers grazing swards of contrasting structures. Appl. Anim. Behav. Sci. 2014, 153, 1–9. [Google Scholar] [CrossRef]
- Fonseca, L.; Mezzalira, J.C.; Bremm, C.; Filho, R.S.A.; Gonda, H.L.; Carvalho, P.C.F. Management targets for maximising the short-term herbage intake rate of cattle grazing in Sorghum bicolor. Livest. Sci. 2012, 145, 205–211. [Google Scholar] [CrossRef]
- Ribeiro Filho, H.M.N.; Setelich, E.A.; Crestani, S.; Dias, K.M.; Mantovani, C.; Valenti, J. Relationship between diurnal grazing time and herbage intake in dairy cows in rotational grazing. Cienc. Rural 2011, 41, 2010–2013. [Google Scholar] [CrossRef]
- Schmitt, D.; Padilha, D.A.; Medeiros-Neto, C.; Ribeiro Filho, H.M.N.; Sollenberger, L.E.; Sbrissia, A.F. Herbage intake by cattle in kikuyugrass pastures under intermittent stocking method. Rev. Cienc. Agron. 2019, 50, 493–501. [Google Scholar] [CrossRef]
- Martins, C.D.M.; Schmitt, D.; Duchini, P.; Miqueloto, T.; Sbrissia, A.F. Defoliation intensity and leaf area index recovery in defoliated swards: Implications for forage accumulation. Sci. Agric. 2021, 78, e20190095. [Google Scholar] [CrossRef]
- Euclides, V.P.B.; Carpejani, G.C.; Montagner, D.B.; Nascimento Junior, D.; Barbosa, R.A.; Difante, G.S. Maintaining post-grazing sward height of Panicum maximum (cv. Mombaça) at 50 cm led to higher animal performance compared with post-grazing height of 30 cm. Grass Forage Sci. 2018, 73, 174–182. [Google Scholar] [CrossRef]
- Marais, J.P. Factors affecting the nutritive value of kikuyu grass (Pennisetum clandestinum)—A review. Trop. Grassl. 2001, 35, 65–84. [Google Scholar]
- García, S.C.; Islam, M.R.; Clark, C.E.F.; Martin, P.M. Kikuyu-based pasture for dairy production: A review. Crop Pasture Sci. 2014, 65, 787–797. [Google Scholar] [CrossRef]
- Fulkerson, W.J.; Lowe, K.F. Perennial forage and pasture crops—establishment and maintenance. In Encyclopedia of Dairy Science, 2nd ed.; Roginsky, H., Fuquay, J.W., Fox, P.F., Eds.; Academic Press: Waltham, MA, USA, 2003; pp. 1124–1131. [Google Scholar]
- Sbrissia, A.F.; Duchini, P.G.; Zanini, G.D.; Santos, G.T.; Padilha, D.A.; Schmitt, D. Defoliation Strategies in Pastures Submitted to Intermittent Stocking Method: Underlying Mechanisms Buffering Forage Accumulation over a Range of Grazing Heights. Crop Sci. 2018, 58, 945–954. [Google Scholar] [CrossRef]
- Bartham, G.T. Experimental techniques: The HFRO sward stick. In Biennial Report of the Hill Farming Research Organization; Alcock, M.M., Ed.; HFRO: Midlothian, UK, 1985; pp. 29–30. [Google Scholar]
- Oetzel, G.R.; Villalba, F.P.; Goodger, W.J.; Nordlund, K.V. A comparison of on-farm methods for estimating the dry-matter content of feed ingredients. J. Dairy Sci. 1993, 76, 293–299. [Google Scholar] [CrossRef]
- Penning, P.D. Animal based techniques for estimating herbage intake. In Herbage Intake Handbook, 2nd ed.; Penning, P.D., Ed.; British Grassland Society: Cheshire, UK, 2004; pp. 53–93. [Google Scholar]
- Hodgson, J. The frequency of defoliation of individual tillers in a set stocked sward. Grass Forage Sci. 1966, 21, 258–263. [Google Scholar] [CrossRef]
- Duru, M.; Ducrocq, H. Growth and senescence of the successive leaves on a cocksfoot tiller. Effect of nitrogen and cutting regime. Ann. Bot. 2000, 85, 645–653. [Google Scholar] [CrossRef]
- Kaps, A.M.; Lamberson, W.R. Biostatistics for Animal Science, 2nd ed.; CABI Publishing: Wallingford, UK, 2009; 504p. [Google Scholar]
- Miguel, M.F.; Ribeiro-Filho, H.M.N.; Andrade, E.A.; Genro, T.C.M.; Delagarde, R. Pasture intake and milk production of dairy cows grazing annual ryegrass with or without corn silage supplementation. Anim. Prod. Sci. 2014, 54, 1810–1816. [Google Scholar] [CrossRef]
- Greenwood, E.A.N.; Arnold, G.W. The quantity and frequency of removal of herbage from an emerging annual grass sward by sheep in a set stocked system of grazing. Grass Forage Sci. 1968, 23, 144–148. [Google Scholar] [CrossRef]
- Hodgson, J.; Ollerenshaw, J.H. The frequency and severity of defoliation of individual tillers in set-stocked swards. Grass Forage Sci. 1969, 24, 226–234. [Google Scholar] [CrossRef]
- Wade, M.H.; Carvalho, P.C.F. Patterns of defoliation and herbage intake on pastures. In Grassland Ecophysiology and Grazing Ecology, 1st ed.; Lemaire, G., Hodgson, J., De Moraes, A., Carvalho, P.C.F., Nabinger, C., Eds.; CABI Publishing: Wallingford, UK, 2000; pp. 233–263. [Google Scholar]
- Ungar, E.D.; Genizi, A.; Demment, M.V. Bite dimensions and herbage intake by cattle grazing short hand-constructed swards. Agric. J. 1991, 83, 973–978. [Google Scholar] [CrossRef]
- Bartham, G.T.; Grant, S.A. Defoliation of ryegrass-dominated swards by sheep. Grass Forage Sci. 1984, 39, 211–219. [Google Scholar] [CrossRef]
Publisher’s Note: MDPI stays neutral with regard to jurisdictional claims in published maps and institutional affiliations. |
© 2020 by the authors. Licensee MDPI, Basel, Switzerland. This article is an open access article distributed under the terms and conditions of the Creative Commons Attribution (CC BY) license (http://creativecommons.org/licenses/by/4.0/).