Article

Biochar Alters Soil Physical Characteristics, Arbuscular Mycorrhizal Fungi Colonization, and Glomalin Production

1
Centre for Agricultural Research, Institute of Soil Sciences and Agricultural Chemistry, Herman O. St. 15, 1022 Budapest, Hungary
2
Georgikon Campus, Szent István University, Deák F. St. 16, 8360 Keszthely, Hungary
3
Institute of Agrophysics, Polish Academy of Sciences, Doswiadczalna 4, 20-290 Lublin 27, Poland
*
Author to whom correspondence should be addressed.
Agronomy 2020, 10(12), 1933; https://doi.org/10.3390/agronomy10121933
Submission received: 30 October 2020 / Revised: 7 December 2020 / Accepted: 7 December 2020 / Published: 9 December 2020
(This article belongs to the Special Issue Impact of Biochar and Compost on Soil Quality and Crop Yield)

Abstract

:
Soil enhancements such as biochar (BC) are gaining attention as tools to mitigate climate change and also to promote crop growth. However, biochar use can disrupt soil ecosystems by changing the soil’s physical, chemical, and biological properties. The study aimed to determine how biochar influences soil physical changes such as specific surface area (SSA) and water vapor sorption, and how these conditions affect arbuscular mycorrhizal fungal (AMF) hyphae growth and glomalin production. The study analyzed these factors at different plant phenological phases (i.e., flowering, development of fruit, and ripening of fruit and seed) to better understand the changes within the system while varying biochar amounts. The study also investigated the effect of different soil physical and chemical parameters on mycorrhizal hyphae growth and glomalin production. Four treatments were investigated: 0, 0.5%, 2.5%, and 5.0% (w/w) biochar amended silt loam soil planted with pepper. Soil samples were taken at the beginning and weeks 6, 10, and 12 of the study. The amount of adsorbed water vapor increased with an increasing amount of biochar added to the soils. Compared to control, SSA was significantly higher in all biochar amended treatments based on adsorption data, and only in the highest biochar amended soils for the desorption data at the end of the experiment. The presence of AMF in the roots appeared at week 6 of the experiment and the intensity of AMF root colonization increased with the age of plants. The AMF colonization parameters were significantly lower in BC2.5 compared to all other biochar amended soils. The abundance of intraradical AMF structures was highly correlated with several physicochemical soil parameters, such as SSA, the geometric mean diameter of soil aggregate, soil aggregate sizes, or pH. Glomalin production was negatively correlated with SSA, water vapor adsorption, aggregate stability, aggregate size, total nitrogen, potassium, and organic carbon content of the soil, while positive correlation was observed with bulk density. Increased biochar amount resulted in a significant decrease in glomalin production, concurrent with the age of the plants. Our results highlight the great complexity of interactions between soil physicochemical and biological parameters, and the importance of the time of sampling when biochar is used in soil, as the effects of biochar additions on the plant, soil physical characteristics, and soil microsymbionts vary over time.

1. Introduction

Biochar addition to soils might have the potential to mitigate climate change, to sequester carbon in soils, but mostly to improve crop production. Hence, recent studies investigate biochar production and its use especially in the agricultural environment. Biochar production from unused organic materials can also lessen waste generation [1]. The application of biochar can greatly influence the soil’s physical [2,3,4,5], chemical [6,7], and biological properties [8,9]; therefore, careful evaluation of its use is necessary.
The specific surface area (SSA) is defined as the surface area of all particles in the sample, usually expressed per unit of mass. When concerning processes taking place at solid–gas phase boundaries, the specific surface area can be viewed as the surface accessible to gas molecules and encompasses the external and internal surfaces of a solid body. The surfaces are mainly determined by the size, shape, porosity, layer composition or molecular structure of the solid particles [10]. Therefore, both mineral and organic soil components are involved in the development of this property [11]. This can then further affect the physical and physicochemical nature of the soils such as reactivity during adsorption phenomena, an organization of constituents in aggregates, or hydrodynamic characteristics [11]. The specific surface area (SSA) also affects the biological activities in soils [12], as the larger surface area enables more colonization of indigenous microorganisms. Biochar amendment can increase water retention as a result of increasing SSA [13]. The higher water retention can provide better environmental conditions for plants under drought prone areas. However, no impact on soil moisture content, or higher water retention combined with faster drying of soils with biochar amendment had been also reported [14,15]. The specific surface area is an important soil physical parameter that needs to be investigated in relation to the soil–plant system. While there are many studies available in the literature investigating the water-holding capacities of different biochar-amended soils, the dynamics of water uptake is much less studied [16]. The method assumes the determination of adsorption/desorption isotherms and the designation of the specific surface area (S) on the basis of the Brunauer–Emmett–Teller (BET) equation [17]. The sorption data from biochar-treated soil provide important information on SSA [18], which might influence the water and nutrients uptake of the plant from the given soil particle surface [19]. With the help of water vapor adsorption/desorption isotherms we can determine the external and internal surfaces of the soils [20]. The N2 isotherms can provide information about the size of the external surface [21,22].
Formation and stability of soil aggregates are influenced by a large number of soil borne biotic and abiotic factors including soil organic matter (SOM), soil moisture, the community structure and the activity of soil fauna, microbiome and plant species, tillage and fertilization [23,24,25,26,27]. Plants and soil microbiome including arbuscular mycorrhizal fungi (AMF) contribute to soil carbon storage and when roots exert some pressure on soil particles, secrete exudates that significantly affects aggregate formation [28]. Glomalin is a glycoprotein that acts like a glue enhancing soil aggregation, it is secreted by AMF hyphae and becomes an essential part of SOM fraction called glomalin-related soil protein (GRSP) [29,30]. Glomalin is extremely stable due to its insolubility in water and its resistance to microbial degradation [28]. Close relationships were found between intraradical AMF colonization, extraradical hyphae, GRSP, and water-stable macroaggregate contents of soils [31,32].
In the available literature, the effects of biochars on AMF infectivity and efficacy are quite controversial [33,34]. There are four possible ways biochar might affect AMF:
(i)
Biochar may change the levels and availability of nutrients (C, N, P, K) by changing the physicochemical parameters of the soil (e.g., cation exchange capacity, pH, water holding capacity), which affect both the host plant and the fungus.
(ii)
Biochar may change the rhizosphere microbiome that may promote plant growth (e.g., mycorrhizal helper bacteria, phosphate mobilizing bacteria).
(iii)
Biochar may alter the processes of plant-AMF signaling (transport and concentration of signal molecules) or the absorption of allelochemicals leading to changes in AM fungal root colonization.
(iv)
Biochar may serve as a microrefugia and shelter for hyphae consumers.
The soil physical and mycorrhizal changes over different plant phenological phases as a result of biochar application can provide an insight into complex soil functioning. The present study aimed to find connections between soil physical and biological changes as a result of biochar application, over time. We assumed that the numerous beneficial properties of biochar for soil and plants such as high specific surface area, porous structure, or nutrients availability, would enhance AMF colonization and glomalin production by providing suitable AMF habitats. Based on earlier studies [2], we also hypothesized that different plant growth phases and biochar amounts would affect differently the soil physical properties, especially the SSA, and thus consequently influence the AMF colonization of the plant roots. We attempt to explain the extent of these changes and correlations between soil physicochemical properties on the progress of AMF hyphal spread. As the present study was a part of a larger experiment, numerous data on edaphic factors were retrieved and used to investigate the connections between soil chemical and physical parameters, AMF infection and glomalin yield.

2. Materials and Methods

2.1. General Soil and Experimental Sites’ Data

The present study is a part of a more complex study investigating the effects of biochar addition to the soil’s biological, chemical, and physical parameters [2,8,15].
Soil samples were collected from a slightly eroded and tilled agricultural field, which is a Calcaric Cambisol, Loamic, according to WRB (2014). The soil was formed on loess, and its local name is Raman brown earth. The samples were taken from the soil layer of 0–30 cm on 5 June 2016, which corresponded to the tillage depth at the sample collection site (46.92936° N, 17.67033° E). The soil was gently homogenized prior to using in the experiment to ensure each plant will have the same soil chemical and physical parameters per treatment. The general meteorological data for the area are: annual average precipitation is 604 mm, the average annual temperature is 10.9 °C, and the average wind speed is 3 m s−1 [35]. During the experiment (11 June 2016–4 September 2016) the average daily temperature was 24.9 °C, ranging between 11.8 °C and 27.6 °C. The total amount of precipitation, including additional irrigation during dry periods, was 248.8 mm. Further information on how the precipitation and irrigation events were occurring is described by Horel et al. [15].
Partial soil chemical and physical parameters (Table 1) were retrieved from earlier studies, which we used to investigate possible connections between the soil physical, chemical, and biological interactions (i.e., mycorrhizal hyphae growth and glomalin production). All data used in the correlation analyses are available in the supplementary tables (Tables S1–S5).

2.2. Biochar Used in the Experiment

Biochar used in the experiment was provided by SonnenErde Gmbh, Austria. According to the manufacturer, the biochar was made from wood chips, fiber sludge, and grain husks using Pyreg-reactor technology at 600 °C [8].

2.3. Experimental Setup

Detailed information on the experimental design can be found in Makó et al. [2] and Pokovai et al. [8]. Briefly, four biochar amended treatments (control (C), BC0.5, BC2.5 and BC5.0) were investigated in 7 replicates planted with Capsicum annuum L. var. grossum (pepper) in the soil at the start of the experiment. BC0.5, BC2.5 and BC5.0 received 0.5%, 2.5%, and 5.0% biochar by weight, respectively, while control treatments received no biochar. The chosen amounts were determined based on earlier laboratory experiments and literature review [37,38].
The pepper plants were grown from seeds prior to the experiment. After the plants reached the four-leaf stage they were planted into pots (with dimensions of 14 cm in height and an 18 cm diameter with a drain outlet). Each pot received two plants, where each treatment included the total plant numbers of 14, ensuring that similar plant height and development phase were present in all treatments at the beginning of the experiment. All pots included 2 kg of soil or soil/biochar mixture (dry weight). Fertilizer (N:P:K of 20:20:20 in a concentration equal to 400 mg kg−1 soil [39], manufacturer Elixir Zorka, Serbia) was added to the soil during the third week of the experiment to eliminate nutrient limitations over the course of the study.
Randomly selected pots were disassembled at distinguished plant phenological stages [40]. The plant phenological stages were as follows: the formation of side shoots and inflorescence emergence during week 3, the flowering during week 6, the development of fruit during week 10, and the ripening of fruit and seed during week 12 (hereafter W3, W6, W10, and W12, respectively). The collected samples were used to study the changes in AMF colonization, and easily-extractable glomalin production and W6, W10, and W12 to analyze differences in SSA and water vapor adsorption between treatments.

2.4. Soil Physical Measurements—Water Vapor Sorption and Soil Specific Surface Area

The hygroscopic water content was determined according to the Sík method (hy1). The hy1 is a fast method, where monomolecular vapor adsorption can be assumed, so the external and internal specific surface area can be deduced from the amount of adsorbed water vapor. Air-dried samples of 4 g were put into a desiccator for 14 days, where the constant humidity was 31.5% achieving using CaCl2 ∗ 6 H2O [41]. Samples were prepared in triplicate, and the constant room temperature was kept at 20 °C. After two weeks, the samples were weighed with an analytical balance, and then oven dried at 105 °C for 24 h and weighed again.
The adsorption/desorption isotherms of water vapor were obtained by the gravimetric method in the accordance with the Polish standard procedure PN-Z-19010-1 [42]. The soil and biochar mixture samples of the weight equal to 4 g were put into a glass vessel and placed over sulfuric acid solution with step-wise increasing (adsorption step) and decreasing (desorption step) concentration of the sulfuric acid solution. The samples were equilibrated at each point of adsorption/desorption for two days. The amount of adsorbed/desorbed water vapor was computed as the difference between the sample with water and sample dried at 105 °C temperature. The measurements were replicated three times in constant temperature conditions (20 °C).
The determination of the specific surface area was based on the application of the Brunauer–Emmett–Teller (BET) equation:
x N ( 1 x )   =   1 C B E T N m   +   C B E T   1 C B E T N m
where N is the amount of adsorbed water vapor, and CBET is a constant. When the equation is applied to the adsorption data in the range of relative pressures 0 < p/p0 > 0.35, x = p/p0, it allows the monolayer capacity (Nm) to be obtained. The specific surface area (SSAwv) can be calculated from the dependence:
SSAwv = Nm·M−1·L·σ
where L is the Avogadro number (6.022 × 10²³ molecules per mole), M is the molecular weight of vapor (gram per mole) and σ is the molecule cross-sectional area (10.8 × 10⁻²⁰ m2 for water molecule). SSAads and SSAdes are the soil specific surface areas determined from adsorption and desorption data, respectively. Using this method, external and internal surfaces of the samples were calculated.
Soil specific surface area was determined by physical adsorption using a Mircomeritics Flowsorb 2300 II instrument (SSAN2). A DeSorb 2300A unit was used to thermally remove all vapors and gases from the inserted samples prior to the actual measurements. High purity nitrogen gas (5.0) was passed through the soil particles to clean the samples. Next, the prepared samples were placed into the test station of Flowsorb II. 2300, where the adsorption was performed at liquid nitrogen temperature with a helium-nitrogen gas mixture containing 29.6% nitrogen. Then, the volume of the adsorbed gas was measured. The results of the specific surface area measurements were processed using the BET Equation (1). As nitrogen is non-polar, we could gather information about the external surfaces of the soil particles [43].

2.5. Arbuscular Mycorrhizal Fungal (AMF) and Glomalin Measurements

After washing with tap water, the root samples were cleared and stained by aniline blue according to modified method of Phillips and Hayman [44]. In total, 30 pieces of 1 cm root segments were examined by light microscope (20–200X; BX51 Olympus, Tokyo, Japan). The AMF root colonization intensities were classified by colonization intensity (M%) and absolute arbuscular richness (arbuscule abundance in the root system, A%) according to the five class method of Trouvelot et al. [45]. The AMF infection measurements were performed on samples collected at W3, W6, W10, and W12 of the experiment. Plant roots were not analyzed at the time of planting (W0).
Coomassie Brilliant Blue dye binds to glomalin-related soil proteins (GRSP) that causes a shift in the absorption maximum of the dye from 465–595 nm [46]. Soil samples of 1 g (<1 mm and 1–2 mm fractions) from all treatments at W3, W6 and W10, the easily-extractable glomalin (EEG) were acquired by washing in 8 mL 20 mM pH 7.0 Na-citrate buffer at 121 °C temperature for 30 min [47]. The EEG-GRSP content was measured with Quick Start™ Bradford protein assay kit (Bio-Rad Laboratories Hercules, CA, USA). 2.5 mL Bradford reagent was given to 500 μL extracted GRSP. After 5 min incubation at room temperature, absorption was measured at 595 nm with a Helios ß v4.60 spectrophotometer (Thermo Spectronics Fisher Scientific UK).

2.6. Statistical Analyses

An independent-sample t-test and one-way analysis of variance (ANOVA, Duncan test or Tamhane’s test depending on the homogeneity of variances examined by Levene’s test) and Boxplot analysis were conducted to compare the effects of biochar amendment and time on the measured soil physical or biological parameters. Pearson’s correlation coefficient (r) was used to evaluate the linear correlation between the soil, soil/biochar mixtures’ physical or chemical properties and the biological parameters. All statistical calculations were performed using either SPSS 13.0 or the software package R (version 4.0.2). Statistical significance of the data sets was determined at p < 0.05.

3. Results

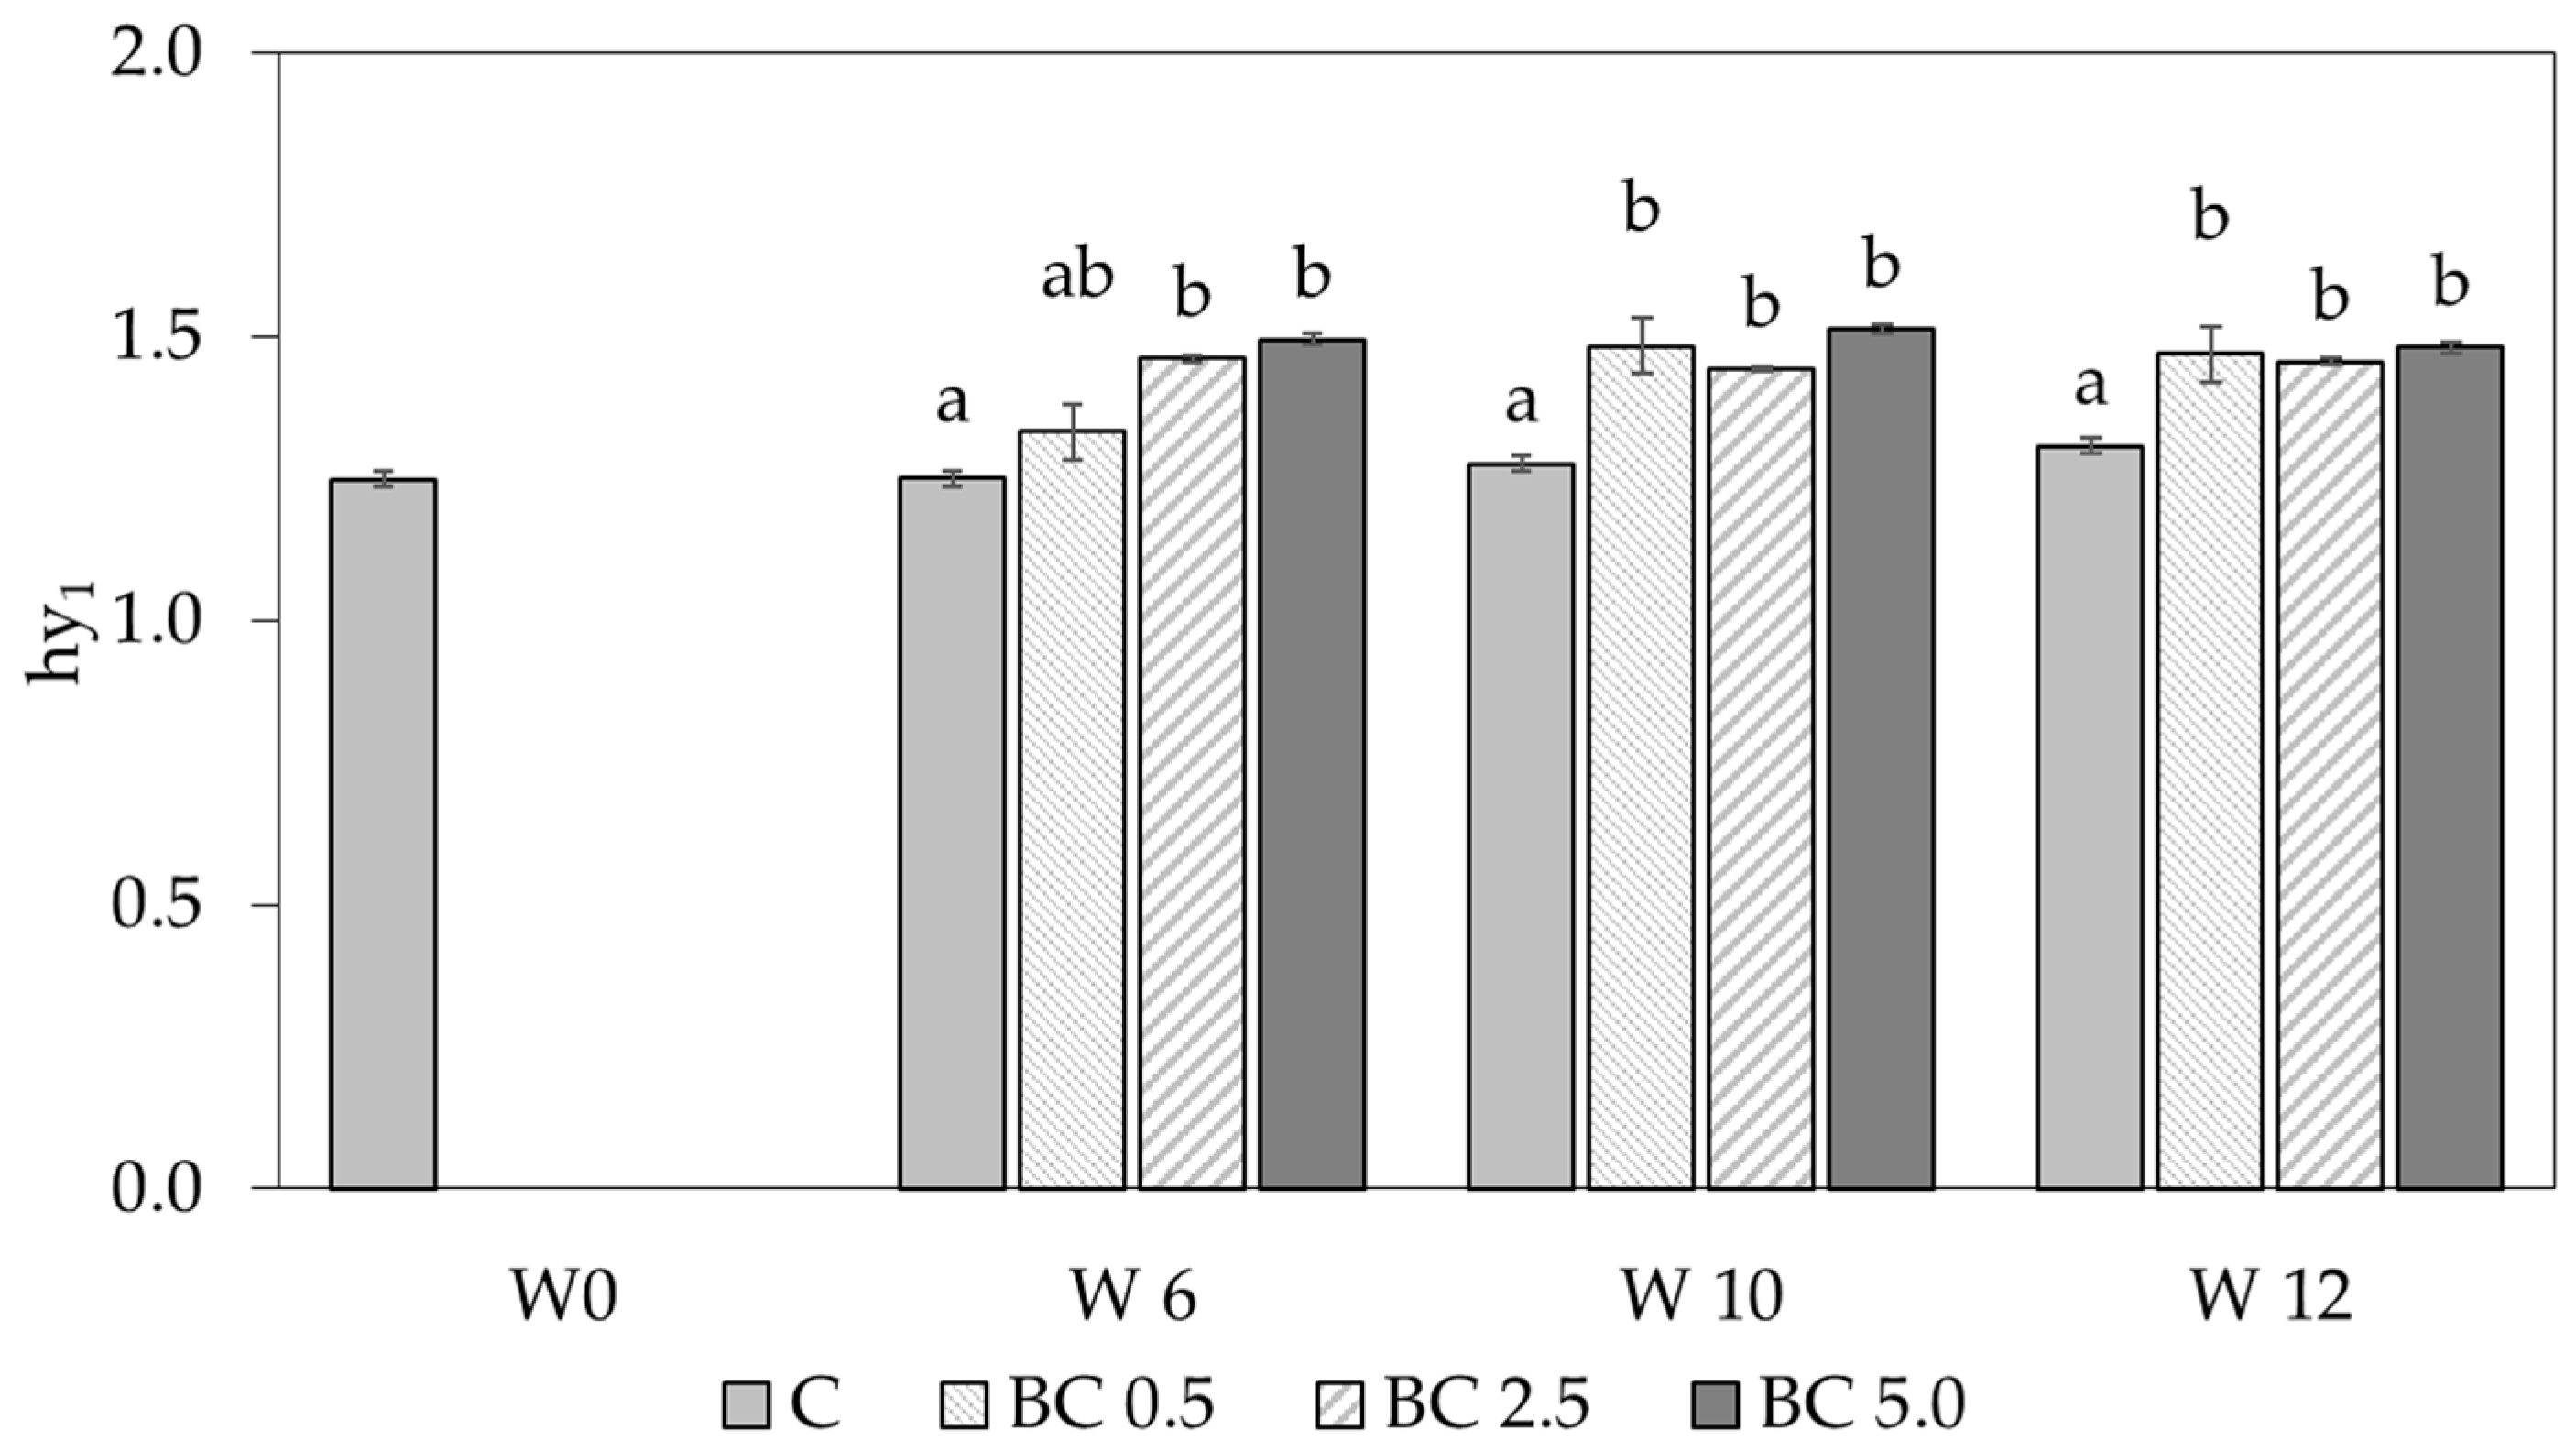
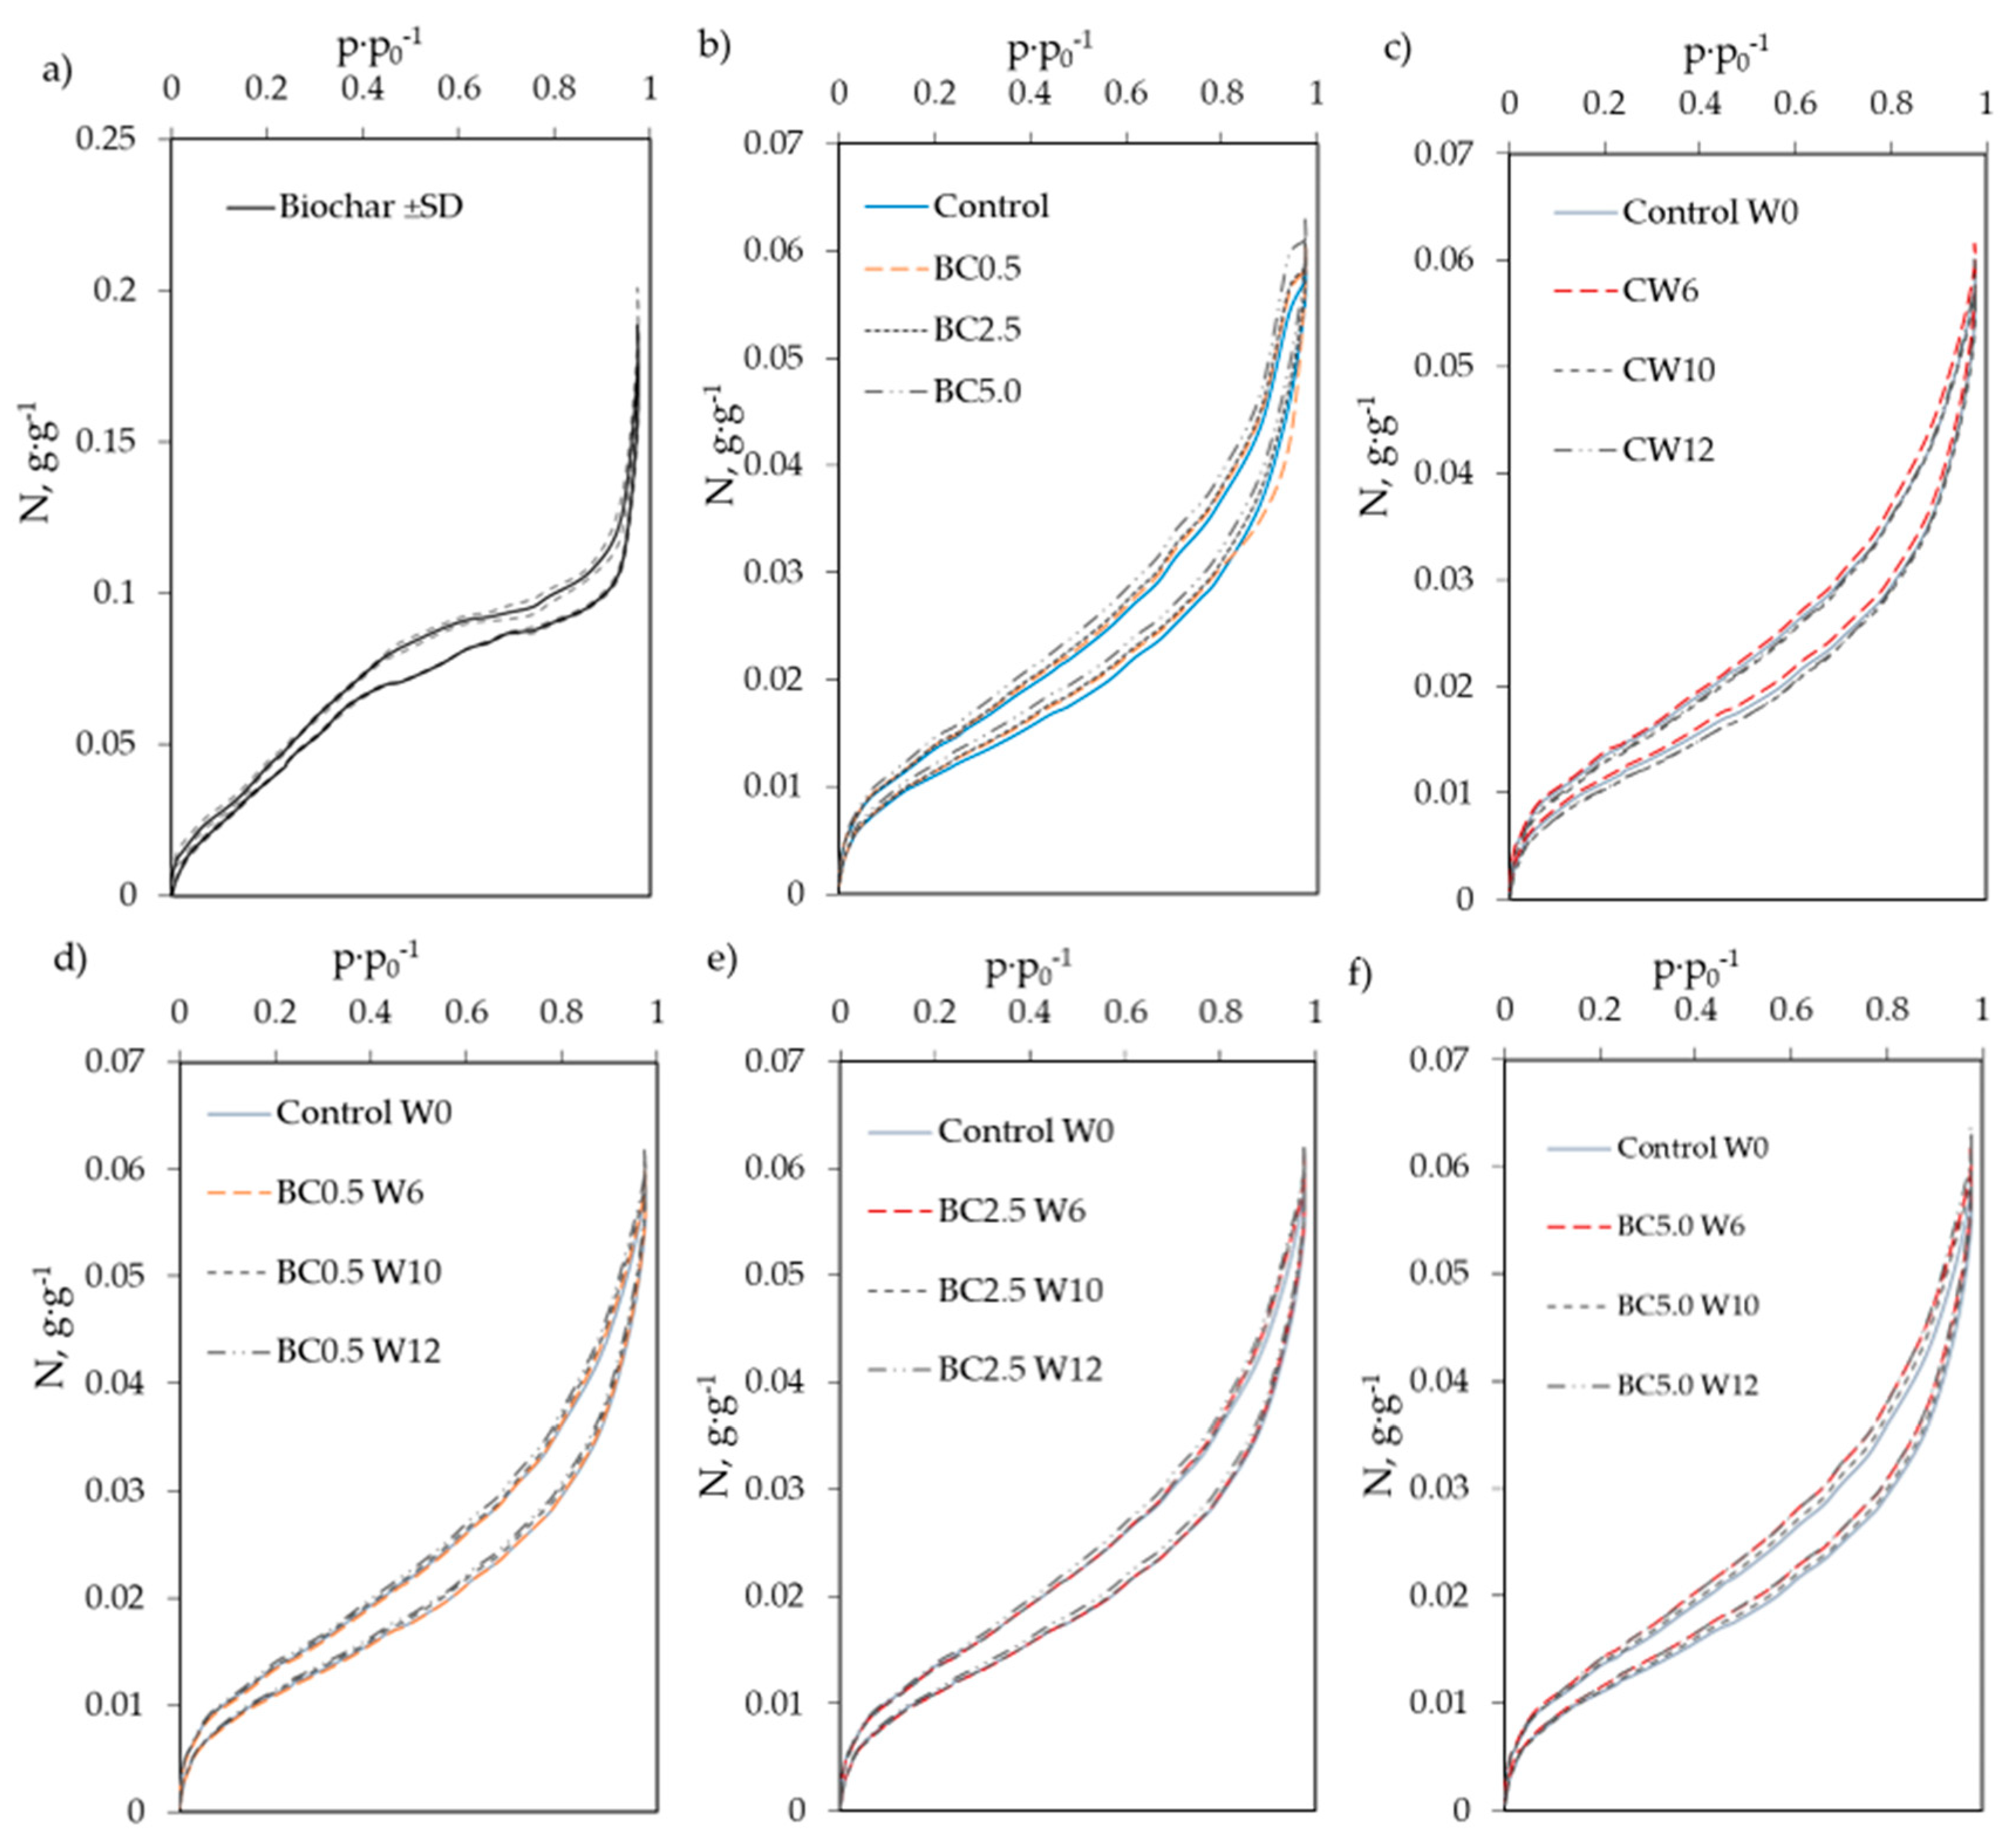
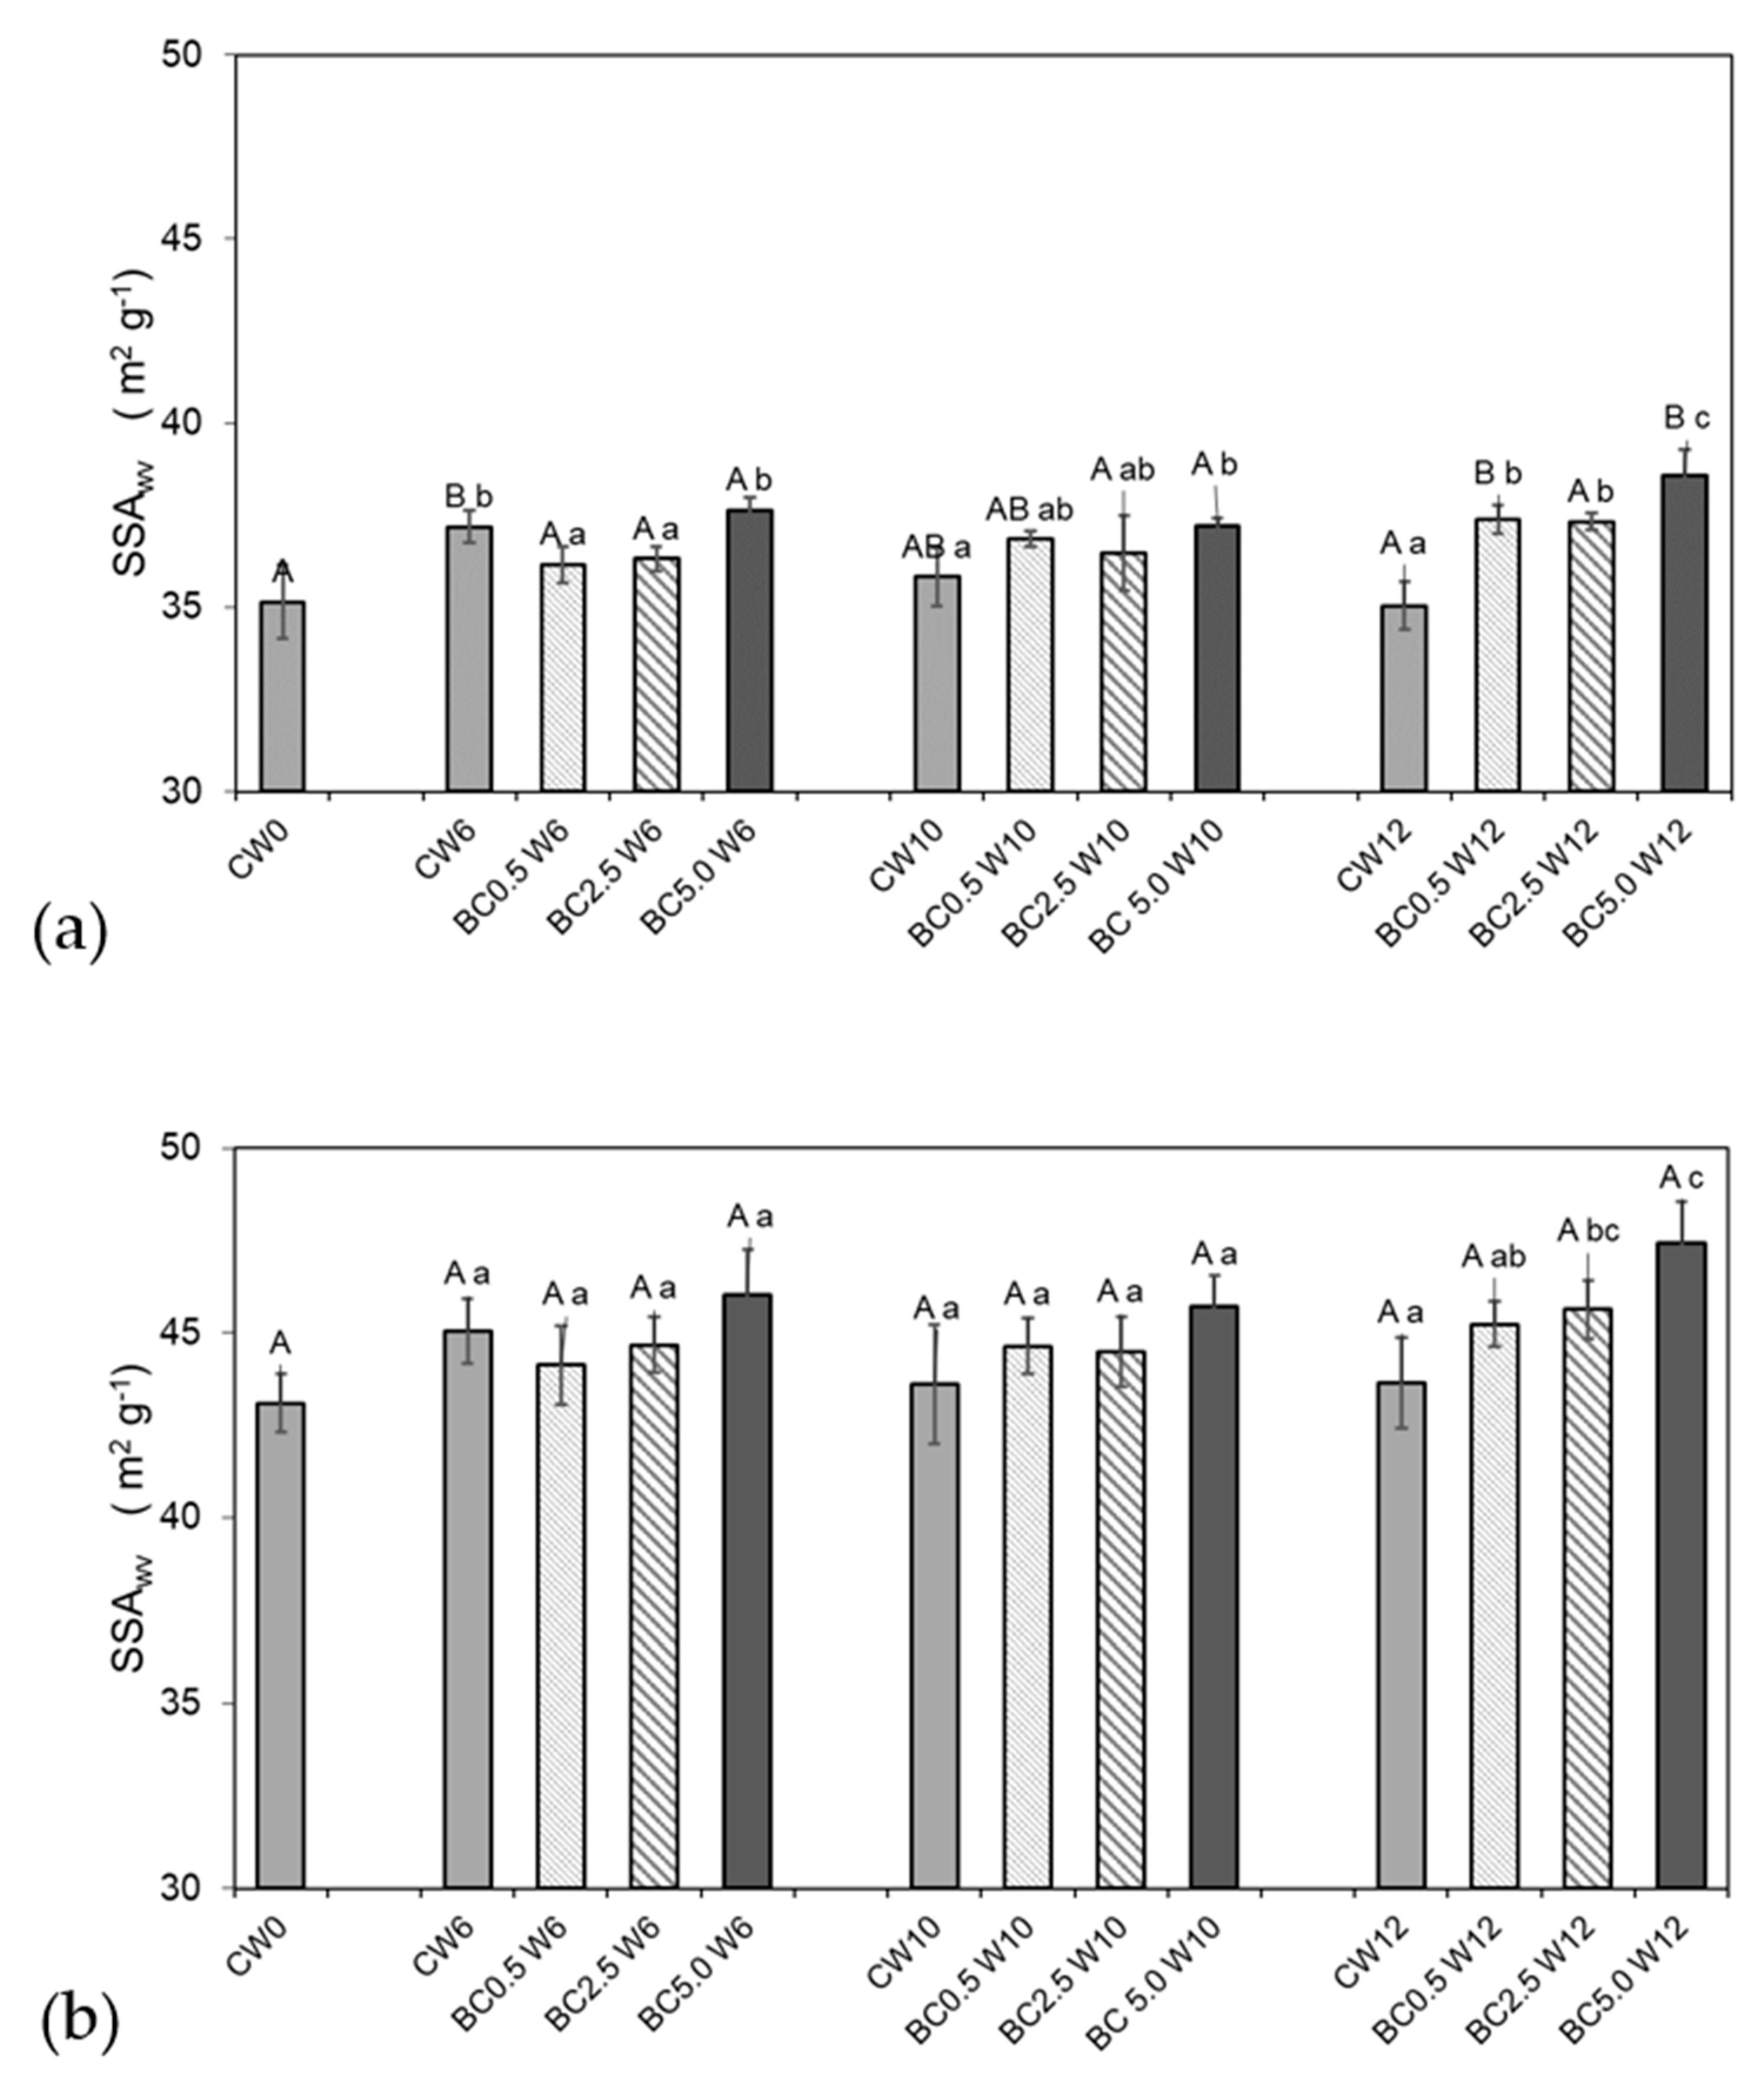
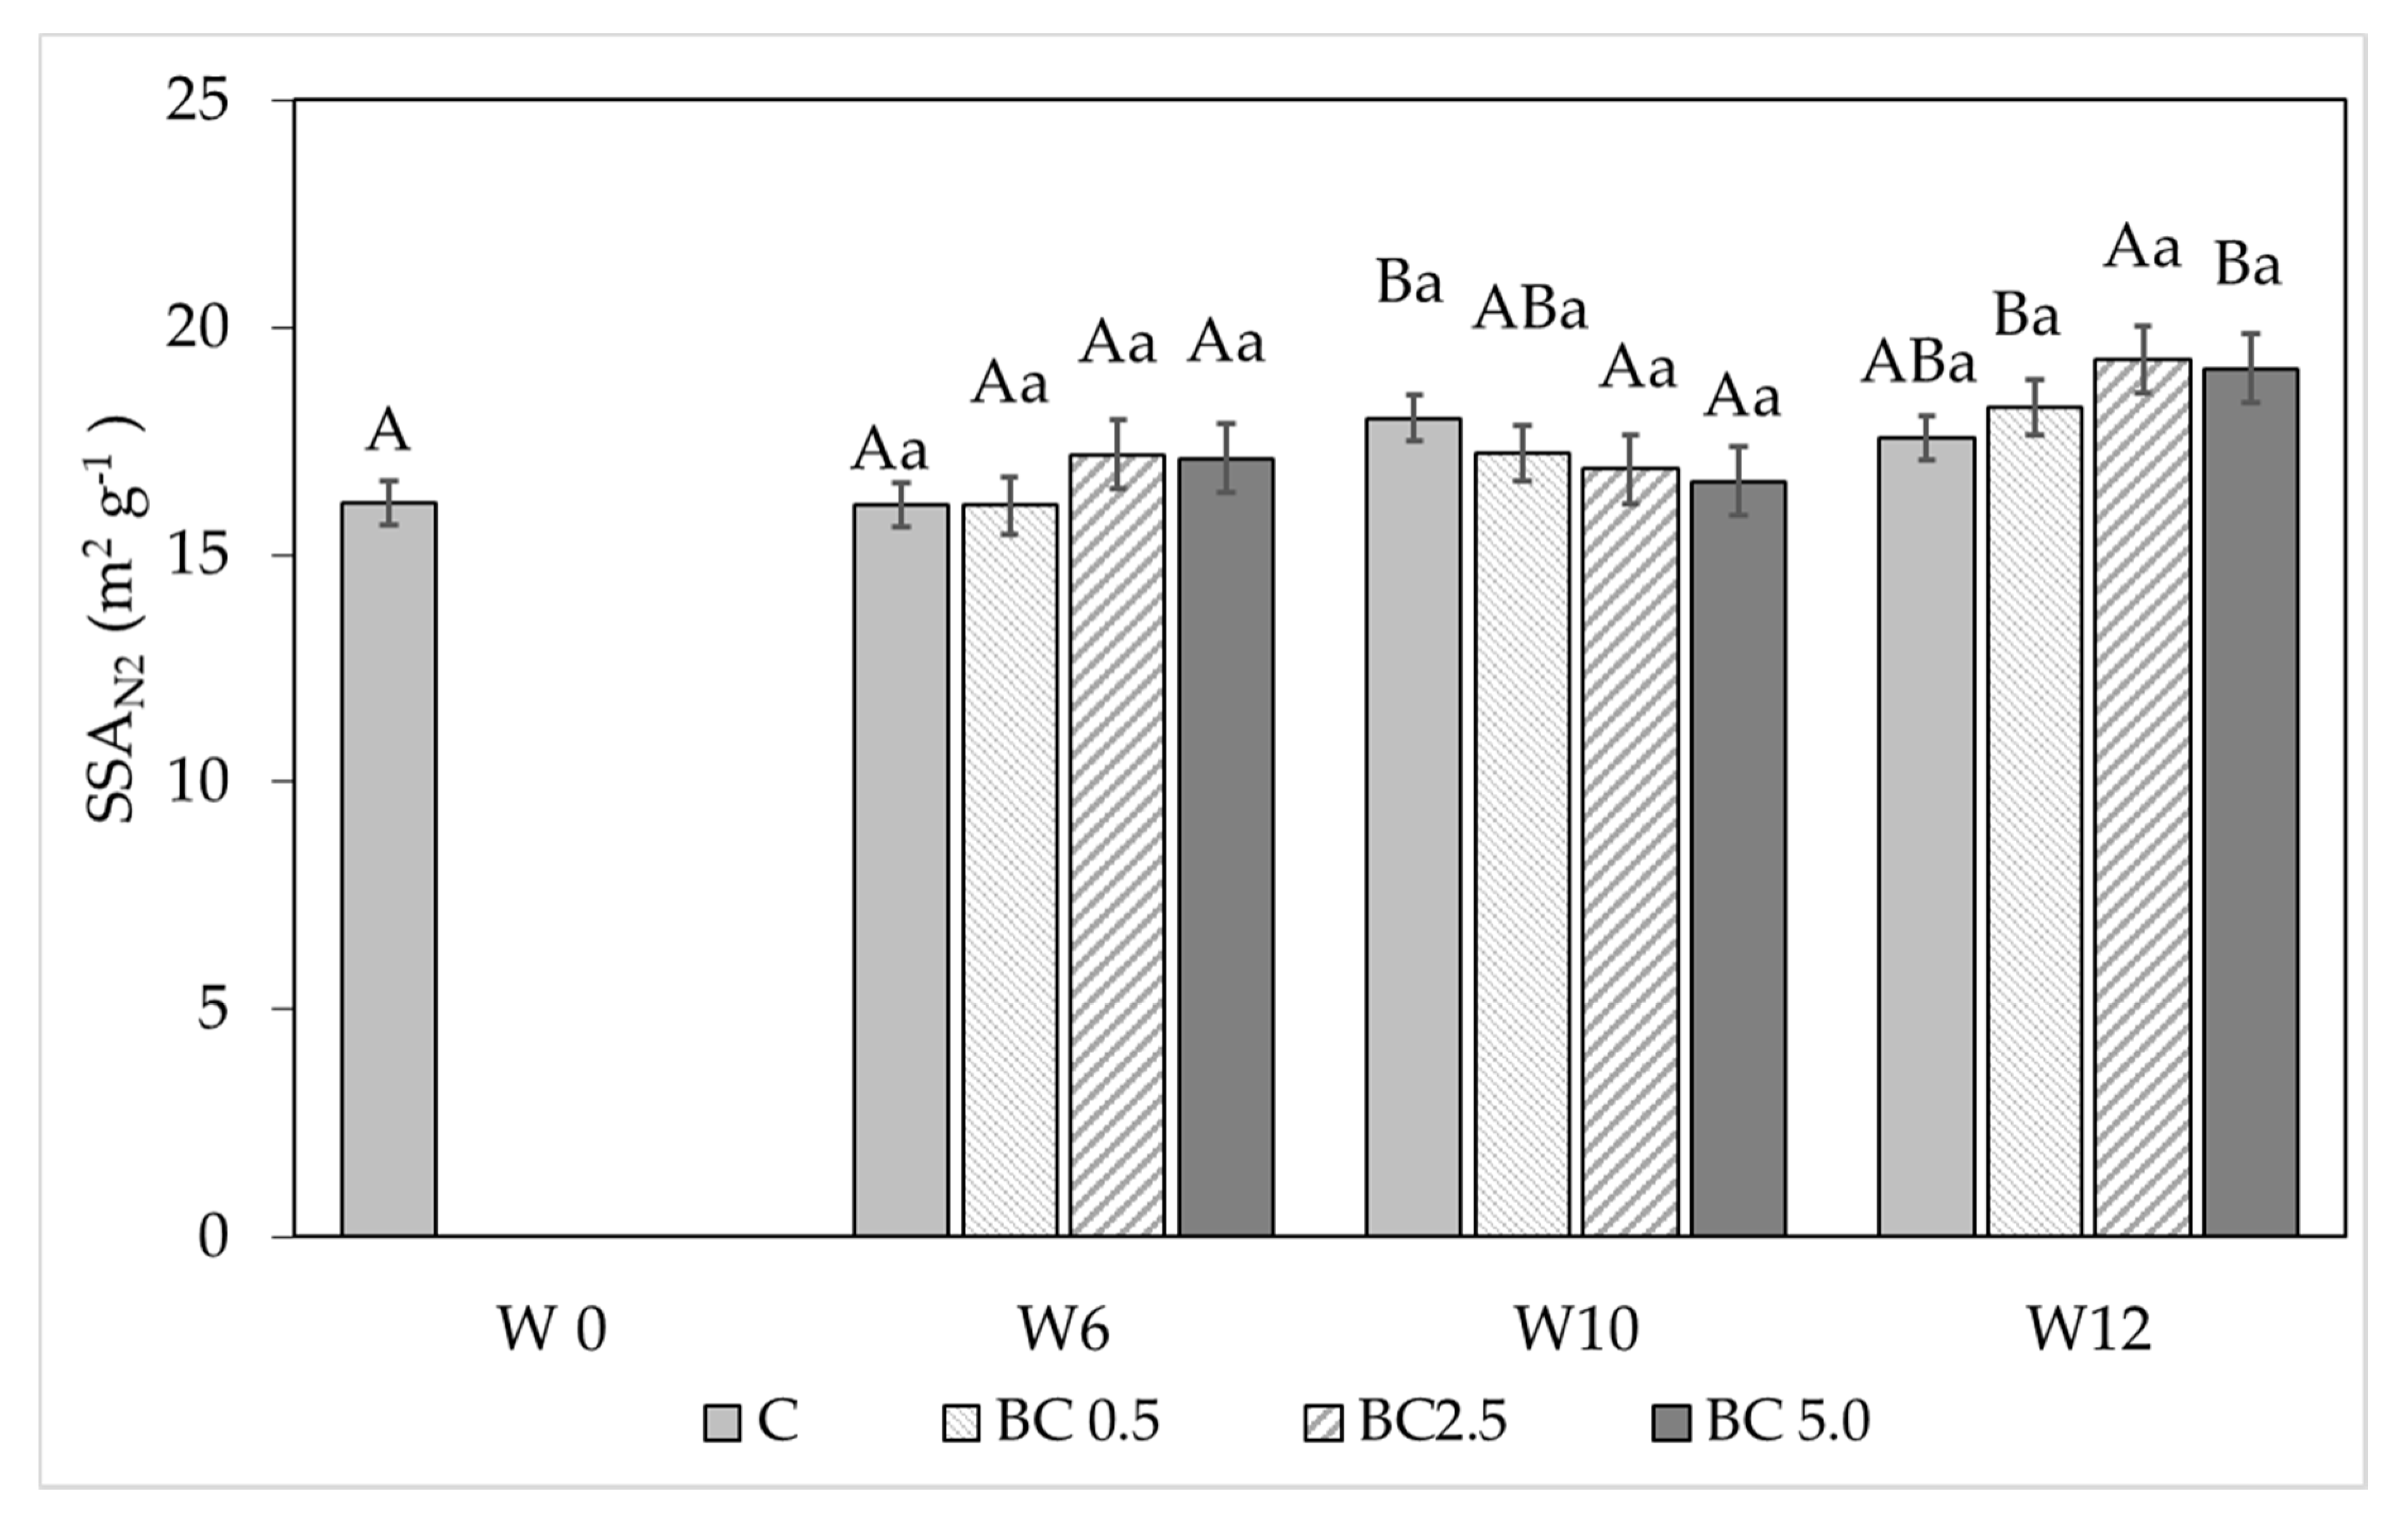
3.1. Hygroscopic Water Content and Water Vapor Sorption Changes

The hygroscopic water contents (hy1) of pure biochar was 5.33 ± 0.12 g g−1. With the increasing biochar amount, the hy1 values increased with values ranging between 1.25–1.50 g g−1 (Figure 1). In general, the treatments showed small differences over time, but the higher amount of biochar enhanced water adsorption onto the soil particles. Biochar amendment resulted in significantly higher hy1 values between control and biochar-amended treatments even at low biochar amount, while over time no significant differences could be observed between treatments (Figure 1).
For all analyzed soil with biochar amendment, the water vapor isotherms were similar in shape. According to the BET classification [48], the isotherms belong to the same II class for all soil samples and had the shape typical of the physical adsorption process. The shape of hysteresis loops and unrestricted adsorption at high p/p0 allowed their classification as type H3. This type of hysteresis loop is characteristic for plate-like particles that produce slit-shaped pores [49]. Water sorption of the biochar was much higher than the biochar/soil mixtures (Figure 2). Even at low-pressure ranges (p/p0) biochar held more water vapor than any of the soil mixtures by over 66%. In comparison to the control, a tendency to increase adsorbed quantity was observed together with biochar dose; however, the differences were significant only in the case of BC5.0 in the last treatment (Figure 2d–f).
Based on the water vapor adsorption method, the average values of the specific surface area (SSAwv) for soil/biochar mixtures ranged from 35.05–38.59 m2 g−1. Values obtained from desorption data were higher compared to the ones retrieved from the adsorption measurements, ranging from 43.10–47.44 m2 g−1 (Figure 3). In general, increased SSAwv was observed over time in most treatments compared to the initial soil’s data (W0), with the highest values observed for BC5.0 at all investigated phenological phases. The statistical analysis (one way ANOVA) showed that the amount of biochar influenced the specific surface area of soil/biochar mixtures. The differences between treatments were the most profound at the end of the experiment (f value = 24.39, p = 0.0022; Figure 3a). Based on the adsorption and the desorption data we observed a 10.1% and 8.7% increase in SSAwv for BC5.0 compared to control, respectively. While differences in SSAwv of the different treatments were observed at all sampling periods, these differences were statistically not significant at the level of p > 0.05 over time (Figure 3b).
The specific surface area for soil/biochar mixtures was also determined using nitrogen molecules (SSAN2). Our data show that smaller SSAN2 was observed when using this technique compared to the method using water vapor adsorption (SSAN2 < SSAwv). Using the nitrogen gas technique to estimate SSAN2 might underestimate the actual surface areas as it only measures the external, while the water vapor adsorption method can enter both external and internal surfaces resulting in a significantly higher SSAwv value for the same soil sample. Similar to the water vapor adsorption/desorption calculations, the SSAN2 increased with time compared to the control with the highest SSAN2 values measured at the end of the experiment (Figure 4). While these differences were statistically not significant among treatments (Figure 4), these small increases could still indicate a generally positive effect of biochar addition on the soil surface area. The changes in the SSAN2 values resulted in a significant difference considering time as a factor over the course of the experiment (p > 0.05; Figure 4). For the pure biochar the surface area was 40.84 ± 1.5 m2 g−1.

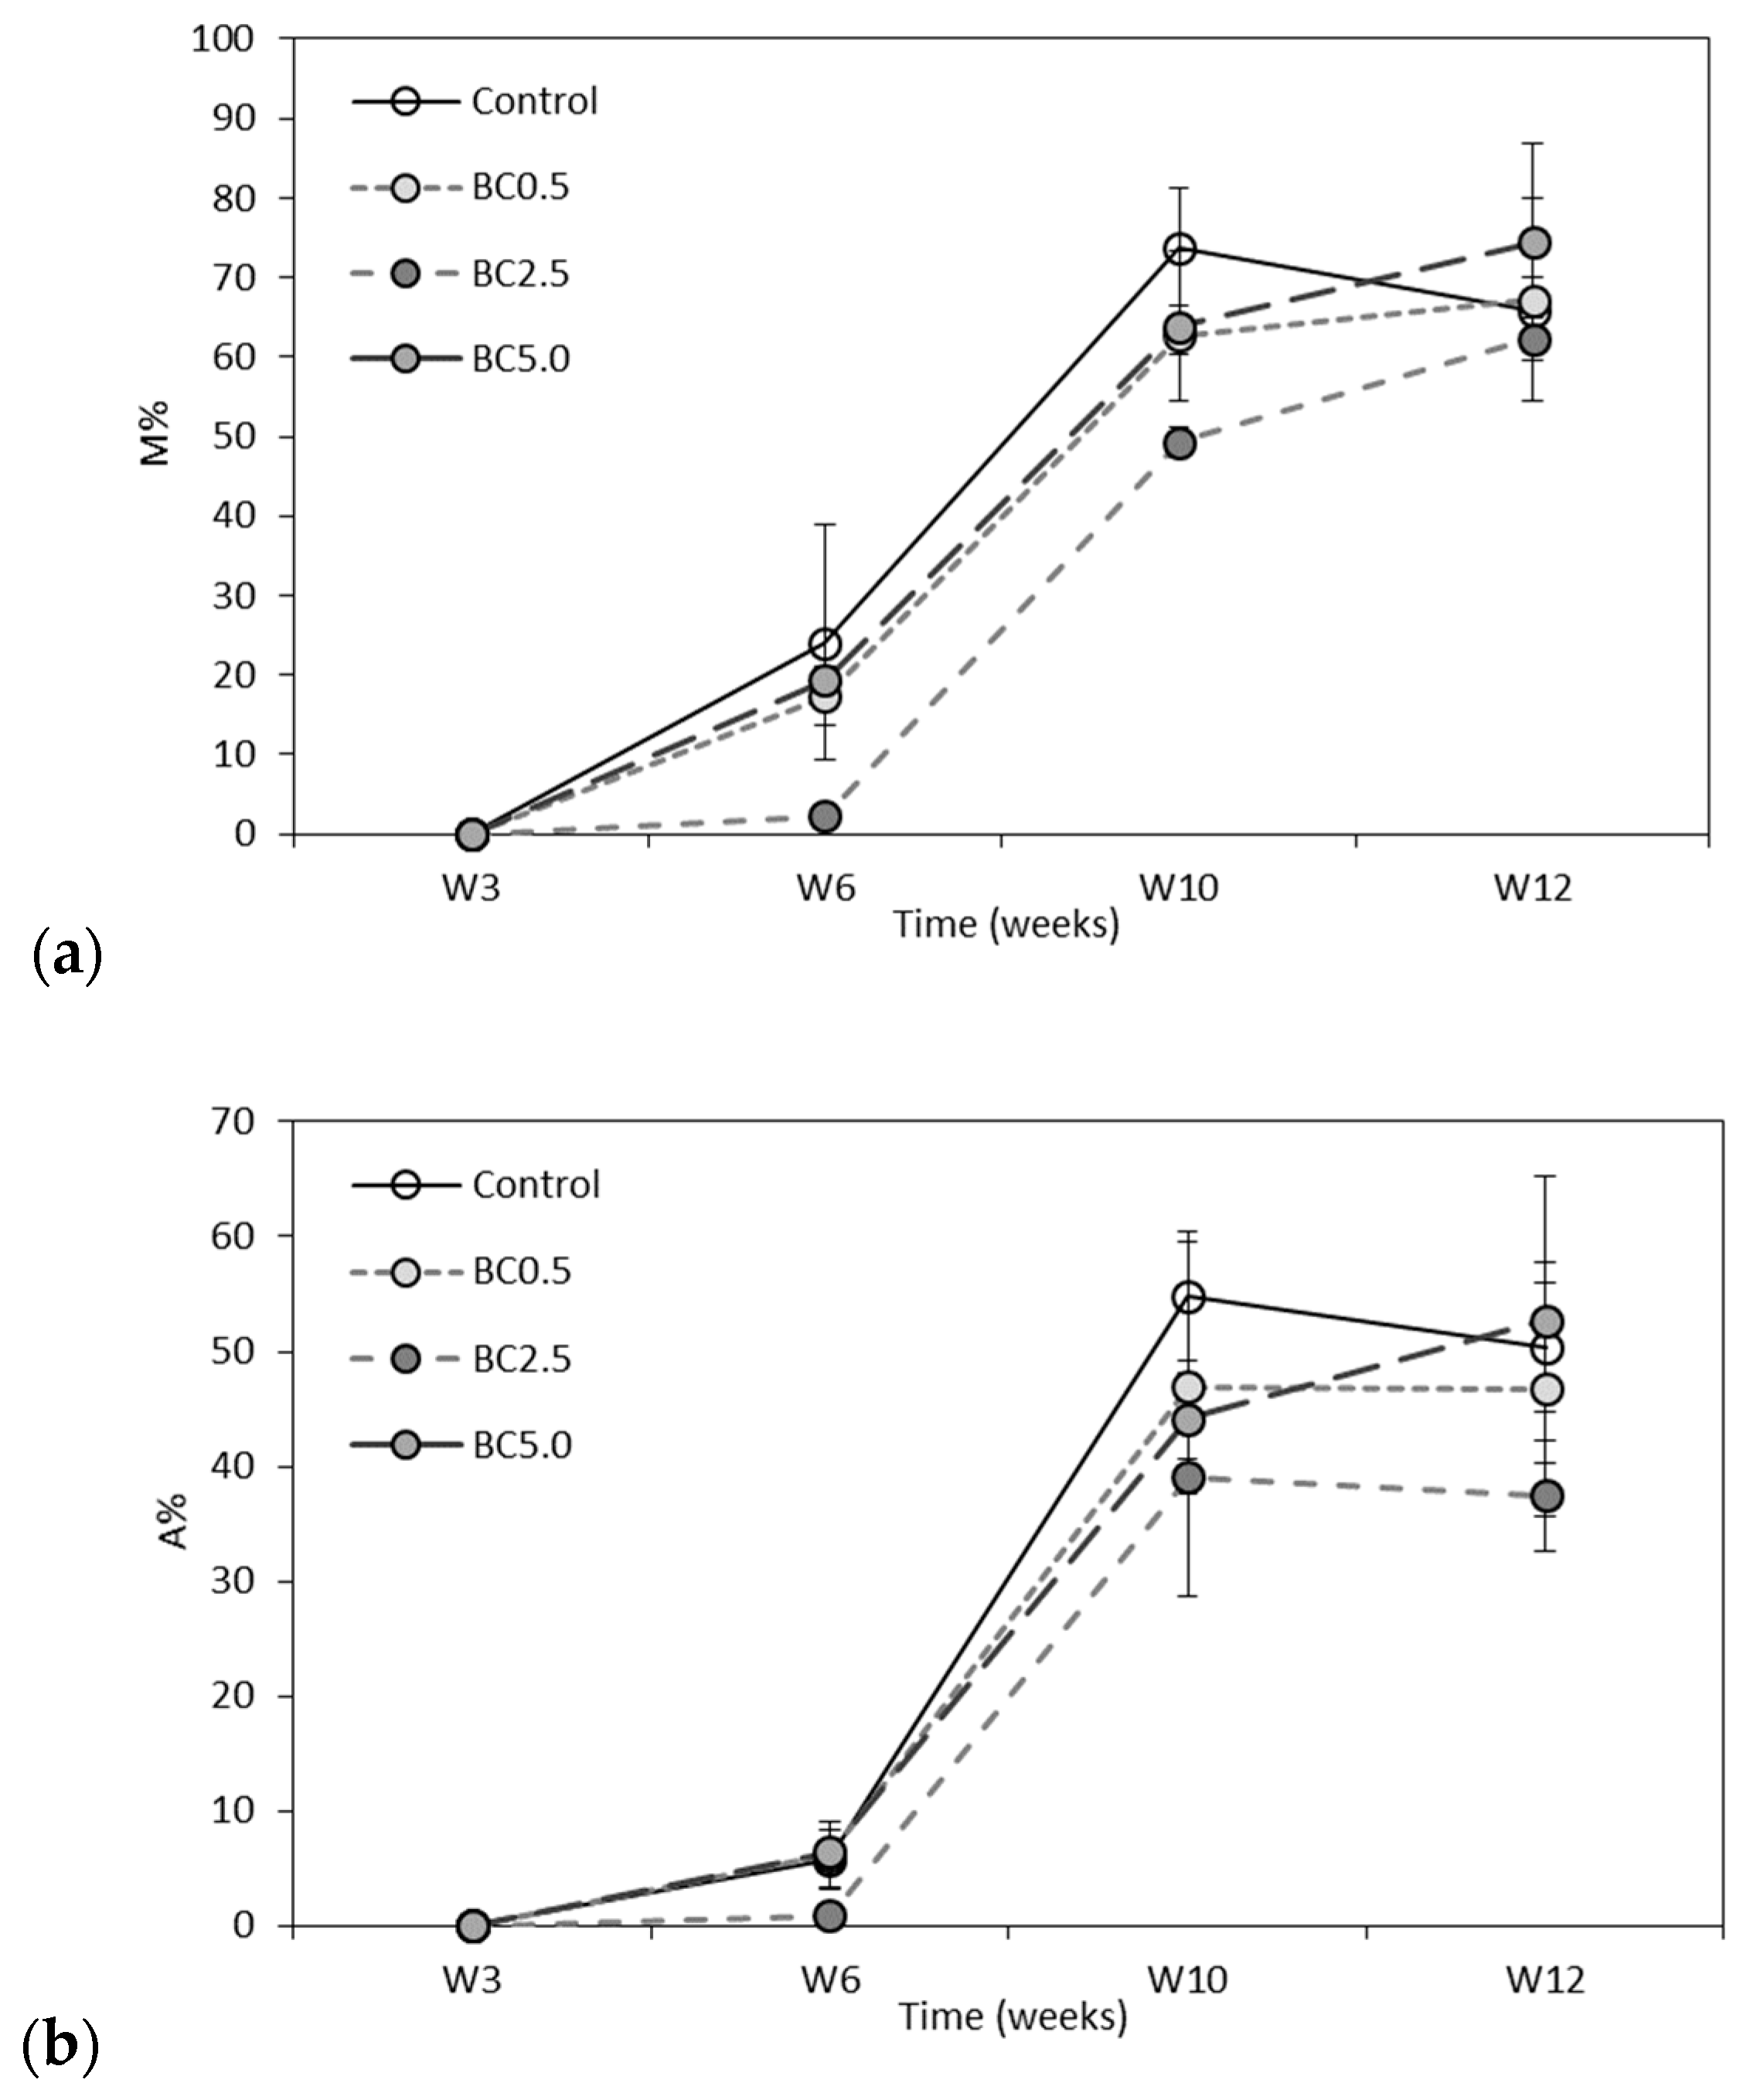
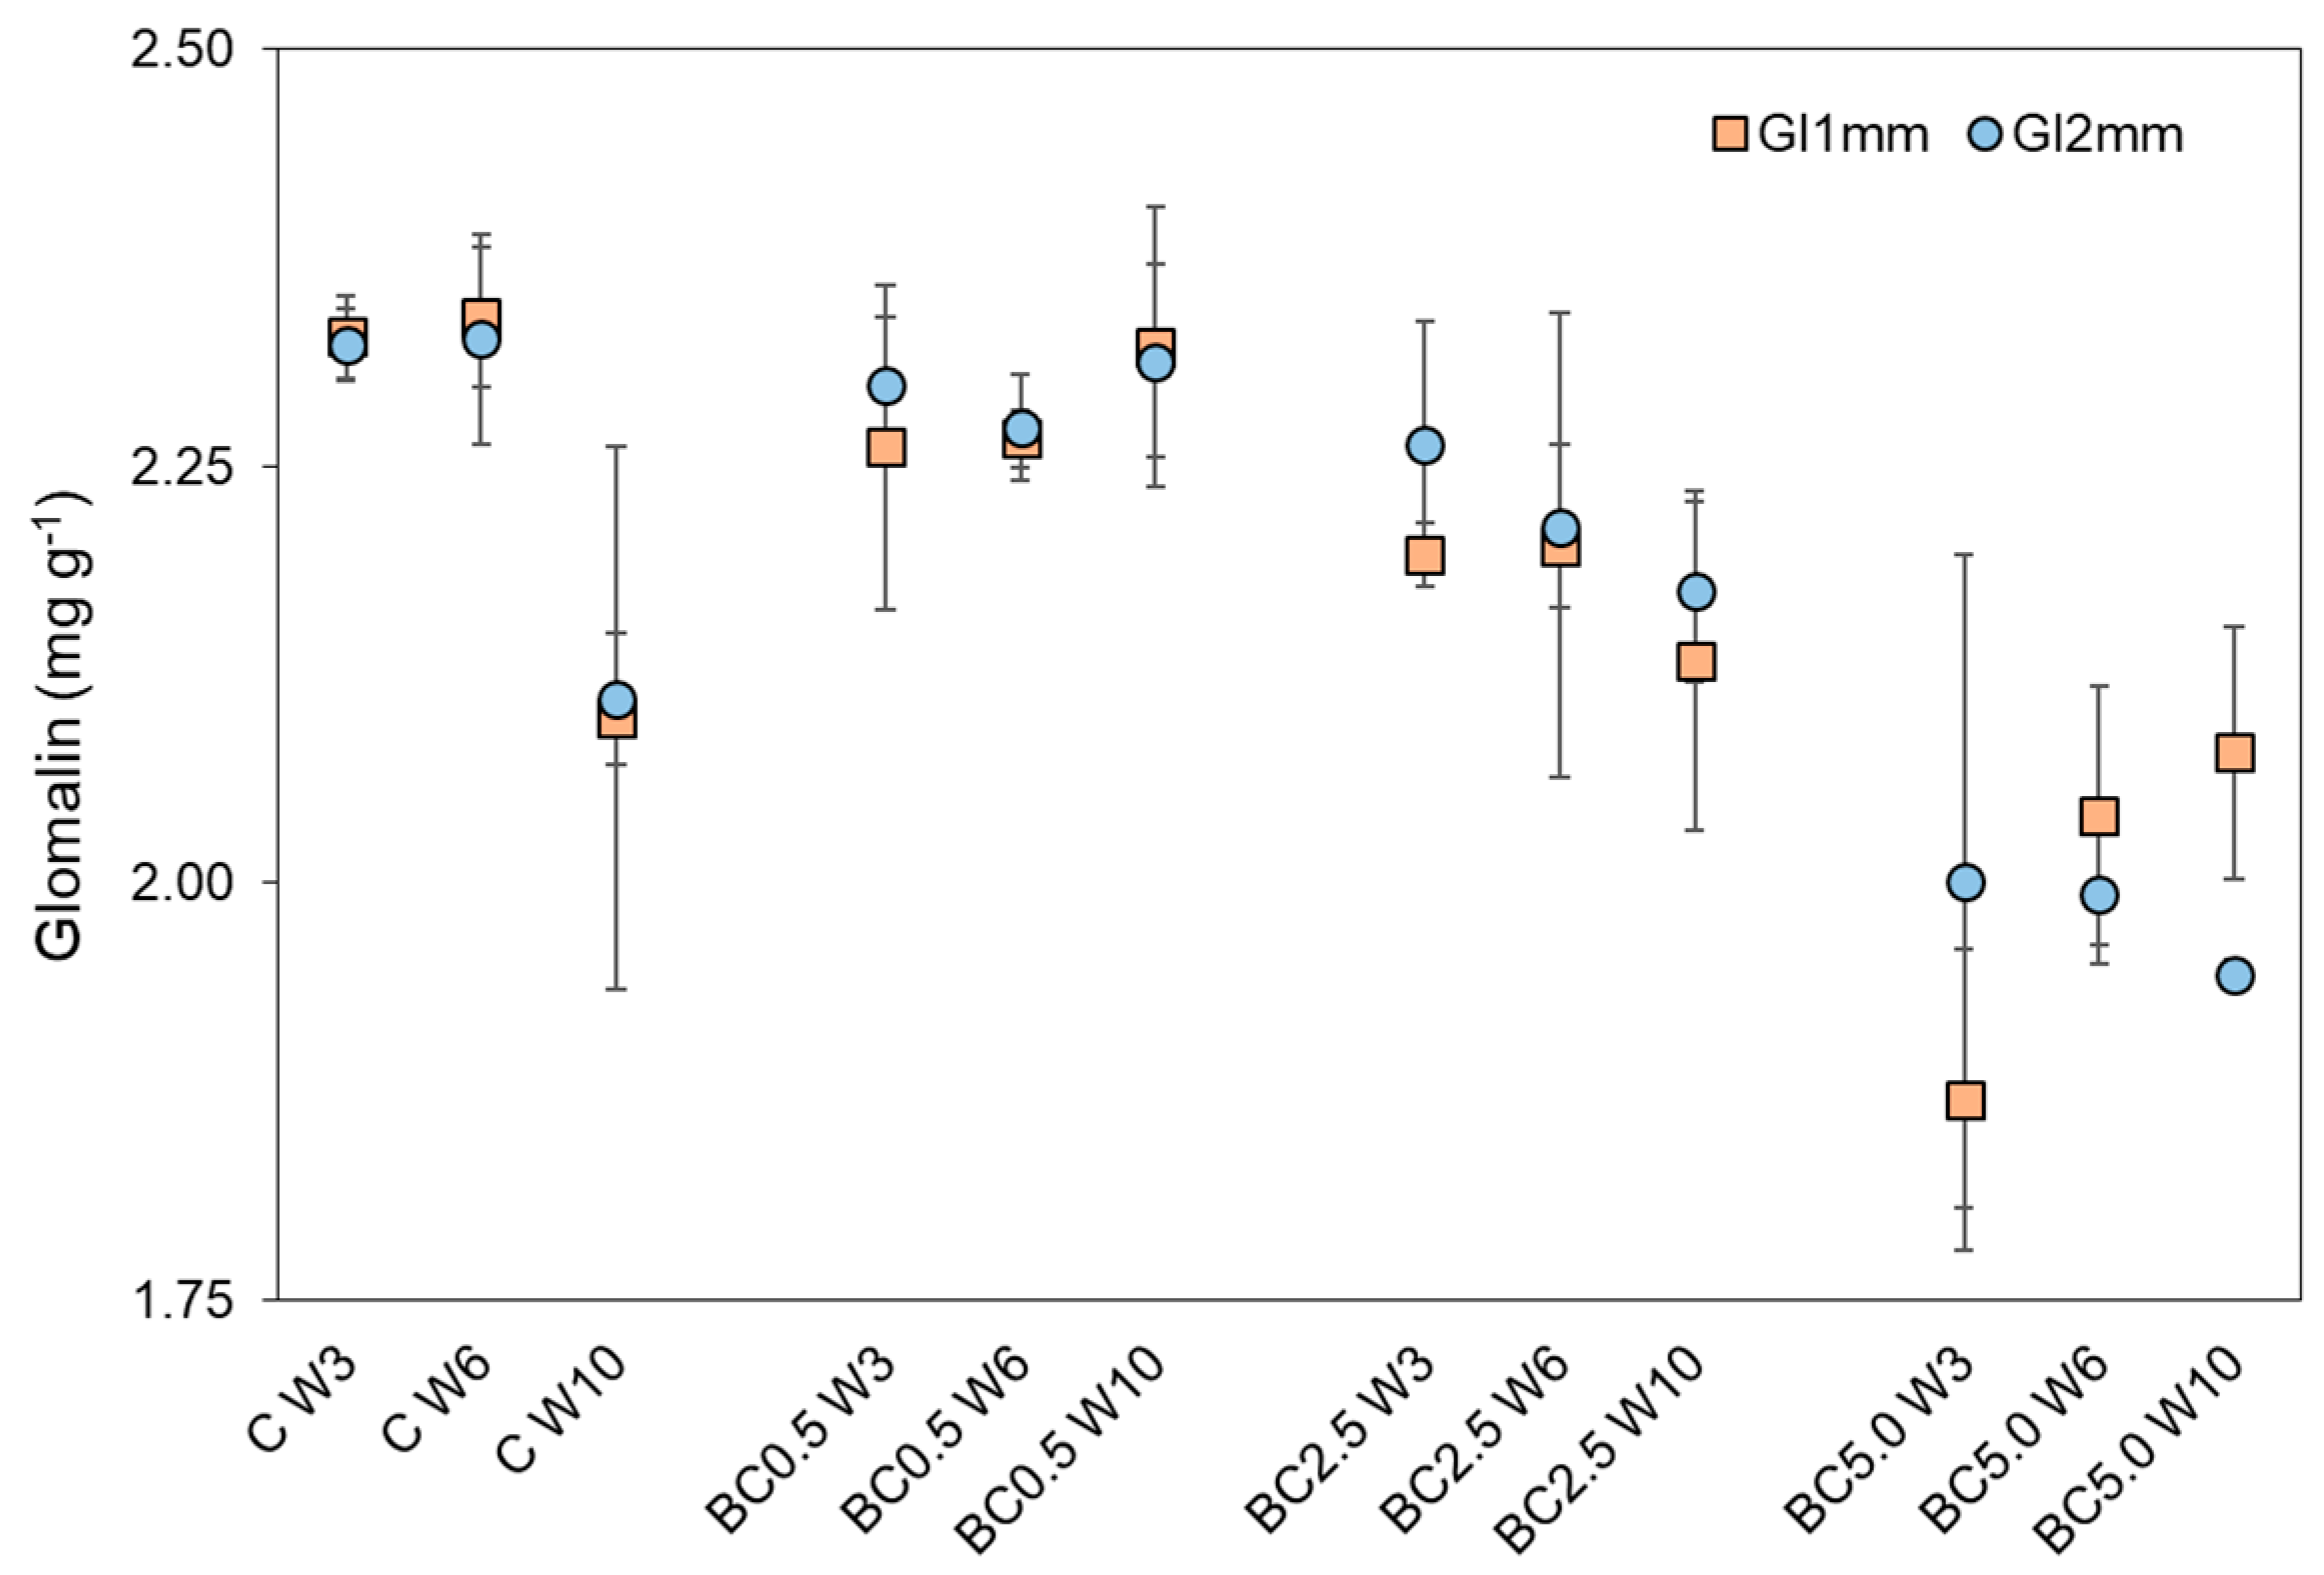
3.2. Arbuscular Mycorrhizal Fungal (AMF) Root Colonization and Glomalin Production

AMF infection could not be detected in the 3-week-old plants (Figure 5). The presence of AMF in roots appeared at week 6 (W6) in the peppers with a 2–24% range for the different biochar treatments (Figure 5a). The intensity of AMF root colonization (M%) increased with the age of the plants. Microscopic observation of harvested control plants showed a slight decrease in colonization comparing to peppers from W10 samples. High arbuscular richness (A%) of a root system confirmed a well-functioning relationship of symbiotic partners (Figure 5b). In the case of a medium dose of biochar in treated soil (BC2.5), the AMF colonization parameters were significantly lower than that at either low or high biochar levels for the samples measured between W6, W10, and W12 (p < 0.05).
A close correlation was found between AMF colonization parameters (r = 0.98. However, there was no correlation between easily-extractable glomalin-related soil protein (EEG-GRSP) content of the soils and AMF root colonization (Gl_1 mm: r = 0.08; Gl_2 mm: r = −0.22)). The EEG-GRSP concentration in <1 mm soil fraction was not affected by the age of plants, but it was affected by the doses of biochar. Our results showed significant differences between BC2.5 and BC5.0 compared to control or BC0.5, while between weeks no significant differences were observed for the treatments. EEG-GRSP of 1–2 mm soil fraction significantly decreased in the soil of the harvested plants (W12; Figure 6).

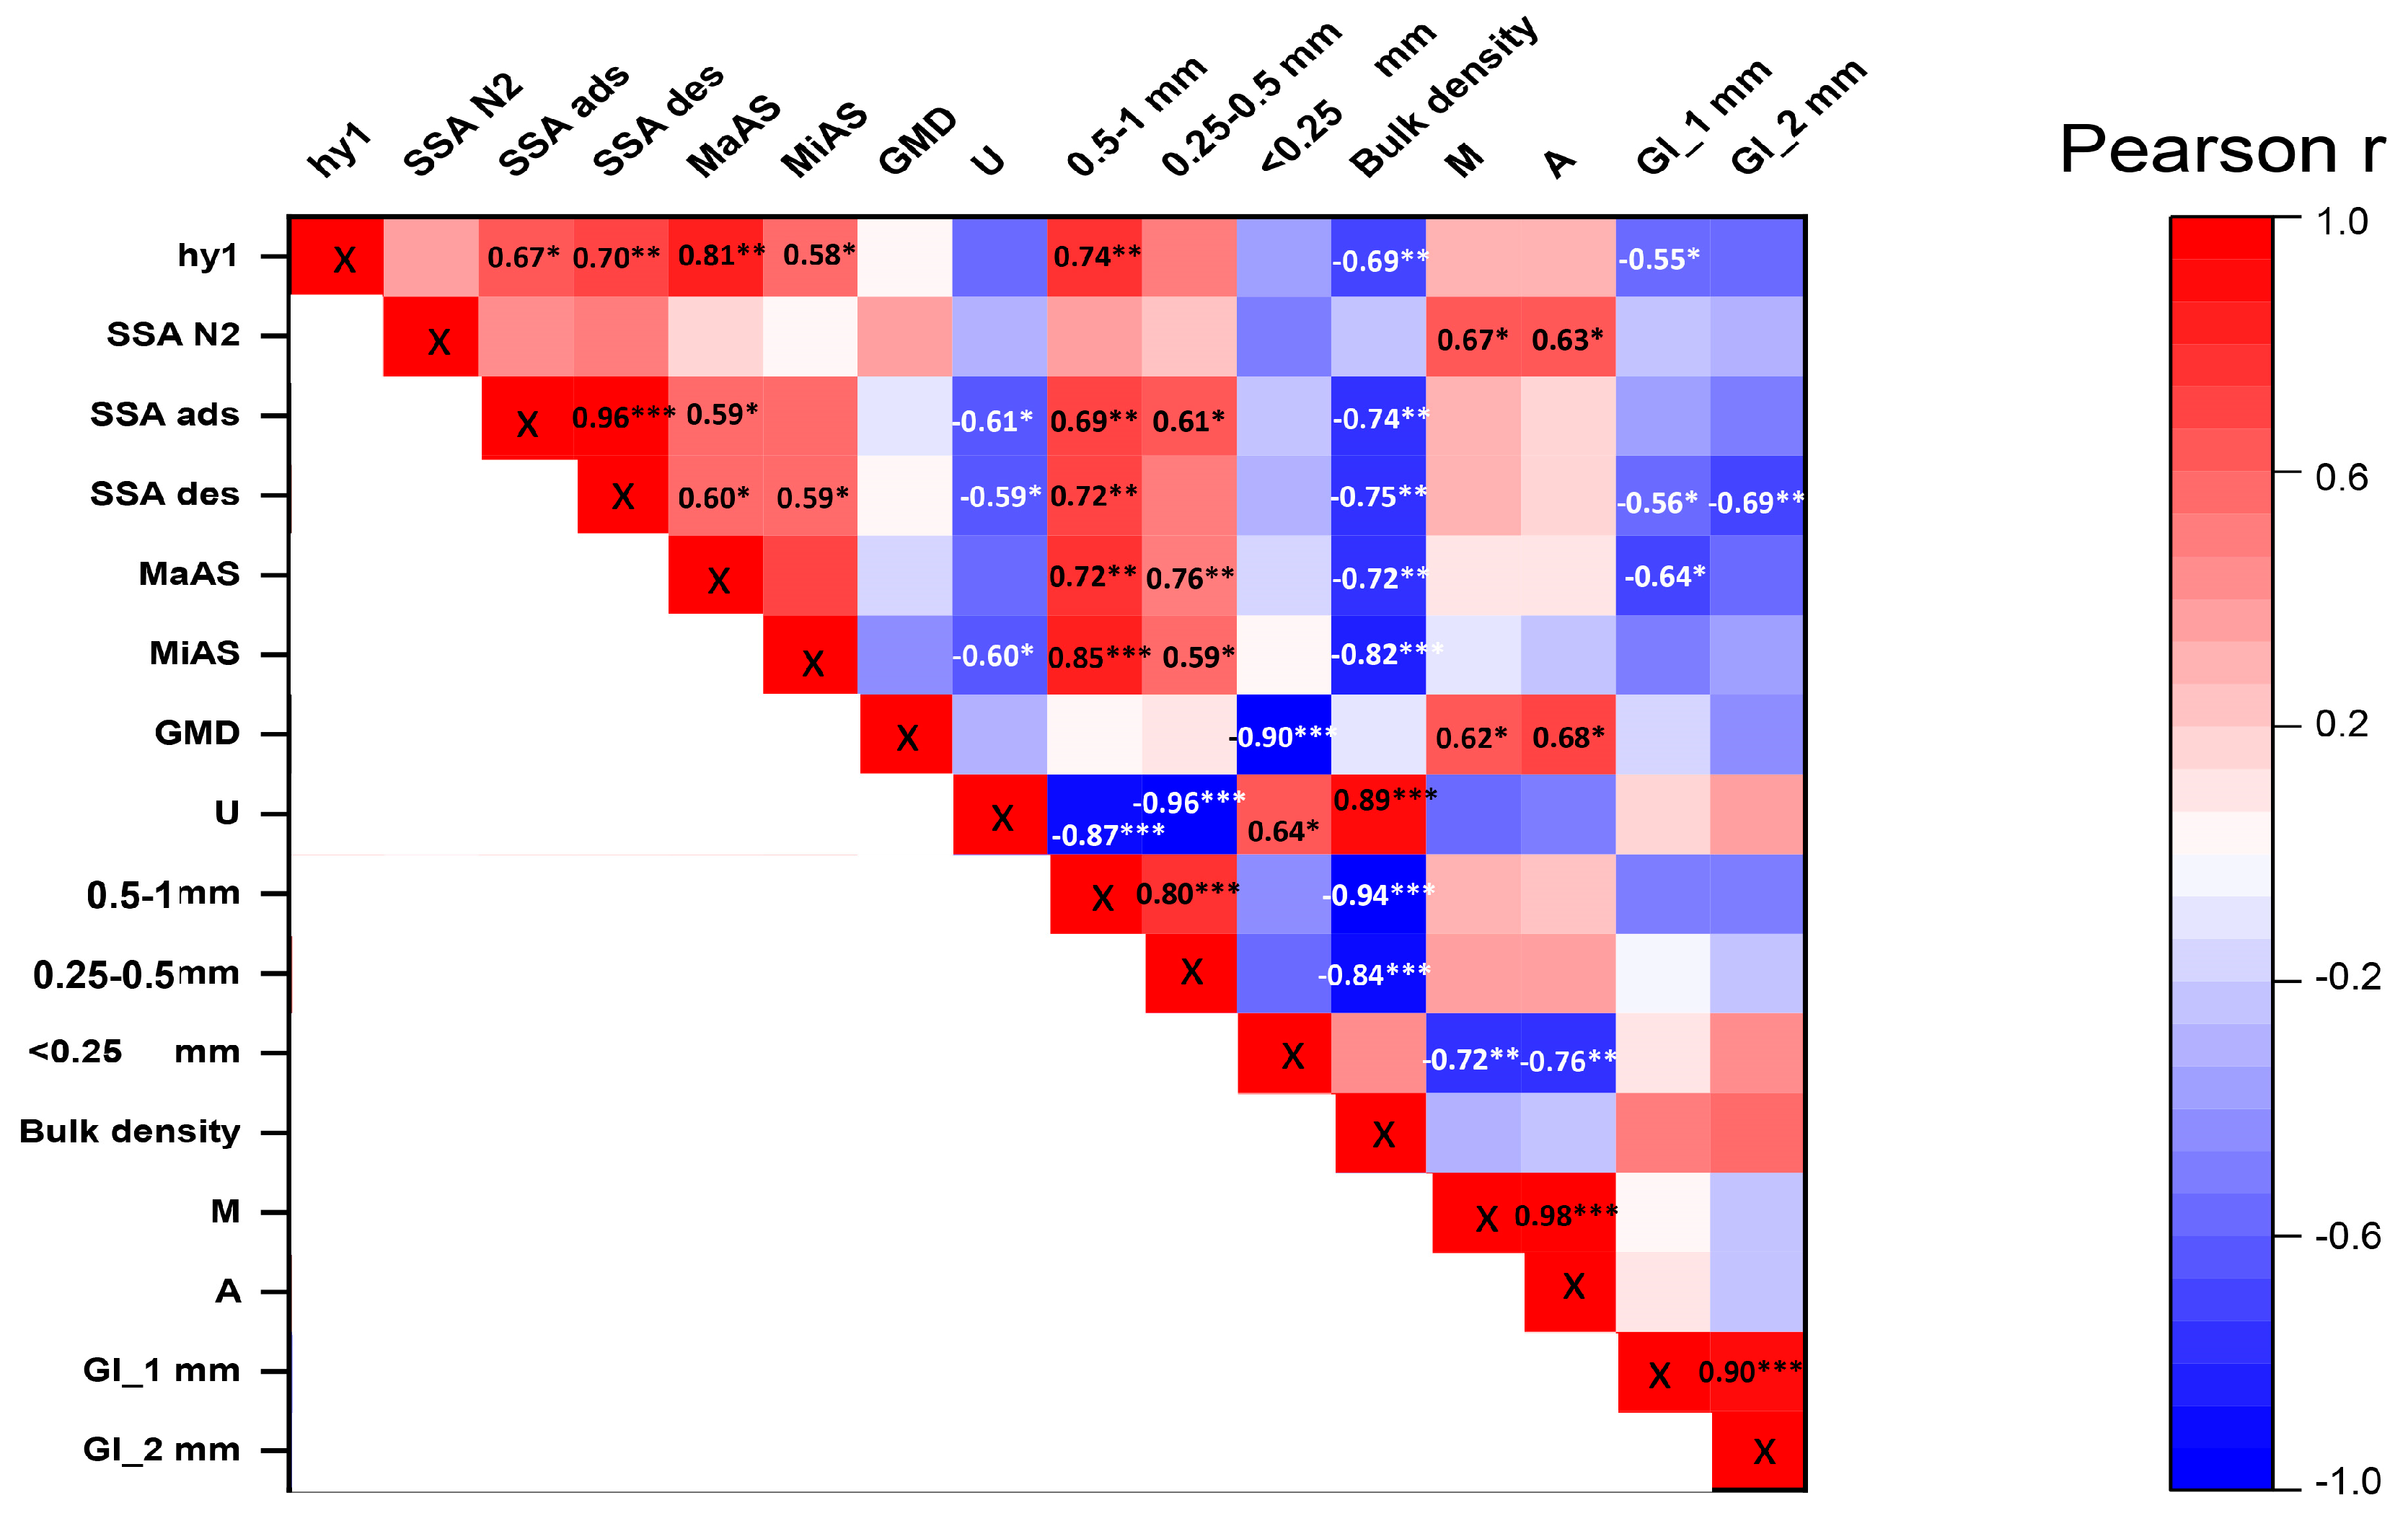
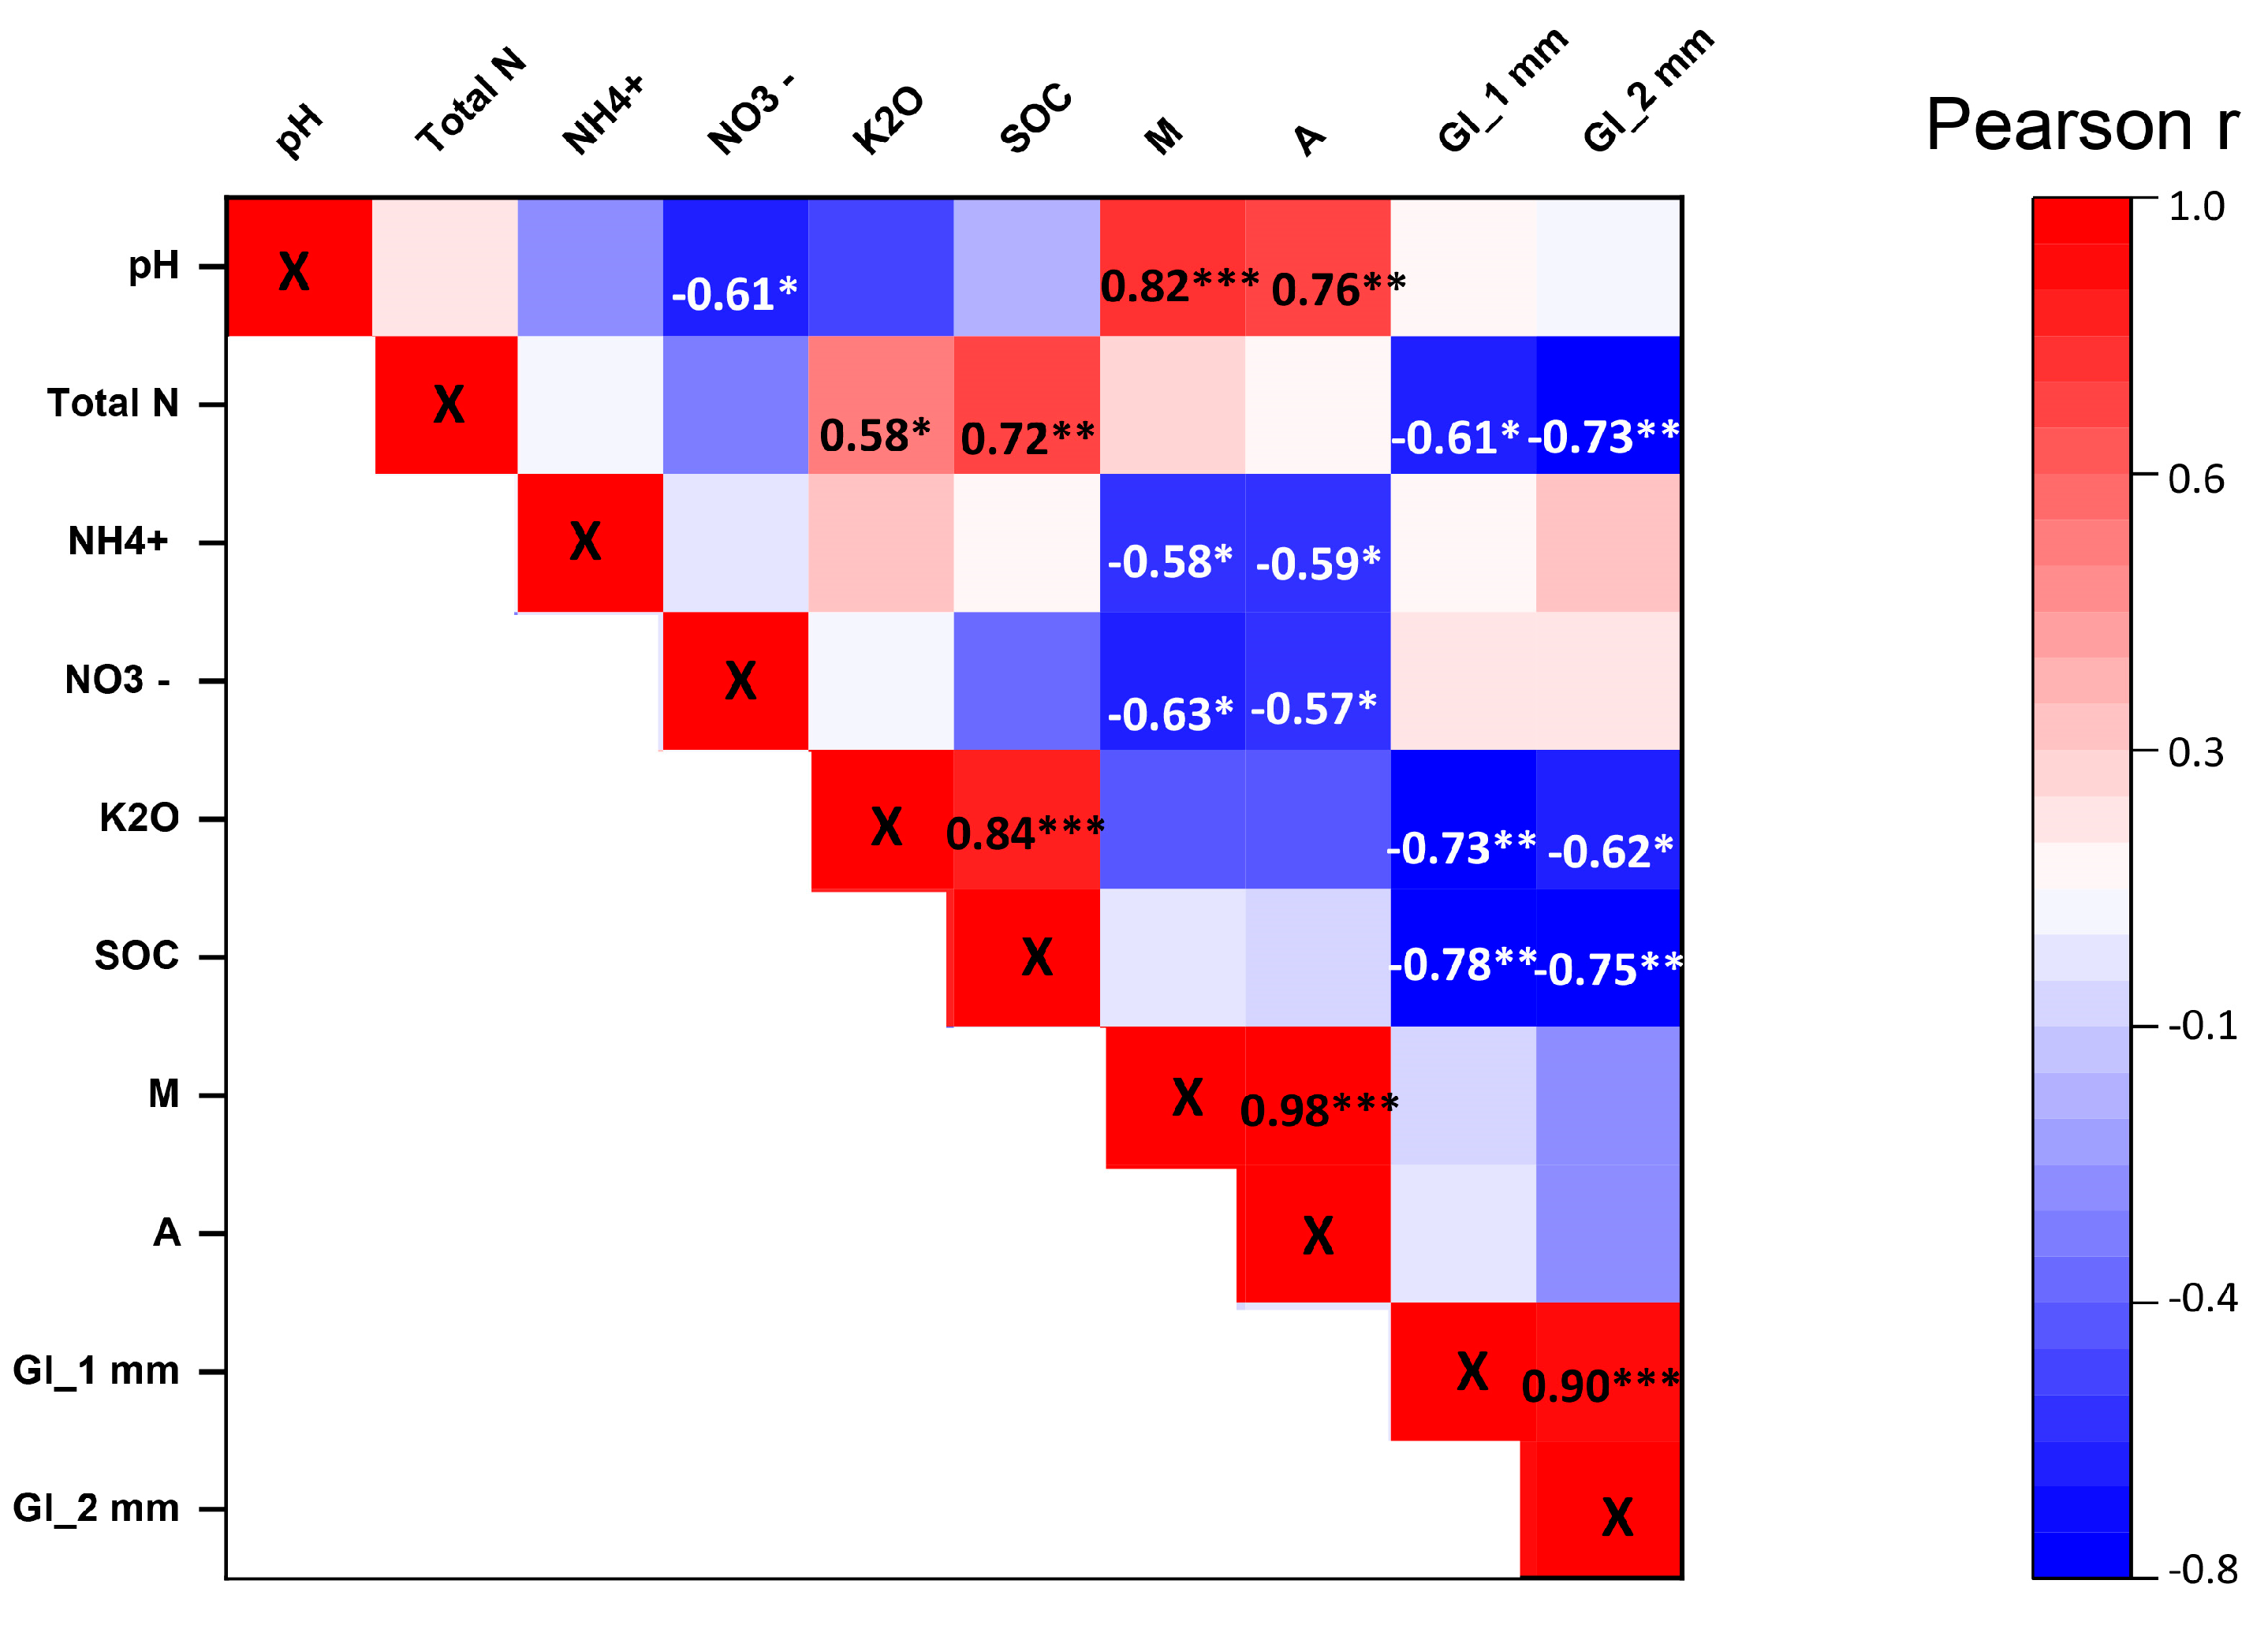
3.3. Relationships between the Soil Physical, Chemical, and Biological Parameters

Soil physical and chemical parameters were retrieved from earlier studies [2,8,50] and used to investigate possible connections between the physical, chemical, and biological (i.e., mycorrhizal fungi hyphae growth and glomalin (EEG-GRSP) production) interactions. The correlations between colonization of mycorrhizal fungi (M%), arbuscularity (A%), glomalin production at different soil fraction sizes, and soil physicochemical parameters of the treatments are presented in Figure 7 and Figure 8.
Soil hygroscopic water content (hy1) and both the SSAads and SSAdes parameters were positively correlated with most other soil physical parameters, such as macro- and microaggregate stability, and saturated hydraulic conductivity (r > 0.56). The abundance of intraradical AMF structures was highly correlated with several physicochemical soil parameters (Figure 7 and Figure 8). Negative relationships occurred between AMF colonization parameters and U (which is the ratio of the 10% and 60% finer soil aggregate sizes (d10/d60)), or the rate of <0.25 mm% aggregate fraction, indicating that AMF could affect macroaggregate (0.25–0.5 mm %, r = 0.41) formation. hy1 did not correlate with the mycorrhizal fungi growth or arbuscularity; however, a significant negative correlation was observed with glomalin production (Figure 7). The SSAN2 showed less pronounced relations to these parameters with strong positive correlations with the mycorrhizal fungi growth and arbuscularity (r = 0.67; Figure 7).
The smaller than 0.25 mm aggregates negatively affected mycorrhizal fungi growth (r = 0.72) and arbuscularity (r = 0.76), while they positively influenced the glomalin production (e.g., r = 0.44 for Gl 2 mm). Weak positive relationships were observed for the larger soil aggregate sizes (>0.25 mm) and the mycorrhizal growth, while negative or no relationships were found with the glomalin production. A significant, negative relationship was also found between macroaggregate stability and glomalin yield (r = −0.64).
The soil chemical parameters greatly influenced the biological parameters investigated. Most notable was the pH, which positively correlated with the mycorrhizal fungi and arbuscularity, while no relationships could be observed with the glomalin data (Figure 8). Mycorrhizal fungi or the arbuscularity data did not show strong correlations with the other chemical parameters with negative relations to the NH4+ (r > 0.58) and NO3 (r > 0.57) soil content. Glomalin data showed a strong negative correlation with the total nitrogen, K, and SOC contents of the soil (Figure 8).

4. Discussion

Significant changes in the SSA (both SSAwv and SSAN2) were observed over time in the biochar-amended samples compared to control. These observed changes could be related to the oxidation of biochar surface in time resulting in the formation of functional groups of a polar nature (mainly hydroxyls, phenolic and carboxyls groups). Polar groups constitute adsorption centers for water vapor molecules and may strongly influence the values of SSA measured by water vapor [51]. However, there might be other associated factors such as total porosity, pore size distribution, microbes and plant roots, which can play important roles in altering properties of the biochar-amended soil surface. Our data verified this, as SSA was correlated with aggregate stability, U, hydraulic conductivity, aggregate size distribution, and the bulk density of the soil. Among soil chemical parameters, we also confirmed strong relationships between SSA and total nitrogen, NH4+, K2O, P2O5, and SOC content of the soil. For the soil biological parameters, AMF colonization, arbuscularity, and glomalin production showed dependence with specific surface area measured with either nitrogen or the water vapor sorption method.
The values of the specific surface area obtained for the biochar were significantly higher than those for the soil/biochar mixtures. These results indicate that biochar is a highly porous material with several reactive sites for adsorption. In general, the specific surface area and porosity of the biochar increase with temperature [52]. This effect is combined with the formation of micropores as well as the rearrangement of the structure during the decomposition of organic matter in high temperature [53]. The additional influence on water adsorption onto biochar-amended soil surfaces could be related to seasonality, soil pH and plant development [51,54], hence additional differences were enabled to develop between treatments. Biochar addition can increase plant available water, the connected porosity, water retention, and the SSA of the soils [13,55], which is supported by our data. The aging of the biochar can also influence its physical properties. Over time, the initial increase in soil porosity and SSA can start to decline [56]. In the present experiment; however, only 3.5 months were investigated and this decreasing trend could not be detected.
The direct and indirect beneficial effects of biochar on the physicochemical properties and microbiological aspects of soils are indisputable [57]. However, when calculating the effect of biochar on the different underground processes, the variable chemical and physical characteristics must be considered among site-specific biotic and abiotic interactions. Most of the higher plants, including the majority of economically important crops, vegetables, fruits and ornamentals, are more productive when symbiosis with AM fungi occurs. The AMF are not host-specific; however, some preferences are presumed. The importance of AMF community to plant diversity, productivity, and ecosystem stability has been recognized in recent decades. Improved growth, health, and stress tolerance (drought-, salt-, toxic element etc.) of AMF-colonized plants are well established, particularly for hosts growing in environments with limited amounts of nutrients [58]. In horticulture, AMF are a well known biostimulant, biofertilizer and bioprotector, and have a beneficial effect on pepper growth, flowering, fruit quality and quantity, photosynthetic activity, and abiotic or biotic stress tolerance [59,60,61,62,63]. The mycorrhizal dependence of pepper cultivars show significant differences, generally the root length colonized by AMF in pepper is high [62,64,65]. In our experiment the AMF colonization was detected at a later phenophase of the host plant and it grew over time.
In soil, the application of biochar could decrease or increase the susceptibility of the hosts to a symbiotic relationship. The adsorptive properties of biochar as well as its porosity and high surface area may promote AMF activity by providing suitable habitats. Cumulative direct and indirect effects of biochar resulted in the observed AMF root colonization and glomalin production. Biochar may provide the nutrient acquisition for AM fungi, proper soil structure, and alleviate plant drought stress. However, the effects of its application on the interaction between physicochemical and biological parameters are still not well understood. An important and novel finding of our investigations is a close relationship between several physical soil properties (SSAN2, GMD, and a rate of <0.25 mm% aggregate fraction) and AMF root colonization in biochar-treated soils. Similar to results of Wu et al. [66], the Pearson correlation showed that root colonization was significantly and positively correlated with water-stable aggregates in 0.25–0.50 mm size fractions. The application of biochar to soil could slightly decrease the susceptibility of the hosts to a symbiotic relationship, despite the increases in pH values of treated soils and its high potassium and phosphorus macroelement content, which is beneficial for plant nutrition [6].
Probably, in our case the detected amount of glomalin produced during the investigated vegetation period of pepper could be also affected by the sensitivity of our extraction method, especially in the presence of biochar in the soil. EEG-GRSP values decreased with increasing biochar doses added to soils, which may be caused by the following direct and indirect effects of biochar on the effectivity of extraction: biochar modified soil pH during extraction processes; biochar changed the small and medium sized aggregates in the soil; added biochar diluted the soil; and AMF hyphae uses biochar pores as habitat, consequently EEG-GRSP levels showed a negative correlation with AMF colonization and several soil parameters. The high surface area and the porosity of biochar might enable the adsorption or retention of glomalin. It has been scientifically established that the size of soil aggregates and the amount of secreted glomalin are inversely related [67]. This habitat effect can be one of the factors that influenced our results as biochar treatment can influence the aggregate size distribution [2].
Before setting the pot experiment up, there was an average 2.28 mg EEG-GRSP content per gram of soil. During the experiment the EEG-GRSP content changed between 1.77–2.41 mg g−1 soil, varying by the biochar amounts. Comparable to our findings, in a similar experiment, approximately 0.2–0.3 mg EEG-GRSP per gram of soil of AMF-inoculated red pepper was found after 70 days growing period [64]. According to the literature, more intense intraradical root colonization or extraradical richness of AMF and higher glomalin content in soil can be simultaneously present [68]. Steinberg and Rillig [69] found a significant decrease in hyphal length and glomalin production due to decomposition processes after 150 days vegetation of the AMF host. Amendola et al. [70] found lower glomalin numbers in biochar-treated samples compared to control for grapevine; however, these differences were not significant. The authors highlighted the soil-milling operations damaging the mycorrhizal network as one of the possible reasons for the low values. Šimanský [71] found significantly lower glomalin values in biochar amended treatments even with additional nitrogen amendments in the case of spring barley; therefore, the negative effect of biochar on glomalin production can be expected. It is very important to investigate biochar–mycorrhizal relationships for the plants as biochar might provide more readily available nitrogen to the roots directly, which creates an environment where the mycorrhizal hyphae can get organic substrates from the plant without delivering nitrogen in return [72].
Strong relationships between soil physical, chemical, and biological properties can be expected. Baiamonte et al. [55] found strong correlations between plant available water and SSA for biochar-amended soils. The larger surface can hold a higher amount of water; therefore, in drought-prone areas biochar amendment to soils might be a possible tool to lessen the negative impacts of water shortages on plants. A significant positive correlation between glomalin and SOC can be also expected [73]. In the present study, strong and negative relations were observed, which might be the result of the added biochar. Therefore, our study further emphasizes the possible negative effect of biochar amendment on glomalin production. Although strong correlations were observed in the present study between the soil physical, chemical, and biological parameters investigated, the number of replicates (13 average values of 36 measurements) and the range of these measured values might only represent a smaller portion of the scale. Additional laboratory or field studies should be implemented to enable us to draw more precise conclusions.

5. Conclusions

The present experiment investigated the relationships between selected soil physical, chemical, and biological characteristics during a vegetation period while varying amounts of biochar were added to the soil. Biochar addition increased the water vapor sorption and the specific surface areas of the soil/biochar mixtures, which changes in the soil structural circumstances can improve the conditions on available water for plant use. The intensity of AMF root colonization increased with the age of plants, while biochar amount resulted in a significant decrease in glomalin production. We found strong correlations between several soil physicochemical properties and the mycorrhizal fungi growth, arbuscularity, and glomalin production. Overall, our results highlight the importance of investigating the effects of biochar prior to its application and to understand its positive and negative influence on the soil–plant system.

Supplementary Materials

The following are available online at https://www.mdpi.com/2073-4395/10/12/1933/s1, Table S1: Soil physical parameters of macroaggregate (MaAS) and microaggregate (MiAS) stability used in the correlation matrice. Data shows mean values, adopted from Horel et al. [50], Table S2. Soil physical parameters used for the correlation matrice. U is the ratio of the 10% and 60% finer soil particle sizes (d10/d60), Ksat is the saturated hydraulic conductivity. Data shows mean values, adopted from Makó et al. [2], Table S3. Soil physical parameter of geometric mean diameter (GMD) of soil aggregates. Data shows mean values. Unpublished data, Table S4. Soil chemical parameters used in the correlation matrice. SOC represents soil organic carbon content. Data shows mean values, adopted from Horel et al. [6], Table S5. Soil physico-chemical and biological parameters used in the current study. Values represents means.

Author Contributions

Conceptualization, G.B., Á.H., A.M., and T.T.; methodology, G.B., Á.H., A.M., K.S., and T.T.; software, A.F. and A.M.; formal analysis, G.B., A.F., Á.H., A.M., K.S. and T.T.; resources, A.F. and K.S.; writing—original draft preparation, G.B., Á.H., A.M., K.S. and T.T.; writing—review and editing, G.B., Á.H., A.M., K.S., and T.T.; project administration, Á.H. and A.M.; funding acquisition, Á.H. All authors have read and agreed to the published version of the manuscript.

Funding

This research was funded by the National Research, Development and Innovation Office—NKFIH grant number OTKA 131792 and OTKA 119475. The APC was funded by OTKA 131792 and OTKA 119475.

Conflicts of Interest

The authors declare no conflict of interest.

References

  1. Ye, S.; Zeng, G.; Wu, H.; Liang, J.; Zhang, C.; Dai, J.; Xiong, W.; Song, B.; Wu, S.; Yu, J. The effects of activated biochar addition on remediation efficiency of co-composting with contaminated wetland soil. Resour. Conserv. Recycl. 2019, 140, 278–285. [Google Scholar] [CrossRef]
  2. Makó, A.; Barna, G.; Horel, Á. Soil physical properties affected by biochar addition at different plant phaenological phases. Part II. Int. Agrophys. 2019, 1, 1–7. [Google Scholar] [CrossRef]
  3. Horák, J.; Šimanský, V.; Igaz, D. Biochar and Biochar with N Fertilizer Impact on Soil Physical Properties in a Silty Loam Haplic Luvisol. J. Ecol. Eng. 2019, 20, 31–38. [Google Scholar] [CrossRef]
  4. Sokołowska, Z.; Szewczuk-Karpisz, K.; Turski, M.; Tomczyk, A.; Cybulak, M.; Skic, K. Effect of Wood Waste and Sunflower Husk Biochar on Tensile Strength and Porosity of Dystric Cambisol Artificial Aggregates. Agronomy 2020, 10, 244. [Google Scholar] [CrossRef] [Green Version]
  5. Toková, L.; Igaz, D.; Horák, J.; Aydin, E. Effect of Biochar Application and Re-Application on Soil Bulk Density, Porosity, Saturated Hydraulic Conductivity, Water Content and Soil Water Availability in a Silty Loam Haplic Luvisol. Agronomy 2020, 10, 1005. [Google Scholar] [CrossRef]
  6. Horel, A.; Gelybó, G.; Potyó, I.; Pokovai, K.; Bakacsi, Z. Soil Nutrient Dynamics and Nitrogen Fixation Rate Changes over Plant Growth in Temperate Soil. Agronomy 2019, 9, 179. [Google Scholar] [CrossRef] [Green Version]
  7. Liu, Z.; Zhu, M.; Wang, J.; Liu, X.; Guo, W.; Zheng, J.; Bian, R.; Wang, G.; Zhang, X.; Cheng, K.; et al. The responses of soil organic carbon mineralization and microbial communities to fresh and aged biochar soil amendments. GCB Bioenergy 2019, 11, 1408–1420. [Google Scholar] [CrossRef] [Green Version]
  8. Pokovai, K.; Tóth, E.; Horel, Á. Growth and Photosynthetic Response of Capsicum annuum L. in Biochar Amended Soil. Appl. Sci. 2020, 10, 4111. [Google Scholar] [CrossRef]
  9. Farkas, É.; Feigl, V.; Gruiz, K.; Vaszita, E.; Fekete-Kertész, I.; Tolner, M.; Kerekes, I.; Pusztai, É.; Kari, A.; Uzinger, N.; et al. Long-term effects of grain husk and paper fibre sludge biochar on acidic and calcareous sandy soils—A scale-up field experiment applying a complex monitoring toolkit. Sci. Total. Environ. 2020, 731. [Google Scholar] [CrossRef]
  10. Sokołowska, Z.; Jamroz, J.; Bańka, P. Apparent surface area of selected meal extrudates. Int. Agrophys. 2008, 22, 75–80. [Google Scholar]
  11. Greenland, D.J.; Hayes, M.H.B. The Chemistry of Soil Processes; J. Wiley: Hoboken, NJ, USA, 1981. [Google Scholar]
  12. Chenu, C.; Stotzky, G. Interactions between Microorganisms and Soil Particles. An Overview. In Interactions Between Soil Particles and Microorganisms; Wiley-VCH-Verlag: Weinheim, Germany, 2002. [Google Scholar]
  13. Arthur, E.; Tuller, M.; Moldrup, P.; De Jonge, L.W. Effects of biochar and manure amendments on water vapor sorption in a sandy loam soil. Geoderma 2015, 243–244, 175–182. [Google Scholar] [CrossRef]
  14. Hardie, M.; Clothier, B.; Bound, S.; Oliver, G.; Close, D. Does biochar influence soil physical properties and soil water availability? Plant. Soil 2014, 376, 347–361. [Google Scholar] [CrossRef]
  15. Horel, A.; Tóth, E.; Gelybó, G.; Dencső, M.; Farkas, C. Biochar Amendment Affects Soil Water and CO2 Regime during Capsicum Annuum Plant Growth. Agronomy 2019, 9, 58. [Google Scholar] [CrossRef] [Green Version]
  16. Gray, M.; Johnson, M.G.; Dragila, M.I.; Kleber, M. Water uptake in biochars: The roles of porosity and hydrophobicity. Biomass Bioenergy 2014, 61, 196–205. [Google Scholar] [CrossRef]
  17. Skic, K.; Boguta, P.; Sokołowska, Z. Analysis of the sorption properties of different soils using water vapour adsorption and potentiometric titration methods. Int. Agrophys. 2016, 30, 369–374. [Google Scholar] [CrossRef] [Green Version]
  18. Cybulak, M.; Sokołowska, Z.; Boguta, P. Hygroscopic moisture content of podzolic soil with biochar. Acta Agrophys. 2016, 23, 533–543. [Google Scholar]
  19. Antal, M.J.; Grønli, M. The Art, Science, and Technology of Charcoal Production. Ind. Eng. Chem. Res. 2003, 42, 1619–1640. [Google Scholar] [CrossRef]
  20. Lu, N.; Zhang, C. Separating External and Internal Surface Areas of Soil Particles. J. Geotech. Geoenviron. Eng. 2020, 146. [Google Scholar] [CrossRef]
  21. Galarneau, A.; Mehlhorn, D.; Guenneau, F.; Coasne, B.; Villemot, F.; Minoux, D.; Aquino, C.C.; Dath, J.-P. Specific Surface Area Determination for Microporous/Mesoporous Materials: The Case of Mesoporous FAU-Y Zeolites. Langmuir 2018, 34, 14134–14142. [Google Scholar] [CrossRef]
  22. De Jong, E. Comparison of three methods of measuring surface area of soils. Can. J. Soil Sci. 1999, 79, 345–351. [Google Scholar] [CrossRef]
  23. Paul, B.; Vanlauwe, B.; Ayuke, F.O.; Gassner, A.; Hoogmoed, M.; Hurisso, T.; Koala, S.; Lelei, D.K.; Ndabamenye, T.; Six, J.; et al. Medium-term impact of tillage and residue management on soil aggregate stability, soil carbon and crop productivity. Agric. Ecosyst. Environ. 2013, 164, 14–22. [Google Scholar] [CrossRef]
  24. Amézketa, E. Soil Aggregate Stability: A Review. J. Sustain. Agric. 1999, 14, 83–151. [Google Scholar] [CrossRef]
  25. Costa, O.Y.A.; Raaijmakers, J.M.; Kuramae, E.E. Microbial Extracellular Polymeric Substances: Ecological Function and Impact on Soil Aggregation. Front. Microbiol. 2018, 9. [Google Scholar] [CrossRef] [PubMed] [Green Version]
  26. Rillig, M.C.; Mummey, D.L. Mycorrhizas and soil structure. New Phytol. 2006, 171, 41–53. [Google Scholar] [CrossRef] [PubMed]
  27. Totsche, K.U.; Amelung, W.; Gerzabek, M.H.; Guggenberger, G.; Klumpp, E.; Knief, C.; Lehndorff, E.; Mikutta, R.; Peth, S.; Prechtel, A.; et al. Microaggregates in soils. J. Plant. Nutr. Soil Sci. 2018, 181, 104–136. [Google Scholar] [CrossRef] [Green Version]
  28. Pal, A.; Pandey, S. Role of Glomalin in Improving Soil Fertility: A Review. Int. J. Plant. Soil Sci. 2014, 3, 1112–1129. [Google Scholar] [CrossRef] [PubMed]
  29. Magurno, F.; Malicka, M.; Posta, K.; Wozniak, G.; Lumini, E.; Piotrowska-Seget, Z. Glomalin gene as molecular marker for functional diversity of arbuscular mycorrhizal fungi in soil. Biol. Fertil. Soils 2019, 55, 411–417. [Google Scholar] [CrossRef]
  30. Rillig, M.C. Arbuscular mycorrhizae, glomalin, and soil aggregation. Can. J. Soil Sci. 2004, 84, 355–363. [Google Scholar] [CrossRef] [Green Version]
  31. Rosier, C.L.; Piotrowski, J.S.; Hoye, A.T.; Rillig, M.C. Intraradical protein and glomalin as a tool for quantifying arbuscular mycorrhizal root colonization. Pedobiologia 2008, 52, 41–50. [Google Scholar] [CrossRef]
  32. Wilson, G.W.T.; Rice, C.W.; Rillig, M.C.; Springer, A.; Hartnett, D.C. Soil aggregation and carbon sequestration are tightly correlated with the abundance of arbuscular mycorrhizal fungi: Results from long-term field experiments. Ecol. Lett. 2009, 12, 452–461. [Google Scholar] [CrossRef]
  33. Koide, R.T. Chapter 25—Biochar—Arbuscular Mycorrhiza Interaction in Temperate Soils. In Mycorrhizal Mediation of Soil; Johnson, N.C., Gehring, C., Jansa, J., Eds.; Elsevier: Berlin, Germany, 2017; pp. 461–477. [Google Scholar] [CrossRef]
  34. Warnock, D.D.; Lehmann, J.; Kuyper, T.W.; Rillig, M.C. Mycorrhizal responses to biochar in soil—Concepts and mechanisms. Plant. Soil 2007, 300, 9–20. [Google Scholar] [CrossRef]
  35. Dövényi, Z. Magyarország Kistájainak Katasztere; MTA Földrajztudományi Kutatóintézet: Budapest, Hungary, 2010; p. 876. (In Hungarian) [Google Scholar]
  36. Uzinger, N.; Takács, T.; Szili-Kovács, T.; Radimszky, L.; Füzy, A.; Draskovits, E.; Szűcs-Vásárhelyi, N.; Molnár, M.; Farkas, É.; Kutasi, J.; et al. Fertility Impact of Separate and Combined Treatments with Biochar, Sewage Sludge Compost and Bacterial Inocula on Acidic Sandy Soil. Agronomy 2020, 10, 1612. [Google Scholar] [CrossRef]
  37. Lim, T.; Spokas, K.A.; Feyereisen, G.W.; Novak, J. Predicting the impact of biochar additions on soil hydraulic properties. Chemosphere 2016, 142, 136–144. [Google Scholar] [CrossRef] [PubMed]
  38. Alburquerque, J.A.; Calero, J.M.; Barrón, V.; Torrent, J.; Del Campillo, M.C.; Gallardo, A.; Villar, R. Effects of biochars produced from different feedstocks on soil properties and sunflower growth. J. Plant. Nutr. Soil Sci. 2014, 177, 16–25. [Google Scholar] [CrossRef]
  39. Schon, M.; Compton, M.P.; Bell, E.; Burns, I. Nitrogen Concentrations Affect Pepper Yield and Leachate Nitrate-nitrogen from Rockwool Culture. HortScience 1994, 29, 1139–1142. [Google Scholar] [CrossRef]
  40. Meier, U. Growth Stages of Mono- and Dicotyledonous Plants. BBCH-Monograph, 2nd ed.; Blackwell Science: Berlin, Germany, 2001. [Google Scholar]
  41. Di Gléria, J.; Klimes-Szmik, A.; Dvoracsek, M. Bodenphysik und Bodenkolloidik; Akadémiai Kiadó: Budapest, Hungary, 1962; p. 795. [Google Scholar]
  42. ALFA-WERO. Polish Standard PN-Z-19010–1 Soil Quality. In Determination of Specific Surface Area of Soils by Water Sorption (BET); ALFA-WERO: Warsaw, Poland, 1997. (In Polish) [Google Scholar]
  43. Mooney, R.W.; Keenan, A.G.; Wood, L.A. Adsorption of Water Vapor by Montmorillonite. I. Heat of Desorption and Application of BET Theory1. J. Am. Chem. Soc. 1952, 74, 1367–1371. [Google Scholar] [CrossRef]
  44. Phillips, J.; Hayman, D. Improved procedures for clearing roots and staining parasitic and vesicular-arbuscular mycorrhizal fungi for rapid assessment of infection. Trans. Br. Mycol. Soc. 1970, 55, 158–161. [Google Scholar] [CrossRef]
  45. Trouvelot, A.; Kought, J.L.; Gianinazzi-Pearson, V. Mesure du taux de mycorhization VA d’un systeme radiculaire. Recherche de methodes d’estimation ayant une signification fonctionnelle. In Physiological and Genetical Aspects of Mycorrhizae; Gianinazzi, S., Gianinazzi-Pearson, V., Eds.; INRA: Paris, France, 1986; pp. 217–221. ISBN 285340-774-8. [Google Scholar]
  46. Bradford, M.M. A rapid and sensitive method for the quantitation of microgram quantities of protein utilizing the principle of protein-Dye binding. Anal. Biochem. 1976, 72, 248–254. [Google Scholar] [CrossRef]
  47. Wright, S.; Upadhyaya, A. A survey of soils for aggregate stability and glomalin, a glycoprotein produced by hyphae of arbuscular mycorrhizal fungi. Plant. Soil 1998, 198, 97–107. [Google Scholar] [CrossRef]
  48. Brunauer, S.; Deming, L.S.; Deming, W.E.; Teller, E. On a Theory of the van der Waals Adsorption of Gases. J. Am. Chem. Soc. 1940, 62, 1723–1732. [Google Scholar] [CrossRef]
  49. Skic, K.; Sokołowska, Z.; Boguta, P.; Skic, A. The effect of application of digestate and agro-food industry sludges on Dystric Cambisol porosity. PLoS ONE 2020, 15, e0238469. [Google Scholar] [CrossRef] [PubMed]
  50. Horel, Á.; Barna, G.; Makó, A. Soil physical properties affected by biochar addition at different plant phaenological phases. Part I. Int. Agrophys. 2019, 33, 255–262. [Google Scholar] [CrossRef]
  51. Boguta, P.; Sokołowska, Z.; Skic, K.; Tomczyk, A. Chemically engineered biochar—Effect of concentration and type of modifier on sorption and structural properties of biochar from wood waste. Fuel 2019, 256. [Google Scholar] [CrossRef]
  52. Bonelli, P.R.; Buonomo, E.L.; Cukierman, A.L. Pyrolysis of Sugarcane Bagasse and Co-pyrolysis with an Argentinean Subbituminous Coal. Energy Sourc. Part A Recover. Util. Environ. Eff. 2007, 29, 731–740. [Google Scholar] [CrossRef]
  53. Katyal, S.; Thambimuthu, K.; Valix, M. Carbonisation of bagasse in a fixed bed reactor: Influence of process variables on char yield and characteristics. Renew. Energy 2003, 28, 713–725. [Google Scholar] [CrossRef]
  54. Cybulak, M.; Sokołowska, Z.; Boguta, P. Impact of Biochar on Physicochemical Properties of Haplic Luvisol Soil under Different Land Use: A Plot Experiment. Agronomy 2019, 9, 531. [Google Scholar] [CrossRef] [Green Version]
  55. Baiamonte, G.; Crescimanno, G.; Parrino, F.; De Pasquale, C. Effect of biochar on the physical and structural properties of a sandy soil. Catena 2019, 175, 294–303. [Google Scholar] [CrossRef]
  56. Cao, T.; Chen, W.; Yang, T.; He, T.; Liu, Z.; Meng, J. Surface Characterization of Aged Biochar Incubated in Different Types of Soil. Bioresources 2017, 12, 6366–6377. [Google Scholar] [CrossRef] [Green Version]
  57. Agegnehu, G.; Srivastava, A.; Bird, M.I. The role of biochar and biochar-compost in improving soil quality and crop performance: A review. Appl. Soil Ecol. 2017, 119, 156–170. [Google Scholar] [CrossRef]
  58. Begum, N.; Qin, C.; Ahanger, M.A.; Raza, S.; Khan, M.I.; Ashraf, M.; Ahmed, N.; Zhang, L. Role of Arbuscular Mycorrhizal Fungi in Plant Growth Regulation: Implications in Abiotic Stress Tolerance. Front. Plant. Sci. 2019, 10. [Google Scholar] [CrossRef] [Green Version]
  59. Garmendia, I.; Goicoechea, N.; Aguirreolea, J. Effectiveness of three Glomus species in protecting pepper (Capsicum annuum L.) against verticillium wilt. Biol. Control. 2004, 31, 296–305. [Google Scholar] [CrossRef]
  60. Hernádi, I.; Sasvári, Z.; Albrechtová, J.; Vosátka, M.; Posta, K. Arbuscular Mycorrhizal Inoculant Increases Yield of Spice Pepper and Affects the Indigenous Fungal Community in the Field. HortScience 2012, 47, 603–606. [Google Scholar] [CrossRef] [Green Version]
  61. Latef, A.A.H.A.; Chaoxing, H. Does Inoculation with Glomus mosseae Improve Salt Tolerance in Pepper Plants? J. Plant. Growth Regul. 2014, 33, 644–653. [Google Scholar] [CrossRef]
  62. Regvar, M.; Vogel-Mikuš, K.; Ševerkar, T. Effect of AMF inoculum from field isolates on the yield of green pepper, parsley, carrot, and tomato. Folia Geobot. Phytotaxon. 2003, 38, 223–234. [Google Scholar] [CrossRef]
  63. Rouphael, Y.; Colla, G. Editorial: Biostimulants in Agriculture. Front. Plant. Sci. 2020, 11. [Google Scholar] [CrossRef] [Green Version]
  64. Selvakumar, G.; Yi, P.H.; Lee, S.E.; Shagol, C.C.; Han, S.G.; Sa, T.; Chung, B.N. Effects of Long-Term Subcultured Arbuscular Mycorrhizal Fungi on Red Pepper Plant Growth and Soil Glomalin Content. Mycobiology 2018, 46, 122–128. [Google Scholar] [CrossRef]
  65. Sensoy, S.; Demir, S.; Türkmen, Ö.; Erdinc, C.; Savur, O.B. Responses of some different pepper (Capsicum annuum L.) genotypes to inoculation with two different arbuscular mycorrhizal fungi. Sci. Hortic. 2007, 113, 92–95. [Google Scholar] [CrossRef]
  66. Wu, Q.-S.; Cao, M.-Q.; Zou, Y.-N.; Chengjun, J. Direct and indirect effects of glomalin, mycorrhizal hyphae and roots on aggregate stability in rhizosphere of trifoliate orange. Sci. Rep. 2015, 4. [Google Scholar] [CrossRef]
  67. Rillig, M.C.; Steinberg, P.D. Glomalin production by an arbuscular mycorrhizal fungus: A mechanism of habitat modification? Soil Biol. Biochem. 2002, 34, 1371–1374. [Google Scholar] [CrossRef]
  68. Lee, J.-E.; Eom, A.-H. Effect of Organic Farming on Spore Diversity of Arbuscular Mycorrhizal Fungi and Glomalin in Soil. Mycobiology 2009, 37, 272–276. [Google Scholar] [CrossRef] [Green Version]
  69. Steinberg, P.D.; Rillig, M.C. Differential decomposition of arbuscular mycorrhizal fungal hyphae and glomalin. Soil Biol. Biochem. 2003, 35, 191–194. [Google Scholar] [CrossRef]
  70. Amendola, C.; Montagnoli, A.; Terzaghi, M.; Trupiano, D.; Oliva, F.; Baronti, S.; Miglietta, F.; Chiatante, D.; Scippa, G. Short-term effects of biochar on grapevine fine root dynamics and arbuscular mycorrhizae production. Agric. Ecosyst. Environ. 2017, 239, 236–245. [Google Scholar] [CrossRef]
  71. Šimanský, V. Effects of biochar and biochar with nitrogen on soil organic matter and soil structure in haplic Luvisol. Acta Fytotech. Zootech. 2016, 19, 129–138. [Google Scholar] [CrossRef] [Green Version]
  72. LeCroy, C.; Masiello, C.A.; Rudgers, J.A.; Hockaday, W.C.; Silberg, J.J. Nitrogen, biochar, and mycorrhizae: Alteration of the symbiosis and oxidation of the char surface. Soil Biol. Biochem. 2013, 58, 248–254. [Google Scholar] [CrossRef] [Green Version]
  73. Zhang, J.; Tang, X.; Zhong, S.; Yin, G.; Gao, Y.; He, X. Recalcitrant carbon components in glomalin-related soil protein facilitate soil organic carbon preservation in tropical forests. Sci. Rep. 2017, 7, 1–9. [Google Scholar] [CrossRef] [Green Version]
Figure 1. Changes in hygroscopic water content (hy1) over time for the different treatments measured at constant 31.5% relative humidity and 20 °C temperature. C, BC0.5, BC2.5, and BC5.0 represent control, 0.5%, 2.5%, and 5.0% biochar amended soil, respectively. Means denoted by the same letter did not significantly differ at p < 0.05; lowercase letters denote the comparison within biochar treatments.
Agronomy 10 01933 g001
Figure 2. Adsorption (lower curves) and desorption (upper curves) isotherms and hysteresis loops obtained for the (a) biochar only, (b) for the different treatments at the end of the experiment, (c) control, (d) BC0.5, (e) BC2.5, and (f) BC5.0. BC0.5, BC2.5, and BC5.0 represent 0.5%, 2.5%, and 5.0% biochar amended soil, respectively. W represents the number of weeks when sampling occurred. N means the quantity adsorbed.
Agronomy 10 01933 g002
Figure 3. Changes in soil surface area (SSAwv) over time for the different treatments, (a) adsorption and (b) desorption values. C, BC0.5, BC2.5, and BC5.0 represent control, 0.5%, 2.5%, and 5.0% biochar amended soil, respectively. W represents the number of weeks during sampling periods. Means denoted by the same letter did not significantly differ at p < 0.05; lowercase letters denote the comparison within biochar treatments, while uppercase letters compare the means of time periods.
Agronomy 10 01933 g003
Figure 4. Changes in SSAN2 over time for the different treatments. C, BC0.5, BC2.5, and BC5.0 represent control, 0.5%, 2.5%, and 5.0% biochar amended soil, respectively. W represents the number of weeks during sampling periods. Means denoted by the same letter are not significant at p < 0.05; lowercase letters denote the comparison within biochar treatments, while uppercase letters compare the means in the sampling periods.
Agronomy 10 01933 g004
Figure 5. Intensity of (a) arbuscular mycorrhizal fungi (AMF) colonization (M%) and (b) arbusculum richness of root system (A%) for the different treatments over time. BC0.5, BC2.5, and BC5.0 represent 0.5%, 2.5%, and 5.0% biochar amended soil, respectively.
Agronomy 10 01933 g005
Figure 6. Glomalin (easily-extractable glomalin-related soil protein, EEG-GRSP) production for the different treatments over time. C, BC0.5, BC2.5, and BC5.0 represent control, 0.5%, 2.5%, and 5.0% biochar amended soil, respectively. W represents the number of weeks during sampling periods.
Agronomy 10 01933 g006
Figure 7. Pearson correlation analysis (r) between the investigated soil physical and biological parameters for the different treatments over the course of the study. The used abbreviations are the following: hy1 is the hygroscopic water content, SSAN2 is the soil specific surface area measured using nitrogen gas, SSAads and SSAdes are the soil specific surface areas determined using water vapor adsorption and desorption data, respectively, MaAS is the macroaggregate stability, MiAS is the microaggregate stability, GMD is the geometric mean diameter of soil aggregate, U is the ratio of the 10% and 60% finer soil aggregate sizes (d10/d60), M is the intensity of AMF root colonization, A is the arbusculum richness of the root system, Gl_1 mm and Gl_2 mm are the easily-extractable glomalin-related soil protein in <1 mm and 1–2 mm soil fractions, of the investigated soil samples, respectively. Correlation is significant * at the 0.05, ** at the 0.01, and *** at the 0.001 levels.
Agronomy 10 01933 g007
Figure 8. Pearson correlation analysis (r) between the investigated soil chemical and biological parameters for the different treatments over the course of the study. SOC refers to the soil organic carbon, M is the intensity of AMF root colonization, A is the arbusculum richness of the root system, Gl_1 mm and Gl_2 mm are the easily-extractable glomalin-related soil protein in <1 mm and 1–2 mm soil fractions, of the investigated soil samples, respectively. Correlation is significant * at the 0.05, ** at the 0.01, and *** at the 0.001 levels.
Agronomy 10 01933 g008
Table 1. Physical and chemical characteristics of the soil and biochar used at the beginning of the experiment. n = 3; mean ± standard deviation (SD). VWC represents volumetric water content, OC represents organic carbon content, EC represents the electrical conductivity. Part of the data was adapted from Pokovai et al. [8]. a Data were estimated from a different study using the same biochar type [36].
Chemical and Physical Parameters at t = 0SoilSDBiocharSD
2–0.052 mm (%)25.84±0.6484.52±0.08
0.052–0.0066 mm (%)50.03±0.7613.90±0.70
<0.0066 mm (%)24.13±0.151.57±4.23
pH(H2O)7.97±0.0410.33±0
Total N (%)0.14±0.021.0±0.1
NH4+ (mg kg−1)5.84±1.011.9±0.1
CaCO3 (%)10.41±0.345.75 a
P2O5 (mg kg−1)977.9±158.15031.1±32.6
K2O (mg kg−1)443.1±96.213,570.3±59.0
OC (%)0.93±0.0727.89±1.73
EC 2.5 (mS cm−1) *0.2±0.013.03
VWCinitial (%)26.51±3.7
* EC of biochar was determined from 1:5 suspension.
Publisher’s Note: MDPI stays neutral with regard to jurisdictional claims in published maps and institutional affiliations.

