Article

Biochar and Its Effects on Plant–Soil Macronutrient Cycling during a Three-Year Field Trial on Sandy Soil with Peppermint (Mentha piperita L.). Part I: Yield and Macro Element Content in Soil and Plant Biomass

by
Urszula Sadowska
1,
Iwona Domagała-Świątkiewicz
2,* and
Andrzej Żabiński
1
1
Department of Machinery Exploitation, Ergonomics and Production Processes, Faculty of Production and Power Engineering, University of Agriculture in Kraków, Łupaszki 6, 30-198 Kraków, Poland
2
Department of Plant Biology and Biotechnology, Faculty of Biotechnology and Horticulture, University of Agriculture in Krakow, Al. Mickiewicza 21, 31-120 Krakow, Poland
*
Author to whom correspondence should be addressed.
Agronomy 2020, 10(12), 1950; https://doi.org/10.3390/agronomy10121950
Submission received: 31 October 2020 / Revised: 9 December 2020 / Accepted: 9 December 2020 / Published: 12 December 2020
(This article belongs to the Special Issue Impact of Biochar and Compost on Soil Quality and Crop Yield)

Abstract

:
Pyrolyzed organic residues can be incorporated as a soil additive to improve their properties, crop productivity, or to increase retention or absorption of different compounds. However, in agronomy, the practice of biochar application is still under examination. The interactions between plant, soil, and biochar can be complex, and determines the agronomic effects obtained. A three-year field experiment was conducted to determine the effects of biochar addition and nitrogen (N) fertilization on biomass productivity and nutrient uptake of Mentha piperita L. The experiment was conducted with a three-factorial design in triplicate at N fertilizer rates of 75, 100, and 125 kg N ha−1 and biochar rates of 0, 5, 15, and 45 t ha−1. Commercial wood-based biochar produced at 650 °C was incorporated into sandy soil in 2017. Generally, our results demonstrated potential for treating a sandy soil, since biochar improved the nutrient availability for peppermint. However, on average, during a three-year mint-yielding period, no significant effect of the applied dose of biochar on this parameter was found. Significantly more soluble Ca, K, and SO4-S was found in the soil amended with biochar as compared with the control soil. Biochar, in doses of 15 and 45 t ha−1, increased the NH4-N concentration in the soil in the second and third year of the study, as well as NO3-N in 2018. The greatest amount of N and P was contained in the peppermint biomass after using 15 and 45 t biochar ha−1. The highest dose of biochar (45 t ha−1) also increased the contents of K and S in plants. Nitrogen fertilization increased the dry matter yield of peppermint on the harvest sampling dates. The N content in the mint increased proportionally to the nitrogen dose in fertilization, regardless of the biochar dose applied. The use of biochar in doses of 15 and 45 t ha−1 in coarse-textured soil contributed to increased use of nitrogen by plants after nitrogen fertilization at doses of 100 and 125 kg N ha−1. These findings suggest that the time-dependent responses of soil to biochar amendment are strongly influenced by plant, microbial, and soil feedback; if so, then practical long-term biochar effectiveness requires further study.

1. Introduction

There is global interest in valorizing biomass residues into valuable biomaterial to promote a circular economy for sustainable development. Lehman and Joseph [1] defined biochar as a C-rich material produced by thermochemical conversion (pyrolysis) of organic waste materials in a controlled low-oxygen environment. Thermally stabilized biomass can be purposely used as a soil amendment to provide a benefit by maintaining physical and chemical properties [2]. The results of many studies have confirmed that charred biomass (biochar) could be used as a soil additive to improve soil properties, crop productivity, or to increase the retention or absorption of different compounds [3,4,5,6,7]. A statistical meta-analysis evaluating the relationship between biochar and crop productivity indicated a small but statistically significant benefit of biochar application to soils on crop productivity, with a mean increase of 10% [8]. The greatest positive effects were found in acidic (14%) and neutral pH soils (13%), and in soils with coarse (10%) or medium texture (13%). Several proposed mechanisms explaining the increase in soil quality and fertility have been proposed, for example, a liming effect [6,7,8,9,10], increasing nutrient and water holding capacity [11,12], enhancing water and nutrient uptake, and reducing N leaching [1,5,13]. The application of biochar to soils has also improved some chemical soil properties such as increased cation exchange capacity (CEC) and increased carbon storage [14,15]. Biochar can modify microbial activity and the symbiotic relationship between plants and microbes, as well as changes in root growth [2,3,16].
Describing biochar properties is the first step in recognizing its agronomic and environmental usefulness and directing future research trials [17]. The characteristics of biochar derived from manure or crop residues differ significantly from biochar derived from lignocellulosic feedstock. Biochar produced at a lower temperature (<400 °C) has different properties from that produced at higher temperatures (>600 °C) [15,18,19,20]. Biochar that is produced from manure and crop residue is richer in nutrients and has higher pH and surface area than biochar made from wood-based feedstocks [21,22]. Similarly, slowly pyrolyzed biochar, produced at a higher temperature, tends to have a larger surface area and higher pH values, but has lower plant-available nutrients than biochar produced at a lower temperature [14,23,24]. Plant-derived biochar produced at a high pyrolysis temperature is stable and resistant to microbial decomposition due to its high aromatic carbon content. The use of resistant biochar may be a key strategy for increasing C sequestration in soils, acting to reduce greenhouse gas emissions [25]. Biochar affects plant nutrient availability and plays a significant role in biogeochemical processes in soils, especially in the nutrient cycling dynamics [3,5]. Biochar shows promise as a soil stabilizer as it can reduce N loss, and therefore improves soil fertility [4,26,27,28]. Many studies have been performed to explain the effect of biochar on soil N availability. Nguyen et al. [29] reviewed 56 studies with 1080 experimental cases, and proposed the following two main mechanisms: abiotic, including adsorption and desorption, and biotic, including mineralization and immobilization, to clarify the influence of biochar on the N-cycling dynamics in soil. Other factors affecting soil inorganic N after biochar application include environmental and agrotechnical factors such as soil type, weather conditions, cropping system, etc. Nguyen et al. [29] reported that long-term studies of mineral nitrogen in soil amendment biochar were limited; thus, the long-term effects of biochar on N remain unclear. The C/N ratio of biochar controls whether biochar prompts N immobilization or mineralization [30,31,32]. Commonly, the nitrogen ions’ sorption capacity (chemisorption or H-bonding) of biochar decreases with increased pyrolysis temperature [9,33].
Generally, the effect of biochar on soil and plants is more noticeable under poor soil conditions than in fertile soils and under sufficient rainfall [8,9,12]. However, in agronomy, the practice of biocarbon application is still being examined, with new innovative solutions being developed. The complexity of the interactions between the plant, soil, and biocarbon can be high, and determines the agronomic effects obtained [17]. Further research efforts are needed to explain the mechanism in different soil conditions and management practices and to include studies over longer periods.
The proper management of the soil environment should consider the different functions of soils such as soil agricultural productivity, soil as a habitat for living organisms, and soil retention capacity. The quality of Polish soils is amongst the poorest in Europe. The proportion of coarse-textured soil in Poland is about 55% [34]. The limited water supply in sandy soil, as well as the low soil organic matter, are critical factors for crop growth. Many of these soils become acidified because of their low buffering capacity. These areas are considered to be management zones for improving crop productivity and soil properties responsible for soil quality and functions [35]. In this context, any contribution of organic matter is likely to improve soil quality and productivity.
Peppermint (Mentha piperita L.) belongs to the Labiatae family and is widely distributed in crops around the world. It is commonly used both in folk medicine and in the pharmaceutical, cosmetic, food, and animal feed industries. Peppermint is one of the oldest medicinal plants [36]. The medical use of peppermint occurs in the forms of peppermint tea and peppermint oil [37]. About 2000 tons of the world’s essential oil come from various species of the genus Mentha, which is the second most important group of oil plants after citrus plants [38].
In this study, a three-year field experiment was conducted to determine the effects of biochar and nitrogen fertilizer amendment on the availability of macronutrients and yield of peppermint production in a sandy soil. The objectives of this study were (1) to assess and compare the impacts of biochar and N fertilizer on aboveground mint biomass, (2) to examine macronutrient concentrations in plant biomass, and (3) to evaluate macronutrients availability in soil. We expected that biochar-supplemented nitrogen would increase plant biomass and affect soil nutrients.

2. Material and Methods

2.1. Field Trial

The research was conducted in 2017–2019 at the experimental station in Mydlniki near Kraków (50°5’1.16’ N, 19°51’5.16 E). The soil site from which samples were taken for analysis, during the spring before the start of the experiment, was slightly acidic to slightly alkaline (Table 1).
The calcium (Ca) content in the soil was, on average ,2199 mg Ca dm−3. In coarse-textured soils, a calcium content of 600–1000 mg dm−3 is considered to be optimal [39]. The salt concentration in the soil solution (EC) was very low. The standards define the range of 1–2 mS cm−1 as an acceptable, safe limit for this parameter. The organic carbon content was low, which was typical of light and very light soils, which were present at this experimental site. The soluble potassium (K) content of the soil was low, and the magnesium (Mg) content was high. In sandy soils, optimal concentrations for these components should be 90–120 mg K and 30–60 mg Mg dm−3 of soil [39]. For sulfur (SO4-S), a content above 25 mg S is assessed as high.
Biochar, at doses of 0, 5, 15, and 45 t ha−1, was introduced into the soil during the spring of 2017, before mint cultivation, and was thoroughly mixed with the 0–20 cm soil upper layer using cultivation tools.
Commercially available biochar produced in Poland (FLUID S.A., Kraków, Poland) was made from mixed wood biomass chips. This company manufactures biochar from biomass in a thermalization energy recovery module. The mean elemental composition and ash content values reported by the biochar producer were the following: C = 72.81% ± 0.08%, N = 0.75% ± 0.014%, H = 3.51% ± 0.049%, S = 0.075% ± 0.001%, and ash = 6.05% ± 0.06%. The moisture content in biochar was 4.5 ± 0.2%, bulk density was 223.2 ± 3.2 kg m−3, and pH was 6.62 ± 0.12
Rooted herbaceous cuttings of peppermint, variety Schoko, were planted in 3 × 3 m plots in triplicate at a spacing of 40 × 21 cm, which produced a density of 13 plants m−2. Differentiated N fertilization in the amounts of 75, 100, and 125 kg ha−1 was used. Before the experiment was set up, N fertilization was applied in the amount of 2/3 of the originally assumed dose in the form of 34% N as ammonium nitrate, and the rest was supplemented after a month of plant vegetation. The same doses of nitrogen were used in the following years of cultivation: 2/3 in the spring after the beginning of vegetation and the rest in monthly intervals. K fertilization was applied in accordance with the previous tests of soil samples at 240 kg ha−1 of potassium sulfate (50% K2O). P fertilization was not applied because the soil intended for the experiment was rich in this component. Every year, during plant vegetation, mechanical weed control was applied.

2.2. Climatic Condition

During the second half of the vegetation period, the temperature patterns were relatively similar between the years. The first half of the growing season in 2018 was warmer, with mean air temperatures during April–September of 15.4, 17.7, and 16.5 °C, in 2017–2019, respectively. The rainfall patterns were markedly different during the three agronomic years (Figure 1). The driest year was 2018 (569 mm), with a particularly dry spring when the beginning of the vegetation period occurred. The most precipitation was recorded in 2017 (702 mm), but with very low precipitation in May, June, and July. In 2019, the total precipitation was 639 mm; however, lack of rainfall and the highest temperature in June were noted.

2.3. Plant Analysis

One herbal harvest was performed during each year of research. The plants were cut approximately 5 cm above the soil surface at the time of flowering. The plant material was washed and rinsed in distilled water, then dried at room temperature and ground. From the ground plant material, the dry matter content was determined by the drying method. Total nitrogen was determined using the Kjeldahl method [40], and the content of mineral elements after microwave mineralization in concentrated nitric acid at 200 °C also was determined. For elemental analyses, a Prodigy High Dispersion ICP-OES Spectrometer (Teledyne Leeman Labs, Hudson NH, USA) was used.

2.4. Soil Analysis

Soil samples were collected with a soil core sampler before trials from all study areas. Each year at the same time, plant material was collected for analysis from each experiment treatment separately (three repetitions).
Soil pH and salts concentration in soil solution (EC) were measured at a soil-to-water ratio of 1:2. The available form of macronutrients was determined in 0.03 mol dm−3 CH3COOH following the universal method [40]. The available forms of nutrients were determined using the inductively coupled argon plasma atomic emission spectroscopy ICP-OES technique (Teledyne Leeman Labs., Mason, OH, USA).

2.5. Statistical Analysis

The three-year (2017–2019) experimental design was factorial and completely randomized with four biochar doses (0, 5, 15, and 45 t ha−1) combined with three N fertilizer doses (75, 100, and 125 kg N ha−1). The data were subjected to analysis of variance (ANOVA) for significant differences between factors such as year, biochar dose, N fertilizer dose, and their interaction. When significant F-tests were obtained (p < 0.05), the factors’ separation was determined using Tukey’s test. Data were statistically analyzed using (Statistica 13, Dell Inc. Tulsa, OK, USA (StatSoft Polska, Kraków)

3. Results and Discussion

When analyzing the results of the peppermint herb yielding, differences between the study years were noticed (Table 2). The lowest yields were achieved in 2017, which, in the case of perennial plants, seemed to be logical and consistent with the literature. Usually, the highest mint yields are obtained during the second and third years of plantation [41], which is confirmed in our results. The final result was largely influenced by meteorological conditions. One of the factors that reduced mint yield the most was drought.
Summarizing the results of mint herb yield throughout the duration of the experiment, there was no effect of the applied dose of biochar on this parameter. Average yields were similar to each other. However, the effect of the applied N dose on the yields was demonstrated. At the same time, similar yields were obtained for 100 and 125 kg ha−1 and they were on average 17.6 t ha−1 and 18.5 t ha−1, respectively.
In 2017, soil enrichment with biochar had no effect on increasing the herb weight; the highest yields were recorded on plots where biochar was not used, with average values of 14.3 t ha−1 (Table 3). We found no difference in herb yield under the influence of nitrogen fertilization. However, two-thirds of the N dose was applied directly before planting rooted cuttings, and they required a period of acclimatization in their new position. In 2018, 15 and 45 tons of ha−1 biochar doses significantly increased the peppermint yield, at 23.8 and 24.7 t ha−1, respectively. The lowest dose of biochar used in the experiment (5 t ha−1) did not increase the yield in relation to the zero dose.
Butar et al. [42] showed that the application of biochar in the growing medium in a proportion of 1:3 reduced the content of peppermint dry matter in relation to other substrates in the composition with chicken manure or compost from oil palm waste. Conversely, Olszewski and Eisenman [43] indicated a slight increase in the dry matter of peppermint grown in the medium with the addition of 5%, 10%, and 15% biochar as compared with a control.
Nitrogen fertilization had a significant effect on the peppermint herb yield. In 2018, the highest and comparable yields were achieved at doses of 100 and 125 kg ha−1 at 23.5 and 24.6 t ha−1, respectively. During the third year of research (2019), only the applied nitrogen fertilization influenced the amount of peppermint herb yield. The highest yields were achieved at doses of 125 and 100 kg ha−1 at 16.8 and 18.3 t ha−1, respectively.
Similarly, Hasanah et al. [44] noted that an increase in morphometric parameters of peppermint plants was determined by organic fertilization and not the used biochar in a one-year pot experiment with biochar. Zheljazkov et al. [45] and Ram et al. [46] observed an increase in mint biomass yield with increasing nitrogen doses. The yield of herbs and other crops depends on the plant density per unit area, which, especially in wide-row crops, may produce different results.
Mansoori [47], with eight plants m−2, obtained fresh weight yields of 2564 kg ha−1, which translated into 841 kg ha−1 of dried raw material. With a density of 20 units M−2, the yield was higher and amounted to 3211 and 1012 kg ha−1, respectively. Verma et al. [48] reported a higher yield of peppermint with the combined use of mineral fertilizers and manure as compared with pure mineral fertilization.
The obtained results of our research indicate a similar production effect with fertilization of 100 and 125 kg ha−1 with a relatively small difference in the applied dose. Poshtdar et al. [41] compared the peppermint yield at doses of 0, 70, 140, 210, and 280 kg N ha−1 and different types of mineral fertilizers and noticed the maximum efficiency at 210 and 280 kg N ha−1. Similar trends in terms of the effect of biochar and nitrogen doses in individual years of the research were related to the dry matter yields of mint herb (Table 4).

3.1. Chemical Properties of Soil

We noted changes in the physical and chemical properties of the soil caused by the passage of time; the use of biochar significantly influenced the soil pH (pH) and the content of soluble forms of macro elements (Table 5). Significantly higher soil reaction and higher contents of Ca, Mg, P, and SO4-S were found during the first year of the study. During the second year, significantly more nitrate nitrogen (NO3-N) and K were found in the soil. During the last year, the soil was characterized by the highest salt (EC) and ammonium nitrogen (NH4-N) contents.
The average values obtained during three years of research indicated that the biochar used in various doses (5, 15, and 45 t ha−1) had a significant effect on pH, EC, and the content of macro elements in the soil, except for magnesium (Table 5). The significant interactions of the year and the dose of biochar or nitrogen dose and the dose of biochar and nitrogen dose are presented in Figure 1, Figure 2 and Figure 3.

3.2. Soil Reaction (pH) and Salts Concentration in Soil Solution

The pH of the examined soil was already at pH 7.03 (before planting, Table 3) and an improvement in pH after biochar application was not expected. However, on average, over the three-year period, the highest soil pH (pH 7.72) was found in a soil where 45 t biochar ha−1 was used, but it differed significantly only in relation to the dose of 15 t ha−1. During the first and second years of research, the highest dose of biochar (45 t ha−1) significantly increased the soil pH value in relation to the control. In 2017, the pH of the soil increased in proportion to the applied doses of biochar.
The increase in soil pH during the first two years after biochar amendment can be explained by the use of high-temperature product (650 °C). Lower-temperature pyrolysis (<400 °C) usually produces acidic biochar, whereas high-temperature pyrolysis (>600 °C) produces alkaline biochar [21,24]. Bista et al. [6] and Baigorri et al. [7] suggested that alkaline biochar with high liming value could be used as a substitute for lime to reduce soil acidity without emitting carbon dioxide. With increasing pyrolysis temperature, basic cations in the ashes are enriched, which may be associated with alkaline carbonates, oxides, and hydroxides [19]. We found that three years after the application of biochar at a dose of 45 t ha−1, the soil pH was significantly lower than in the untreated and the 5 t biochar dose plots (Figure 2a). The obtained results are consistent with those of Johnes et al. [3], who reported that after three years of incorporation of biochar in the soil, the pH and EC had fallen significantly. Additionally, significant losses of Ca, K, and Na were observed; however, no changes in P or NH4+ concentration were found.
In general, the EC in the examined sandy soil was very low and did not exceed 100 µS cm−1 (Table 5). Our three-year study demonstrated that biochar, regardless of the dose used, significantly increased the salt concentration in the soil in relation to the control. The ash content of biochar, which can affect the salts concentration in the soil solution, is dependent on the nature of the feedstock. Here, biochar was made from a woody mix biomass and the ash content in the dry matter was 6.05%. Literature data showed that the ash content in biocarbon made of woody plants ranged from 0.3 to 7% [19,24]. The concentration of salt in the soil solution in the first year of the study (2017) was significantly higher for the sites where biochar was used as compared with the control. However, during the second and third years of the research, this was observed only for the doses of 5 and 45 t of biochar ha−1 (Figure 2b).
For the combination with the doses of 5 and 15 t of biochar, a proportional increase in salt concentration was observed with an increase in the dose of N (Figure 4a). Biochar introduced into the soil at the highest dose effectively reduced the soil EC after the application of ammonium nitrate at the highest dose of 125 kg N ha−1, which could indicate sorption of the introduced nitrogen.

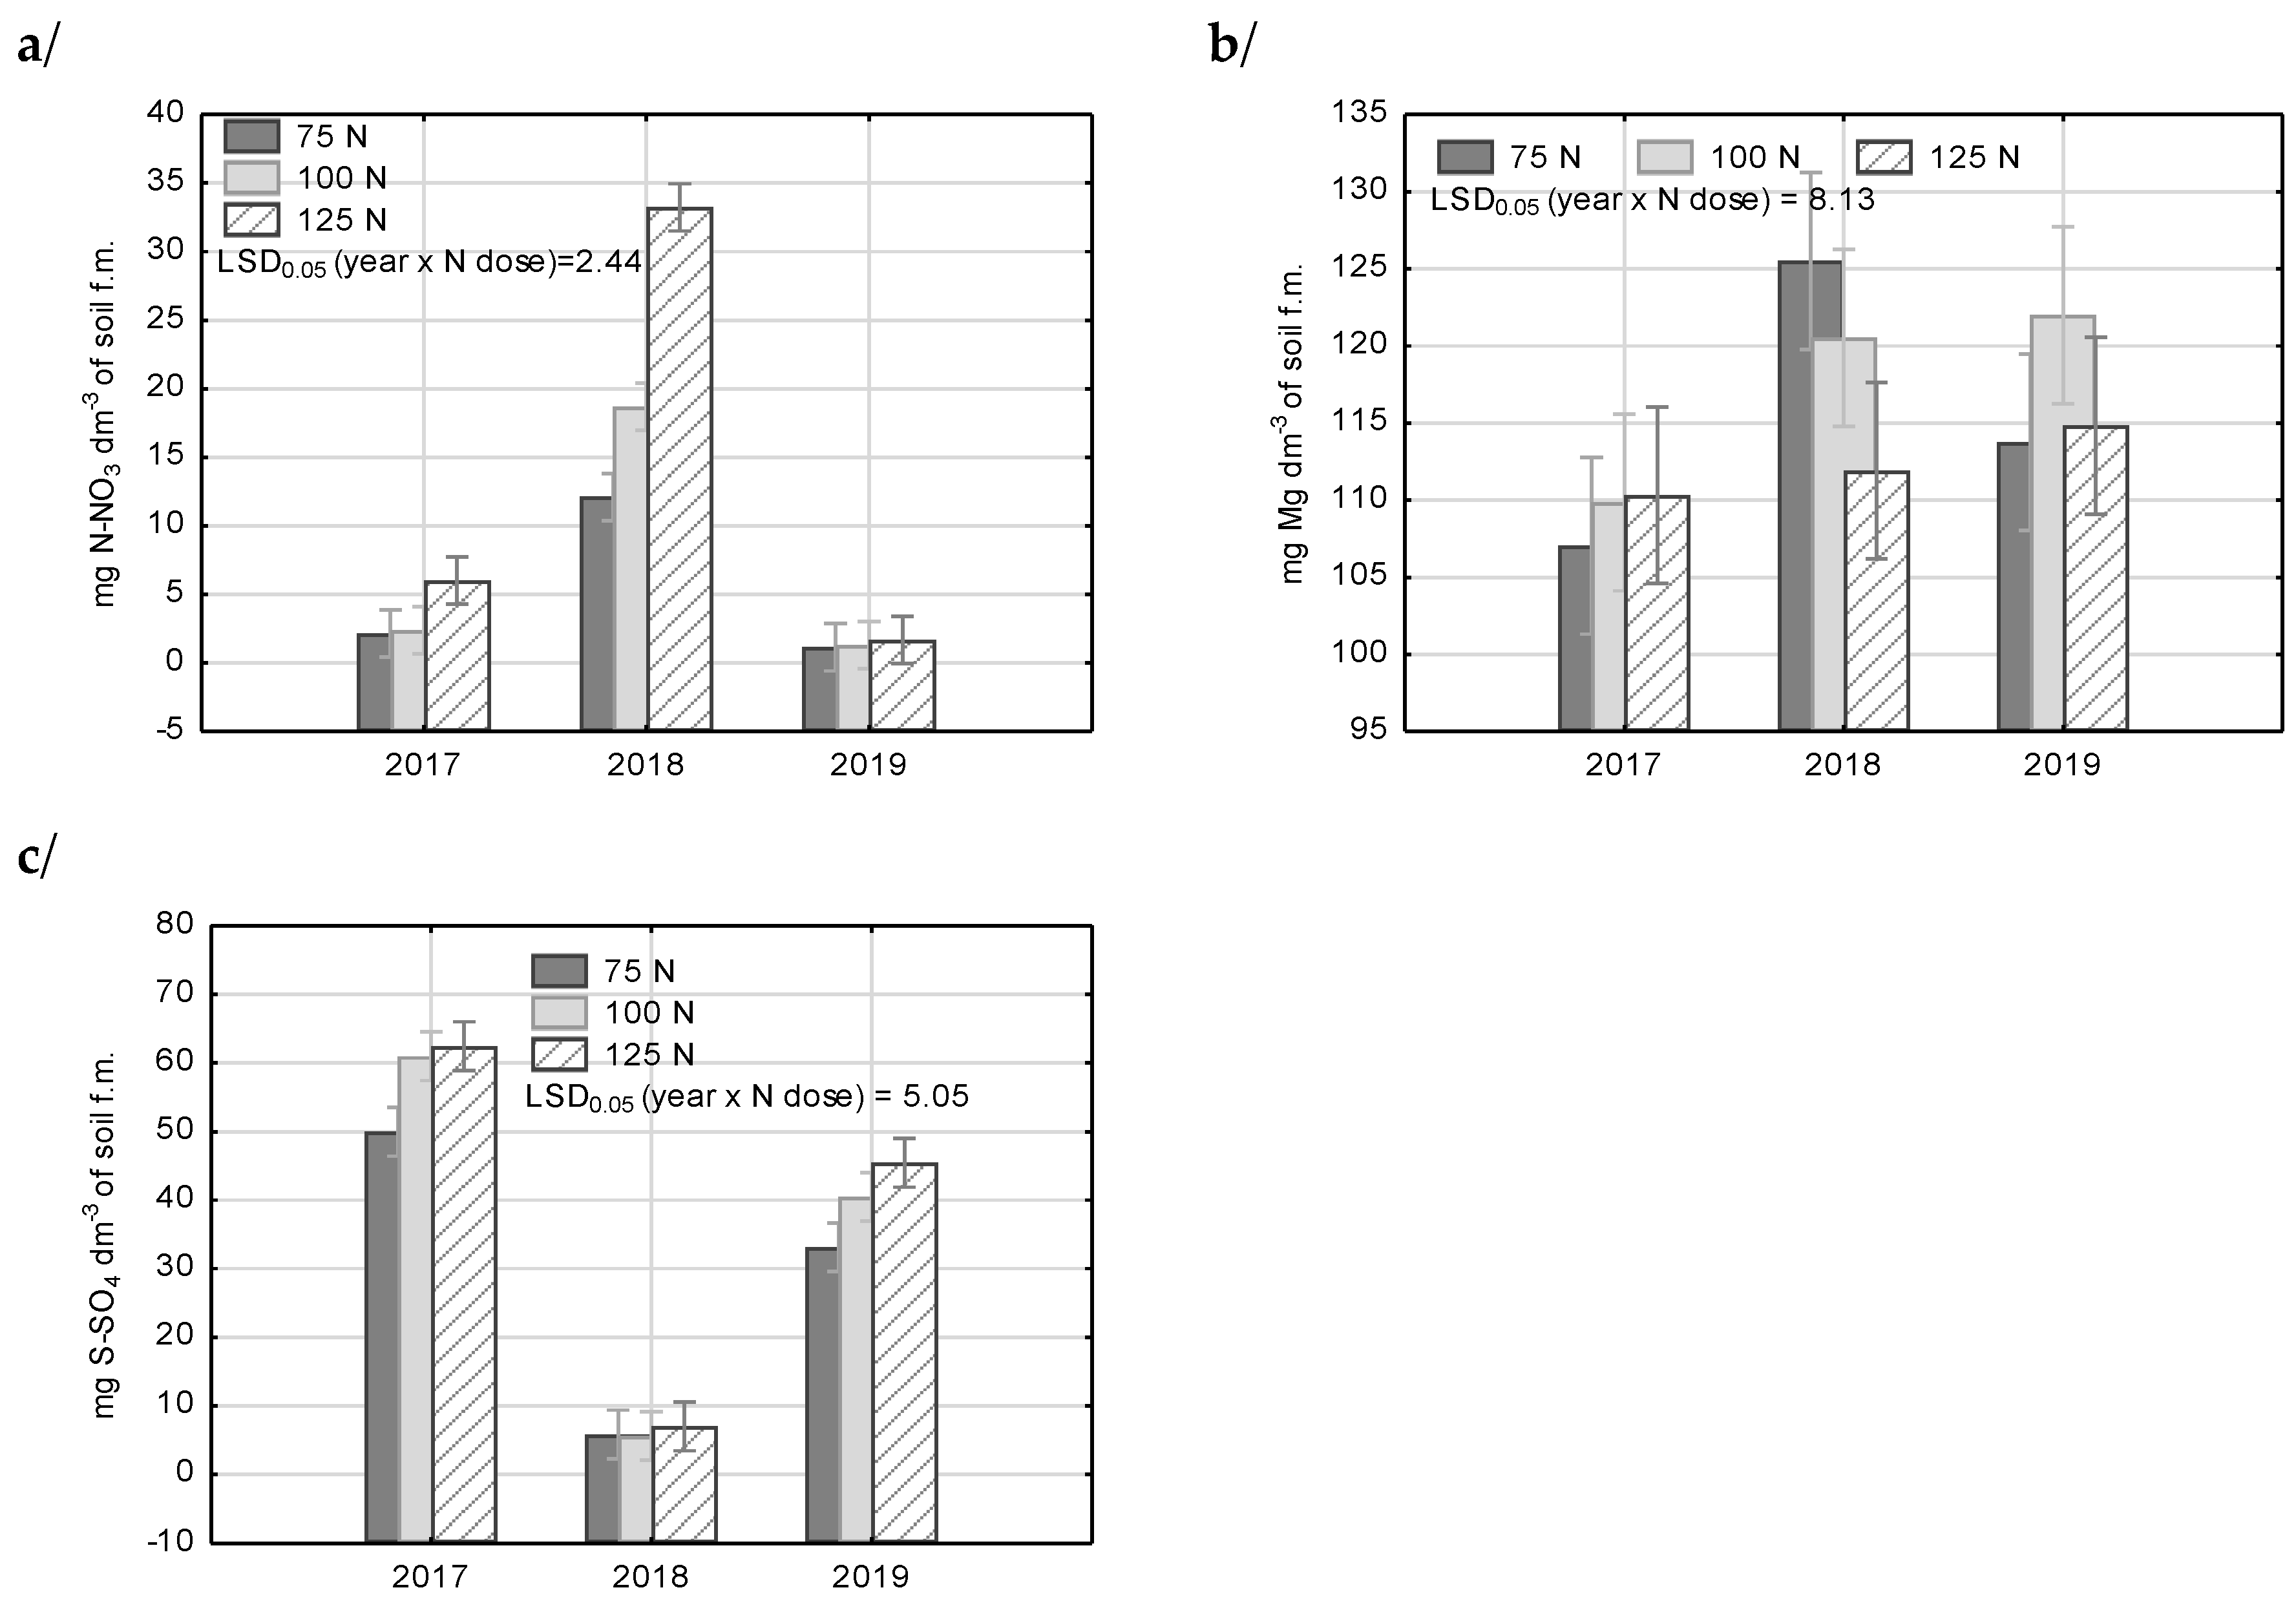
3.3. Mineral Nitrogen Content in Soil

Before the start of the field experiment, we hypothesized that wood-based biochar produced at a high pyrolysis temperature (650 °C) would absorb and reduce plant available nitrogen, resulting in a negative impact on peppermint biomass. The nitrogen fertilization scheme was designed to compensate for this negative effect. Adsorption of ammonium by biochar has been well documented by Spokas et al. [28]. Nguyen et al. [29] demonstrated in a meta-analysis that biochar addition reduced soil inorganic N by about 11% (NH4+) and 10% (NO3) per 56 works published between 2010 and 2015. However, 95% of cases were reported within one year after biochar application. The presented three-year findings showed that the average content of mineral nitrogen in the soil, both in ammonium and nitrate forms, was the highest for the sites where 15 and 45 t of biochar was used. With nitrates, it increased proportionally with an increase in their dose (Table 5). However, after a detailed analysis of the interaction between the factors of the experiment, a statistically significant effect of the doses of 15 and 45 t ha−1 of biochar on an increase in the concentration of ammonium nitrogen (NH4-N) in the soil was found only during the second and third years in relation to the control and the dose of 5 t ha−1 (Figure 2c). Biochar produced from wood-based feedstock at high temperatures tends to retain inorganic N through adsorption and immobilization. Significantly more reactions in the soil N cycle are controlled by microorganisms [16,49]. Biochar creates a habitat, provides labile substrates from fresh material, and alters the soil environment for microorganisms [22]. Immobilization of inorganic nitrogen by microorganisms could be a consequence of the decomposition of organic materials that have low N contents [4]. However, a shift from immobilization to mineralization can release inorganic N to partially meet the plant N demands in biochar-amended soil. The results of the study, obtained for the ammonium form of nitrogen during the second and third years, seemed to confirm this.
In soil where 5 and 15 tons of biochar were used, we observed a tendency for the content of N-ammonium to increase with an increase in the dose of ammonium nitrate (Figure 4b). However, a statistically significant increase in the concentration of NH4-N after fertilization with 100 and 125 kg N ha−1 was found only for the treatment with 15 tons of biochar ha−1. Steiner et al. [30] indicated that nitrogen fertilizers could be immobilized in the microbial biomass and adsorbed in organic form to biochar surfaces. Here, the results obtained for a higher dose of biochar (45 t ha−1) confirm these observations (Figure 4b).
In the case of nitrate nitrogen for the first and third years of the research, the concentration of NO3-N in the soil was low and did not significantly depend on the doses of biochar used (Figure 2d). In 2018, doses of 15 and 45 t ha−1 increased the concentration of this form of nitrogen in the soil, both in relation to the untreated plots and the dose of 5 t biochar ha−1. It is difficult to identify specific factors that influence the nitrate content in biochar-amended soil [6,16,32,49]. According to Clough et al. [4], the short- and long-term consequences of biochar on N immobilization or mineralization are specific to the soil/biochar arrangements and additional systematic studies are required to predict N cycling responses.
During the first and second years of the study, the highest concentration of nitrates was found in soil fertilized with the highest dose of ammonium nitrate (Figure 3a). During the last year (2019), only a trend toward an increase in the concentration of NO3-N in combination with the highest fertilization was observed. For this form of mineral nitrogen, a significant interaction between biochar dose and fertilizer nitrogen dose was also observed (Figure 4c). In all experimental trials where biochar was applied with the highest dose of fertilizing N (125 kg ha−1), a significantly higher concentration of nitrates in the soil was found as compared with the control. In combination with the highest dose of biochar (45 t), the dose of 100 kg N ha−1 also significantly increased the concentration of NO3-N in the soil in relation to the untreated soil. A similar pattern was obtained for the yield of mint biomass, in 2019, for the 45 t ha−1 of biochar +100/125 kg N ha−1 treatment. This indicated a reduction in microbial N immobilization and higher net mineralization and nitrification rates. Our results were consistent with those of Gundale and Deluca [50], who showed that the effect of charcoal on nitrification only occurred when a labile N source was also present.

3.4. Available Macronutrients in Soil
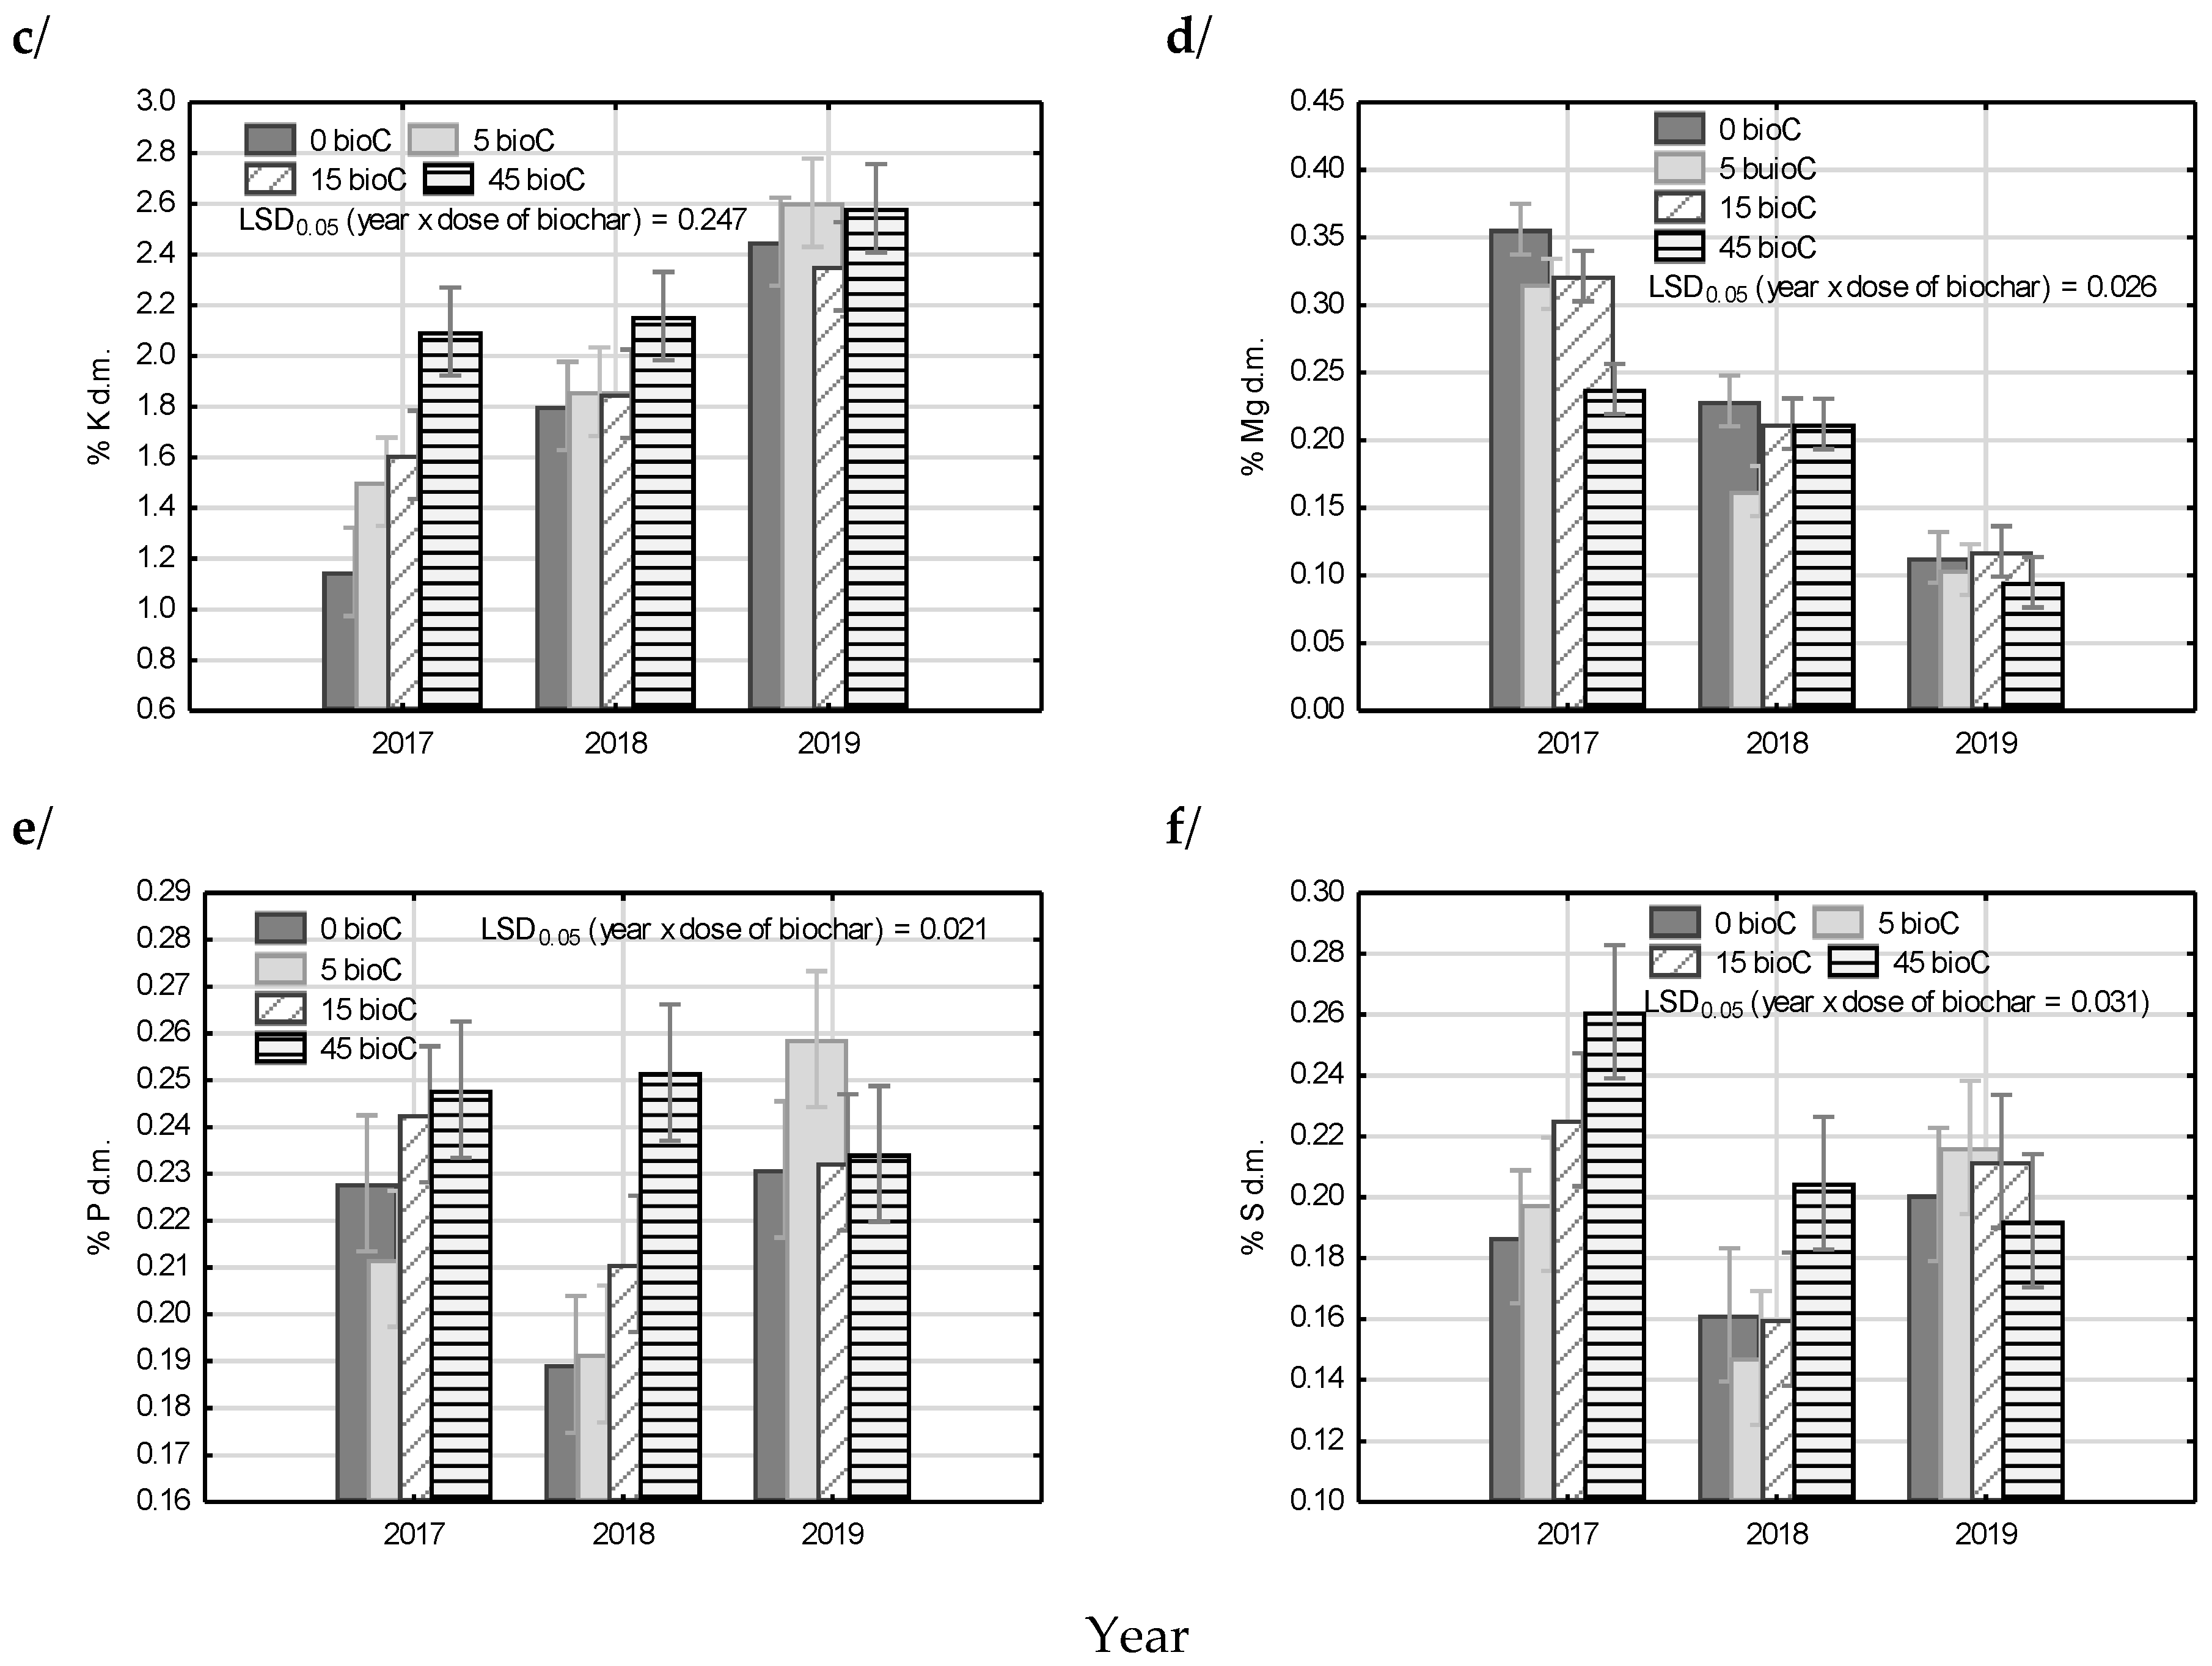
Lehmann et al. [16] and Ding et al. [9] reported that various mechanisms explained the increase in plant nutrient availability in nutrient-limited soils, such as the addition of soluble nutrients contained in the biochar ash or the mineralization of the labile fraction of biochar containing organically bound nutrients. However, Baigorri et al. [7] reported that the biochar effect on soil properties was only significant in acidic soils, probably associated with a liming effect. In our experiment, on average, during the three-year study period, significantly more soluble Ca, K, and SO4-S was found in the soil amended with biochar as compared with the control (Table 5).
Bista et al. [6] reported that biochar application at rates below 22.4 t ha−1 increased soil pH, P, K, and S contents, and the shoot and root biomass of wheat in a greenhouse study. Similarly, Marks et al. [49] found, in a field experiment, that biochar increased soil concentrations of K+ and SO42−, which was attributed to a direct additive effect.
Increases in the contents of Ca and SO4-S were observed after the application of a dose of 5 t of biochar, and of K in the soil enriched with 45 t of biochar ha−1. In the case of P, biochar doses of 5 and 15 t ha−1 significantly decreased its solubility in the soil as compared with the untreated soil enriched with a dose of 45 t ha−1. In 2017, the concentration of available Ca in the soil increased with applied biochar dose and was significantly higher than in the untreated soil (Figure 2e). However, during the second and third years, the highest concentration of Ca was found for the lowest dose, i.e., 5 t biochar ha−1. For inorganic ions, it is commonly assumed that the cation exchange capacity of a soil controls retention. Domingues et al. [19] reported that woody plant biochar showed generally low cation exchange capacity (CEC) with mean values of about 2.4 cmolc kg−1, irrespective of pyrolysis temperature. However, our experiment was conducted on sandy soil with the ability to retain cations depending almost completely on soil organic matter. In soil, the addition of biochar at a dose 45 t ha−1 could significantly increase the ability of this soil to retain cations. High-surface-area biochar produced at a high temperature usually has low CEC. The ageing effect may be created by oxidizing the organic biochar, increasing the negative charge density, and increasing the formation of biochar–mineral complexes [7,19,51,52]. For the determined content of soil-soluble calcium, a significant interaction between the dose of biochar and the dose of N fertilizer was also identified (Figure 4d). Regardless of the biochar dose, the highest Ca concentration was found in soils fertilized with the highest dose of ammonium nitrate (125 kg N ha−1). In the case of the 5 t biochar per ha treatment, the 100 kg N ha−1 dose significantly increased the content of soluble Ca in the soil in relation to the 75 kg N ha−1 dose. Some synergistic responses to nutrients may result from soil reactions, such as the acidifying effect of the fertilizer nutrient [53]. A possible explanation of the observed phenomenon is acidification due to applying ammonium nitrate in higher doses to the soil, which is initially slightly alkaline. Acidification affects the dissolution of calcium carbonates in soil amended with biochar. Application of N fertilizers to soils, such as ammonium nitrate, produces H+ through nitrification and NO3 leaching processes [54].
During the first two years of the study, the soluble potassium content in soil was significantly higher in biochar-enriched soils than in the control. The highest concentration of K was found in the soil in which 45 t of biochar per hectare was introduced. During the third year of the study, the increasing tendency of K content in soil was still visible, but at a much lower concentration in the soil in all treatments where biochar was used (Figure 2f). Ash residues in biochar, which is rich in available nutrients, and especially in cationic elements such as Ca2+, Mg2+, Na2+, and K+, contain carbonates and bicarbonates of cations [18]. In a leaching experiment, Riedel et al. [5] showed that K release from the biochar-amended soils was higher (about one-third) than from untreated soil. This was confirmed by Zheng et al. [23]. Marks et al. [49] also indicated that biochar increased K+ and SO42− in soil solution and attributed this to a direct additive effect. This is consistent with data from other sources.
In 2017, the concentration of soluble magnesium in the soil was significantly higher in soils enriched with biochar using doses of 5 and 45 t ha−1 as compared with the control and the dose of 15 t ha−1 (Figure 2g). The opposite tendency was found during the second year of the research, i.e., the lowest Mg content was found in the soil where 5 and 45 tons of biochar per hectare were introduced. In 2019, the lowest Mg concentration was found for the dose 45 t ha−1. The Mg soil enrichment due to the addition of biochar, as well as the adsorption/desorption Mg2+ processes, were probably responsible for the observed concentrations of cation in the soil solution. As mentioned above, the sandy soil had the lowest initial surface area, and biochar addition likely substantially increased relative surface area, which led to increased nutrient retention. During the first year of the study, nitrogen fertilization did not significantly affect the Mg concentration in the soil, but during the second year of the study, along with the increase in the dose of nitrogen fertilizer, the concentration of soluble magnesium in the soil decreased (Figure 3b). In 2019, the highest available magnesium in soil was found for the dose of 100 kg N ha−1.
In 2017, significantly less phosphorus was found in soils enriched with the dose of 15 t of biochar per hectare, both in relation to the control and the other doses of biochar (Table 5). During the second and third years, the least soluble P was found in all the treatments where biochar was used in relation to the untreated soils (Figure 2h). Much of the discussion of the incorporation of pyrolyzed organic residues in soil has focused on phosphate availability in biochar-amended soil. Mukherjee and Lal [17] indicated that phosphates could be preferentially adsorbed and retained on the biochar surface to limit plant availability, as biochar had a high CEC. Likewise, Gul and Whalen [22] reported that low available N and P concentrations were expected when coarse-textured soil was amended with biochar with a high surface area. Zheng et al. [23] demonstrated that P was transformed to less soluble minerals, resulting in a reduction in available P in high-temperature biochar. Mukherjee and Zimmerman [14] found that insoluble ortho-P was 17% and 61% of the total P in wood-based biochars pyrolyzed at 250 and 650 °C, respectively. In general, this is confirmed by the present study with the use of high-temperature biochar. Lima et al. [11] and Zhao et al. [55] found that the phosphorus adsorption isotherms reached values up to 9000 mg kg−1 of maximum P adsorbed on the surface of pine wood biochar. Baigorri et al. [7] found that Al and Fe were absorbed by biochar, whereas P was only adsorbed on the P–Fe/Al–biochar complex. This could partially explain the negative effects in alkaline soils.
The use of biochar, in 2017, resulted in an increased concentration of sulfates in the soil, regardless of the dose used. During the second year, the concentration of SO4-S was low and did not depend on the doses of biochar (Figure 2i). During the third year, the highest amount of SO4-S was found in the soil treated with the 5 t ha−1 biochar dose. The soil enriched with doses of 15 and 45 tons of biochar per hectare also had higher contents of this component in relation to the untreated soil. In 2017 and 2019, nitrogen fertilization with the doses of 100 and 125 kg N ha−1 significantly increased the concentration of SO4-S in the soil in relation to the dose of 75 kg N ha−1 (Figure 3c). In a greenhouse experiment with wheat, Bista et al. [6] reported that sulphur was 93% to 380% higher in biochar treatments than a control soil without fertilizer and 66 to 297% more than a control with fertilizer application.

3.5. Plant Analysis

The sufficiency ranges in peppermint biomass established for the harvesting date by Arrobas et al. [56] for N, P, K, Ca, and Mg were 3.2–4.2, 0.12–0.45, 1.0–3.0, 0.70–2.3, and 0.40–1 (%DM, dry matter), respectively. According to these critical levels of macronutrients, mint was characterized by low concentrations of N and Mg in this study. During the first year after the use of biochar, the highest concentrations of total nitrogen and magnesium, as well as the lowest concentrations of potassium in mint, were found in relation to 2018 and 2019. During the second year, the lowest contents of N, Ca, P, and S were found in the mint biomass. One explanation of this finding could be the decrease in N and other macronutrient concentrations, which was most likely associated with a dilution effect in the higher biomass of peppermint obtained in 2018 (Table 2). Numerous authors have investigated whether an increase in yield, mainly via N fertilization, led to a dilution of nutrients in biomass [53]. During the last year of the experiment, significantly more Ca and K and the least Mg were found in the mint as compared with the other study years. The biochar doses used had a significant effect on the content of all macronutrients in mint biomass (Table 6). In relation to the control, the highest amounts of N and P were found after applying 15 and 45 t biochar ha−1. One of the mechanisms that was proposed for the increase in plant nutrient availability in nutrient-limited soils amended with biochar was a retention of N, P, and S, associated with an increase in biological activities or community modifications [9]. Jones et al. [3] reported significantly higher above-ground maize foliar uptake of N in response to the addition of biochar (0–50 t ha−1). Similarly, Lehmann et al. [1] reported that amendment with biochar significantly reduced the leaching of fertilizer N and increased plant growth and nutrition status. The highest addition of biochar (45 t/ha) to the soil significantly increased the contents of K and S in the mint in relation to the control and other doses of biochar. In the case of Ca and Mg, the highest dose of biochar significantly decreased the content of these components in the plant material as compared with cultivation on untreated soil (Table 6).
Nitrogen fertilization only significantly influenced the contents of N and P in biomass (Table 6). N content increased in proportion to the nitrogen dose in fertilization, while the phosphorus content did not differ significantly for the 100 and 125 kg N ha−1 doses but was significantly higher than after applying 75 kg N ha−1.
We had expected the highest nutritional quality of peppermint during the first year of the experiment, when most nutrients could be readily desorbed from biochar. A significant interaction of the year and the dose of biochar on the content of all determined macro elements in the mint plant material was found (Figure 5a–f). During the first year, the least nitrogen was found in mint biomass after the use of 45 t of biochar per hectare, whereas the dose of 15 t significantly increased the content of this component in the plant. As mentioned earlier, biochar addition reduced soil inorganic N, especially one year after its application [4,29].
Rajkovich et al. [18] found that tissue N concentration and total N uptake by corn in a greenhouse experiment decreased, on average, with increasing pyrolysis temperature and biochar application rate. During the second and third year of this study, mint contained the highest amount of N from the cultivation site where 45 tons of biochar ha−1 were used. The obtained results are consistent with the those of Jones et al. [3], who reported that wood biochar (0.25 and 50 t ha−1) used in sandy loam clay soil affected foliar N only during the second and third years after addition. In soils without biochar, nitrogen fertilization in higher doses (100 kg N ha−1and 125 kg N ha−1) significantly increased the N content in the plant material as compared with the dose of 75 kg N. In combination with the lowest dose of biochar (5 t ha−1), only the dose of 125 kg N ha−1 significantly increased the N concentration in biomass in relation to the others. For the doses of 15 and 45 tons of biochar per hectare, nitrogen was most effectively used in fertilization performed at doses of 100 and 125 kg N ha−1. These results correlate with the highest content of nitrate nitrogen in soil in these combinations (Figure 4a). The most proportional increase in the N concentration in the mint along with increasing dose of fertilizing nitrogen was observed when using biochar at the highest dose (Figure 6a).
On the basis of the growing body of literature, we concluded that adsorption of NH4+ onto biochar and the NO3 absorption potential of biochar produced at a high temperature could be the reasons for the better use of N fertilizer and the better nitrogen nutrition of the mint grown in sandy soil supplemented with the highest doses of biochar. In sandy soils with low organic matter, biochar input can produce significant differences in terms of CEC [4,9]. This applies to ammonium and also to other basic cations.
During the first year, the trend toward an increase in the content of K and S in biomass with an increase in the dose of biochar was observed (Figure 5c,f, respectively). For these elements, during the second year after the use of biochar, only the highest dose of 45 t/ha significantly increased the concentrations of K and S in plant material. In 2019, no significant effect of biochar dose on the contents of K and S in mint was observed. Martinsen et al. [57] reported that biochar significantly increased the concentrations of K and P in maize straw. Similarly, Oram et al. [58] found that red clover biomass was significantly higher with increased potassium content when grown on biochar-amended soil.
A clear trend toward a decrease in the Mg content in biomass with increases in the dose of biochar was demonstrated during the first year of the study. Biochar used at the highest dose (45 t/ha) also significantly decreased the content of calcium in the mint throughout the cultivation period (Figure 5d). The fundamental concept of plant nutrition is the nutrient–element balance [59]. We noticed K content in mint biomass increased with biochar doses and with increased K concentration in soil. At the same time the Ca and Mg concentration in biomass decreased. Interactions among nutrients on nutrient uptake and accumulation contain zero-interaction, synergism, or antagonism. For example, the antagonistic effect of potassium-magnesium interaction often has been studied [53]. High concentrations of NH4+, K+, and Na+ in the soil solution interfere with Mg uptake by plants. In the present study, the amount of K in the sandy soil solution was much lower than Mg concentration (Table 1); therefore, mint probably developed specific K transport systems in the root cells to guarantee sufficient K uptake when its concentration in the soil solution was low. Conversely, the Mg transporters are non-specific and can be used by other cations such as potassium [59,60]. As an ion competing for cation exchange reactions, excess calcium may also inhibit Mg uptake [53].
Biochar is a soil amendment that has the potential to increase plant-available P by directly supplying P in the biochar [7,61]. However, limited effects on soil P availability can occur when the Ca in the added biochar forms insoluble Ca phosphates. In this study, the reaction of mint to the applied biochar, in terms of phosphorus content, was variable over the years of the research. In the first year, the highest doses of 15 and 45 t of biochar per hectare significantly increased the content of P in the plant as compared with the control and 5 t ha−1, but, during the third year, only the lowest dose of biochar increased the P concentration in biomass (Figure 5e). Lima et al. [11] found that the growth of maize and the nutrient retention properties of soil were significantly improved with increasing biochar doses in a greenhouse pot experiment with sandy soil. Even a low coffee grounds biochar dose of 4 t ha−1 produced higher P use efficiency than NPK treatment.
In terms of Ca, Mg, and P contents in the plant, the fertilization variant of 15 t biochar ha−1 + 100 or 125 kg N ha−1 was better than 75 kg N ha−1 (Figure 6b–d). The highest concentration of P in mint grown in soil enriched with 5 tons of biochar per hectare was identified after applying 125 kg N ha−1. A possible explanation for this relationship could be an interaction between plant nutrients, which could produce antagonistic or synergistic results that impact nutrient use efficiency. Synergistic interactions are well known for nitrogen-potassium and nitrogen-phophorus [53]. As macronutrients create the basis for fertilizer applications, these synergistic interactions should be considered when optimizing a fertilization strategy.

4. Conclusions

Plant and soil reactions of biochar application vary with agricultural systems, crop type, and climatic conditions, as well as fertilization regime. Wood-based biochar produced at 650 °C was examined as a sandy soil amendment in a three-year Mentha piperita L. var. Schok crop field trial, applied at 0, 5, 15, and 45 t ha−1 while applying N at 75, 100, and 125 kg ha−1.
The findings showed that biochar had variable effects on sandy soil fertility, yield, and elemental composition of mint biomass over time. Biochar application altered the soil nutrients dynamics in the field experiment with N fertilizer practices. Increasing biochar application rates significantly increased the availability of Ca, K, and SO4−2 in the soil. The nutrient release from biochar was effective, especially during the first year after application. The increase in the concentration of NH4-N in soil with increasing doses of biochar was observed during the second and third years of the study, as was observed for NO3-N during the second year after biochar application. Since biochar produced from wood-based feedstock at high temperatures tends to retain inorganic N, we recommend the addition of adequate nitrogen fertilizer when amending the soil with high biochar rates, mainly during the first year after application. Generally, biochar treatments did not significantly affect peppermint biomass. The N content in the mint increased proportionally with the nitrogen dose in fertilization, regardless of the biochar dose applied. However, during the third year of the experiment, when biochar treatment at 45 t ha−1 was supplemented with 100 and 125 kg N ha−1 fertilization, we observed a beneficial effect on crop development. Potassium and calcium, as competing ions in cation exchange reactions, inhibited Mg uptake by plants. The highest amounts of N and P were contained in peppermint biomass after using 15 and 45 t biochar ha−1. The highest dose of biochar also increased the contents of K and S in plants. As an agro-environmentally beneficial management tool, the most promising aspects of biochar use in this three-year study were an increase in available forms of Ca, K, and S derived from soil; a better N use at higher N doses; and an improved mineral nutrient status of mint with regard to N, P, K and S content. Future research needs to systematically understand biochar–N interactions in the long term and should also clarify the effects of aged versus fresh biochar. Collectively, our findings suggest that the responses of soil to biochar amendment are strongly influenced by plant, microbial, and soil feedback, and therefore determining the practical effectiveness of biochar in the long term requires additional study.

Author Contributions

Conceptualization, U.S.; methodology, U.S.; validation, U.S.; data curation, I.D.-Ś., U.S. and A.Ż.; formal analysis, I.D.-Ś. and U.S.; writing—original draft preparation, I.D.-Ś. and U.S.; writing—review and editing, I.D.-Ś. All authors have read and agreed to the published version of the manuscript.

Funding

This research received no external funding.

Conflicts of Interest

The authors declare no conflict of interest.

References

  1. Lehmann, J.; da Silva, J.P.; Steiner, C.; Nehls, T.; Zech, W.; Glaser, B. Nutrient availability and leaching in an archaeological anthrosol and a ferralsol of the central amazon basin: Fertilizer. manure and charcoal amendments. Plant Soil 2003, 249, 343–357. [Google Scholar] [CrossRef]
  2. Sohi, S.P.; Krull, E.; Lopez-Capel, E.; Bol, R. A review of biochar and its use and function in soil. In Advances in Agronomy; Sparks, D.L., Ed.; Elsevier Academic Press Inc.: San Diego, CA, USA, 2010; Volume 105, pp. 47–82. [Google Scholar]
  3. Jones, D.L.; Rousk, J.; Edwards-Jones, G.; DeLuca, T.H.; Murphy, D.V. Biochar-mediated changes in soil quality and plant growth in a three year field trial. Soil Biol. Biochem. 2012, 45, 113–124. [Google Scholar] [CrossRef]
  4. Clough, T.J.; Condron, L.M.; Kammann, C.; Müller, C. Review of Biochar and Soil Nitrogen Dynamics. Agronomy 2013, 3, 275–293. [Google Scholar] [CrossRef] [Green Version]
  5. Riedel, T.; Hennessy, P.; Iden, S.C.; Koschinsky, A. Leaching of soil-derived major and trace elements in an arable topsoil after the addition of biochar. Eur. J. Soil Sci. 2015, 66, 823–834. [Google Scholar] [CrossRef]
  6. Bista, P.; Ghimire, R.; Machado, S.; Pritchett, L. Biochar effects on soil properties and wheat biomass vary with fertility management. Agronomy 2019, 9, 623. [Google Scholar] [CrossRef] [Green Version]
  7. Baigorri, R.; San Francisco, S.; Urrutia, O.; Garcia-Mina, J.M. Biochar-Ca and Biochar-Al/-Fe-Medited Phosphate Exchange Capacity are Main Drivers of the Different Biochar Effects on Plant in Acidic and Alkaline Soils. Agronomy 2020, 10, 968. [Google Scholar] [CrossRef]
  8. Jeffery, S.; Verheijen, F.G.A.; van der Velde, M.; Bastos, A.C. A quantitative review of the effects of biochar application to soils on crop productivity using meta-analysis. Agr. Ecosyst. Environ. 2011, 144, 175–187. [Google Scholar] [CrossRef]
  9. Ding, Y.; Liu, Y.; Liu, S.; Li, Z.; Tan, X.; Zeng, G.; Zhou, L.; Zheng, B. Biochar to improve soil fertility. A review. Agron. Sustain. Dev. 2016, 36, 36. [Google Scholar] [CrossRef] [Green Version]
  10. Zornoza, R.; Moreno-Barriga, F.; Acosta, J.A.; Muñoz, M.A.; Faz, A. Stability, nutrient availability and hydrophobicity of biochars derived from manure. crop residues. and municipal solid waste for their use as soil amendments. Chemosphere 2016, 144, 122–130. [Google Scholar] [CrossRef]
  11. Lima, J.R.S.; Silva, W.M.; Medeiros, E.V.; Duda, G.P.; Corrêa, M.M.; Filho, A.P.M.; Clermont-Dauphin, C.; Antonino, A.C.D.; Hammecker, C. Effect of biochar on physicochemical properties of a sandy soil and maize growth in a greenhouse experiment. Geoderma 2018, 319, 14–23. [Google Scholar] [CrossRef]
  12. Edeh, G.; Ondřej, M.; Bussb, W. A meta-analysis on biochar's effects on soil water properties—New insights and future research challenges. Sci. Total Environ. 2020, 714, 136857. [Google Scholar] [CrossRef] [PubMed]
  13. Yuan, H.; Lu, T.; Wang, Y.; Chen, Y.; Lei, T. Sewage sludge biochar: Nutrient composition and its effect on the leaching of soil nutrients. Geoderma 2016, 267, 17–23. [Google Scholar] [CrossRef]
  14. Mukherjee, A.; Zimmerman, A.R. Organic carbon and nutrient release from a range of laboratory-produced biochars and biochar-soil mixtures. Geoderma 2013, 193–194, 122–130. [Google Scholar] [CrossRef]
  15. Brassard, P.; Godbout, S.; Palacios, J.H.; Jeanne, T.; Hogue, R.; Dubé, P.; Limousy, L.; Raghavan, V. Effect of six engineered biochars on GHG emissions from two agricultural soils: A short-term incubation study. Geoderma 2018, 327, 73–84. [Google Scholar] [CrossRef]
  16. Lehmann, J.; Rillig, M.C.; Thies, J.; Masiello, C.A.; Hockaday, W.C.; Crowley, D. Biochar effects on soil biota—A review. Soil Biol. Biochem. 2011, 43, 1812–1836. [Google Scholar] [CrossRef]
  17. Mukherjee, A.; Lal, R. The biochar dilemma. Soil Res. 2014, 52, 217–230. [Google Scholar] [CrossRef]
  18. Rajkovich, S.; Enders, A.; Hanley, K.; Hyland, C.; Zimmerman, A.R.; Lehmann, J. Corn growth and nitrogen nutrition after additions of biochars with varying properties to a temperate soil. Bio Fert. Soils 2012, 48, 271–284. [Google Scholar] [CrossRef]
  19. Domingues, R.R.; Trugilho, P.F.; Silva, C.A. Properties of biochar derived from wood and high nutrient biomasses with the aim of agronomic and environmental benefits. PLoS ONE 2017, 12, 1–19. [Google Scholar] [CrossRef] [Green Version]
  20. Tsai, W.T.; Huang, P.C.; Lin, Y.Q. Characterization of Biochars Produced from Dairy Manure at High Pyrolysis Temperatures. Agronomy 2019, 9, 634. [Google Scholar] [CrossRef] [Green Version]
  21. Bruun, E.W.; Hauggaardd-Nielsen, H.; Ibradhim, N.; Egsgaard, H.; Ambus, P.; Jensen, A.P.; Dam-Johanse, K. Influence of fast pyrolysis temperature on biochar labile fraction and short-term carbon loss in a loamy soil. Biomass Bioenerg. 2011, 35, 1182–1189. [Google Scholar] [CrossRef]
  22. Gul, S.; Whalen, J.K. Biochemical cycling of nitrogen and phosphorus in biochar-amended soils. Soil Biol. Biochem. 2016, 103, 1–15. [Google Scholar] [CrossRef]
  23. Zheng, H.; Wang, Z.; Deng, X.; Zhao, J.; Luo, Y.; Novak, J.; Herbert, S.; Xing, B. Characteristics and nutrient values of biochars produced from giant reed at different temperatures. Bioresour. Technol. 2013, 130, 463–471. [Google Scholar] [CrossRef] [PubMed]
  24. Quosai, P.; Anstey, A.; Mohanty, A.K.; Misra, M. Characterization of biocarbon generated by high- and low-temperature pyrolysis of soy hulls and cofee chaf: For polymer composite applications. R. Soc. Open Sci. 2018, 5, 1–16. [Google Scholar] [CrossRef] [PubMed] [Green Version]
  25. Bruun, E.; Cross, A.; Hammond, J.; Nelissen, V.; Rasse, D.P.; Hauggaard-Nielsen, H. Biochar carbon stability and effect on greenhouse gas emissions. In Biochar in European Soils and Agriculture: Science and Practice; Shackley, S., Ruysschaert, G., Zwart, K., Glaser, B., Eds.; Earthscan: London, UK, 2016; pp. 165–183. [Google Scholar]
  26. Libutti, A.; Mucci, M.; Francavilla, M.; Monteleone, M. Effect of biochar amendment on nitrate retention in a silty clay loam soil. Ital. J. Agro. 2016, 11, 273–276. [Google Scholar] [CrossRef] [Green Version]
  27. Libutti, A.; Cammerino, R.A.; Francavilla, M.; Monteleone, M. Soil Amendment with Biochar Affects Water Drainage and Nutrient Losses by Leaching: Experimental Evidence under Field-Grown Conditions. Agronomy 2019, 9, 758. [Google Scholar] [CrossRef] [Green Version]
  28. Spokas, K.A.; Novak, J.M.; Venterea, R.T. Biochar’s role as an alternative N-fertilizer: Ammonia capture. Plant Soil 2012, 350, 35–42. [Google Scholar] [CrossRef]
  29. Nguyen, T.T.N.; Xu, C.Y.; Tahmasbian, I.; Che, R.; Xu, Z.; Zhou, X.; Wallace, H.M.; Bai, S.H. Effects of biochar on soil available inorganic nitrogen: A review and metaanalysis. Geoderma 2017, 288, 79–96. [Google Scholar] [CrossRef] [Green Version]
  30. Steiner, C.; Glaser, B.; Teixeira, W.G.; Lehmann, J.; Blum, W.E.H.; Zech, W. Nitrogen retention and plant uptake on a highly weathered central Amazonian Ferralsol amended with compost and charcoal. J. Plant Nutr. Soil Sci. 2008, 171, 893–899. [Google Scholar] [CrossRef]
  31. Chan, K.Y.; Xu, Z. Biochar: Nutrient properties and their enhancement. In Biochar for Environmental Management: Science and Technology; Lehmann, J., Joseph, S., Eds.; Earthscan: London, UK, 2009; Volume 1, pp. 67–84. [Google Scholar]
  32. Yao, Y.; Gao, B.; Zhang, M.; Inyang, M.; Zimmerman, A.R. Effect of biochar amendment on sorption and leaching of nitrate, ammonium, and phosphate in a sandy soil. Chemosphere 2012, 89, 1467–1471. [Google Scholar] [CrossRef]
  33. Mukherjee, A.; Zimmerman, A.R.; Harris, W.G. Surface chemistry variations among a series of laboratory-produced biochars. Geoderma 2011, 163, 247–255. [Google Scholar] [CrossRef]
  34. Kabała, C.; Charzyński, P.; Chodorowski, J.; Drewnik, M.; Glina, B.; Greinert, A.; Hulisz, P.; Jankowski, M.; Jonczak, J.; Łabaz, B.; et al. Polish Soil Classification, 6th edition—Principles, classification, scheme and correlations. Soil Sci. Annual. 2019, 70, 71–97. [Google Scholar] [CrossRef] [Green Version]
  35. Krasowicz, S.; Oleszek, W.; Horabik, J.; Dębicki, R.; Jankowiak, J.; Stuczyński, T.; Jadczyszyn, J. Rational management of the soil environment in Poland. Pol. J. Agronomy. 2011, 7, 43–58. [Google Scholar]
  36. Petrovska, B.B. Historical review of medicinal plants’ usage. Pharmacognosy Rev. 2012, 6, 1–5. [Google Scholar] [CrossRef] [PubMed] [Green Version]
  37. McKay, D.L.; Blumberg, J.B. A review of the bioactivity and potential health benefits of peppermint tea (Mentha piperita L.). Phytother. Res. Int. J. Devot. Pharmacol. Toxicol. Eval. Nat. Prod. Deriv. 2006, 20, 619–633. [Google Scholar] [CrossRef] [PubMed]
  38. Muciarelli, M.; Camusso, W.; Bertea, C.M.; Maffei, M.E. Effect of (+)-pulegone and other oil components of Mentha x Piperita on cucumber respiration. Phytochemistry 2001, 57, 91–98. [Google Scholar] [CrossRef]
  39. Sady, W. Field Vegetable Fertilization; Plantpress: Kraków, Poland, 2000. (In Polish) [Google Scholar]
  40. Ostrowska, A.; Gawliński, S.; Szczubiałka, Z. (Eds.) Soil and Plant Analysis Procedures; Institute Environment Protection: Warszawa, Poland, 1991. (In Polish) [Google Scholar]
  41. Poshtdar, A.; Mashhadie, A.R.A.; Moradi, F.; Siadat, S.A.; Bakhshandeh, A. Effect of source and rate of nitrogen fertilizer on yield and water and nitrogen use efficiency of peppermint (Mentha piperita L.). Iran. J. Crop Sci. 2016, 18, 13–31. [Google Scholar]
  42. Butar, R.R.B.; Sitepu, F.E.; Hasanah, Y. Growth Response of Peppermint (Mentha piperita L.) Stem Cuttings on Several Composition of Planting Media. Indones. J. Agric. Res. 2018, 1, 187–192. [Google Scholar] [CrossRef] [Green Version]
  43. Olszewski, M.W.; Eisenman, S.W. Influence of biochar amendment on herb growth in a green roof substrate. Hortic. Environ. Biotechnol. 2017, 58, 406–413. [Google Scholar] [CrossRef]
  44. Hasanah, Y.; Sitepu, F.E.; Butar, R.B. Morphological characters and N uptake of Mint (Mentha piperita) with the growing media composition treatment. In IOP Conference Series: Earth and Environmental Science; IOP Publishing: Bristol, UK, 2019; p. 012147. [Google Scholar]
  45. Zheljazkov, V.D.; Cantrell, C.L.; Astatkie, T.; Ebelhar, M.W. Peppermint productivity and oil composition as a function of nitrogen. growth stage. and harvest time. Agronom. J. 2010, 102, 124–128. [Google Scholar] [CrossRef] [Green Version]
  46. Ram, D.; Ram, M.; Singh, R. Optimization of water and nitrogen application to menthol mint (Mentha arvensis L.) through sugarcane trash mulch in a sandy loam soil of semi-arid subtropical climate. Bioresour. Technol. 2006, 97, 886–893. [Google Scholar] [CrossRef]
  47. Mansoori, I. The effect of plant density and harvesting time on growth and essential oil of peppermint (Mentha piperita L.). J. Med. Bioeng. 2014, 3. [Google Scholar] [CrossRef]
  48. Verma, R.K.; Verma, R.S.; Rahman, L.U.; Kalra, A.; Patra, D.D. Integrated Nutrient Management on Biomass. Oil Yields and Essential Oil Composition of Peppermint (Mentha piperita L.) and Residual Fertility in a Hilly Soil. J. Essential Oil Bearing Plants 2016, 19, 582–591. [Google Scholar] [CrossRef]
  49. Marks, A.N.; Mattan, S.; Alcañiz, J.M.; Pérez-Herrero, E.; Domene, X. Gasifier biochar effects on nutrient availability. organic matter mineralization. and soil fauna activity in a multi-year Mediterranean trial. Agric. Ecosyst. Environ. 2016, 215, 30–39. [Google Scholar] [CrossRef]
  50. Gundale, M.J.; Deluca, T.H. Charcoal Effects on Soil Solution Chemistry and Growth of Koeleria macrantha in the Ponderosa Pine/Douglas-fir Ecosystem. Biol. Fert. Soils 2007, 43, 303–311. [Google Scholar] [CrossRef]
  51. Lehmann, J.; Joseph, S. Biochar for environmental management: An introduction. In Biochar for Environmental Management. Science and Technology; Lehmann, J., Joseph, S., Eds.; Earthscan: London, UK, 2009; pp. 1–12. [Google Scholar]
  52. Lin, Y.; Munroe, P.; Joseph, S.; Henderson, R.; Ziolkowski, A. Water extractable organic carbon in untreated and chemical treated biochars. Chemosphere 2012, 87, 151–157. [Google Scholar] [CrossRef]
  53. Rietra, R.P.J.J.; Heinen, M.; Dimkpa, C.O.; Bindraban, P.S. Effects of Nutrient Antagonism and Synergism on Yield and Fertilizer Use Efficiency. Commun. Soil Sci. Plant Anal. 2017, 48, 1895–1920. [Google Scholar] [CrossRef] [Green Version]
  54. Kunhikrishnan, A.; Thangarajan, R.; Bolan, N.S.; Xu, Y.; Mandal, S.; Gleeson, D.B.; Seshadri, B.; Zaman, M.; Barton, L.; Tang, C.; et al. Functional Relationships of Soil Acidification. Liming. and Greenhouse Gas Flux. Adv. Agron. 2016, 139, 1–71. [Google Scholar] [CrossRef]
  55. Zhao, S.; Wang, B.; Gao, Q.; Gao, Y.; Liu, S. Adsorption of phosphorus by different biochars. Spectrosc. Lett. 2017, 50, 73–80. [Google Scholar] [CrossRef]
  56. Arrobas, M.; Ferreira, Q.; Afonso, S.; Rodrigues, A. Sufficiency ranges and crop nutrient removals for peppermint (Mentha x piperita L.) established from field and pot fertilizer experiments. Commun. Soil Sci. Plant Anal. 2018, 49, 1719–1730. [Google Scholar] [CrossRef] [Green Version]
  57. Martinsen, V.; Shitumbanuma, V.; Alling, V.; Breedveld, G.; Rutherford, D.; Sparrevik, M.; Hale, S.; Obia, A.; Mulder JCornelissen, G. Biochar effect on maize yield and soil characteristics in five conservation farming sites in Zambia. Agronomy 2013, 3, 256–274. [Google Scholar] [CrossRef] [Green Version]
  58. Oram, N.J.; van de Voorde, T.F.J.; Ouwehand, G.J.; Bezemer, T.M.; Mommer, L.; Jeffery, S.; Van Groenigen, J.W. Soil amendment with biochar increases the competitive ability of legumes via increased potassium availability. Agric. Ecosyst. Environ. 2014, 191, 92–98. [Google Scholar] [CrossRef] [Green Version]
  59. Marschner, P. Marschner’s Mineral Nutrition of Higher Plants, 3rd ed.; Academic Press: Cambridge, MA, USA, 2012. [Google Scholar] [CrossRef]
  60. Senbayram, M.; Gransee, A.; Wahle, V.; Thiel, H. Role of magnesium fertilisers in agriculture: Plant–soil continuum. Crop Pasture Sci. 2015, 66, 1219–1229. [Google Scholar] [CrossRef]
  61. Noyce, G.L.; Jones, T.; Fulthorpe, R.; Basiliko, N. Phosphorus uptake and availability and short-term seedling growth in three Ontario soils amended with ash and biochar. Can. J. Soil Sci. 2017, 97, 678–691. [Google Scholar] [CrossRef] [Green Version]
Figure 1. The variation of meteorological conditions during the field experiment in 2017–2019.
Agronomy 10 01950 g001
Figure 2. Soil reaction (pH), salt concentration (EC), and macronutrient content (mg dm−3) in the soil depending on the applied biochar dose in 2017–2019 (average of nitrogen doses).
Agronomy 10 01950 g002aAgronomy 10 01950 g002b
Figure 3. Ammonium, nitrate, and magnesium nitrogen content (mg dm−3) in the soil depending on the applied nitrogen fertilizer dose, in 2017–2019 (average of biochar doses).
Agronomy 10 01950 g003
Figure 4. Soil reaction (pH), salt concentration (EC), and the content of mineral nitrogen and calcium (mg dm−3) in the soil depending on the applied dose of biochar and fertilizer nitrogen (average from 2017–2019).
Agronomy 10 01950 g004
Figure 5. Contents of nitrogen, calcium, potassium, magnesium, phosphorus, and sulfur (%DM) in mint biomass depending on the applied biochar dose in 2017–2019 (average of fertilizer nitrogen doses); the factors were separated using the Fisher test (p < 0.05).
Agronomy 10 01950 g005aAgronomy 10 01950 g005b
Figure 6. Content of macronutrients (%DM) and sodium (mg kg−1) in mint biomass depending on the applied dose of biochar and nitrogen fertilizer (average from 2017–2019); the factors separation was achieved using NIR Fisher test p < 0.05.
Agronomy 10 01950 g006
Table 1. Soil reaction (pH in H2O), salinity ((EC) electrical conductivity, mS cm−1), and macronutrient content (mg dm−3) in the soil before the start of the experiment in April 2017.
FieldpHEC% CPN-NH4N-NO3KMgCaS
Before cultivation7.030.051.031073.502.8245.7189219923.5
Standard numbers *-- 20–50--80–12060–120800–1000-
* according to Nowosielski [39].
Table 2. Yield of fresh and dry matter (t ha−1) of peppermint herb in 2017–2019.
FactorYield of Fresh Matter
(t ha−1)
Dry Matter Yield
(t ha−1)
Year of research201712.3 a*3.32 a
201822.5 c6.24 c
201916.0 b4.38 b
A dose of biochar
(Mg∙ha−1)
016.7 a4.68 a
516.5 a4.46 a
1517.2 a4.63 a
4517.4 a4.82 a
Nitrogen level
(kg∙ha−1)
7514.8 a4.10 a
10017.6 ab4.78 ab
12518.5 b5.07 b
* A different letter within each column indicates significantly different at p < 0.05 using Tukey’s test.
Table 3. Interaction of experimental factors (year, dose of biochar, and dose of fertilizing nitrogen) on the yield of peppermint herb (t of fresh matter ha−1).
YearN Level
(kg ha−1)
A Dose of Biochar (t ha−1)Average
051545
20177513.711.811.89.911.8 a
10014.513.311.011.212.5 a
12514.912.312.410.912.6 a
Average14.3 b*12.5 a11.8 a10.7 a-
20187517.518.520.621.319.5 a
10020.421.727.024.823.5 b
12523.822.826.525.324.6 b
Average20.6 a21.0 a23.8 b24.7 b-
20197512.212.513.514.013.1 a
10015.017.517.017.516.8 ab
12518.518.015.221.718.3 b
Average15.2 a16.0 a15.2 a17.8 a-
* A different letter within column/row indicates significantly different at p < 0.05 using Tukey’s test (HSD).
Table 4. The interaction of the experimental factors (year, dose of biochar, and dose of fertilizing nitrogen) on the yield of peppermint (t dry matter yield ha−1).
YearN Level
(kg ha−1)
Biochar Dose (t ha−1)Average
051545
2017754.143.303.462.463.33 a
1004.633.062.772.993.37 a
1253.733.503.122.683.26 a
Average4.17 c*3.29 b3.11 ab2.71 a-
2018754.965.365.675.595.39 a
1005.745.707.476.316.30 b
1256.555.947.058.637.04 c
Average5.75 a5.67 a6.73 b6.84 b-
2019753.343.313.683.933.93 a
1004.174.924.624.944.94 b
1254.835.003.925.845.84 b
Average4.11 a4.41 a4.08 a4.91 a-
* A different letter within column/row indicates significantly different at p < 0.05 using Tukey’s test (HSD).
Table 5. Soil reaction (pHH2O), salt concentration (EC µS cm−1), and the contents of macronutrients (mg dm−3) in soil fertilized with different doses of nitrogen (kg N ha−1) at different levels of enrichment of soil with biochar (t ha−1) in 2017–2019.
FactorpHECN-NH4N-NO3CaKMgPS-SO4
Year20177.84 c*84 b3.4 a3.5 b3418 c61 a109 a69 b58 c
20187.49 a80 b4.7 a21.3 c2564 a82 b119 b59 a6 a
20197.69 b41 a19.9 b1.4 a3068 b60 a117 b56 a40 b
Biochar dose07.67 ab57 a6.0 a3.2 a2414 a47 a115 a69 b26 a
57.67 ab71 b5.4 a4.3 a3637 c70 b118 a56 a40 c
157.64 a73 b15.7 c9.9 b3026 b63 b116 a57 a36 b
457.72 b71 b10.2 b17.6 c2988 b90 c112 a64 b36 b
N dose757.68 a61 a8.9 a5.2 a2605 a64 a115 a64 b30 a
1007.66 a72 b8.6 a7.5 b3059 a67 ab117 a64 b36 b
1257.68 a72 b10.6 a13.6 c3385 a71 b112 a56 a38 b
* A different letter within column in each group of factors are significantly different at p < 0.05 using the Tukey test.
Table 6. Macronutrients (%DM) and sodium (mg kg−1 DM) content in mint biomass depending on the biochar doses used (t ha−1) and nitrogen fertilization (kg N ha−1) in 2017–2019.
FactorNCaKMgPS
Year20172.04 c*1.14 b1.59 a0.31 c0.23 b0.22 b
20181.03 a1.08 a1.92 b0.20 b0.21 a0.17 a
20191.22 b1.36 c2.50 c0.11 a0.24 b0.21 b
Biochar dose01.39 a1.26 c1.80 a0.23 c0.21 a0.18 a
51.40 ab1.16 ab1.99 b0.19 a0.22 ab0.19 a
151.46 bc1.21 bc1.94 ab0.22 b0.23 b0.20 a
451.47 c1.13 a2.28 c0.18 a0.24 c0.22 b
N dose751.29 a1.17 a1.99 a0.20 a0.22 a0.20 a
1001.45 b1.21 a2.01 a0.21 a0.23 b0.20 a
1251.54 c1.19 a2.00 a0.21 a0.23 b0.19 a
* Different letters within column in each group of factors are significantly different at p < 0.05 using Tukey’s test.
Publisher’s Note: MDPI stays neutral with regard to jurisdictional claims in published maps and institutional affiliations.

