Article

Environmental Effects on Soybean (Glycine Max (L.) Merr) Production in Central and South Germany

1
Institute of Crop Science, University of Hohenheim, Fruwirthstraße 23, 70599 Stuttgart, Germany
2
Department of Plant Breeding, IFZ Research Centre for Biosystems, Land Use and Nutrition, Justus Liebig University Giessen, Heinrich-Buff-Ring 26, 35392 Giessen, Germany
3
Institute for Resistance Research and Stress Tolerance, Federal Research Centre for Cultivated Plants, Julius Kühn-Institut (JKI), Erwin-Baur-Straße 27, 06484 Quedlinburg, Germany
4
State Plant Breeding Institute, University of Hohenheim Fruwirthstraße 21, 70593 Stuttgart, Germany
5
Center for Organic Farming, University of Hohenheim, Fruwirthstraße 14, 70599 Stuttgart, Germany
*
Author to whom correspondence should be addressed.
Agronomy 2020, 10(12), 1847; https://doi.org/10.3390/agronomy10121847
Submission received: 10 October 2020 / Revised: 19 November 2020 / Accepted: 21 November 2020 / Published: 24 November 2020

Abstract

:
The cultivation area of soybean (Glycine max (L.) Merr) is increasing in Germany as a way to ensure self-sufficiency through its use as feed and food. However, climatic conditions needed for soybean cultivation are not appropriate in all parts of the country. The objective of this study was to determine the influence of solar radiation, temperature, and precipitation on soybean seed productivity and quality in central and south Germany. A multi-factorial field trial was carried out with three replicates at four locations in 2016 and five locations in 2017, testing 13 soybean varieties from the maturity groups MG 00 and MG 000. Considering all the tested factors, “variety” was highly significant concerning protein content (Ø 41.1% dry matter (DM)) and oil content (Ø 19.1% in DM), but not seed yield (Ø 40.5 dt ha−1).The broad sense heritability of protein content was H2 = 0.80 and of oil content H2 = 0.7. Protein and oil content were significantly negatively correlated (r = −0.82). Seed yield was significantly positively correlated with solar radiation (r = 0.32) and precipitation (r = 0.33), but significantly negatively with Crop Heat Units (CHU) (r = −0.42). Over both experimental years, varieties from maturity group MG 00 were less significantly correlated with the tested environmental factors than varieties from maturity group MG 000. None of the environmental factors tested significantly increased the protein or oil content of soybean. In growing areas with heat periods during ripening, protein content tended to be higher than in cooler areas; in areas with high solar radiation during flowering, protein content tended to be reduced.

1. Introduction

Soybean (Glycine max (L.) Merr.), with its multiple uses, is one of the most important crops worldwide [1]. The high-quality of its protein makes it an important component of animal feed for both milk and meat production. Soybean oil is also used for human nutrition. As the demand for vegetarian and vegan food has increased, vegetable proteins and oils from soybeans have gained importance in recent years [2]. The world soybean production in 2017 was 352.6 million tons, of which 77% was GMO soybean [3,4]. The average soybean grain yield in the entire European Union in the years 2016–2017 (3.0 t ha−1) was 10% higher than the yield in Germany (2.7 t ha−1), 20 % lower than in the USA (3.4 t ha−1), and about 13% lower than in Brazil (3.1 t ha−1) [4]. The mean protein content in these trials (41.6%) was comparable to the global average protein content; for example, Brazil (40.9%), USA (41.4 %), and China (42.1%). The oil content in the trials (19.1%) was higher than the oil content in Brazil (18.7%), USA (18.8%), and China (16.8%) [5]. This confirms that the potential for both protein production and oil production via soybean cultivation in Germany gets little attention and consideration. The cultivation of GMO soybean is not permitted in Germany. For environmental and health safety reasons consumers in Germany prefer GMO-free products; this necessitates domestic production, but soy is not a traditional crop in Germany [6]. However, climate change and increasing temperatures in Central Europe offer opportunities to implement and extend soybean into non-traditional areas [1,7,8]. Soybean has a high heat demand. It can therefore only be lucratively cultivated in the southern, warmer parts of Germany [9]. Soybean is also historically a short-day plant, originating from regions with relatively high temperatures during the growing season [1], but breeding progress has made it possible to grow almost day-neutral soybean varieties [2,10]. The beginning of reproductive development (bud formation and flowering) is determined by the latitude and temperature sum of the growing area and genotype (E-gene alleles) [11]. Changes in day length and prevailing daily temperature are of primary importance for these steps [12]. The soybean starts to flower when the length of daylight becomes shorter than critical photoperiod at the growing location [10]. The flowering period and pod filling are also highly sensitive to water stress [13], and water shortages during these periods can lead to significant yield losses up to 20–25 % [4,14]. Soybeans require a precisely determined heat sum during the growing season to mature; for example, >2400 Crop Heat Units (CHU) for very early MG 000 varieties, 2400–2600 CHU for early MG 00 varieties, and well over 3200 CHU for late maturing varieties [15]. In Germany, early and very early varieties of maturity groups MG 00 and MG 000, which were developed to suit our climatic conditions, are cultivated [10]. In the USA, in contrast, varieties from later maturity groups—MG V, MG IV, genotypes with highest, to MG 0, genotypes with the lowest requirement for heat sum, are grown [16].
On average, soybean seeds contain 18–25% oil [2]. The by-product of oil extraction is soybean meal, containing 40–44% crude protein [17]. The concentrations of these two components are genetically predetermined but can vary depending on the environment [18]. The protein and oil content of soybean seeds are negatively correlated [19,20]. A higher temperature during reproductive growth tends to result in higher oil content [21,22]. The effect of temperature on protein content, however, is not yet clear. There is evidence that warm temperatures (>20 °C to <28 °C) during the growing period increase the protein content of soybean [23,24]. However, a negative correlation between temperature and protein content has also been reported [25]. The effects of precipitation on protein and oil content of soybean seeds seem to be inconsistent; there is a positive correlation between precipitation during the growing season and oil content, but a negative correlation between precipitation and protein content [26,27]. Also, a negative correlation of both traits with precipitation has been reported [25].
To meet the demands of protein for food and feed and for soy oil by domestically produced soybeans, it is important to know in which growing areas varieties from different maturity groups (MG 00 and MG 000) develop their best potential. Political decisions and commercial demand as well as preferences in Germany call for an expansion of organic agricultural production [28]. Soybean is one of the few crops that delivers comparable productivity under both organic and conventional farming [29]. The regions where soybean with a high protein content cannot be successfully grown, would be better suited for oil production, especially in organic farming, since there is still no suitable organic oil crop in Germany. The objective of this study was to determine the effects of solar radiation, temperature, and precipitation on soybean seed productivity, protein, and oil content in Germany. The following hypotheses were tested:
(1)
High solar radiation ensures high grain yield.
(2)
Insufficient precipitation leads to a high oil content and low protein content of soybean seeds.
(3)
High temperatures during the growing season increase the protein content of soybean seeds.

2. Materials and Methods

2.1. Cultivation

The field experiments were conducted in two years and at four locations in Germany in 2016—Gruenseiboldsdorf: GSD; Eckartsweier: EKW; Wetterau: WET; Guesten: GUS; and five locations in 2017—Added Rossleben: ROS (Table 1).
The soil texture at all locations was sandy loam with optimal pH 6.5–6.9. The experimental design at all locations was a randomized complete block design with three replicates and 13 varieties. The plot size was identical with harvest area (Table 1).
The seeds of all varieties were untreated and inoculated with HiStick® Soy (2 × 10⁹ colony forming units per gram nitrogen fixing bacterium Bradyrhizobium (Bradyrhizobium japonicum); the application rate was 400 g per 100 kg of seeds). The seeding depth was 3–5 cm and seed rate was calculated to achieve plant density of 60–65 plants m−2. In all years and at all locations, weeds and pests were controlled chemically according to the best management practices. For weed control at the GSD, WET, and EKW locations, the mixture of Centium® 36 CS (360 g l−1 Clomazone) 0.25 l ha−1 + Sencor WG (700 g kg−1 Metribuzin) 0.3 kg ha−1 + Spectrum (720 g l−1 Dimethenamid-P) 0.8 l ha−1 was applied as pre-emergence weed control. In the GUS location Artist® (240 g kg−1 Flufenacet, 175 g kg−1 Metribuzin) 2.0 l ha−1 + Centium® 36 CS (360 g l−1 Clomazone) 0.2 l ha−1 were additionally used in pre-emergence. In ROS, chemical weed control consisted of pre-emergence spraying of Stomp® Aqua (455 g l−1 Pendimethalin) 2.4 l ha−1 + Spectrum (720 g l−1 Dimethenamid-P) 1.4 l ha−1. In 2016 at all locations Karate Zeon® (9, 4%) Lambda-Cyhalothrin was applied at 0.075 l ha−1 against butterfly painted lady (Vanessa cardu). In the second trial year, there was no infestation by this insect. No fungicides were used, as none are officially registered for soybeans in Germany and none of the diseases exceeded the threshold.
The study comprised five varieties from maturity group MG 00 and eight varieties from maturity group MG 000 (Table 2). All varieties were recommended for cultivation in Germany and were among the most widely-grown varieties (Merlin, Sultana) or were new promising varieties (Regina, Sculptor, Coraline) [30].

2.2. Data Collection

Seed yield was determined by combine harvesting at full maturity (R8 (full maturity) + 8–15 days) [31]. The water content of seeds was measured immediately after harvest, and seed yield per plot was corrected to 14% moisture in seed. Protein yield and oil yield were calculated by multiplying seed yield with their corresponding protein or oil content. From all plots at all locations, samples were taken (400–500 g intact soybean seeds) to determine the protein and oil content via near-infrared reflectance spectroscopy (NIRS, Polytec PSSSHA03-2.1) [32].
Weather data was provided by the German weather service. The weather stations were a maximum of 5 km away from the trial fields (Table 3).
The total precipitation over the entire vegetation period (Pwv) was summed for each month, for the growing season (15 April–15 September), and for the critical period for drought stress (15 June to 15 August, R1-R6—Flowering-seed filling). The sum of solar radiation (SRwv) was calculated from the daily value in kWh m−2 for the period from 15 April to 15 September in all trials and years. Solar radiation during flowering (SRf) is the sum of daily value solar radiation in kWh m−2 from 1 June to 1 July. The sum of CHU for the entire vegetation period (CHUwv) was calculated according to Rossberg and Recknagel [15] for the period from 1 June to 15 September. Crop Heat Units (CHU) at maturity was determined for the period 15 August to 15 September. Temperature (Tnight) at flowering is the average of temperatures for every night from R1 to R3 (15 June—31 July).

2.3. Data Analysis

We first calculated the mean of each individual variety for each trait in the respective environments. The means of individual varieties were then averaged across the environments by calculating the arithmetic mean. The normality of distribution and homogeneity of variance of residuals were checked graphically.
For computing broad sense heritability, we estimated the genetic variance in a full random model Equation (1) based on the variety means of each single environment. The standard error of entry means was estimated in a model that considers interactions with the variety as random and all other effects as fixed Equation (2). Analyses were carried out with the software R [33] using the packages lmerTest [34], lsmeans [35], and lme4 [36].
Equation (1):
Pikl = µ + Gi+ Yk + Ll + (GL)il + (GY)ik +(YL)lk+ eikl,
where Pikl is the observed phenotype of the ith variety in the kth year at the lth location, Gi is the random effect of the ith variety, Yk the random effect of the kth year and Ll the random effect of the lth location, (GL)il is the random effect of the ith variety in the lth location, (GY)ik is the random effect of the ith variety in the in the kth year, and (YL)lk is the random effect term of the lth location in the kth year. eikl denotes the error term.
Equation (2):
Pikl = µ + gi+ yk + ll + (GL)il + (GY)ik + eikl,
where Pikl is the observed phenotype of the ith variety in the kth year at the lth location, gi is the fixed effect of the ith variety, yk the fixed effect of the kth year and ll the fixed effect of the lth location. (GL)il is the random effect of the ith variety in the lth location, and (GY)ik is the random effect of the ith variety in the in the kth year. Fixed effects are written in bold lowercase letters. eikl denotes the random error term.
Based on the genetic variance (1) and standard error (2) broad sense heritability was computed as described in (3) [37].
Equation (3):
H 2 = σ G 2 σ G 2 + S E 2 ,
where σ G 2 is the genetic variance derived from the full random model (1) and SE2 is the squared standard error of the difference between the means, derived from (2).
Interrelationships between environmental impacts and seed properties were determined by calculating the Pearson coefficients of correlation (r).

3. Results

The analysis of variance showed highly significant effects of variety on protein and oil content (Table 4). The interaction of year × location was also highly significant for protein and oil content.
The highest heritability was estimated for protein content with H2 = 0.80. The heritabilities for seed and protein yields were H2 = 0.55 and for oil yield H2 = 0.61.
The mean seed yield of varieties from maturity group MG 00 was higher than that from maturity group MG 000 (Table 5). The means of protein and oil content were almost equal for both maturity groups.
The responses of varieties grouped by maturity groups and depending on year revealed significant correlations ranging from r = 0.25 to r = 0.74 (Table 6). In Table 6, the effects of year are shown.
Varieties from the maturity group MG 000 were significantly correlated with environmental conditions compared to varieties from the maturity group MG 00. Solar radiation was the main factor leading to an increase in seed yield and thus to increases in protein yield and oil yield. Precipitation often significantly increased yield and thus protein yield and oil yield in MG 000 varieties. Crop Heat Units, which had no significant effects on the observed traits in MG 00 varieties, were negatively correlated with seed yield, protein yield, and oil yield in MG 000 varieties. The response of MG 000 varieties to precipitation correlated positively with seed yield, protein yield, and oil yield. Crop Heat Units (CHU) and CHU at maturity correlated negatively with yield and thus protein and oil yields.
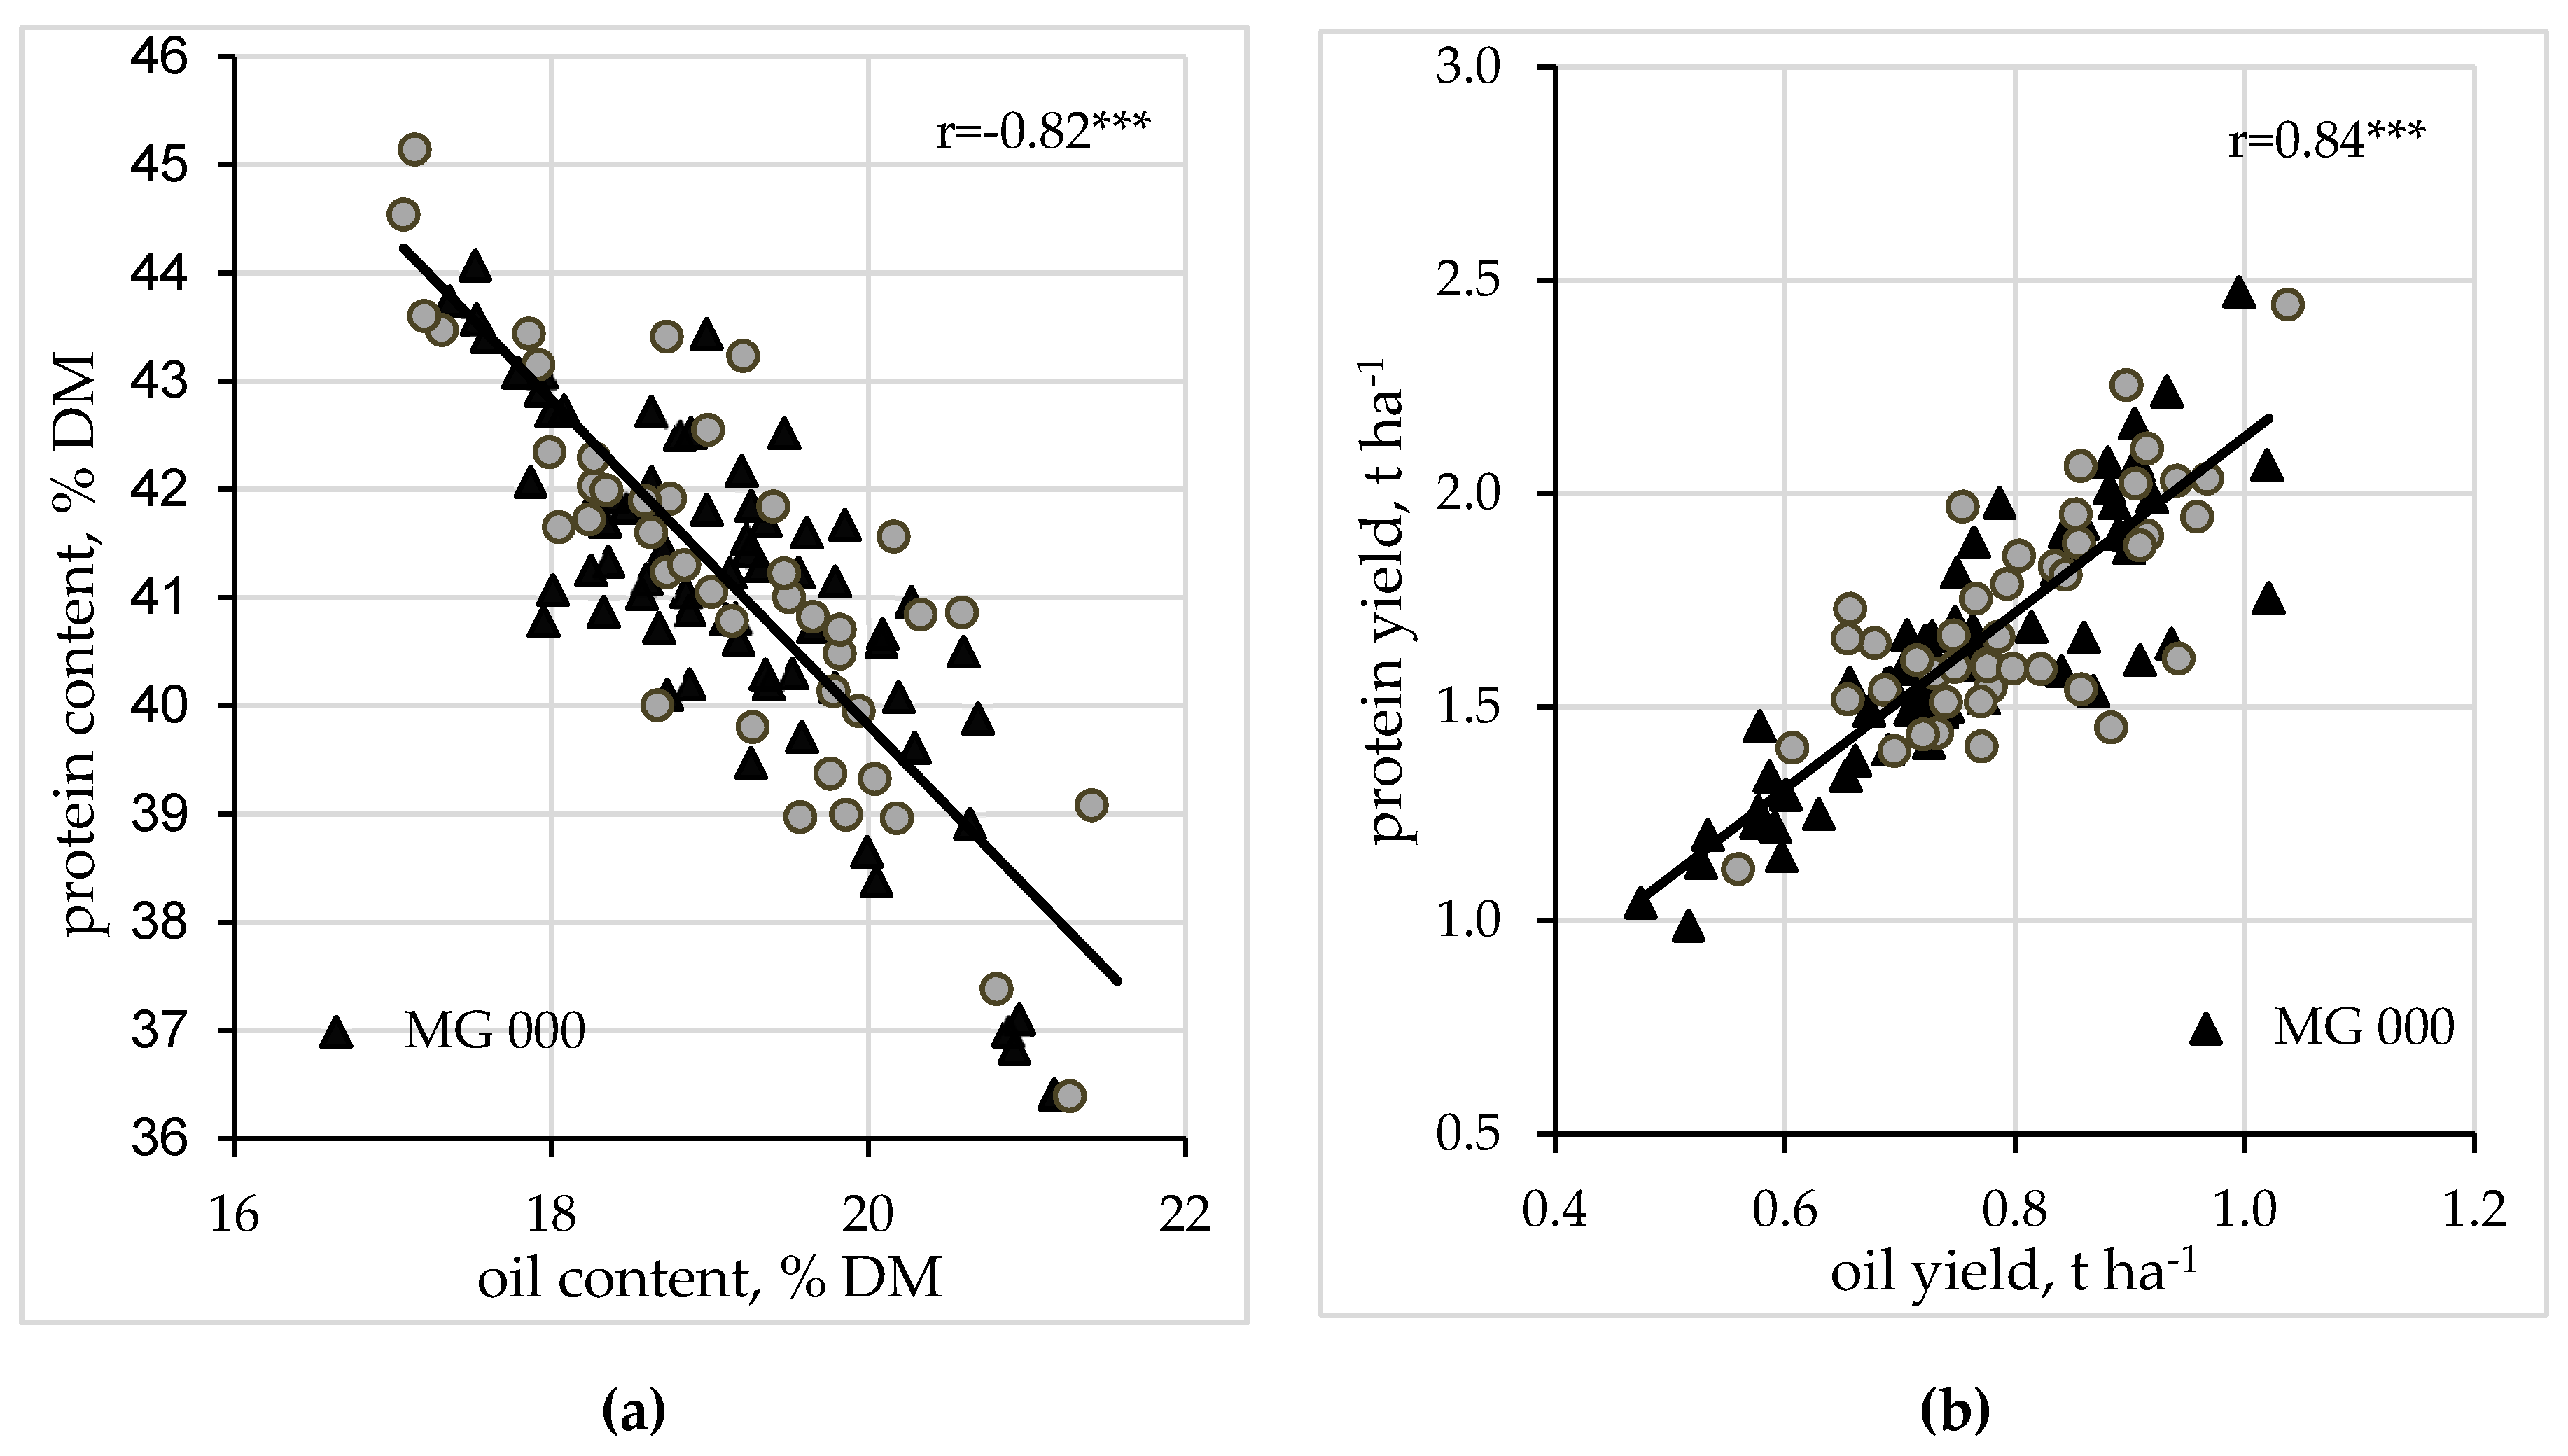
There was a strong negative correlation (r = −0.82 ***) between oil content and protein content over all varieties, locations, and trial years (Figure 1a).
Protein content ranged from 35.4% to 45.1% with a mean of 41.1%. Oil content ranged from 17.1% to 21.6% with a mean of 19.1% (Table 5). The correlation between protein yield and oil yield was positive at r = 0.84, at the highly significant level (p < 0.01) (Figure 1b).
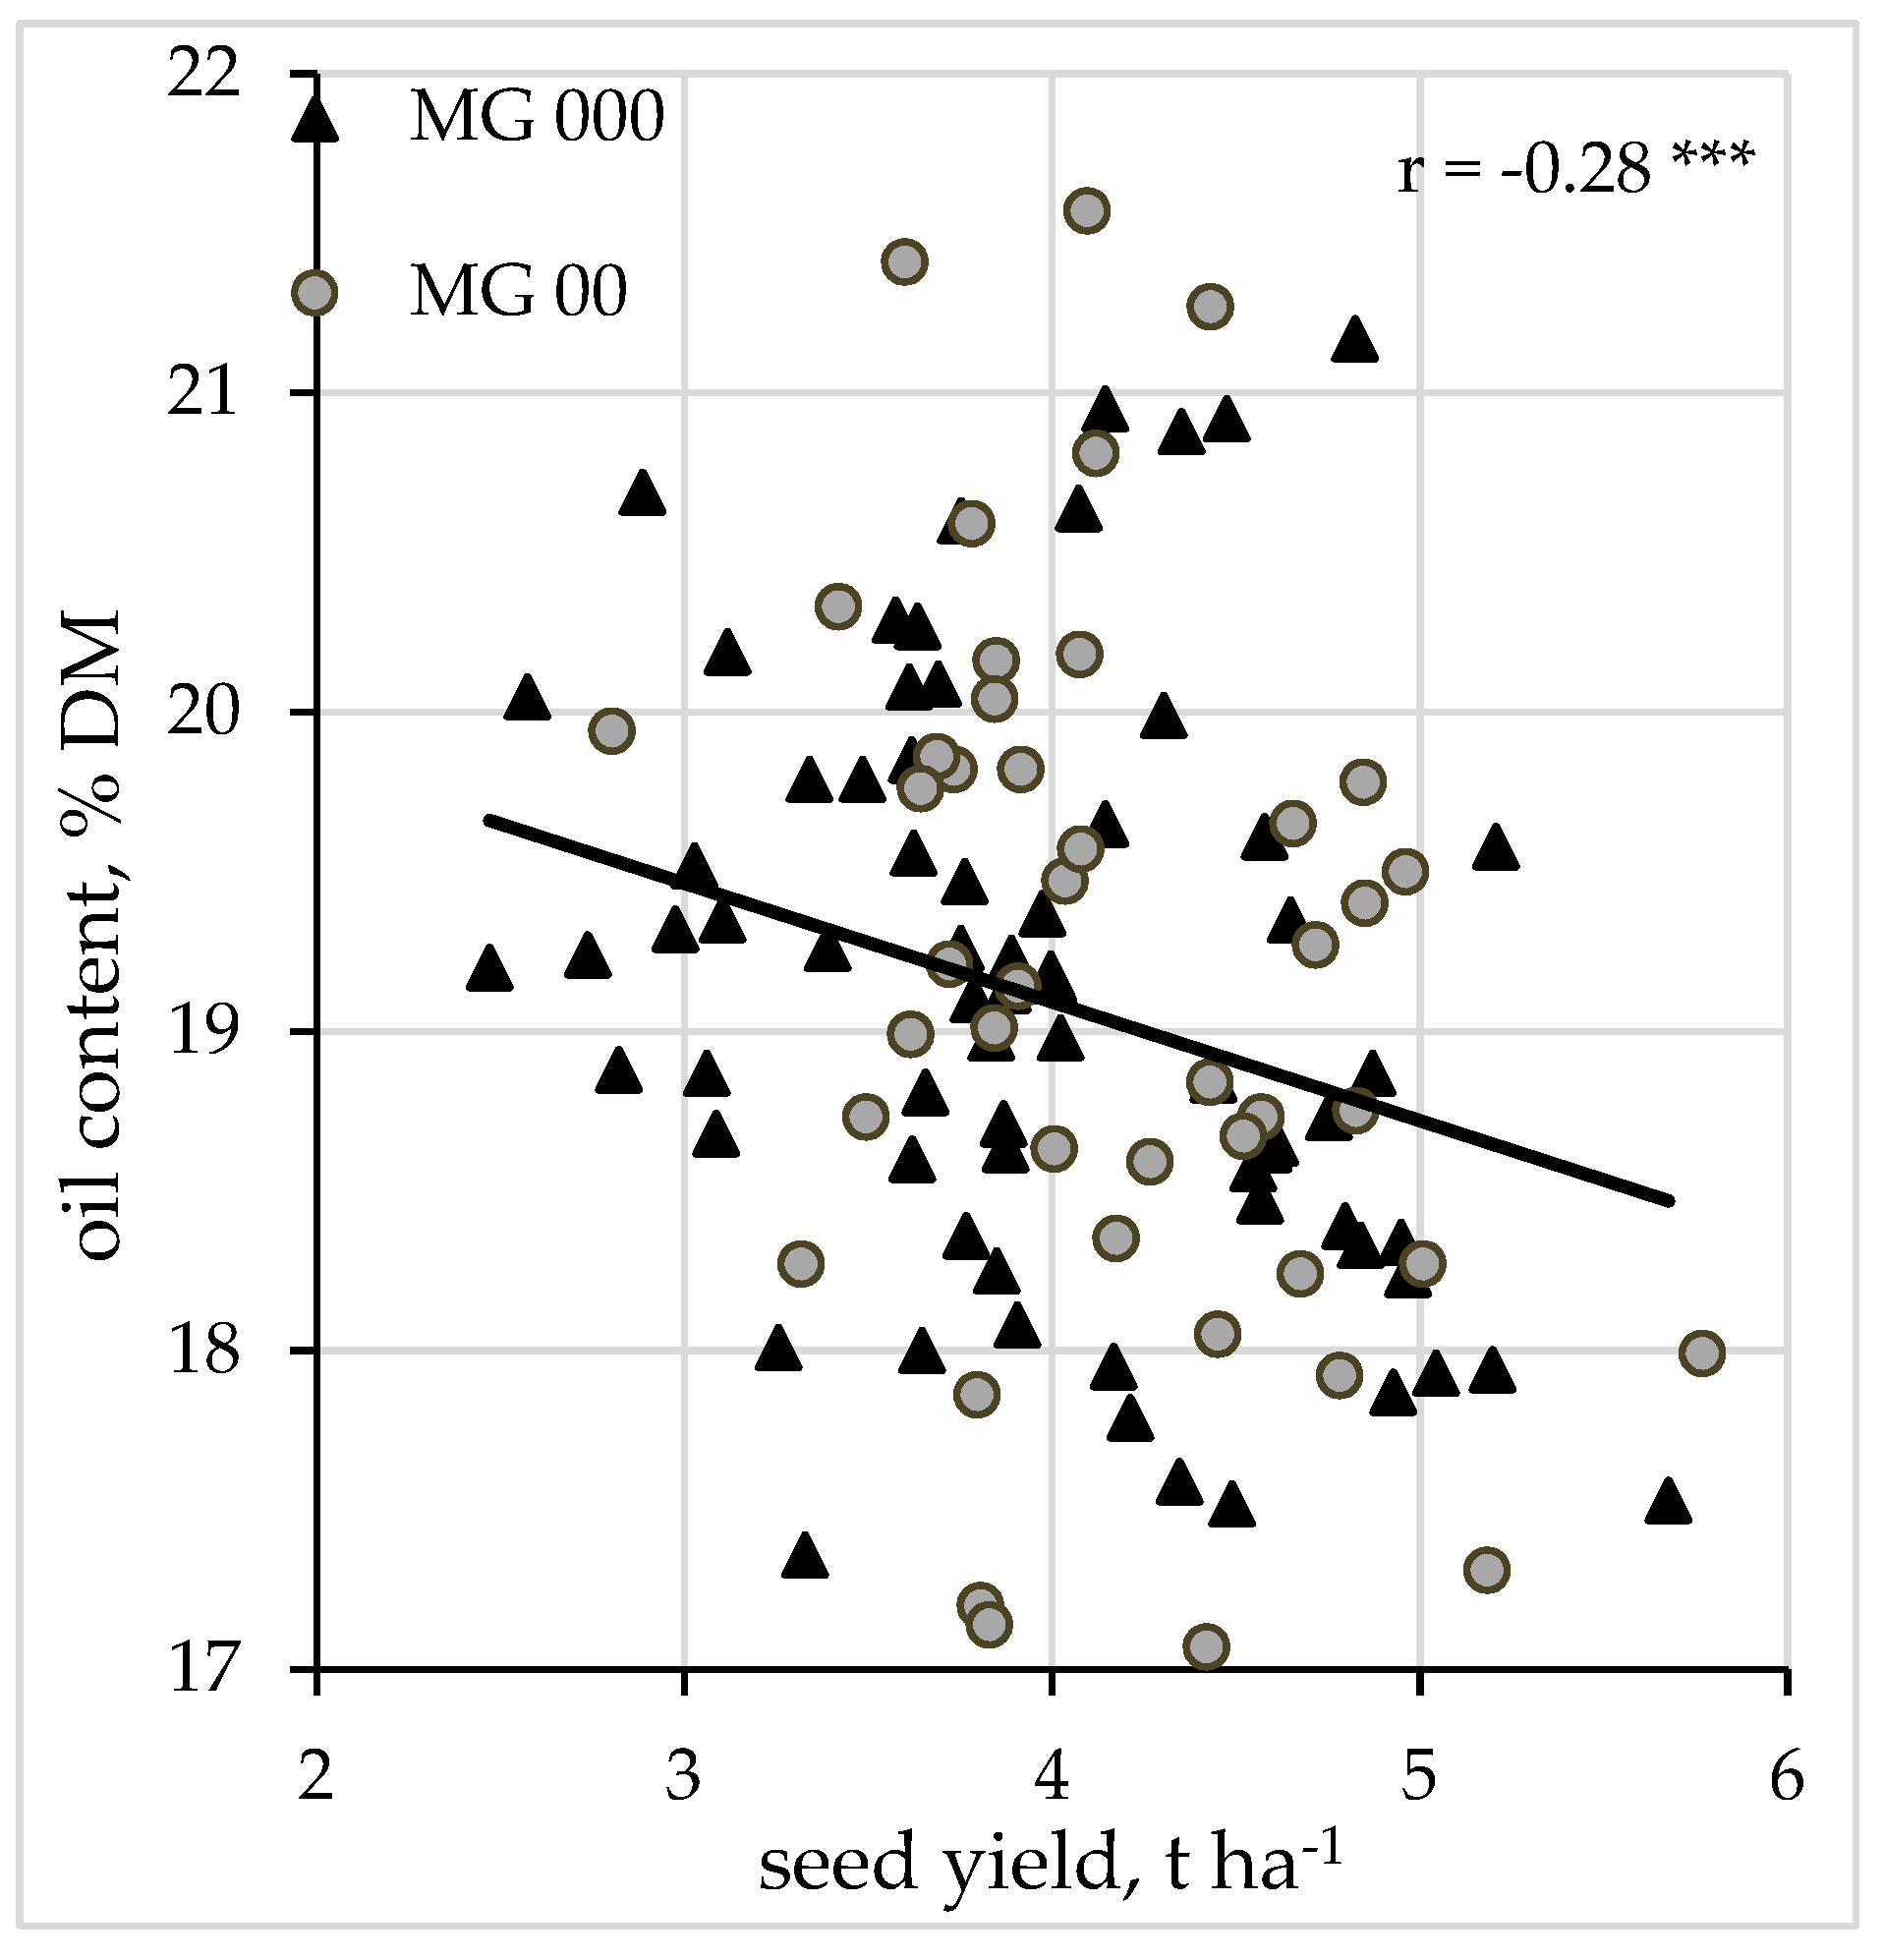
The correlation between seed yield and protein content was low and not significant (data not shown). In contrast, seed yield and oil content were significantly negatively correlated at r = −0.28 *** (Figure 2).

4. Discussion

The high heritability of traits contributes to genetic progress, a characteristic that informs the selection of the most suitable genotypes as future varieties [17,38]. The conditions under which soybeans are grown, including the environment, determine the breeding direction, and this in turn depends on the geographic regions and the proposed cultivation of specific varieties [39,40]. Weather conditions differed in both trial years (Table 3); only night temperatures and solar radiation did not vary greatly over all locations. On average, the year 2017 was moister and cooler than 2016. Crop Heat Units at maturity in 2017 were approximately 60–160 units lower than in 2016. Solar radiation at flowering and-seed filling however, was on average 30 kWhm−2 higher in 2017 than in 2016. As a result, the soybean production properties correlated with environmental factors with varying degrees of intensity (Table 6).
The most critical period in the entire vegetation period of soybean concerning water availability and sufficiency is R4-R6 (pod formation and seed filling) [14,18,21,41]. The results of the current study, with a positive correlation (r = 0.47) between seed yield and precipitation during flowering-seed filling are in accordance with existing literature. The early maturing varieties of MG 000 were more sensitive to increases in precipitation in the period R4-R6 than MG 00 varieties in each trial year (Table 6). This may have been due to the shorter seed filling period and shorter duration of individual periods of vegetation growth of soybean from maturity group 000. This agrees with Souza et al. [42], who compared MG 00 (early ripening) and II (later ripening) varieties in Brazil and also with Chen und Wiatrak [41], who performed experiments with MG IV to VIII in the USA. High solar radiation at flowering increased seed yield in the current study over the two experimental years independent of the maturity group (Table 6), similar to findings of other researchers [13,39,43]. The intensification of solar radiation at the time of flowering could stimulate photosynthesis and thus raise the production of assimilates, leading to an increase in seed yield by increasing the number of pods per reproductive node [39]. Similar results (r = 0.37) for five maturity groups in the USA have also been reported by Kane und Grabau 1992 [44]. At the same time, high temperatures at certain stages of development (R3-R6) can have a negative impact on seed yield and quality characteristics of soybean. For example, Dornbos and Mullen and Gibson and Mullen [45,46] reported that high temperatures (>29 °C) led to a reduction in number of seeds per plant and in seed weight The negative correlation between CHU at maturity and seed yield in our study (r = −0.42) was higher for the early maturing varieties (MG 000). MG 000 varieties can mature in the middle of September in Germany, whereas MG 00 varieties are usually harvested 10–12 days later. High temperatures during the final period of ripening may interfere with the physiological maturing process and simply lead to desiccation, not perfect maturing [9,47].
As previous studies suggest, the protein content of soybean seeds is influenced by day and night temperatures and varies depending on their stage of development [18,47]. Temperatures of about 20°C correlated significantly positively with soybean protein content. Our results indicate that higher temperatures at maturity may lead to higher protein content (Table 6). The protein content of soybean seeds increased with increasing mean temperatures >28 °C and remained constant <28 °C [18]. Compared to our studies, previous studies quoted above examined varieties with a much longer vegetation period (MG up to VIII) and in locations at a much lower latitude (<29.4 °S). In our study, the early ripening varieties (MG 00 and MG 000) reacted more rapidly to the higher temperatures they experienced, which have begun to occur more often in Germany.
Oil content was the only seed property that correlated negatively with Tnight at development stage R1-R3, similar to previous results [48,49,50]. However, soybean studies at 23 locations in Argentina indicated the opposite [27]. Such differences in results were likely due to the fact that those studies [25] were conducted in different regions in Argentina while other three were performed in the USA (Iowa) [48,49,50]; the varieties examined, therefore, belonged to different maturity groups (MG IV-V) (middle late) and II (late).
The time during the growing season when drought occurs can affect the intensity of its influence on protein and oil content [21]. It is well established from studies in the USA, South America, Central Europe, and Russia that oil content is negatively correlated with precipitation at flowering-seed filling phase [14,20,23,47]. Our studies, conducted in a region (Germany) previously considered not suitable for soybean cultivation (because only few varieties were able to ripen at the low CHU), is in line with these results (Table 6). A much stronger negative correlation, as compared to the average of both years, was observed in the dry year 2016 compared to 2017 (Table 6). It is possible that if the season were already dry, further water deficits at this stage could have had a stronger increasing effect on the oil content. If water deficiency occurred at R5-R6, soybean seeds did not fully develop and did not reach their variety-specific size [42,49,51,52]. The transfer processes of nutrients (first of all carbohydrate) and thus seed quality were impaired [14,47], and the assimilates could not be completely converted into protein and oil [52]. However, the protein and oil content are negatively correlated, so the protein content of soybean seeds increased by 3–5% under drought stress then oil content decreased by 2–3% compared to seeds of control plants with optimal water supply [48]. Protein formation in soybean seeds starts about 10–15 days earlier than that of fats [20]; when drought becomes more severe, protein synthesis continues but nutrients for oil are exhausted [21]. From a biochemical point of view, this can be linked to the activation of superoxide, which, in a drought, promotes the accumulation of protein more than that of oil [53]. Such a phenomenon is already known from cereals; when under drought stress, starch enzyme activity is more strongly affected than enzyme for protein formation [54]. Therefore, at drier sites and/ or at locations where drought periods can be expected, varieties that have been selected for high oil content and oil yield should not be grown; rather, this production objective should be pursued at more humid locations. The negative correlation between precipitation at flowering-seed filling and oil content was only detected under dry conditions; under more humid conditions we could not detect this effect (trial year 2017).
Negative correlations of oil content with protein content of soybeans have been reported for soybean since the mid-1960s [17]. The highest negative correlation between protein and oil content was found in the European early maturing genotypes (0-0000); for example, almost r = −0.9 in Germany [17], r = −0.79 in Austria [23], and r = −0.83 in Slovenia [55]. According to investigations in Russia over 27 years, this correlation was on average r = −0.53 [20] and in the Midwest of the USA r = −0.64 [56]. Piper und Boote analyzed 1863 varieties from 10 maturity groups at 60 locations throughout the USA and documented a correlation of r = −0.43 [18]. This strong negative correlation between protein content and oil content was also seen in our results r = −0.82 (average over only early maturing MG 00 and MG 000 varieties—Figure 1a), as typical for Central Europe. The reasons for the strong negative correlation between protein and oil content are not completely clear. These two properties are determined by the same combination of genes and it is difficult to do plant breeding work only to increase of one of these properties without leaving the other unchanged [20,57,58]. However, the synthesis of protein and oil in soybean seeds utilize the same carbon metabolism, and the synthesis processes interact with each other [59]. Therefore, competition for carbon can develop, and this is reflected in a negative correlation.
If the aim is to increase total soybean protein production in Germany, increasing seed yield would increase the amount of protein per unit area. In this context, the phenotypic correlations of seed yield with protein and oil content are important. Though seed yield correlated negatively with protein content but positively with oil content in the common studies [17,56], our investigation did not find a significant correlation of seed yield with protein content; this is similar to the findings of Whaley und Eskandari [40]. Despite its importance, there is no clear evidence of a relationship between seed yield and protein content. Test results from Germany provide information about a low and negative correlation [17] while in the USA a low but positive correlation has been calculated [22]. This correlation is influenced by year and weather/soil conditions in the growing area [23]. Such a regulation process between protein content and seed yield is known from wheat [60]. Therefore, genotypic variation together with environment provides many breeding possibilities for the adaptation of new varieties [40]. The low negative correlation between seed yield and oil content in our study contrasts with other available results [22,51]. It is essential to take the findings of referenced studies into consideration when planning the production, especially the choice of varieties, of certain soybean products such as soybean meal, soybean oil or tofu, and other foodstuffs, in different growing areas of a country with a temperate climate.
Time to maturity, drought tolerance, and heat tolerance are important traits to consider in adapting soybean varieties to different growing environments. Since the levels of protein content and oil content of the maturity groups MG 00 and MG 000 barely differed, and since the seed yields of MG 00 varieties trended higher than those of MG 000 varieties, MG 00 varieties should preferentially be cultivated and bred in regions suitable either for protein or oil production. To select for varieties with high seed yield and with long ripening period, such as the tested MG 00 varieties, the testing should occur in regions with comparatively high solar radiation (for example location Eckartsweier). The late ripening varieties from MG 0 would also be appropriate for these locations. In regions with comparatively high precipitation, MG 000 varieties would be suitable because of their high seed yields and therefore high protein and oil yields (for example Grünseiboldsdorf, Wetterau, and Rossleben). If MG 00 varieties were cultivated in drier areas (such as Eckartsweier and Guesten) the oil content would be higher. High temperatures at maturation would result in higher protein content in MG 000 varieties (Eckartsweier, Wetterau and Grünseiboldsdorf). The following table ranks the tested soybean varieties according to their adaption to locations with different environmental properties in Germany (Table 7).

5. Conclusions

Environmental parameters such as solar radiation, temperature, and precipitation, in addition to breeding progress, will determine the success of soybean production in Germany. It is necessary to place the varieties in suitable growing environments according to the direction of use to achieve the highest performance. Regions with high solar radiation and ample precipitation are suitable for producing high seed, protein, and oil yields of soybean using varieties from MG 00 and MG 000 maturity groups. Dry growing areas should be selected for oil production as a possible supply of vegetable oil, especially in organic farming. If production is concentrated on high protein content, the MG 000 varieties should be grown in regions where temperatures remain high during ripening. This knowledge can be used as a tool to expand soybean cultivation to the dry eastern Germany and northern German cool regions. Domestically grown soy products can then meet the growing demand for vegan and vegetarian food.

Author Contributions

O.S.: conceptualization, data collection, data evaluation, main writing and structuring of original draft; A.S. conceptualization, data evaluation; V.H. conceptualization, review and editing; S.Z. conceptualization, review and editing; W.C. conceptualization, review and editing; S.G. contributor role, conceptualization, review and editing, supervision. All authors have read and agreed to the published version of the manuscript.

Funding

This research received no external funding.

Acknowledgments

We thank Saaten Union GmbH for the opportunity to carry out the trials, and for all support. Special thanks go to all research institutions, who has realized the field trials.

Conflicts of Interest

The authors declare no conflict of interest.

References

  1. Hahn, V.; Miedaner, T. Soybean Cultivation in the EU. Rewarding Cultivation Without GMOs; 100% Practice; in German; DLG-Verlag: Frankfurt am Main, Germany, 2013; ISBN 9783769020199. [Google Scholar]
  2. The Soybean. Botany, Production and Uses; Singh, G. (Ed.) CABI: Wallingford, CT, USA, 2010; ISBN 9781845936440. [Google Scholar]
  3. ISAAA. Global Status of Commercialized Biotech/GM Crops. Available online: http://www.isaaa.org/resources/publications/briefs/52/executivesummary/default.asp (accessed on 23 January 2020).
  4. FAOSTAT. Available online: http://www.fao.org/faostat/en/#data/QC (accessed on 3 November 2019).
  5. Grieshop, C.M.; Fahey, G.C. Comparison of quality characteristics of soybeans from Brazil, China, and the United States. J. Agric. Food Chem. 2001, 49, 2669–2673. [Google Scholar] [CrossRef] [PubMed]
  6. EST GmbH. Soybeans—Global Volume Distribution and Volume Flows. Available online: http://www.sojatoaster.com/hintergrundinfos/sojaanbau-globale-mengenverteilung-und-mengenstroeme/ (accessed on 23 January 2020).
  7. Sojafoederring. Available online: https://www.sojafoerderring.de/aktuell/aktuelle-kurzmeldungen/ (accessed on 22 January 2020).
  8. Jongman, R.H.G.; Bunce, R.G.H.; Metzger, M.J.; Mücher, C.A.; Howard, D.C.; Mateus, V.L. Objectives and applications of a statistical environmental stratification of Europe. Landsc. Ecol. 2006, 21, 409–419. [Google Scholar] [CrossRef]
  9. Leithold, G.; Schulz, F.; Franz, K.-P. Suitability of short-seasoned soybeans for cultivation on an organic marginal site, taking into account different row spacing (in German). Crop Sci. 2003, 1, 21–28. [Google Scholar]
  10. Berschneider, J. Chances and Limitations of European Soybean Production: Market Potential Analysis. Master’s Thesis, Universität Hohenheim, Stuttgart, Germany, 2016. [Google Scholar]
  11. Jia, H.; Jiang, B.; Wu, C.; Lu, W.; Hou, W.; Sun, S.; Yan, H.; Han, T. Maturity group classification and maturity locus genotyping of early-maturing soybean varieties from high-latitude cold regions. PLoS ONE 2014, 9, e94139. [Google Scholar] [CrossRef] [PubMed]
  12. Soybeans. Improvement, Production, and Uses, 3rd ed.; Boerma, H.R.; Specht, J.E. (Eds.) American Society of Agronomy, Crop Science Society of America, Soil Science Society of America: Madison, WI, USA, 2004; ISBN 978-0-89118-266-5. [Google Scholar]
  13. Jones, P.G.; Laing, D.R. The effects of phenological and meteorological factors on soybean yield. Agric. Meteorol. 1978, 19, 485–495. [Google Scholar] [CrossRef]
  14. Brevedan, R.E.; Egli, D.B. Short periods of water stress during seed filling, leaf senescence, and yield of soybean. Crop Sci. 2003, 43, 2083. [Google Scholar] [CrossRef]
  15. Roßberg, D.; Recknagel, J. Investigations on the suitability of soybean cultivation in Germany (in German). J. Cult. Plant 2017, 69, 137–145. [Google Scholar]
  16. Miersch, M. Soybean Cultivation in North America—Web Links. Available online: https://www.sojafoerderring.de/wp-content/uploads/2016/12/Sojainfo_18_2016_Sojanbau_USA_Weblinks1.pdf (accessed on 14 March 2020).
  17. Kurasch, A.K.; Hahn, V.; Leiser, W.L.; Starck, N.; Würschum, T. Phenotypic analysis of major agronomic traits in 1008 RILs from a diallel of early European soybean varieties. Crop Sci. 2017, 57, 726. [Google Scholar] [CrossRef]
  18. Piper, E.L.; Boote, K.I. Temperature and cultivar effects on soybean seed oil and protein concentrations. J. Am. Oil Chem. Soc. 1999, 76, 1233–1241. [Google Scholar] [CrossRef]
  19. Hurburgh, C.R.; Paynter, L.N.; Schmitt, S.G. Quality sharacteristics of Midwestern soybeans. Appl. Eng. Agric. 1987, 3, 159–165. [Google Scholar] [CrossRef] [Green Version]
  20. Novikova, L.Y.; Seferova, I.V.; Nekrasov, A.Y.; Perchuk, I.N.; Shelenga, T.V.; Samsonova, M.G.; Vishnyakova, M.A. Impact of weather and climate on seed protein and oil content of soybean in the North Caucasus. Vavilov J. Genet. Breed. 2018, 22, 708–715. [Google Scholar] [CrossRef]
  21. Carrera, C.; Martínez, M.J.; Dardanelli, J.; Balzarini, M. Water deficit effect on the relationship between temperature during the seed fill period and soybean seed oil and protein concentrations. Crop Sci. 2009, 49, 990. [Google Scholar] [CrossRef]
  22. Mourtzinis, S.; Gaspar, A.P.; Naeve, S.L.; Conley, S.P. Planting date, maturity, and temperature effects on soybean seed yield and composition. Agron. J. 2017, 109, 2040. [Google Scholar] [CrossRef] [Green Version]
  23. Vollmann, J.; Fritz, C.N.; Wagentristl, H.; Ruckenbauer, P. Environmental and genetic variation of soybean seed protein content under Central European growing conditions. J. Sci. Food Agric. 2000, 80, 1300–1306. [Google Scholar] [CrossRef]
  24. Sudaric, A.; Simic, D.; Vrataric, M. Characterization of genotype by environment interactions in soybean breeding programmes of southeast Europe. Plant Breed. 2006, 125, 191–194. [Google Scholar] [CrossRef]
  25. Maestri, D.M.; Labuckas, D.O.; Meriles, J.M.; Lamarque, A.L.; Zygadlo, J.A.; Guzmán, C.A. Seed composition of soybean cultivars evaluated in different environmental regions. J. Sci. Food Agric. 1998, 77, 494–498. [Google Scholar] [CrossRef]
  26. Kumar, V.; Rani, A.; Solanki, S.; Hussain, S.M. Influence of growing environment on the biochemical composition and physical characteristics of soybean seed. J. Food Compos. Anal. 2006, 19, 188–195. [Google Scholar] [CrossRef]
  27. Carrera, C.; Martínez, M.J.; Dardanelli, J.; Balzarini, M. Environmental variation and correlation of seed components in nontransgenic soybeans: Protein, oil, unsaturated fatty acids, tocopherols, and isoflavones. Crop Sci. 2011, 51, 800. [Google Scholar] [CrossRef]
  28. BMEL. “Organic Farming—Looking Forwards” Strategy: Towards Greater Sustainability in Germany. Available online: https://www.bmel.de/SharedDocs/Downloads/EN/Publications/OrganicFarmingLookingForwards.pdf?__blob=publicationFile (accessed on 14 March 2020).
  29. Sojafoerdering. Bio-Soybean Info Bavaria. Available online: https://www.sojafoerderring.de/aktuell/newsletter/bio-soja-info-bayern/ (accessed on 14 March 2020).
  30. Federal Office for Plant Varieties. Descriptive List of Varieties: Cereals, Maize Oil and Fiber Crops, Leguminous, Beet Root and Catch Crops. (In German). Available online: https://www.bundessortenamt.de/apps6/bsa_bsl/public/de/result (accessed on 25 January 2020).
  31. Fehr, W.R.; Caviness, C.E. Stage of development descriptions for soybeans, Glycine Max (L.) Merrill. Crop Sci. 1971, 11, 929–931. [Google Scholar] [CrossRef]
  32. Pazdernik, D.L.; Killam, A.S.; Orf, J.H. Analysis of amino and fatty acid composition in soybean seed, using Near Infrared Reflectance Spectroscopy. Agron. J. 1997, 89, 679–685. [Google Scholar] [CrossRef]
  33. R Foundation for Statistical Computing, A language and environment for statistical computing: Version 3.1; Vienna, Austria, 2013. Available online: http://www.R-project.org/ (accessed on 25 January 2020).
  34. Kuznetsova, A.; Brockhoff, P.B.; Christensen, R.H.B. lmerTest Package: Tests in linear mixed effects models. J. Stat. Softw. 2017, 82, 9892–9918. [Google Scholar] [CrossRef] [Green Version]
  35. Russell, V.L. Least-squares means: The R Package lsmeans. J. Stat. Softw. 2016, 69, 4801–4834. [Google Scholar] [CrossRef] [Green Version]
  36. Douglas, B.; Maechler, M.; Bolker, B.; Walker, S. Fitting linear mixed-effects models using lme4. J. Stat. Softw. 2015, 67, 363–385. [Google Scholar] [CrossRef]
  37. Piepho, H.-P.; Möhring, J. Computing heritability and selection response from unbalanced plant breeding trials. Genetics 2007, 177, 1881–1888. [Google Scholar] [CrossRef] [Green Version]
  38. Aditya, J.P.; Bhartiya, P.; Bhattiya, A. Genetic variability, heritability and character association for yield and component characters in soybean (G. max (L.) Merrill). J. Cent. Eur. Agric. 2011, 12, 27–34. [Google Scholar] [CrossRef] [Green Version]
  39. Board, J.E.; Harville, B.G. Soybean yield component responses to a light Iinterception gradient during the reproductive period. Crop Sci. 1993, 33, 772. [Google Scholar] [CrossRef]
  40. Whaley, R.; Eskandari, M. Genotypic main effect and genotype-by-environment interaction effect on seed protein concentration and yield in food-grade soybeans (Glycine max (L.) Merrill). Euphytica 2019, 215, 1. [Google Scholar] [CrossRef]
  41. Chen, G.; Wiatrak, P. Soybean development and yield are influenced by planting date and environmental conditions in the southeastern coastal plain, United States. Agron. J. 2010, 102, 1731. [Google Scholar] [CrossRef]
  42. De Souza, P.I.; Egli, D.B.; Bruening, W.P. Water stress during seed filling and leaf senescence in soybean. Agron. J. 1997, 89, 807. [Google Scholar] [CrossRef]
  43. Caron, B.O.; Sgarbossa, J.; Schwerz, F.; Elli, E.F.; Eloy, E.; Behling, A. Dynamics of solar radiation and soybean yield in agroforestry systems. An. Acad. Bras. Cienc. 2018, 90, 3799–3812. [Google Scholar] [CrossRef]
  44. Kane, M.V.; Grabau, L.J. Early planted, early maturing soybean cropping system: Growth, development, and yield. Agron. J. 1992, 84, 769. [Google Scholar] [CrossRef]
  45. Dornbos, D.L.; Mullen, R.E. Influence of stress during soybean seed fill on seed weight, germination, and seedling growth rate. Can. J. Plant Sci. 1991, 71, 373–383. [Google Scholar] [CrossRef] [Green Version]
  46. Gibson, L.R.; Mullen, R.E. Influence of day and night temperature on soybean seed yield. Crop Sci. 1996, 36, 98. [Google Scholar] [CrossRef]
  47. Rotundo, J.L.; Westgate, M.E. Meta-analysis of environmental effects on soybean seed composition. Field Crop. Res. 2009, 110, 147–156. [Google Scholar] [CrossRef]
  48. Dornbos, D.L.; Mullen, R.E. Soybean seed protein and oil contents and fatty acid composition adjustments by drought and temperature. J. Am. Oil Chem. Soc. 1992, 69, 228–231. [Google Scholar] [CrossRef]
  49. Gibson, L.R.; Mullen, R.E. Soybean seed quality reductions by high day and night temperature. Crop Sci. 1996, 36, 1615. [Google Scholar] [CrossRef]
  50. Kane, M.V.; Steele, C.C.; Grabau, L.J.; MacKown, C.T.; Hildebrand, D.F. Early-maturing soybean cropping system: III Protein and oil contents and oil composition. Agron. J. 1997, 89, 464. [Google Scholar] [CrossRef]
  51. Leffel, R.C. Breeding soybeans for the economic values of seed oil and protein. JPA 1989, 2, 338. [Google Scholar] [CrossRef]
  52. Egli, D.B.; Bruening, W.P. Water stress, photosynthesis, seed sucrose levels and seed growth in soybean. J. Agric. Sci. 2004, 142, 1–8. [Google Scholar] [CrossRef]
  53. Ku, Y.-S.; Au-Yeung, W.-K.; Yung, Y.-L.; Li, M.-W.; Wen, C.-Q.; Liu, X.; Lam, H.-M. Drought Stress and Tolerance in Soybean. Available online: https://www.intechopen.com/books/a-comprehensive-survey-of-international-soybean-research-genetics-physiology-agronomy-and-nitrogen-relationships/drought-stress-and-tolerance-in-soybean (accessed on 25 January 2020).
  54. Dupont, F.M.; Altenbach, S.B. Molecular and biochemical impacts of environmental factors on wheat grain development and protein synthesis. J. Cereal Sci. 2003, 38, 133–146. [Google Scholar] [CrossRef]
  55. Flajsman, M.; Santavec, I.; Kolmanic, A.; Kosmelj, K.; Kocjan-Acko, D. Agronomic performance and stability of seed, protein and oil yields of seven soybean cultivars determined in field experiments in Slovenia. Genetika 2019, 51, 31–46. [Google Scholar] [CrossRef] [Green Version]
  56. Naeve, S.L.; O’Neill, T.A.; Miller-Garvin, J.E. Canopy nitrogen reserves: Impact on soybean yield and seed quality traits in Northern Latitudes. Agron. J. 2008, 100, 681. [Google Scholar] [CrossRef]
  57. Hwang, E.-Y.; Song, Q.; Jia, G.; Specht, J.E.; Hyten, D.L.; Costa, J.; Cregan, P.B. A genome-wide association study of seed protein and oil content in soybean. BMC Genom. 2014, 15, 1. [Google Scholar] [CrossRef] [Green Version]
  58. Yaklich, R.W.; Vinyard, B.; Camp, M.; Douglass, S. Analysis of seed protein and oil from soybean northern and southern region uniform tests. Crop Sci. 2002, 42, 1504. [Google Scholar] [CrossRef]
  59. Sugimoto, T.; Tanaka, K.; Monma, M.; Kawamura, Y.; Saio, K. Phosphoenolpyruvate carboxylase level in soybean seed highly correlates to its contents of protein and lipid. Agric. Biol. Chem. 2014, 53, 885–887. [Google Scholar] [CrossRef] [Green Version]
  60. Fiez, T.E.; Miller, B.C.; Pan, W.L. Winter wheat yield and grain protein across varied landscape positions. Agron. J. 1994, 86, 1026–1032. [Google Scholar] [CrossRef]
Figure 1. Correlation between protein content and oil content (a) and protein yield and oil yield (b) of soybean. Figure shows results from five locations, 13 varieties from the maturity groups MG 00 and MG 000; two trial years (2016, 2017). *** p < 0.001.
Agronomy 10 01847 g001
Figure 2. Correlation between seed yield and oil content of soybean. Figure shows results from 13 varieties from the maturity groups MG 00 and MG 000 at five locations and two trial years (2016, 2017). *** p < 0.001.
Agronomy 10 01847 g002
Table 1. Characterization of locations and cropping details.
Trial LocationGPS PositionDate of SowingMethod of SowingDate of HarvestPreceding Crop $Harvest Area, m−2Precipitation and Temperature $$
mm°C
2016
GSD2016Grünseiboldsdorf48°29′ N 11°56′ E22 AprilDrill17 September WW10.48147.7
EKW2016Eckartsweier48°32′ N 7°52′ E29 AprilSingle seed13 September WW7.87269.9
WET2016Wetterau50°24′ N 8°39 E22 April Single seed20 SeptemberWW15.06559.3
GUS2016Guesten50°95′ N 6°43′ E20 April Drill22 SeptemberSB10.566010.0
2017
GSD2017Grünseiboldsdorf48°29′ N 11°56′ E24 AprilDrill24 SeptemberWW10.48147.7
EKW2017Eckartsweier48°32′ N 7°52′ E24 AprilSingle seed16 SeptemberWW7.87269.9
WET2017Wetterau50°22′ N 8°39′ E25 AprilSingle seed14 OctoberWW15.06559.3
GUS2017Guesten50°96′ N 6°42′ E25 AprilDrill27 SeptemberSB10.566010.0
ROS2017Rossleben51°18′ N 11°26′ E5 MayDrill16 OctoberC10.55329.4
$ WW: winter wheat (Triticum aestivum), SB: sugar beet (Beta vulgaris), C: Canola (Brassica napus) $$ long-term means (last 20 years).
Table 2. Tested varieties according to year of registration and maturity group 1.
VarietyMaturity Group (MG)Year of RegistrationVarietyMaturity Group (MG)Year of Registration
Tourmaline000/002013Adsoy000/00002012
ES Mentor002009Merlin0001997
SY Eliot002013Sultana0002009
Orion001999Viola0002015
Primus002005Sculptor0002017
Lissabon0002008
Regina0002016
Coraline0002014
1 it is approximately 12–14 days of difference in maturity between the maturity groups.
Table 3. Overview of weather conditions at the trial locations.
TrialPwv §, mmSRwv #, kWh m−2CHUwv Pfs ¥, mmTnight at Flowering, °CSRf , kWh m−2CHU at Maturity
GDS2016396566.22747205.013.0169.0724
EKW2016281562.9310277.014.4155.6761
WET2016243512.9302081.313.1148.4759
GUS2016321421.23101132.414.1117.3794
GDS2017497563.42664206.413.1203.3565
EKW2017253556.63163117.015.5197.9708
WET2017466498.92873201.013.5172.4648
GUS2017276360.43063134.314.7150.9671
ROS2017365520.82783225.014.1179.9609
§ Pwv—Total precipitation over entire vegetation period; # SRwv—Solar radiation over entire vegetation period; CHUwv—Crop Heat Units over entire vegetation period; ¥ Pfs—Precipitation flowering-seed filling; SRf—Solar radiation at flowering.
Table 4. Analysis of variance (based on Equation (1)) and heritability (Equation (3)) for seed yield and quality over five locations and two trial years.
p Value
Seed YieldProtein ContentOil ContentProtein YieldOil Yield
Variety0.140.0001 ***0.002 **0.130.09
Year0.281.01.00.70.19
Location0.321.01.00.870.05 *
Year × variety0.02 *0.70.1040.01 *0.04 *
Location × variety0.430.51.00.180.7
Year × location0.01 *0.0001 ***0.0001 ***0.0001 ***0.8
Heritability (H2), %0.550.800.690.550.61
Significant codes, p =: < 0.001 *** 0.01 ** 0.05 *.
Table 5. Soybean seed yield (arithmetic means) and seed properties’ means over five locations, 13 varieties and two trial years (2016, 2017) in Germany, p < 0.05.
MG $ 00 MG 000MG 00 and 000
MeanSD $$MeanSDMeanSD
Seed yield [t ha−1]3.58±0.493.39±0.603.48±0.57
Protein content [% DM ] 41.08±1.9741.05±1.5841.06±1.74
Oil content [% DM]19.16±1.1219.11±0.9319.14±1.00
Protein yield [t ha−1]1.47±0.221.40±0.261.44±0.25
Oil yield [t ha−1]0.69±0.090.65±0.110.67±0.10
$ MG—Maturity group; $$ SD—Standard deviation, DM—Dry matter.
Table 6. Correlations between environmental conditions and seed traits of soybean (Glycine max) across five locations and 13 varieties in Germany in the years 2016 and 2017 respectively, and averaged over both years, p < 0.05.
Precipitation, mmSolar Radiation, kWh m−2CHUPFS ¥, mmTnight at Flowering, °CSRf , kWh m−2CHU at Maturity
Maturity group 00
Seed yield
2016−0.040.64 *0.01−0.180.350.50 *−0.31
20170.140.49 *−0.250.41 *−0.080.32−0.16
mean 0.180.46 *−0.19−0.250.190.50 *−0.37 *
Protein content
20160.20−0.03−0.160.21−0.100.09−0.07
2017−0.16−0.100.180.130.16−0.320.31
Mean−0.12−0.070.120.070.06−0.230.22
Oil content
2016−0.74 *−0.210.51 *−0.67 *0.04−0.260.36
20170.260.03−0.24−0.07−0.280.25−0.35
Mean−0.060.020.04−0.38 *−0.27−0.130.12
Protein yield
20160.030.63 *−0.01−0.140.330.50 *−0.32
20170.060.36−0.130.39−0.010.13−0.02
Mean0.130.40 *−0.140.260.190.38 *−0.27
Oil yield
2016−0.210.58 *0.16−0.370.370.42−0.21
20170.290.51 *−0.360.36−0.230.47 *−0.34
Mean0.170.49 *−0.170.080.090.46 *−0.32 *
Maturity group 000
Seed yield
20160.60 *0.19−0.67 *0.66 *−0.49 *0.32−0.49 *
20170.220.41 *−0.300.39 *−0.170.30−0.25
Mean0.41 *0.26 *−0.47 *0.59 *−0.120.45 *−0.46 *
Protein content
20160.240.21−0.230.21−0.050.22−0.23
2017−0.22−0.180.230.100.21−0.41 *0.35 *
Mean−0.17−0.070.140.050.09−0.25 *0.25 *
Oil content
2016−0.64 *−0330.44 *−0.54 *−0.03−0.350.39 *
20170.310.16−0.30−0.01−0.310.36 *−0.41 *
Mean−0.020.05−0.003−0.32 *−0.31 *−0.120.13
Protein yield
20160.62 *0.22−0.69 *0.68 *−0.49*0.35*−0.52 *
20170.130.32 *−0.220.39 *−0.10−0.16−0.13
Mean0.35 *0.22−0.43 *0.58 *−0.090.38 *−0.39 *
Oil yield
20160.48 *0.12−0.60 *0.57 *−0.52 *0.26−0.42 *
20170.33 *0.45*−0.40 *0.38 *−0.280.41 *−0.38 *
Mean0.43 *0.28 *−0.50 *0.52 *−0.220.44 *−0.45 *
¥ Pfs—Precipitation flowering-seed filling; SRf—Solar radiation at flowering; * p < 0.05.
Table 7. Classification of soybean varieties according to their adaption to different locations in Germany.
LocationMG 00 VarietiesMG 000 Varieties
Suitable for High
dry oil contentoil content
wet no effectyield
warm yieldprotein content
coolno effectno effect
high solar radiationyieldyield
Publisher’s Note: MDPI stays neutral with regard to jurisdictional claims in published maps and institutional affiliations.

