Article

Variability for Glutenins, Gluten Quality, Iron, Zinc and Phytic Acid in a Set of One Hundred and Fifty-Eight Common Wheat Landraces from Iran

1
Department of Agronomy and Plant Breeding, Faculty of Agriculture, University of Zanjan, Zanjan 45371-38791, Iran
2
Departamento de Genética, Escuela Técnica Superior de Ingeniería Agronómica y de Montes, Edificio Gregor Mendel, Campus de Rabanales, Universidad de Córdoba, CeiA3, 14071 Córdoba, Spain
3
Global Wheat Program, International Maize and Wheat Improvement Center (CIMMYT), Apdo. Postal 6-641, Mexico DF., Mexico
*
Author to whom correspondence should be addressed.
Agronomy 2020, 10(11), 1797; https://doi.org/10.3390/agronomy10111797
Submission received: 19 October 2020 / Revised: 12 November 2020 / Accepted: 13 November 2020 / Published: 16 November 2020

Abstract

:
Bread wheat can be used to make different products thanks to the presence of gluten, a protein network that confers unique visco-elastic properties to wheat doughs. Gluten is composed by gliadins and glutenins. The glutenins can be further divided into high and low-molecular-weight glutenins (HMWGs and LMWGs, respectively) and are encoded by Glu-1 and Glu-3 loci. The variability of these genes is associated with differences in quality. Because of this, the identification of novel glutenin alleles is still an important target. In this study, 57 haplotypes or glutenin combinations were registered among a set of 158 Iranian landraces and five novel HMWGs alleles were identified. The landraces were also characterized for several quality traits, including gluten quality, which allowed to associate the different glutenin alleles with low or high quality. Other quality traits examined were iron, zinc, and phytate contents, which are intimately related with the nutritional quality. Important variation for these components was found as well as for the phytate:iron/zinc molar ratios (related to the potential bioavailability of these important micronutrients). The landraces identified in the present study (some of them combining high gluten quality with low phytate:zinc values) could be a useful resource for breeders who aim to improve the wheat end-use quality and especially the content of zinc and its relative bioavailability.

Graphical Abstract

1. Introduction

Among the wheat species, common or bread wheat (Triticum aestivum L. ssp. aestivum) is the most cultivated and economically important. Moreover, 94% of the total wheat cultivated area is dedicated to this crop. One of the main reasons behind bread wheat success is its versatility to produce diverse food products [1]. Because of this, wheat constitutes a staple food worldwide, providing ~20% of the total calories and proteins to human diets globally. Bread wheat can be used to make many different products due to the presence of gluten. A gluten network is formed after mixing wheat flour with water and confers the unique visco-elastic properties (elasticity and extensibility) of wheat doughs [2].
Gluten is composed to a large extent by two types of proteins: the monomeric gliadins (mainly responsible of gluten viscosity and extensibility) and the polymeric glutenins (more associated with gluten elasticity or strength). Based on their molecular weight, the glutenins can be further divided into high and low-molecular-weight glutenins (HMWGs and LMWGs, respectively). The HMWGs are encoded by genes located on the long arm of the group 1 chromosomes, at the Glu-A1, Glu-B1, and Glu-D1 loci. Each gene encodes x-type and y-type subunits. The LMWGs are encoded by a multi-genic family located on the short arm of the group 1 chromosomes, at the Glu-A3, Glu-B3, and Glu-D3 loci. Allelic variation at both the Glu-1 and Glu-3 loci has been shown to greatly affect several wheat quality traits (e.g., gluten strength and extensibility, or bread-making quality). Several glutenin alleles associated with specific dough or end-use quality characteristics have been identified (see [3] for a complete review about gluten). However, despite the amount of research done on the glutenins, several Glu-1 and Glu-3 alleles have not yet been characterized. For this reason, the identification of novel glutenin alleles and allelic combinations linked with superior quality is still an important target of several wheat quality research projects.
Apart from providing a large amount of carbohydrates and proteins, wheat is a good source of several compounds that are linked with healthy properties. Wheat bioactive compounds are largely located in the grain bran and germ and include micronutrients such as iron (Fe) and zinc (Zn). These microelements play a key role in human health and their optimal intake is necessary to ensure normal growth and physical and mental development [4]. However, their absorption in our digestive system is complex and conditioned by many factors which could either reduce or improve their bioavailability. Phytic acid constitutes one of the major factors limiting mineral absorption. This molecule is mainly located in the wheat bran and its presence has been associated with a significant reduction of the nutritional quality of the wheat grain [5]. For this reason, breeding for biofortified wheat requires a focus on enhanced grain Fe and Zn contents and a reduction of grain phytic acid content [6].
Wheat is a widely conserved crop with an estimated 856,168 genetic resources held by germplasm banks worldwide [7]. Among these genetic resources are the landraces, the local farmers’, or traditional varieties. The landraces are diverse for characteristics such as adaptation and hold huge genetic diversity potential. Modern varieties have supplanted wheat landraces in most areas. Germplasm Banks often maintain landraces as the breeders’ first line of defense when seeking enhanced variability for new traits [8]. The International Maize and Wheat Improvement Center (CIMMYT) Germplasm Bank holds approximately 50,200 wheat landraces accessions, 9066 accessions from Iran (IWA or Iranian Wheat Accession). These materials were amassed mainly in 1935 from country-wide collections from farmers’ fields and marketplaces covering 16 provinces by a University of Tehran (UT) professor. More than 11,000 seed samples (accessions) were sent by UT to UC Davis, where they were increased, characterized, and cataloged as the Iranian Wheat Collection accessions (IWA). CIMMYT and USDA genbanks hold currently a duplicate of the collection.
In our study, a set of 158 IWA bread wheat landraces was analyzed with the following objectives: (a) Discover novel HMWGs and LMWGs glutenins alleles; (b) Identify accessions with outstanding gluten quality and associate that with the glutenins composition; (c) Find accessions with high micronutrient (Fe and Zn) and low phytic acid contents that could be used in breeding programs focused on the improvement of wheat nutritional quality.

2. Materials and Methods
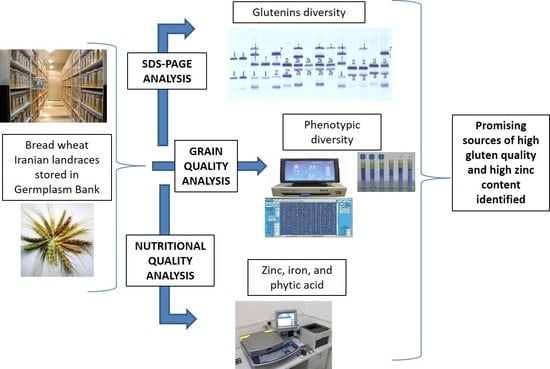
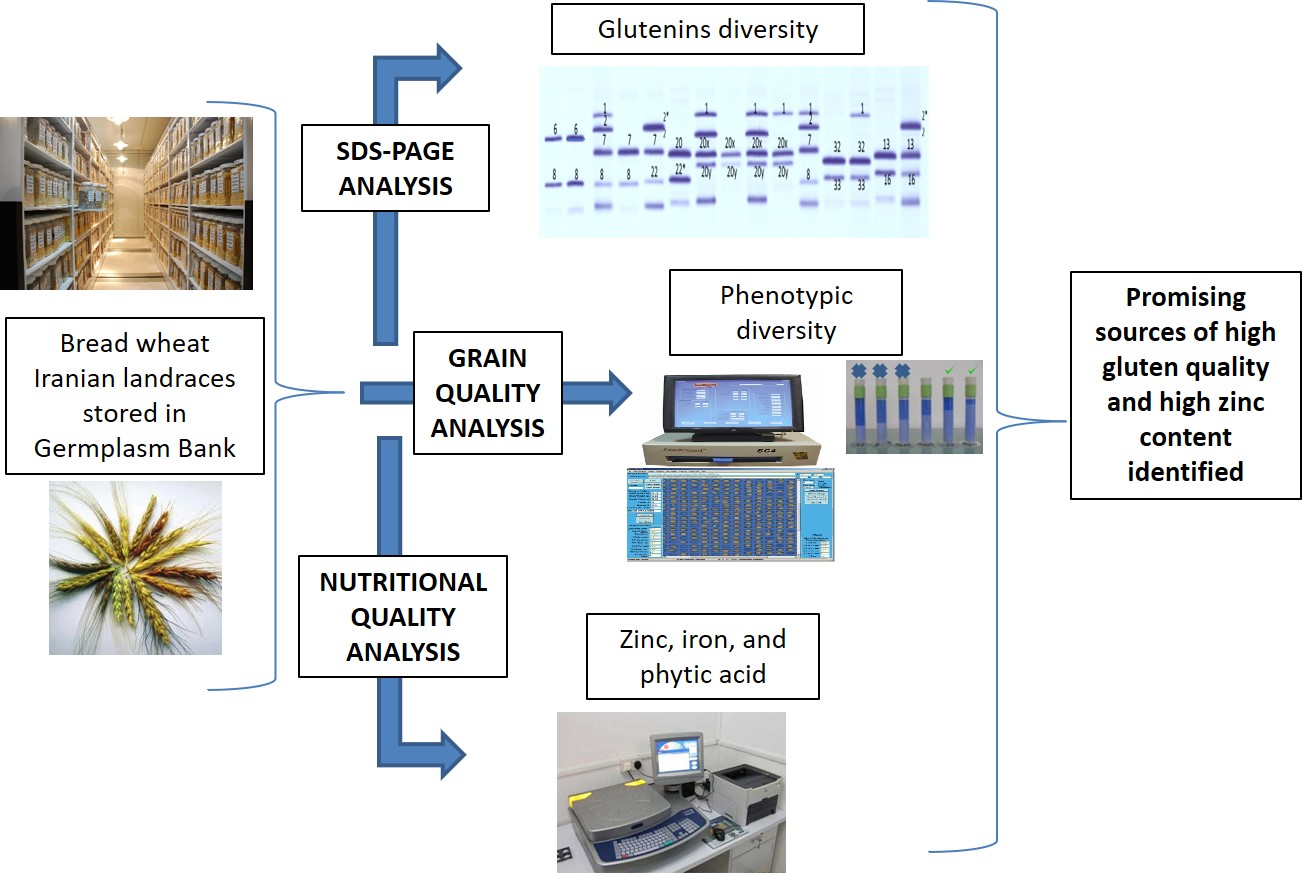
2.1. Plant Material

In this study, one hundred and fifty-eight Iranian common wheat landraces (Supplementary Table S1) were evaluated together with the cultivar Sokoll, which was used as local check. The landraces were provided by the Wheat Germplasm Bank of CIMMYT. Sokoll is one of the most popular wheat synthetic derivatives from CIMMYT, which is often used as parent in CIMMYT breeding program and as a check in field trials. The landraces were grown in Ciudad Obregón (27 20° N, 109 54° W, 38 m ASL), Sonora, Mexico, during the 2012–2013 cropping season. Of each accession, seeds of a single plant were used for the trial. All landraces were planted in 0.3 m2 plot size in an unreplicated trial in October 2012 and harvested in April/May 2013. Plots were managed following standard agronomic practices for the site, which includes irrigation that approximately whenever 50% of available soil moisture was depleted according to gravimetric scales (around 600 mm of water applied in total). The crop cycle was characterized by null precipitation and average temperatures of 31 °C and 32 °C during March and April, months when grain filling occurred. Grains from other wheat cultivars provided by several Germplasm Banks were used as standards for SDS-PAGE analysis: KU-1094 (Glu-A1 2.1*), TRI11553/92 (Glu-B1 14* + 15*) (An et al. 2005); CI-12213 (Glu-B1 32 + 33); ‘Pavon’ (Glu-A1 2*); ‘Wilbur’(Glu-B1 7 + 22); TA1659 (Glu-D1 3 + 10.2); TA1694 (Glu-D1 1.5 + 10.3). These cultivars carry glutenins alleles that have been described in previous studies that allowed us to identify properly the glutenins alleles found in this study.

2.2. Grain Quality Parameters

Briefly, 50 g samples of the grain harvested were used for the grain quality analysis. Grain size (Thousand kernel weight, TKW) (g) and test weight (TW) (kg/hL) were evaluated with an image analyzer (SeedCount SC5000, Next Instruments, Australia). Near-infrared spectroscopy (DA 7200 NIR, Perten Instruments, Sweden) was used to estimate grain protein content (GPC, 12.5% moisture basis). The calibration of the NIR curve was carried out with methods 46-12, 44-15A and 44-01 according to the AACC [9]. Grain samples were milled into whole meal flour using a Udy type mill with a 0.5 mm mesh. A whole-meal flour sample of 0.5 g was used to estimate overall gluten quality through the SDS-sedimentation test (SDSS) as described by Pena [10]. 1 g of flour was placed in a 25 mL plastic test tube. 6 mL of water were added to the tube and mixed with vortex. After 5 min, 19 mL of lactic acid solution (0.32% v/v) with SDS (2.9% w/v) were added to the test tube. The tubes were shaken for 2 min on a mechanical shaker oscillating horizontally. Finally, the tubes were allowed to stand for 14 min and measurement of the volume of sediment was done. To calculate the SDS-sedimentation index, the result of the SDS-sedimentation test was divided by GPC.

2.3. Glutenins Composition (SDS-PAGE)

Few grains of each accession were ground manually in order to extract the glutenins fraction and identify the glutenins subunits by SDS-PAGE analysis. Electrophoretic analysis (one dimensional SDS-PAGE) in polyacrylamide gels was performed according to the methodology of Hernandez-Espinosa et al. [11]. Whole meal flour (20 mg) was incubated with 0.75 mL of 50% propanol (v/v) for 30 min in a Thermomixer (Eppendorf, Germany) at 1400 rpm and 65 °C to extract the gliadins. The tubes were centrifuged 2 min at 10,000 rpm being the supernatant (gliadins fraction) discarded. The same process was repeated twice to remove any remaining gliadins. Then, 100 µL of a solution with DTT at 1.5% (w/v) formed with 50 µL of propanol at 50% (v/v) and 50 µL of Tris-HCl 0.08M pH 8.0, were added to the pellet. The tubes were mixed in a vortex and incubated for 30 min in a Thermomixer at 1400 rpm and 65 °C. Following this, the tubes were centrifuged 2 min at 10,000 rpm and 100 µL of a solution with vinylpyridine at 1.4% (v/v) formed with 50 µL of propanol at 50% (v/v) and 50 µL Tris-HCl 0.08M pH 8.0 was added to the supernatant, which contains the glutenins fraction. The tubes were mixed in a vortex and incubated for 15 min in a Thermomixer at 1400 rpm and 65 °C, before they were centrifuged for 2 min at 13,000 rpm. The supernatant containing the glutenins fraction was transferred to a new tube (pellet containing other grain proteins such as albumins or globulins was discarded). Then, 180 µL of a solution Tris-HCl M pH 6.8, 2% SDS (w/v), 40% glycerol (w/v), and 0.02% (w/v) bromophenol blue were added to the glutenins fraction. The tubes were mixed in a vortex and incubated for 5 min in a Thermomixer at 1400 rpm and 90 °C, and after they were centrifuged for 2 min at 13,000 rpm. Then, 6 µL of the supernatant containing the glutenins fractions were used to load the gels. The separating gel had a concentration of acrylamide of 15% and was prepared using 1 M Tris buffer with a pH 8.5. Gels were run at 12.5 mA per gel for 20 h. The gels were stained using coomasie blue. The glutenins subunits were named following the nomenclature systems developed by Jackson et al. [12] and Branlard et al. [13].

2.4. Nutritional Quality Parameters

An energy dispersive X-ray fluorescence spectrometry (EDXRF, Oxford Instruments, Abingdon, UK) instrument (bench-top, non-destructive) was used to determine iron (FeC, mg/kg) and zinc (ZnC, mg/kg) concentrations in grain. A Megazyme scaled-down protocol [14] was used to determine grain phytic acid concentration. The molar ratios of phytic acid:iron (Phy:Fe) and phytic acid:zinc (Phy:Zn) were calculated by converting the contents of phytic acid, Fe, and Zn into moles by dividing the concentrations by their respective molar mass and atomic weight: phytic acid 660.04 g mol−1, Fe 55.85 g mol−1, and Zinc 65.4 g mol−1.

3. Results

3.1. Grain Quality Parameters Variation

The range and average values for kernel characteristics, GPC, and SDSS are shown in Table 1. The values of all the accessions are showed in Supplementary Table S1. The grain morphology parameters (TW and TKW) varied greatly in this set of samples, with accessions showing medium-large properly filled grains with high TW and TKW values (i.e., accession 57 with TW of 80.2 kg/hL and TKW of 45.6 g), and others with deficient grain density and small size (i.e., accession 109 with TW of 69.1 kg/hL and TKW of 32.4 g). The average TW value was comparable with the TW value of the local check (cv. Sokoll) even though the check had in general larger grains than the landraces. In contrast, the average GPC values identified among the landraces were higher than the GPC content of the check. In terms of overall gluten quality, measured with the SDS-sedimentation test, the landraces exhibited a large variation, with accessions showing extremely high values associated with very good gluten quality (e.g., accession 145, 23.5 mL), and others with very low values associated with poor gluten quality (e.g., accession 1, 9.5 mL). In comparison, the local check shown a value associated with medium gluten quality (14.5 mL). As the SDS-sedimentation test is influenced by both GPC and the gluten intrinsic quality, the SDS-sedimentation index was calculated dividing the SDS-sedimentation by GPC of each accession, in order to normalize the data based on protein content and have a better idea of the intrinsic gluten quality of each accession. The observed SDS-sedimentation index variability was also large, and several accessions showed very high values (>1.50), which indicated very good gluten quality.

3.2. HMWGs and LMWGs Variability

All the Iranian landraces (158 accessions) were analyzed for their glutenin composition by SDS-PAGE (Table 2 and Supplementary Table S1). A total of 57 haplotypes or glutenin combinations were registered. Within the HMWGs group, three common alleles were detected at the Glu-A1 locus: a (subunit 1), b (subunit 2*) and c (null). A novel allele, which we have tentatively named Glu-A1bb following the order of the Wheat Gene Catalogue, was found in only one landrace (accession 83). This allele is characterized by a subunit (here identified with 2.1+), with lower mobility than the common subunit 2* and with higher mobility than the subunit 2.1* described by An et al. [15] in a Spanish spelt wheat landrace (Figure 1I).
At the Glu-B1 locus nine different alleles were detected including two novel alleles. One of the novel alleles was characterized by the presence of the subunit 14* and was associated here with Glu-B1cp (accessions 17–19), following the order of the Wheat Gene Catalogue and recent publications about the same topic [16,17]. The subunit 14* was first reported by An et al. [15] in a Russian spelt wheat landrace which exhibited the subunits 14* + 15* (allele Glu-B1bj) (Figure 1II). The other putatively novel allele was identified in the accession 104 and was characterized by the presence of the subunits 7 + 33. The subunit 33 is rare and has been described in only few landraces. This subunit is typically linked with the x-type subunit 32 (allele Glu-B1aq) [18] and exhibits a similar mobility to subunit 22 of the reference cultivar ‘Wilbur’(allele Glu-B1ch) which was described in Hernández-Espinosa et al. [11] (Figure 1III). According to the Wheat Gene Catalogue, this novel subunit combination (7 + 33) was identified here with the allele Glu-B1cq (accession 104). In addition to these two novel alleles, two rare alleles (Glu-B1bj and Glu-B1ch) were also identified in one and two of the analyzed landraces, respectively (accessions 40, 136 and 143).
In the case of Glu-D1, eight different alleles were found. Common alleles such as Glu-D1a (subunits 2 + 12) or Glu-D1d (subunits 5 + 10) were detected within this collection. Rare alleles such as Glu-D1b (subunits 3 + 12), Glu-D1l (subunit 12), Glu-D1v (subunits 2.1 + 10.1, accession 3) (Figure 1IV, which includes cultivars used as checks from [19]) and Glu-D1aj (subunits 1.5 + 12) were also detected in some accessions. Similar to the Glu-A1 and Glu-B1 loci, two novel Glu-D1 alleles were also found in two accessions. One of them exhibited an x-type subunit with higher mobility than the more common subunit 2. This putatively novel subunit was named 2+ and was found to be linked with the common y-type subunit 12. This novel combination was associated here with the allele Glu-D1bx. The other novel allele consisted of the x-type subunit 2+ and another novel y-type subunit here identified with 12+, which had slightly higher mobility than the normal subunit 12 (Figure 1V). The 2+ + 12+ subunits were identified as Glu-D1by. Similar to the HMWGs, wide variability was also identified at the LMWGs loci even though no novel alleles were detected. Specifically, at both the Glu-A3 and Glu-B3 loci were found seven different alleles. In contrast, lower variability was identified at the Glu-D3 locus for which were detected only three alleles (Table 2).

3.3. Effects of Glutenin Alleles on Gluten Quality

In Table 2 are shown the average values of GPC, SDSS and SDSI (traits related with gluten properties) for each allele identified in the Iranian landraces of the glutenin loci (Glu-A1, Glu-B1, Glu-D1, Glu-A3, Glu-B3, and Glu-D3). Some of the alleles identified were present in few landraces, making any attempt to associate gluten quality parameters and glutenin composition rather difficult to generalize. However, some general trends could be highlighted in this preliminary association study. If the SDSI average value of accessions carrying a specific allele was considerably higher than the average SDSI value, that specific allele was associated with higher quality (and vice versa). Within the HMWGs group, the Glu-A1 non-null alleles (1 and 2*) were associated to higher gluten quality than the null allele, and the subunit 1 was in this case associated with higher gluten quality than subunit 2*. For Glu-B1 the very high frequency of the dominant allele 7 + 8 (85.4%) made more difficult to associate the other alleles with high or low gluten quality. But it could be highlighted that the rare and novel alleles 7 + 22 and 14* were present in accessions with very high SDSI values. In the case of Glu-D1 it was the allele 2.1 + 10.1 the one associated with the highest SDSI values, followed closely by the allele 5 + 10. In contrast, the alleles 12 and 2+ + 12+ were associated with low gluten quality. Within the LMWGs groups, for the Glu-A3 locus it was difficult to associate any allele to high gluten quality as the allele with a significant number of representatives showed intermediate values (allele c, average SDSI of 1.16). The Glu-A3e allele, which showed also high frequency (26.5%) was linked to lower gluten quality (average SDSI of 1.06). For the Glu-B3 locus, only the allele j (SDSI 0.98) was not close to the average gluten quality (SDSI 1.15) indicating that it could be associated with low gluten quality. A similar case was found for Glu-D3 locus, in which the allele c was present in accessions that on average showed lower gluten quality.
In terms of glutenins combinations, it was not possible to associate them to phenotypic quality traits, as there were a large number of haplotypes (57) meaning that the number of accessions for each combination was very low. Anyway, it is interesting to mention that the top three accessions in terms of gluten quality had the following glutenins combination: Glu-A1 1, Glu-B1 7 + 9, Glu-D1 5 + 10, Glu-A3a, Glu-B3c, Glu-D3b (accession 158), Glu-A1null, Glu-B1 7 + 8, Glu-D1 2.1 + 10.1, Glu-A3g, Glu-B3c, Glu-D3a (accession 157), Glu-A1null, Glu-B1 14*, Glu-D1 2 + 12, Glu-A3c, Glu-B3d, Glu-D3a (accession 156).

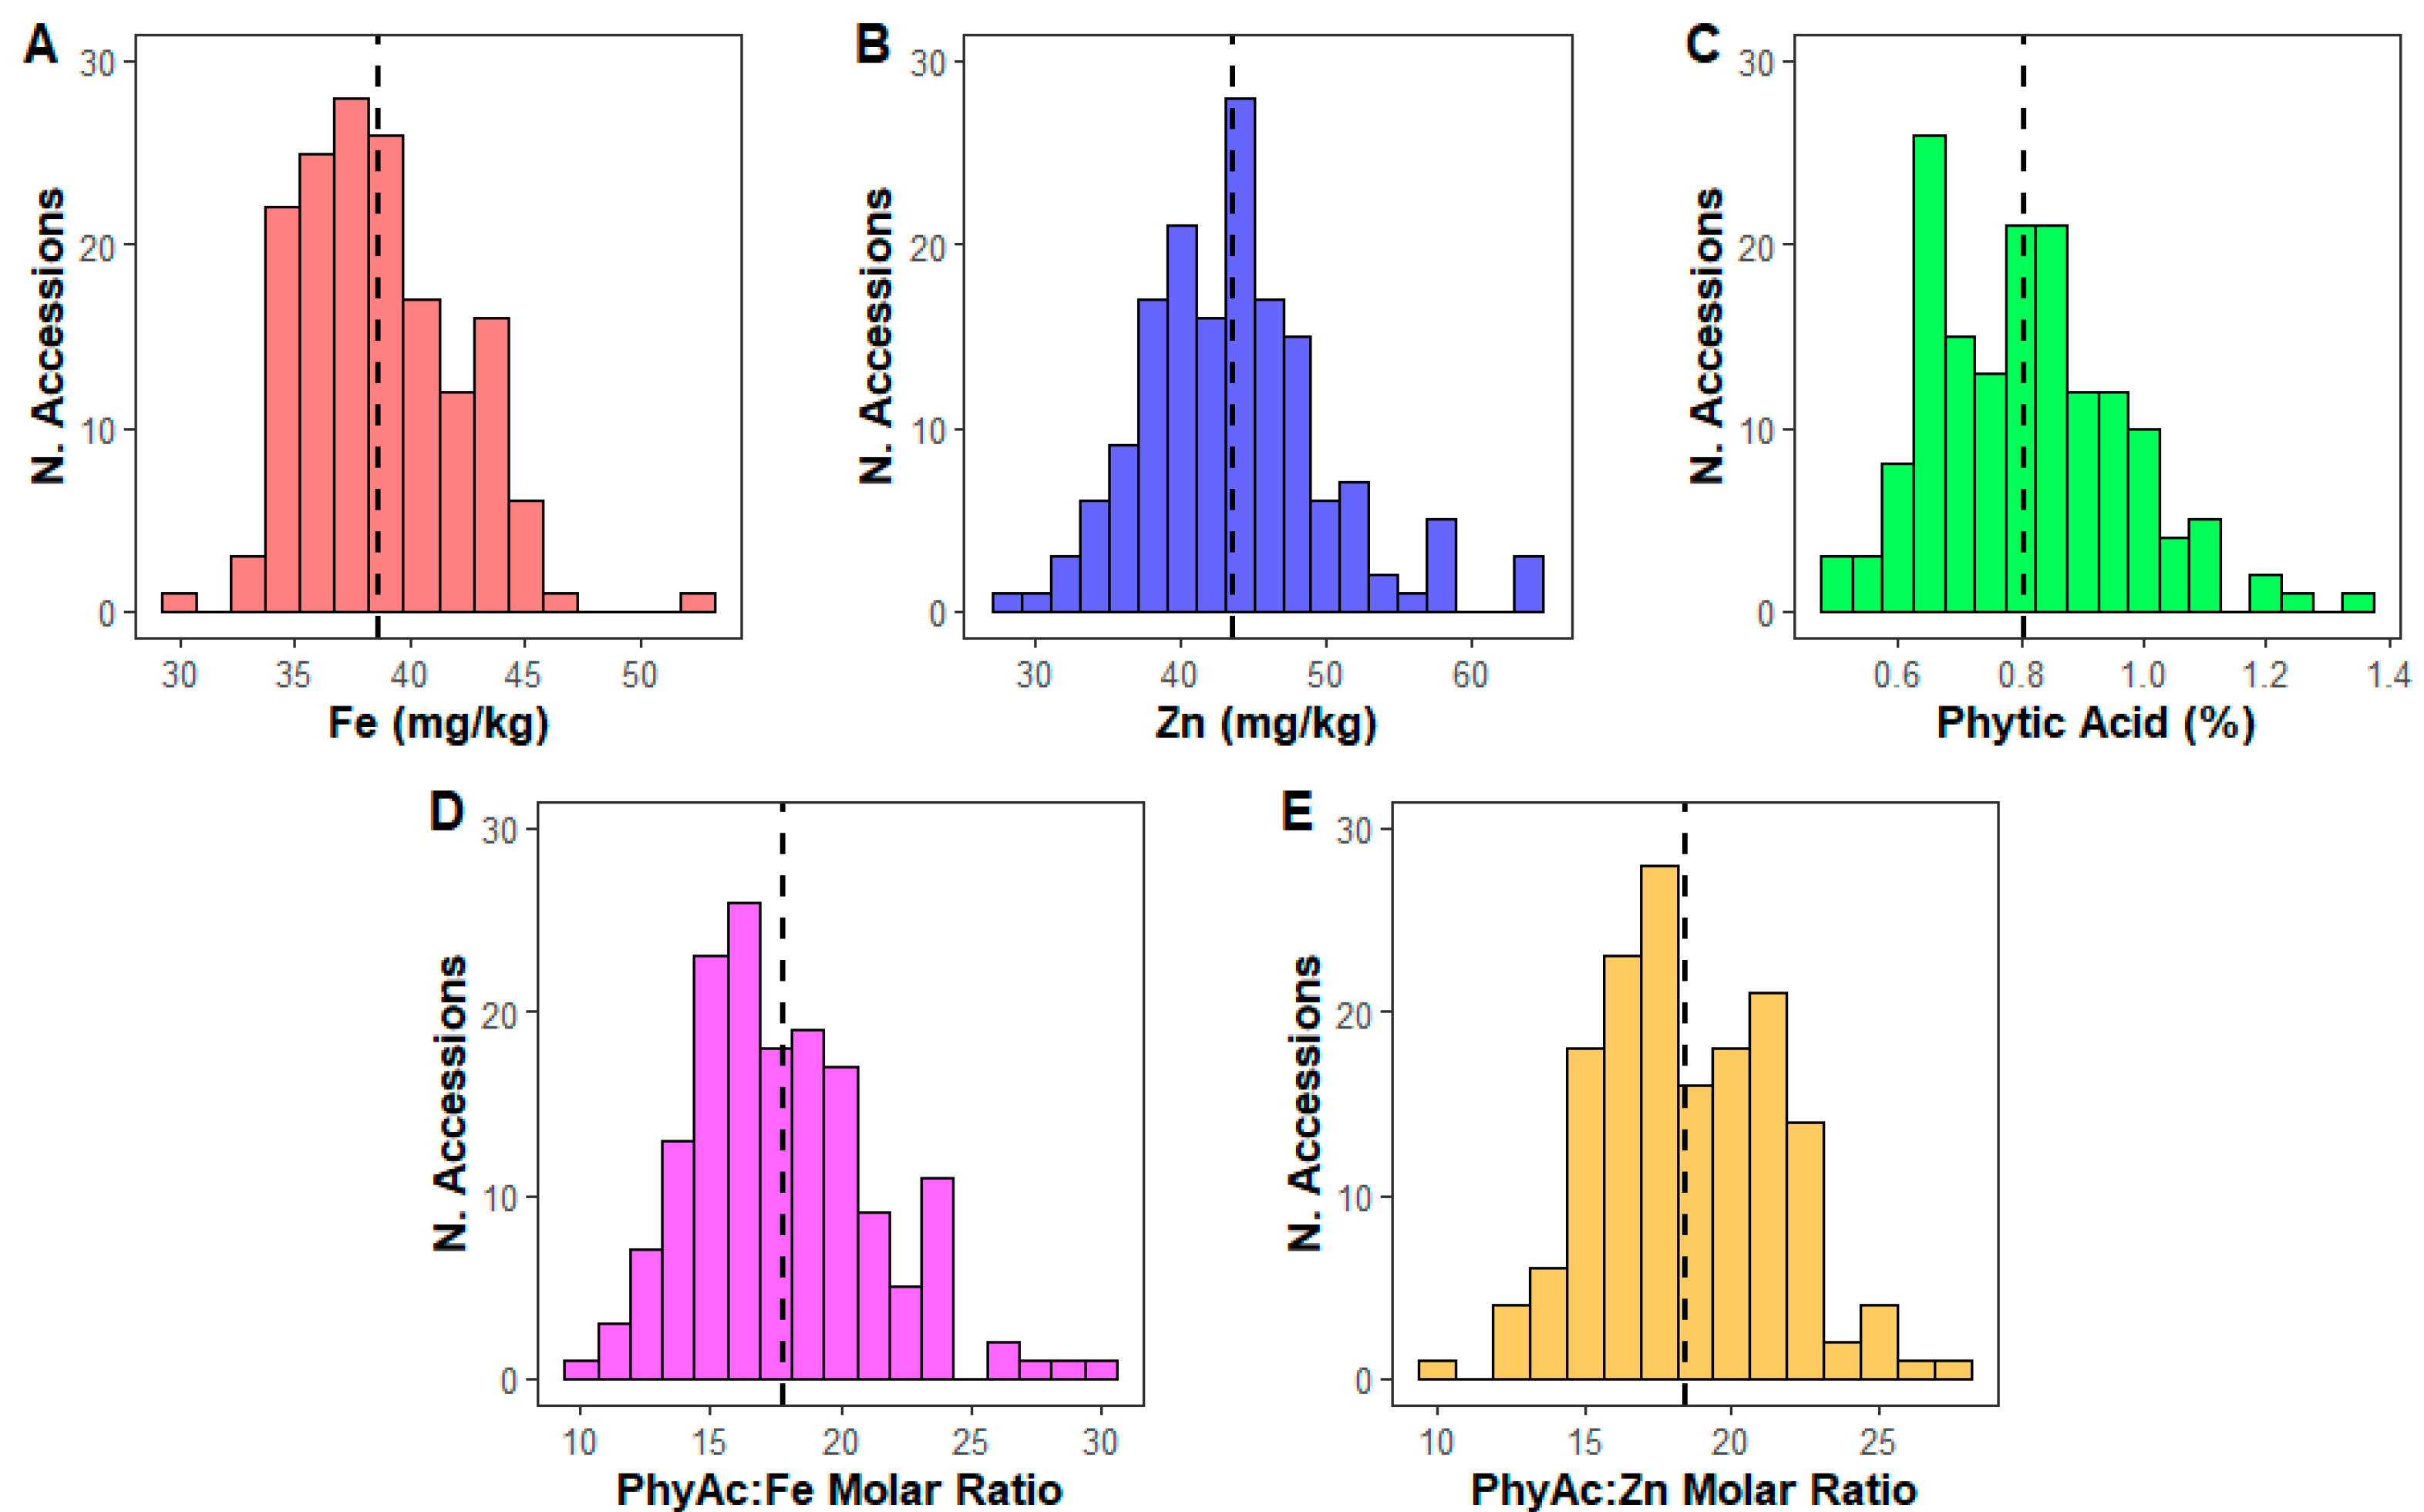
3.4. Micronutrients and Phytic Acid Content

Wide variability with two to three-fold variation was found within the set of Iranian landraces for grain Zn, Fe and phytic acid content (Table 1). As reported in Figure 2A–C, all these traits showed continuous variation and an approximated normal distribution. For Zn, and particularly for Fe, the number of accessions with very high grain concentration (>50 mg/kg) was less. For phytic acid, there was a high frequency of accessions showing low to medium-low concentration (<0.7 g/100 g), whereas the number of accessions with high phytic acid content was quite small. Phytic acid and Fe (Phy:Fe) and phytic acid and Zn (Phy:Zn) molar ratios were calculated. The reason to do this was to estimate the potential bioavailability of both micronutrients, which are chelated by phytic acid in human digestion system. A variation of almost two and three-fold was found for Zn and Fe, respectively (Table 1, Figure 2D–E). Around 30% of the landraces showed a moderate zinc bioavailability (Phy:Zn molar ratio < 16) whereas around 50% of the landraces showed a moderate iron bioavailability (Phy:Fe molar ratio < 17).
The landrace accession number 119 exhibited the highest Zn concentration (65.0 mg/kg) coupled with a medium-high concentration of phytic acid (1.1 g/100 g), which was translated in a relatively low (16.7) Phy:Zn molar ratio. On the other hand, the accession 25 showed the highest Fe grain value, 46.0 mg/kg, together with a Phy:Fe value of 15.8 (Supplementary Table S1). This accession 25 also exhibited a high Zn concentration (53.7 mg/kg), which makes it a good source for increasing both micronutrients.

3.5. Pearson Correlation among Quality Parameters

Pairwise comparison between all the traits was performed in order to identify their possible relationships (Table 3).
In general, grain morphological traits did not appear to be significantly associated with any of the other quality traits, with the exception of GPC which was negatively associated with TW (r = −0.39). When looking at GPC, interestingly no significant associations were identified between this trait and either SDSS or SDSI. In contrast, positive correlations between GPC and ZnC (r = 0.45) and PhyC (r = 0.46) were detected, suggesting that these components are likely accumulated in the grain through a similar mechanism. Gluten quality, as indicated by the SDSS and SDSI values, did not appear to be strongly associated by any of the analyzed traits. Among the nutritional quality traits, significant positive correlation was identified only between ZnC and PhyC (r = 0.57) and, as expected, between Phy:Zn or Phy:Fe and PhyC (r = 0.64 and 0.90, respectively).

4. Discussion

Common wheat has a vast number of genetic resources available. This is mainly determined by its historical use in almost all latitudes of the world that has resulted in the selection of thousands of landraces adapted to specific locations in terms of agronomical conditions and end-uses. However, deep knowledge of the genetic variation within a germplasm collection for the specific traits of interest is required to make efficient use of it [20]. In this regard, CIMMYT is aiming to characterize its Wheat Germplasm Bank (holds more than 100,000 accessions) in order to possibly use its unexploited variation for the genetic improvement of the breeding program [21]. An important part of the CIMMYT Germplasm Bank wheat collection is composed by landraces originated from Iran, one of the centers of diversity of common wheat. Iranian landraces showed great genetic diversity, which could be higher than in other materials [22]. Therefore, it is interesting to explore this material for their variation in grain quality traits related with both end-use and nutritional properties.
In this study 158 Iranian landraces were evaluated. Because of the high number of landraces and diverse traits analyzed in the study, the landraces were grown in an un-replicated trial in a single location. This study represents a first preliminary screening to detect outstanding genotypes that can be moved forward for a deeper characterization under several environments. In general, the variation of the grain morphological characteristics was wide, with several accessions that clearly did not grow under optimal conditions conducive for adequate grain filling, which is very common in old landraces. Moreover, the conditions in the location were this study was carried out (Ciudad Obregon, Mexico) are probably something different from the conditions in their locations of origin. Few accessions had large grains with TW values higher than the ones of the check cultivar used in the study. However, none of these landraces exceeded the TW values of the current varieties or new breeding lines grown in the area [23]. Nevertheless, this should not be viewed as a deterrent to use these landraces in breeding programs. Such genetic resources should in fact be used more as donors of unique traits which are not present in the modern germplasm pool, rather than yield-related traits such as test weight or grain size. As expected, the inferior grain morphological characteristics of these landraces was in general associated with higher grain protein content, as also reported in several previous studies [11,24]. The accession 44 was an interesting exception to this general rule as it showed larger grains (TKW 48.2 g) and higher protein content (17.8%) than the average, and test weight (76.8 kg/hL) very similar to the average. This accession may be a good resource for breeding programs focused on increasing protein content (related with both industrial and nutritional quality). It is important to mention that both grain morphology characteristics and protein content are traits highly influenced by the environment and GxE interactions. Because of this the data presented in this study for these traits should be taken as preliminary as no replication was used.
The variation found for the SDS-sedimentation value, a test that evaluates the overall gluten quality and which is highly correlated with bread-making quality [25], was also very wide. From the analysis of the results, most of the landraces did not appear to be useful for the gluten quality improvement since they exhibited quite low SDS-sedimentation values. However, there were several accessions with SDS sedimentation index values much higher than the ones of the check (SDS-sedimentation index 1.07), such as accessions 156, 157, and 158 (SDS-sedimentation index 1.58, 1.58 and 1.60, respectively), which could be used as source of genes to improve gluten quality. Although more studies will be done in future to confirm these results, it is important to mention the high effect of the genotype and the low effect of GxE interactions on this trait as showed in previous studies [23,26]. Variation of the glutenin subunits composition has long been associated with major changes in gluten strength and wheat end-use quality [3] and currently, most of the modern wheat varieties exhibit common HMWGs and LMWGs alleles which have been associated with specific wheat functionalities. Interestingly, the above-mentioned good quality accessions 156 and 157 exhibited a tentatively novel allele (Glu-B1cp or 14*) and a rare allele (Glu-D1v or 2.1 + 10.1), respectively, suggesting that these two uncommon alleles could possibly be used for the improvement of gluten quality in modern germplasm. Further studies are required to investigate to what extent these glutenin alleles contribute to the outstanding quality showed by those landraces. Moreover, the novel subunits identified in this study were tentatively assigned to the different glutenin loci based on their mobility in SDS-PAGE compared to known standards with known alleles. Deeper genetics studies are required to confirm if these novel subunits constitute actual new alleles. Other novel glutenin alleles were found at each HMW-GS locus (one for Glu-A1, one more for Glu-B1, and two for Glu-D1) as well as rare alleles not common in the modern wheat pool (i.e., Glu-B1 7 + 22 or ch that was also linked with high gluten quality, and Glu-D1 3 + 12). Many of these alleles have not been reported in previous studies among Iranian germplasm [27,28] and their association with wheat end-use quality has not been well defined emphasizing the importance of a continue screening of this type of materials for the identification of novel genetic variability.
In terms of nutritional quality, this collection of Iranian landraces showed interesting variation for Zn, Fe, and phytic acid content. These traits also showed previously strong genetic control [14,29]. In the case of zinc, the range of variation (30–65 mg/kg) was larger than the one found in other similar studies on landraces from Turkey [30] and Iran [31], but smaller than the variation reported for a group of Spanish landraces [32]. For grain Fe content, the variation was lower, although it was still possible to find accessions with outstanding values such as accession 66 (52.1 mg/kg). For both micronutrients there were several accessions with values higher than the local check. However, similarly to the protein content, these values were most likely determined by the “concentration” effect which is caused by the small grain size of the landraces. Nevertheless, some accessions had high micronutrient concentrations and good grain quality (accession 199: ZnC 65mg/kg; TKW 45.1 g; TW 77.1 kg/hL), suggesting that some of the analyzed landraces could effectively be used for the improvement of grain micronutrient accumulation. The CIMMYT biofortification breeding program has utilized diverse genetic resources including several Iranian landraces with high Zn and Fe. Interestingly the overall end-use quality features of biofortified wheat lines derived from diverse genetic resources did not alter much; in fact some of the biofortified wheat varieties quality has been enhanced by utilizing novel alleles from landraces [33]. Similarly to FeC and ZnC, wide phytic acid content variation was identified, which was comparable to the values reported in previous studies [34,35]. However, even though several lines with low phytic acid contents could be identified, in general, they were also associated with low grain Zn content. Among these landraces in fact, a high and positive correlation between these two components was identified, which clearly explicates the challenge in the selection of lines with both high grain micronutrient content and high micronutrient bioavailability. To further explore the estimated micronutrient bioavailability of the analyzed landraces, the molar ratio between phytic acid and the micronutrients (Zn and Fe) was calculated. According to IZiNCG [36], the Phy:Zn molar ratio values should be divided into three groups based on the zinc absorption level: <5 (high absorption), 5–15 (moderate absorption), and >15 (low absorption). According to this classification, 19 of the accessions analyzed in the present study showed moderate Zn bioavailability and could be used in breeding programs focused on the development of biofortified cultivars with improved Zn bioavailability. It is interesting to mention that three of those accessions (143, 152 and 155) also showed high gluten quality, which make them an interesting source to improve end-use and nutritional quality. Regarding Fe bioavailability, Hurrell & Egli [37] mentioned that the Phy:Fe molar ratios lower than 1 or preferably lower than 0.4 are required in order to have a proper Fe absorption. None of the accessions analyzed here exhibited the optimal Phy:Fe values, confirming the challenge of increasing iron intake by developing genetically biofortified wheat cultivars.

5. Conclusions

Common wheat landraces from Iran were evaluated for different grain morphological characteristics, grain protein contents, gluten quality, glutenin composition, zinc, iron, and phytic acid contents. Large variability was found for all the traits, and landraces with outstanding quality values were found, including some that combined high values of traits related with both end-use and nutritional quality. Furthermore, five novel HMWGs alleles were identified among the landraces. The effect of these alleles on gluten and end-use quality will need to be further investigated. Overall, several landraces characterized in the present study could be used in breeding programs in order to improve end-use and nutritional quality in general, and gluten quality, grain zinc concentration, and its relative bioavailability in particular.

Supplementary Materials

The following are available online at https://www.mdpi.com/2073-4395/10/11/1797/s1, Table S1: Grain quality characteristics of a set of Iranian bread wheat landraces.

Author Contributions

Conceptualization, C.G.; methodology, Z.M., N.H.-E., and F.C.; formal analysis, Z.M., A.B.H.-G., and F.C.; investigation, Z.M., A.B.H.-G., and C.G.; resources, T.P. and M.I.I.; data curation, C.G.; writing—original draft preparation, Z.M. and C.G.; writing—review and editing, Z.M., A.B.H.-G., M.R.A., T.P., V.G., and M.I.I.; supervision, C.G. All authors have read and agreed to the published version of the manuscript.

Funding

This research was supported by Bill and Melinda Gates Foundation grant number OPP1215722 and co-funded by Foreign and Commonwealth Office became the Foreign, Commonwealth & Development Office (FCDO) of the UK Government. Funding was also received by Seeds of Discovery, Sustainable Modernization of Traditional Agriculture Program (Mas-Agro) funded by Secretariat of Agriculture and Rural Development of Mexico (SADER), and CGIAR Research Program on WHEAT.

Acknowledgments

Carlos Guzmán gratefully acknowledges the European Social Fund and the Spanish State Research Agency (Ministry of Science, Innovation and Universities) for financial funding through the Ramon y Cajal Program (RYC-2017-21891).

Conflicts of Interest

The authors declare no conflict of interest.

References

  1. Peña-Bautista, R.J.; Hernandez-Espinosa, N.; Jones, J.M.; Guzmán, C.; Braun, H.J. CIMMYT Series on Carbohydrates, Wheat, Grains, and Health: Wheat-Based Foods: Their Global and Regional Importance in the Food Supply, Nutrition, and Health. Cereal Foods World 2017, 62, 231–249. [Google Scholar] [CrossRef]
  2. Shewry, P.R. Wheat. J. Exp. Bot. 2009, 60, 1537–1553. [Google Scholar] [CrossRef] [PubMed]
  3. Wrigley, C.; Batey, I.; Skylas, D.; Sharp, P. (Eds.) Gliadin and Glutenin: The Unique Balance of Wheat Quality; AACCI Press: St. Paul, MN, USA, 2006. [Google Scholar]
  4. Jurowski, K.; Szewczyk, B.; Nowak, G.; Piekoszewski, W. Biological consequences of zinc deficiency in the pathomechanisms of selected diseases. J. Biol. Inorg. Chem. 2014, 19, 1069–1079. [Google Scholar] [CrossRef] [PubMed] [Green Version]
  5. Eagling, T.; Wawer, A.A.; Shewry, P.R.; Zhao, F.; Fairweather-tait, S.J. Iron bioavailability in two commercial cultivars of wheat: Comparison between wholegrain and white flour and the effects of nicotianamine and 2′-deoxymugineic acid on iron uptake into Caco-2 Cells. J. Agric. Food Chem. 2014, 62, 10320–10325. [Google Scholar] [CrossRef] [PubMed] [Green Version]
  6. Singh, R.P.; Velu, G. Zinc-biofortified wheat: Harnessing genetic diversity for improved nutritional quality. Sci. Br. Biofortification 2017, 1–4. [Google Scholar]
  7. FAO. The Second Report on the State of the World’s Animal Genetic Resources for Food and Agriculture; Scherf, B.D., Pilling, D., Eds.; FAO Commission on Genetic Resources for Food and Agriculture Assessments: Rome, Italy, 2015; ISBN 9789251065341. [Google Scholar]
  8. Alvarez, J.B.; Guzmán, C. Interspecific and intergeneric hybridization as a source of variation for wheat grain quality improvement. Theor. Appl. Genet. 2018, 131, 225–251. [Google Scholar] [CrossRef]
  9. AACC. Approved Methods of the American Association of Cereal Chemists, 10th ed.; AACC: St. Paul, MN, USA, 2000. [Google Scholar]
  10. Pena, R.J.; Amaya, A.; Rajaram, S.; Mujeeb-Kazi, A. Variation in quality characteristics associated with some spring 1B/1R translocation wheats. J. Cereal Sci. 1990, 12, 105–112. [Google Scholar] [CrossRef]
  11. Hernández-Espinosa, N.; Payne, T.; Huerta-Espino, J.; Cervantes, F.; Gonzalez-Santoyo, H.; Ammar, K.; Guzmán, C. Preliminary characterization for grain quality traits and high and low molecular weight glutenins subunits composition of durum wheat landraces from Iran and Mexico. J. Cereal Sci. 2019, 88, 47–56. [Google Scholar] [CrossRef]
  12. Jackson, E.A.; Morel, M.H.; Sontag-Strohm, T.; Branlard, G.; Metakovsky, E.V.; Redaelli, R. Proposal for combining the classification systems of alleles of Gli-1 and Glu-3 loci in bread wheat (Triticum aestivum L.). J. Genet. Breed. 1996, 50, 321–336. [Google Scholar]
  13. Branlard, G.; Dardevet, M.; Amiour, N.; Igrejas, G. Allelic diversity of HMW and LMW glutenin subunits and omega-gliadins in French bread wheat (Triticum aestivum L.). Genet. Resour. Crop. Evol. 2003, 50, 669–679. [Google Scholar] [CrossRef]
  14. Magallanes-López, A.M.; Hernandez-Espinosa, N.; Velu, G.; Posadas-Romano, G.; Ordoñez-Villegas, V.M.G.; Crossa, J.; Ammar, K.; Guzmán, C. Variability in iron, zinc and phytic acid content in a worldwide collection of commercial durum wheat cultivars and the effect of reduced irrigation on these traits. Food Chem. 2017, 237, 499–505. [Google Scholar] [CrossRef] [PubMed]
  15. An, X.; Li, Q.; Yan, Y.; Xiao, Y.; Hsam, S.L.K.; Zeller, F.J. Genetic diversity of European spelt wheat (Triticum aestivum ssp. spelta L. em. Thell.) revealed by glutenin subunit variations at the Glu-1 and Glu-3 loci. Euphytica 2005, 146, 193–201. [Google Scholar] [CrossRef]
  16. Alvarez, J.B.; Guzmán, C. Recovery of wheat heritage for traditional food: Genetic variation for high molecular weight glutenin subunits in neglected/underutilized wheat. Agronomy 2019, 9, 755. [Google Scholar] [CrossRef] [Green Version]
  17. Chegdali, Y.; Ouabbou, H.; Essamadi, A.; Cervantes, F.; Ibba, M.I.; Guzmán, C. Assessment of the Glutenin Subunits Diversity in a Durum Wheat (T. turgidum ssp. durum) Collection from Morocco. Agronomy 2020, 10, 957. [Google Scholar] [CrossRef]
  18. Cherdouh, A.; Khelifi, D.; Carrillo, J.M.; Nieto-Taladriz, M.T. The high and low molecular weight glutenin subunit polymorphism of Algerian durum wheat landraces and old cultivars. Plant. Breed. 2005, 124, 338–342. [Google Scholar] [CrossRef]
  19. Xu, S.S.; Khan, K.; Klindworth, D.L.; Nygard, G. Evaluation and characterization of high-molecular weight 1D glutenin subunits from Aegilops tauschii in synthetic hexaploid wheats. J. Cereal Sci. 2010, 52, 333–336. [Google Scholar] [CrossRef]
  20. Sorrells, M.E.; Barbosa, J.; Nachit, M.M.; Ketata, H.; Autrique, E. Relationships among 81 Durum Genotypes Based RFLPs, Gliadins, Parentage, and Quality Traits; Options Méditerranéennes: Zaragoza, Spain, 1995. [Google Scholar]
  21. Vikram, P.; Franco, J.; Burgueño-Ferreira, J.; Li, H.; Sehgal, D.; Saint Pierre, C.; Ortiz, C.; Sneller, C.; Tattaris, M.; Guzman, C.; et al. Unlocking the genetic diversity of Creole wheats. Sci. Rep. 2016, 6, 23092. [Google Scholar] [CrossRef]
  22. Alipour, H.; Bihamta, M.R.; Mohammadi, V.; Peyghambari, S.A.; Bai, G.; Zhang, G. Genotyping-by-sequencing (GBS) revealed molecular genetic diversity of Iranian wheat landraces and cultivars. Front. Plant. Sci. 2017, 8, 1293. [Google Scholar] [CrossRef]
  23. Hernández-Espinosa, N.; Mondal, S.; Autrique, E.; Gonzalez-Santoyo, H.; Crossa, J.; Huerta-Espino, J.; Singh, R.P.; Guzmán, C. Milling, processing and end-use quality traits of CIMMYT spring bread wheat germplasm under drought and heat stress. Field Crop. Res. 2018, 215, 104–112. [Google Scholar] [CrossRef]
  24. Magallanes-López, A.M.; Ammar, K.; Morales-Dorantes, A.; González-Santoyo, H.; Crossa, J.; Guzmán, C. Grain quality traits of commercial durum wheat varieties and their relationships with drought stress and glutenins composition. J. Cereal Sci. 2017, 75, 1–9. [Google Scholar] [CrossRef]
  25. Guzmán, C.; Mondal, S.; Govindan, V.; Autrique, J.E.; Posadas-Romano, G.; Cervantes, F.; Crossa, J.; Vargas, M.; Singh, R.P.; Peña, R.J. Use of rapid tests to predict quality traits of CIMMYT bread wheat genotypes grown under different environments. LWT Food Sci. Technol. 2016, 69, 327–333. [Google Scholar] [CrossRef]
  26. Guzmán, C.; Autrique, J.E.; Mondal, S.; Singh, R.P.; Govindan, V.; Morales-Dorantes, A.; Posadas-Romano, G.; Crossa, J.; Ammar, K.; Peña, R.J. Response to drought and heat stress on wheat quality, with special emphasis on bread-making quality, in durum wheat. Field Crop. Res. 2016, 186, 157–165. [Google Scholar] [CrossRef]
  27. Bahraei, S.; Saidi, A.; Alizadeh, D. High molecular weight glutenin subunits of current bread wheats grown in Iran. Euphytica 2004, 137, 173–179. [Google Scholar] [CrossRef]
  28. Chaparzadeh, N.; Sofalian, O.; Javanmard, A.; Hejazi, M.S.; Zarandi, L. Study of glutenin subunits in some wheat landraces from northwest of Iran by SDS-PAGE technique. Int. J. Agric. Biol. 2008, 10, 101–104. [Google Scholar]
  29. Velu, G.; Guzman, C.; Mondal, S.; Autrique, J.E.; Huerta, J.; Singh, R.P. Effect of drought and elevated temperature on grain zinc and iron concentrations in CIMMYT spring wheat. J. Cereal Sci. 2016, 69, 182–186. [Google Scholar] [CrossRef]
  30. Kokten, K.; Akcura, M. Mineral concentrations of grain of bread wheat landraces originated from eastern Anatolia of Turkey. Prog. Nutr. 2018, 20, 119–126. [Google Scholar] [CrossRef]
  31. Heidari, B.; Padash, S.; Dadkhodaie, A. Variations in micronutrients, bread quality and agronomic traits of wheat landrace varieties and commercial cultivars. Aust. J. Crop. Sci. 2016, 10, 377–384. [Google Scholar] [CrossRef]
  32. Vázquez, J.F.; Chacón, E.A.; Carrillo, J.M.; Benavente, E. Grain mineral density of bread and durum wheat landraces from geochemically diverse native soils. Crop. Pasture Sci. 2018, 69, 335–346. [Google Scholar] [CrossRef]
  33. Guzman, C.; Medina-Larque, A.S.; Velu, G.; Gonzalez-Santoyo, H.; Singh, R.P.; Huerta-Espino, J.; Ortiz-Monasterio, I.; Pena, R.J. Use of wheat genetic resources to develop biofortified wheat with enhanced grain zinc and iron concentrations and desirable processing quality. J. Cereal Sci. 2014, 60, 617–622. [Google Scholar] [CrossRef]
  34. Gupta, R.K.; Gangoliya, S.S.; Singh, N.K. Screening and characterization of wheat germplasms for phytic acid and iron content. J. Agric. Sci. Technol. 2015, 17, 747–756. [Google Scholar]
  35. Hussain, S.; Maqsood, M.; Miller, L. Bioavailable zinc in grains of bread wheat varieties of Pakistan. Cereal Res. Commun. 2012, 40, 62–73. [Google Scholar] [CrossRef]
  36. IZiNCG. Assessment of the Risk of Zinc Deficiency in Populations and Options for Its Control; United Nations University Press: Tokyo, Japan, 2004; ISSN 0379-5721. [Google Scholar]
  37. Hurrell, R.; Egli, I. Iron bioavailability and dietary reference values. Am. J. Clin. Nutr. 2010, 91, 1461S–1467S. [Google Scholar] [CrossRef] [PubMed]
Figure 1. Representative variability for HMWGs found in Iranian bread wheat landraces. Lanes are as follow. I: A, KU-1094 (Glu-A1 2.1*); B, accession 83 (Glu-A1 2.1+); C, ‘Pavon’ (Glu-A1 2*). II: A, accession 153 (Glu-B1 14*); B, TRI11553/92 (Glu-B1 14* + 15*); C, accession 154 (Glu-B1 14*). III: A, ‘Wilbur’ (Glu-B1 7 + 22); B, accession 104 (Glu-B1 7 + 33); C, CI-12213 (Glu-B1 32 + 33). IV: A, accession 3 (Glu-D1 2.1 + 10.1); B, TA1659 (Glu-D1 3 + 10.2); C, TA1694 (Glu-D1 1.5 + 10.3). V: A, ‘Opata’ (Glu-D1 2 + 12); B, accession 32 (Glu-D1 2+ + 12+); C, accession 82 (Glu-D1 2+ + 12); D, ‘Pavon’ (Glu-D1 5 + 10).
Agronomy 10 01797 g001
Figure 2. Number of accessions in each range of concentration of iron (A), zinc (B), phytic acid (C), phytic acid:zinc molar ratio (D), and phytic acid:iron molar ratio (E). Dotted lines indicate the average value for each of the traits.
Agronomy 10 01797 g002
Table 1. Means and ranges for industrial quality parameters determined in 158 landraces from Iran.
Iranian LandracesLocal Check (cv. Sokoll)
MeanRangeValues
Test weight (kg/hL)76.167.1–81.576.4
Thousand kernel weight (g)44.732.4–58.349.4
Grain protein (%)15.713.4–18.913.5
SDS Sedimentation (mL)17.99.5–23.514.5
SDS Sedimentation index1.140.61–1.601.07
Grain zinc (mg/kg)43.627.9–65.037.9
Grain iron (mg/kg)38.630.2–52.133.9
Grain phytic acid (g/100 g)0.8080.491–1.3420.766
Phytic acid:zinc molar ratio18.410.4–27.120.0
Phytic acid:iron molar ratio17.89.8–29.819.1
Table 2. Allelic/banding pattern and their frequency for HMW and LMW glutenin subunits identified in landraces from Iran and corresponding means of grain quality parameters.
GluteninLocusAlleleN. of Accessions% of AccessionsGPRO (%)SDSS (mL)SDSI
HMWGsGlu-A11 (a)42.515.020.41.37
2* (b)6541.116.018.61.17
null (c)8855.715.617.31.11
2.1+ (bb)10.616.919.51.15
Glu-B17 + 8 (b)13585.415.817.51.11
7 + 9 (c)63.715.818.71.18
6 + 8 (d)21.217.823.01.29
20 + 20 (e)10.614.514.51.00
17 + 18(i)74.414.920.51.38
14* + 15* (bj)10.616.015.00.94
7 + 22 (ch)21.215.322.51.48
14* (cp)31.814.522.71.57
7 + 33 (cq)10.616.621.01.27
Glu-D12 + 12 (a)12981.615.717.61.12
3 + 12 (b)106.316.720.51.23
5 + 10 (d)31.815.619.71.27
12 (l)10.615.411.00.71
2.1 + 10.1 (v)85.014.719.31.31
2+ + 12 (bx)10.615.618.01.15
2+ + 12+ (by)10.617.315.50.90
LMWGsGlu-A3a10.614.423.01.60
b63.815.721.81.40
c9560.115.718.21.16
d10.616.321.01.29
e4226.516.217.21.06
f85.014.913.90.93
g53.114.419.61.36
Glu-B3b2113.215.816.91.07
b’85.015.818.41.16
c5232.915.817.71.13
d1610.115.218.21.21
g4327.215.918.61.17
i148.815.618.51.19
j42.516.315.90.98
Glu-D3a9862.015.717.61.13
b4427.816.119.81.23
c1610.115.315.00.98
Total average 15.717.91.14
GPRO, grain protein content; SDSS, SDS sedimentation volume; SDSI, SDS sedimentation index (SDSS/GPRO).
Table 3. Pearson correlation coefficients (r) among different kernel characteristics and its bioactive components for bread wheat landraces.
TWTKWGPCSDSSSDSIZnCFeCPhyCPhy:Zn
TKW−0.10
GPC−0.39−0.21
SDSS0.28−0.330.10
SDSI0.38−0.27−0.200.95
ZnC−0.170.070.45−0.08−0.22
FeC0.200.050.200.170.100.37
PhyC−0.190.090.46−0.13−0.270.570.13
Phy:Zn−0.080.050.11−0.10−0.13−0.25−0.190.64
Phy:Fe−0.280.070.35−0.22−0.310.39−0.310.900.70
TW: Test weight; TKW: Thousand kernel weight; GPC: Grain protein content; SDSS: SDS Sedimentation volume; SDSI: SDSS index; ZnC: Zinc Content; FeC: Iron Content; PhyC: phytic acid content; Phy:Zn: phytic acid:zinc molar ratio; Phy:Fe: phytic acid:iron molar ratio. Numbers in bold are significant at 5% level.
Publisher’s Note: MDPI stays neutral with regard to jurisdictional claims in published maps and institutional affiliations.

