Article

Adaptive Multi-Paddock Grazing Lowers Soil Greenhouse Gas Emission Potential by Altering Extracellular Enzyme Activity

1
Department of Renewable Resources, University of Alberta, Edmonton, AB T6G 2E3, Canada
2
Department of Agricultural, Food and Nutritional Science, University of Alberta, Edmonton, AB T6G 2P5, Canada
3
Department of Biological Sciences, University of Alberta, Edmonton, AB T6G 2R3, Canada
*
Author to whom correspondence should be addressed.
Current address: Agriculture and Agri-Food Canada, Beaverlodge Research Farm, Beaverlodge, AB T0H 0C0, Canada.
Agronomy 2020, 10(11), 1781; https://doi.org/10.3390/agronomy10111781
Submission received: 18 September 2020 / Revised: 9 November 2020 / Accepted: 10 November 2020 / Published: 13 November 2020

Abstract

:
Adaptive multi-paddock (AMP) grazing is a form of rotational grazing in which small paddocks are grazed with high densities of livestock for short periods, with long recovery periods prior to regrazing. We compared the fluxes of greenhouse gases (GHGs), including carbon dioxide (CO2), methane (CH4), and nitrous oxide (N2O), from soils of AMP-grazed grasslands to paired neighboring non-AMP-grazed grasslands across a climatic gradient in Alberta, Canada. We further tested GHG responses to changes in temperature (5 °C vs. 25 °C) and moisture levels (permanent wilting point (PWP), 40% of field capacity (0.4FC), or field capacity (FC)) in a 102-day laboratory incubation experiment. Extracellular enzyme activities (EEA), microbial biomass C (MBC) and N (MBN), and available-N were also measured on days 1, 13, and 102 of the incubation to evaluate biological associations with GHGs. The 102-day cumulative fluxes of CO2, N2O, and CH4 were affected by both temperature and moisture content (p < 0.001). While cumulative fluxes of N2O were independent of the grazing system, CH4 uptake was 1.5 times greater in soils from AMP-grazed than non-AMP-grazed grasslands (p < 0.001). There was an interaction of the grazing system by temperature (p < 0.05) on CO2 flux, with AMP soils emitting 17% more CO2 than non-AMP soils at 5 °C, but 18% less at 25 °C. The temperature sensitivity (Q10) of CO2 fluxes increased with soil moisture level (i.e., PWP < 0.4FC ≤ FC). Structural equation modelling indicated that the grazing system had no direct effect on CO2 or N2O fluxes, but had an effect on CH4 fluxes on days 1 and 13, indicating that CH4 uptake increased in association with AMP grazing. Increasing soil moisture level increased fluxes of GHGs—directly and indirectly—by influencing EEAs. Irrespective of the grazing system, the MBC was an indirect driver of CO2 emissions and CH4 uptake through its effects on soil EEAs. The relationships of N-acetyl-β glucosaminidase and β-glucosidase to N2O fluxes were subtle on day 1, and independent thereafter. AMP grazing indirectly affected N2O fluxes by influencing N-acetyl-β glucosaminidase on day 13. We conclude that AMP grazing has the potential to mitigate the impact of a warmer soil on GHG emissions by consuming more CH4 compared to non-AMP grazing in northern temperate grasslands, presumably by altering biogeochemical properties and processes.

1. Introduction

Grasslands cover more than 30% of terrestrial land globally and generate important ecological services, including enhancing food security by providing forage for more than 1.8 billion livestock and holding 33% of the terrestrial carbon (C) stock [1]. However, grasslands can affect global climate change by being a sink or source of greenhouse gases (GHGs), including carbon dioxide (CO2), methane (CH4), and nitrous oxide (N2O), depending on several drivers, including their responses to management [2,3]. The identification of grazing management practices that achieve GHG reductions within grasslands [4,5] would have direct social and policy implications for land use and management [6]. Although GHG emissions from grasslands are responsive to grazing [7,8,9], grasslands vary in their response, depending on which specific grazing practices are used [9]. Moreover, under future climate change scenarios, increased temperature and altered soil moisture may interact with grazing to affect GHG dynamics, because fluxes of GHG vary with temperature and moisture level [10,11,12] depending on the defoliation level [7].
Adaptive multi-paddock (AMP) grazing is a form of rotational grazing in which grasslands are sub-divided into many small paddocks and high densities of animals graze for short periods within each paddock, with long rest periods between successive grazing events to facilitate vegetation recovery [13,14]. The AMP grazing system has been reported to improve physical, chemical, and biological soil properties compared with areas subject to continuous grazing [15], in which cattle graze throughout the growing season in the same area. In particular, vegetation recovery is suggested to be more rapid in AMP-grazed areas due to enhanced control over the extent of defoliation and more uniform impact of animals on grassland soils, including the physical impact on soils through concentrated animal activity (“herd effect”) [16] and distribution of excreta [13]. Ultimately, these practices have been suggested as a means to increase the fixation of atmospheric C into plant biomass, and bolster soil organic C (SOC) [13] and macro-nutrients [17], improve soil function and health, and mitigate climate change through increased C storage [18,19]. There are multiple ways AMP grazing may alter vegetation and soils leading to altered C cycling. High stocking densities can increase soil compaction [20], affecting bulk density, penetration resistance, and water infiltration [21] slowing decomposition processes [22]. Trampling can increase fine litter, which is typically a source of more recalcitrant C, incorporation into soils [19], and can subsequently alter microbial abundance and composition [23]. Furthermore, AMP grazing may alter the chemical composition of vegetation by favoring grazing-tolerant plants that tend to have more recalcitrant carbon [24] or, in contrast, by encouraging plant regrowth, which tends to be less recalcitrant [15]. However, the benefits of AMP grazing in boosting productivity, maintaining grassland function, and enhancing C sequestration remain unclear and are sources of debate [25,26]. An understanding is therefore needed of the mechanisms regulating C and N cycling under AMP grazing compared to non-AMP systems and to parse out the role of AMP grazing on GHG emissions. Measurements of GHGs in the field are influenced simultaneously by variation in environment and management regimes. Thus, controlled incubation studies are one approach to specifically test the grazing legacy effects of soil microbes in altering pathways of nutrient cycling in soils [27], and thereby to formulate grazing management strategies to mitigate atmospheric GHGs [9].
Soil extracellular enzyme activity (EEA) regulates soil organic matter (SOM) decomposition and nutrient cycling [28], thereby influencing GHG fluxes from the soil. Plants and microbes release enzymes during the decomposition process of SOM, catalyzing the decomposition of target molecules [29]. As different enzymes can be responsible for decomposing a single biopolymer in SOM, several enzymes need to be measured simultaneously to fully understand the role of EEAs in the cycling of C and nutrients such as nitrogen (N). Soil EEAs can change in response to biotic (e.g., vegetation, faunal influences) and abiotic conditions of soils (e.g., temperature and moisture) that affect soil physical and chemical properties [30,31]. Thus, measurement of EEAs in grassland soil under different microclimatic conditions is necessary to help understand the role of the grazing-induced environment in affecting GHG fluxes from the soil. While effects of temperature and moisture on GHG emissions have been widely studied in both the field [7,32] and in laboratory conditions [33,34], none have examined the specific influence of AMP grazing and the role of associated EEAs in regulating GHG fluxes.
The goal of this study was to determine whether AMP grazing alters potential GHG fluxes from grassland soils relative to neighboring conventional grazing practices (hereafter “non-AMP”), and to test whether the grazing system has altered the sensitivity of GHG fluxes to changes in soil temperature and moisture. We conducted a laboratory incubation experiment to test the a priori influence of grazing system on GHG emissions and associated microbial activity. An additional objective was to explore the effects of grazing regime, temperature, and moisture conditions on microbes and EEAs, and resultant GHG fluxes in grassland soils.

2. Materials and Methods

2.1. Study Sites and Soil Collection

Grasslands under AMP grazing were initially identified by a voluntary selection process from a pool of attendees at a series of rancher workshops held across Alberta and more widely advertised using local producer groups. Prospective candidates responded to a series of questions concerning their grazing management activities using an online self-registration system. To qualify as an AMP ranch, ranches had to meet criteria regarding the number of paddocks used per herd (>10), the minimum size of the ranch (>65 ha), the frequency of cattle rotation, and the use of flexible adjustment of stocking density in response to climatic variation across the region. These conditions were subsequently verified via phone interviews and field visits. Additionally, we required that AMP ranches had used this system for at least 10 years, that no cultivation/seeding was done in the last 10 years, and that each AMP ranch had a neighboring ranch (within 10 km) with a similar cultivation history and ecosite conditions (landform and soil type) supporting cattle grazing. Moreover, AMP ranches were considered for study only if a portion of the grasslands therein were free of bale grazing and available for soil sampling to avoid confounding effects of additional C and nutrient inputs from hay.
Grasslands from a total of 11 pairs of ranches were selected across south-central Alberta, Canada, for this study. Each pair was comprised of AMP grasslands and their neighboring non-AMP grasslands, where the latter utilized conventional grazing management. The 11 pairs represented a broad agro-climatic (i.e., soil and vegetation) gradient across northern temperate grasslands of Alberta, Canada. Selected ranches were, in order of declining aridity, situated within the Mixed grass, Aspen parkland, Foothills fescue, and Boreal transition regions. Soils coinciding with these natural regions were Orthic Brown Chernozems (Mixed grass), Orthic Black to Eluviated Black Chernozems (Foothills and Parkland), and Dark Gray Chernozems to Gray Luvisols (Boreal). Soil organic matter content ranges from 2.5 to 3.4% in Brown, 3.5 to 5.5% in Gray, and 5.5 to 8.5% in Black Chernozem soils [35]. The 30-yr normal (1984–2014) mean annual precipitation (MAP) ranged from 332.3 to 533.3 mm, with mean annual temperatures (MAT) ranging from 2.0 to 4.1 °C. The annual heat moisture (AHM, [AHM = (MAT + 10)/(MAP/1000)]) index, an index of aridity and moisture limitations on ecosystem productivity [36,37], ranged from 24.3 in moist areas to 44.1 in arid areas. AHM is a useful climatic variable because it accounts for both changes in moisture and temperature [38].
Six sampling points were randomly selected within a representative grassland area of 10 ha on each of the 22 studied ranches. Two mineral soil cores (3.8 cm diameter, 15 cm deep) from each sampling location were collected in the last week of August 2017. After overlying litter and mulch were removed, six mineral soil samples from each ranch were combined, bagged, and placed in a cooler to transport to the University of Alberta, where they were stored at 4 °C until processed during the second week of November.

2.2. Soil Processing and Characterization

Soil moisture content was determined from 20 g sub-samples by weighing them fresh, drying at 105 °C for 27 h to a constant mass, and then reweighing. Bulk soil was air-dried and sieved through a 2 mm screen, with all coarse fragments removed, including rocks, roots, and litter. Sub-samples of air-dried soils were ground to 0.1 mm size with a ball mill (Retsch MM200 Mixer Mill, Thomas Scientific, Swedesboro, NJ, USA) and then analyzed for total C and N by dry combustion using an automated elemental analyzer (Elementar Analysensysteme GmbH, Langenselbold, Germany). Soil pH was measured with a 1:5 (w:v) mix of soil:water [39], bulk density was determined using the core method [40], and the texture was determined using the hydrometer method [41].

2.3. Soil Preparation, Incubation, Gas Sampling, and Analysis

Water holding capacity of sieved soils at different matric potentials was determined using the pressure-plate method [42]. Sub-samples of air-dried soils were first placed in O-rings on ceramic porous plates and saturated for 24 h. Saturated soils were then pressurized at 0.1, 0.5, 1.0, 5.0, and 15.0 bars for 72 h, after which the moisture content at each pressure level was quantified by drying at 105 °C for 27 h to a constant mass and reweighing. Water content at 15 bar was considered the permanent wilting point (PWP), while 0.1 bar was the field capacity (FC) of sandy soils [43] and 0.33 bar the FC of clayey soils [42]. Water content at 0.33 bar was estimated by linear extrapolation of water contents at 0.1, 0.5, and 1.0 bar. The moisture content of air-dried sieved soil was also determined following the oven-dry method (described above) to help maintain the desired soil moisture level throughout the subsequent incubation experiment.
For each grassland investigated, 100 g of oven-dry equivalent air-dried soil was placed in each of six 500 mL Mason jars for the incubation experiment. Sufficient water was added (with a dilute 0.005 M CaSO4 to protect micro-aggregates from disruption) to bring these soils to a moisture level of either FC, 40% FC, or PWP [44]. One set of Mason jars with soil from each moisture treatment was placed in an incubator at 5 °C, while the other set was placed in another incubator at 25 °C. The tops of all jars were covered with perforated aluminum foil for five consecutive days to stabilize microbial activity. On the fifth day (collection day 0), initial GHG samples were collected from the headspace air of the jars immediately after closing them using a lid equipped with a rubber septum. Soils were further incubated for 24 h with the lids closed, and then headspace samples were collected again to determine the change in GHG concentrations. Subsequent sampling of GHGs occurred on days 1, 2, 4, 7, 10, 13, 18, 23, 28, 35, 42, 52, 62, 72, 82, 92, and 102. The change in gas concentration between the 0 and 24 h headspace samples on each sampling day was used to calculate daily GHG flux per unit dry mass of soil. Soil moisture levels were maintained throughout the incubation period by tracking water loss by weighing the jars and replenishing the water at least 3 days prior to each gas sampling event. Headspace air samples were collected with an air-tight 20 mL syringe (Norm-Ject, Henke Sass Wolf, Tuttlingen, Germany) and injected into 12 mL pre-vacuumed soda glass Isomass Exetainers (Labco Limited, Lampeter, Wales, UK).
Greenhouse gas samples were analyzed with a Varian CP 3800 gas chromatograph (Varian Canada, Mississauga, Canada) containing three detectors. A thermal conductivity detector (TCD) and flame ionization detector (FID) simultaneously determined the concentration of CO2 and CH4, respectively [45], while the electron capture detector (ECD) determined the concentration of N2O [46]. Standard curves were generated using mixtures of gases at standard concentrations of CO2 (360 ppm), CH4 (1.6 ppm) and N2O (1.0 ppm) (Praxair, Mississauga, Ontario, Canada) and used to calculate the headspace concentrations of respective gases.

2.4. Measurements of Microbial Activities and Soil Parameters

A parallel set of soils at the same moisture level were prepared by placing 50 g of oven-dry equivalent air-dried soil in 200 mL conical flasks for measuring extracellular enzyme activities (EEAs), microbial biomass C (MBC) and N (MBN), and reactive N (available-N), on day 1 (start), day 13, and day 102 (end) of the incubation period.
Activities of select extracellular enzymes involved in C (xylosidase: Xylo, β-glucosidase: BG, cellobiosidase: Cello) and N (N-acetyl-β glucosaminidase: NAG) cycling in soil were analyzed. To assess the EEA, a standard fluorometric method was used with 96-well microplates (see Sinsabaugh et al. [47]) with acetate buffer solution (pH 5.0). One gram of fresh soil and 125 mL of buffer were mixed to make a soil solution and 200 µL of the solution was pipetted into each well of the microplate. Depending on the enzyme type, microplates with soil solutions and enzyme substrates were incubated for three (BG, NAG), four (Xylo), or seven hours (Cello) at 25 °C. After incubation, microplates were read on a Biotek Synergy HT (BioTek Instruments, Inc., Winooski, VT, USA) with 360 nm excitation and 460 nm emission [48]. Substrates used in this experiment were 4-MUF-β-D-glucopyranoside, 4-MUF-β-D-cellobioside, 4-MUF-β-D-xyloside, and 4-MUF-N-acetyl-β-glucosaminide.
Soil MBC and MBN were analyzed by the chloroform fumigation-extraction method [49,50]. For fumigation, 10 g of moist soil sample was fumigated with chloroform in a desiccator for 24 h. Soil extracts were obtained by mixing 10 g of moist soil with 50 mL of 0.5 mol L−1 K2SO4 solution, shaking for 1 h in a reciprocating shaker (250 rpm), and filtering through Q2 filter papers. Soil extractions were analyzed for MBC and MBN by a TOC-V analyzer connected to a TN module (Shimadzu Corporation, Kyoto, Japan). The MBC and MBN were calculated as the difference between the C and N extracted from fumigated and non-fumigated soil samples, respectively.
Soil NO3 and NH4+ were determined using the colorimetric method in soil solution. The vanadium oxidation method was used for NO3 [51], and the indophenol blue method was used for NH4+ [52] and analyzed on a spectrophotometer (GENESYS™ 10S UV-Vis Spectrophotometer, ThermoFisher Scientific, Ottawa, Canada). The sum of NH4+-N and NO3-N was expressed as total available N (avail-N). The MBC, MBN, and avail-N on each sampling day were calculated per unit mass of soil (mg kg−1 soil).

2.5. Data Preparation

All GHG concentrations were converted to gas fluxes per unit mass of dry soil using the following Equation (1), modified after Lang et al. [34]:
R = ρ × Δ c × V × 273 W × Δ t × ( 273 + T ) × 24
where,
R = flux of GHGs, specifically CO2 (mg CO2–C kg−1 day−1), N2O (µg N2O–N kg−1 day−1), and CH4 (µg CH4–C kg−1 day−1),
ρ = density of N2O, CO2, or CH4 in a standard state,
Δc = change in gas concentration between incubation times of t1 (0 h) and t2 (~24 h) (ppbv h−1 or ppmv h−1),
V = volume of the Mason jar (mL),
T = incubation temperature (°C),
W = dry weight of soil (kg), and
Δt = time difference (h) between GHG measurements (t2 − t1).
The temperature sensitivity of CO2 flux (Q10) was calculated using the following Equation (2) [53,54]
Q10 = (R2/R1)10/(T2−T1)
where,
R2 and R1 are the cumulative CO2 emissions measured at temperatures T2 and T1, respectively, and T2 > T1.
The proportion of total mineralized SOC as CO2 was calculated as follows:
%   C min   =   1 102 ( CO 2 C ) Total   SOC   in   soil   sample × 100
where,
% Cmin is the proportion of total organic carbon mineralized as CO2 throughout the incubation experiment, and
CO2-C is the cumulative sum of SOC mineralized as CO2 during the 102-day incubation period.
The net flux of cumulative GHGs over the entire experimental period was calculated as follows [55]:
Net GHG flux = CO2 + (CH4 × 28) + (N2O × 265)
where,
Net GHG flux is the sum of all GHGs (mg CO2-e kg−1), and 28 and 265 are the global warming potential of CH4 and N2O, respectively, compared to CO2 given a 100 y life span of trace gases [55].
Resulting EEA rates were expressed in µmol h−1 g−1 of oven-dry soil using the following equation [47].
E n z y m e   a c t i v i t y   ( µ mol   g   soi l 1 h 1 ) =   S i g n a l   × 125   mL 1000   × T i m e ( h ) × 0.2   mL   × W / ( 1 + M )
where,
Enzyme activity = EEA rate (µmol h−1 g−1 dry soil),
W = the fresh weight of soil in g, and
M = the moisture content of soil.
S i g n a l   ( nmol ) = ( A s s a y / E c ×   Q c ) ( S u b s t r a t e / E c ) ( S o i l / E c ×   Q c ) + ( B u f f e r / E c ×   Q c )
where,
Ec is the emission coefficient, and
Qc is the quench coefficient.

2.6. Statistical Analyses

Normality and homogeneity of variance for all data were tested with Shapiro–Wilk tests in univariate analyses. A log transformation was applied to the total 102-day cumulative flux of CO2 and N2O, and a cube root transformation was applied to CH4 flux. However, non-transformed values are presented for ease of data interpretation. The fixed effects of the grazing system, temperature, and moisture level were then analyzed on cumulative GHGs using a 3-way factorial mixed model ANOVA using transformed data (where appropriate) for a split-split plot experimental design. Grazing is the whole plot factor, incubation temperatures the sub-plot (i.e., incubation chambers) factor, and moisture level the sub-sub plot factor. The grazing system, soil temperature, and moisture were fixed effects, with blocked ranch pairs as random effects. Temperature sensitivity (Q10) of CO2 flux was analyzed in a two-way mixed model with the grazing system and soil moisture as fixed effects, and ranch pair as random effects. All effects were evaluated at the 5% level of significance. All analyses were performed using the software RStudio version 1.2.5033 [56].
We used structural equation modelling (SEM) to evaluate the relationships among grazing, soil temperature, soil moisture, MBC, individual EEAs, and soil GHG emissions. We developed a conceptual SEM model (Figure S1), hypothesizing direct effects of MBC and EEA on GHG fluxes, MBC on EEA, and grazing, soil temperature, and soil moisture effects on MBC, EEA, and GHG fluxes. The categorical variables “grazing”, “soil temperature” and “soil moisture” were coded as 0 for non-AMP and 1 for AMP; 0 for 5 °C, and 1 for 25 °C; 0 for PWP, 1 for 0.4FC, and 2 for FC, respectively. Following Grace [57], we assessed the conceptual model (full model) vs. reduced models by the goodness-of-fit statistics and used akaike information criterion (AIC) to select the final model among alternative models. The final model had the lowest AIC value. We conducted SEM analysis using the ‘piecewiseSEM’ package in R software [58].

3. Results

3.1. Basic Soil Properties

Soil physical and chemical properties, including bulk density, texture, moisture content, pH, SOC, and N, were not affected by the grazing system (Table S1). However, SOC (p = 0.023) and soil available-N (p = 0.05) varied with the geographic location of the grasslands studied, as represented by AHM (data not shown). More arid grasslands (higher AHM index) were associated with lower SOC (r = −0.62; p < 0.001) and available-N (r = −0.54; p < 0.001), and a higher C:N ratio (r = 0.86; p < 0.001).

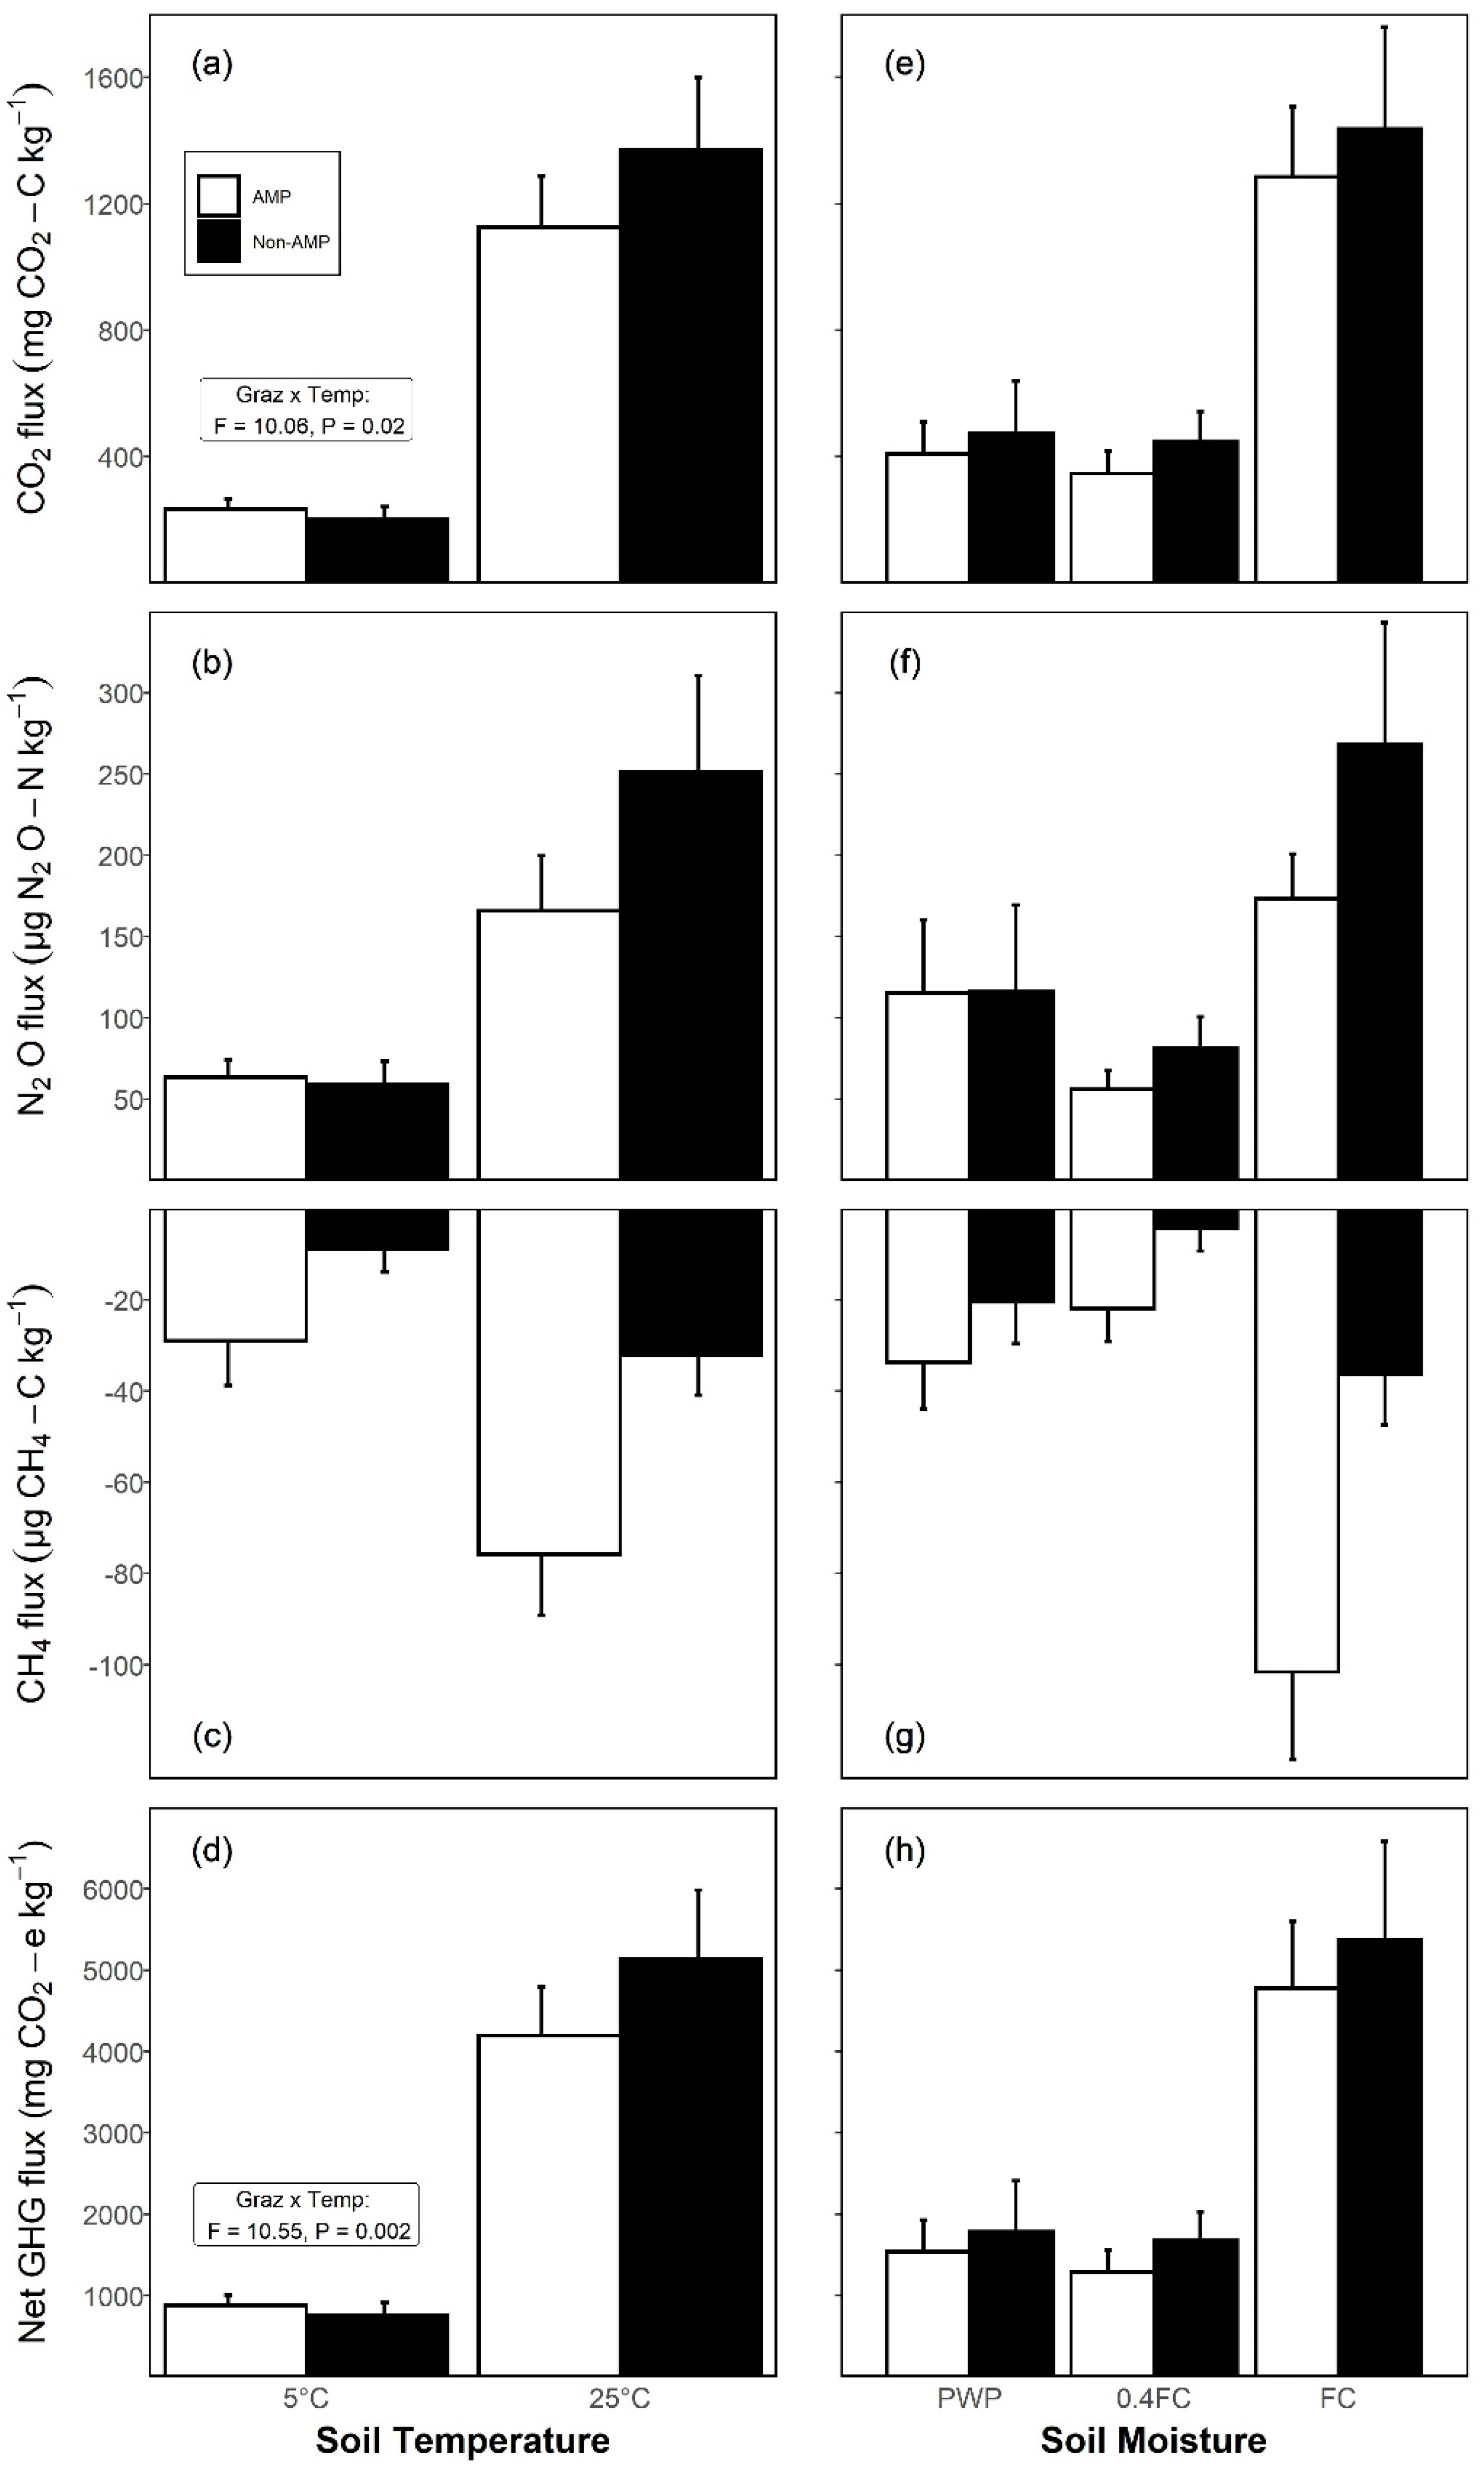
3.2. Effects of Grazing, Soil Temperature, and Moisture on Cumulative GHG Fluxes

Total emissions of CO2 during the entire incubation period were affected by soil temperature and moisture (p < 0.001), with a further interaction of grazing × soil temperature (Table 1). At 5 °C, AMP soils emitted 17% more CO2 compared to non-AMP soils, while at 25 °C, AMP soils emitted 18% less CO2 than non-AMP soils (Figure 1a). Fluxes of CO2 from soils at FC were 2.1 and 2.7 times greater compared to soils at PWP and at 0.4FC, respectively; notably, the responses to moisture remained similar in both grazing systems (Figure 1e).
Cumulative fluxes of N2O during the incubation period were independent of grazing (p ≥ 0.58), but remained strongly influenced by soil temperature and moisture (p < 0.001, Table 1). Soils at 25 °C produced 3.4 times more N2O than soils at 5 °C (Figure 1b). Mean N2O flux from soils at FC were 1.5 and 3.1 times higher than in soils at PWP and 0.4FC, respectively (Figure 1f).
The cumulative uptake of CH4 during the incubation period was affected by the grazing system, soil temperature, and moisture (Table 1). Overall, CH4 uptake was 2.6-fold greater in AMP soils (52.4 ± 6.4 µg CH4-C kg−1) in comparison to non-AMP soils (20.4 ± 2.5 µg CH4-C kg−1) (Figure 1c). Similarly, soils at 25 °C had 2.9-fold greater uptake of CH4 compared to soils incubated at 5 °C (Figure 1c). Furthermore, uptake of CH4 was 2.6-fold greater in soils at FC than soil at PWP (p < 0.001), and the latter, in turn, was double (p < 0.001) that in soils at 0.4FC (Figure 1g).
Net GHG emissions (CO2-e) throughout the incubation varied with soil temperature and the interaction of grazing with temperature (Table 1). Net GHG emissions were 15% lower in non-AMP than in AMP systems at 5 °C, but were 22% higher in non-AMP soils at 25 °C compared to the AMP soils (Figure 1d). Net GHG emissions were also affected by soil moisture (Table 1). Soils at FC emitted 3.1 and 3.7 times more net GHGs (p < 0.05) in comparison to soils at either PWP or 0.4FC, while the latter did not differ from one another (Figure 1g).
The temperature sensitivity (Q10) of CO2 flux within these grassland soils differed between the AMP and non-AMP grazing systems (Table 1), and were consistently greater (p < 0.001) from non-AMP soils (2.76 ± 0.11) compared to AMP soils (2.13 ± 0.08). Additionally, Q10 values increased with soil moisture as follows: PWP (2.25 ± 0.11) < 0.4FC (2.43 ± 0.14) ≤ FC (2.67 ± 0.14) (p < 0.05 for all comparisons).

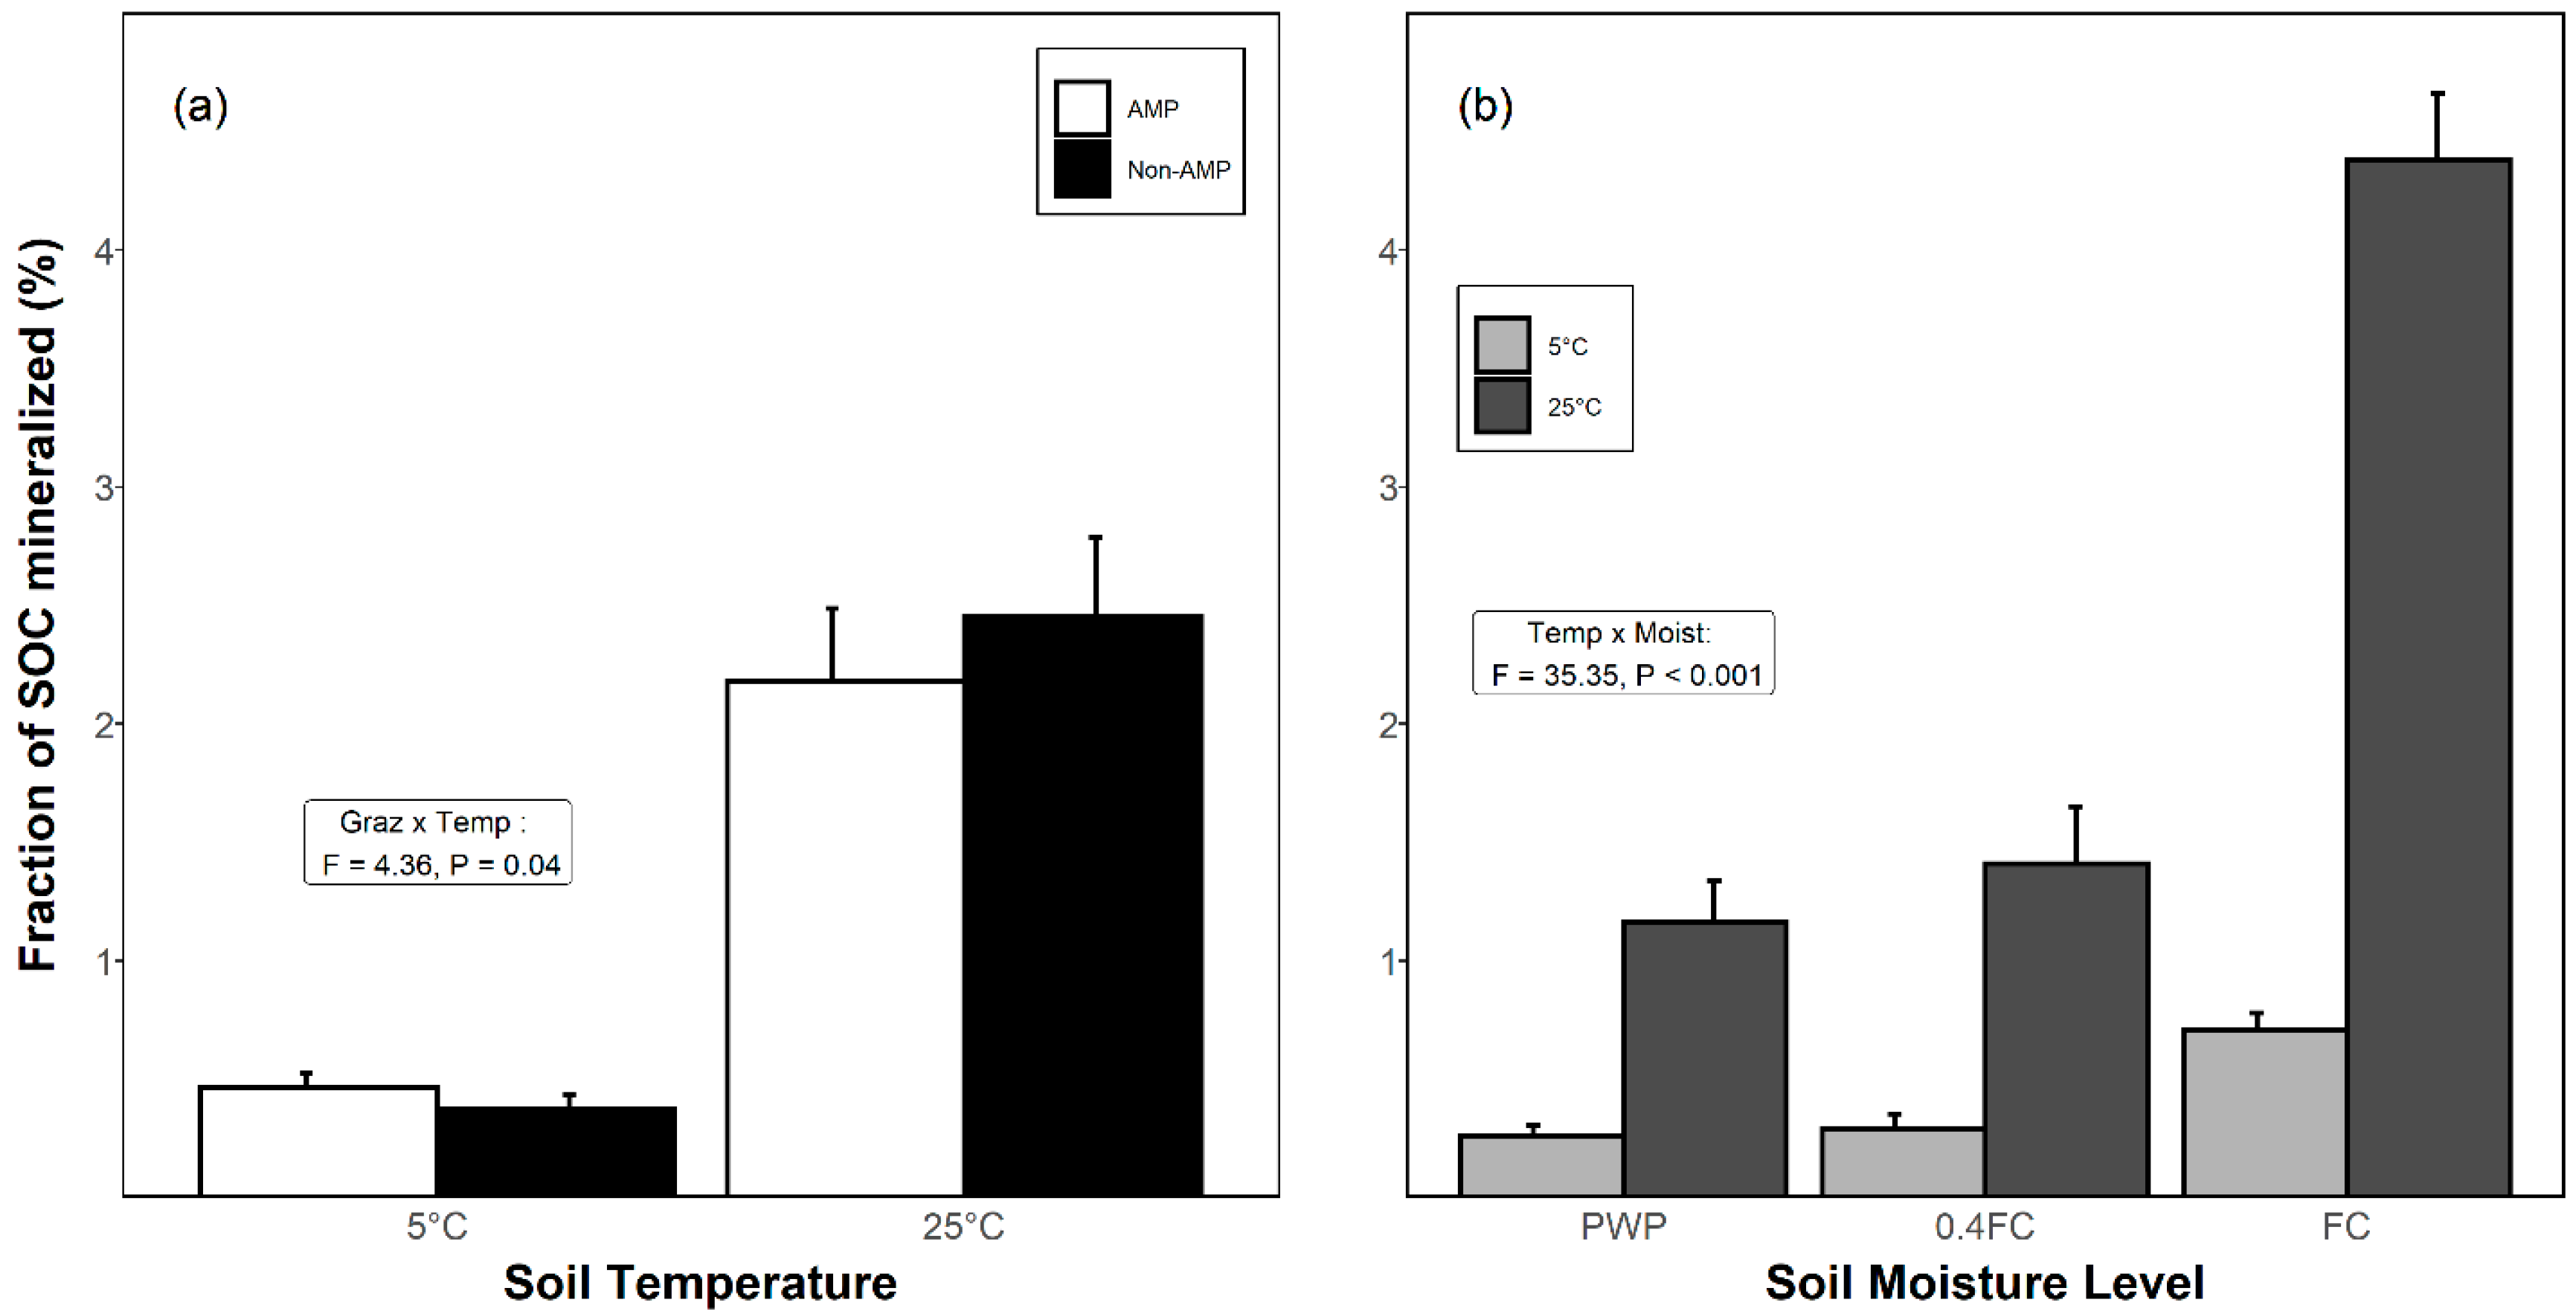
3.3. Proportion of SOC Mineralized as CO2

The proportion of SOC mineralized as CO2 during the incubation period was affected by soil temperature, moisture, and by an interaction of grazing × temperature, and temperature × moisture (Table 1). At 5 °C, the proportion of SOC mineralized as CO2-C was <0.5%, but at 25 °C reached as high as 2.9% (Figure 2a). Within the AMP soils, SOC mineralization was 3.7 times greater at 25 °C than at 5 °C, while in non-AMP soils this increase was 5.6 times (Figure 2a). Increasing soil moisture and soil temperature both increased the proportion of SOC mineralized (Figure 2b), though high temperature (25 °C) and high moisture (i.e., FC) in combination increased CO2-C mineralization by as much as 17+ fold relative to soils at low temperature where moisture was below FC (Figure 2b).

3.4. Factors Affecting GHG Fluxes

The use of SEM evaluating CO2, CH4, and N2O responses to the grazing regime, temperature, and moisture conditions during incubation, as well as the associated MBC and EEA levels, revealed marked differences among GHGs, and the sampling times during incubation (Figure 3; Table S2).
Emissions of CO2 from soil were consistently positively influenced by increasing soil moisture, and even more so by greater soil temperatures (Table S3), throughout all three sampling periods—namely days 1, 13, and 102 (Figure 3a). In contrast, the grazing system had no impact on CO2 emissions, either directly, or indirectly by moderating MBC. Instead, MBC was largely decoupled from soil temperature and moisture (Table S4), with the exception of soil temperature on day 13, at which time higher temperatures reduced MBC (Figure 3a; Table S5). Soil EEAs had a strong positive response to both increasing MBC and higher soil moisture, particularly on day 13, but also on day 102, and to a lesser extent on day 1 (Table S6; Table S7).
Unlike CO2, CH4 fluxes directly declined (i.e., uptake increased) in response to higher soil temperature during the first two sampling periods, and also decreased more within soils subject to AMP rather than non-AMP grazing at these times (Figure 3b). By the end of the incubation period, however, no direct grazing effect remained, while CH4 flux increased at that point with soil temperature and declined with greater moisture (Figure 3b). CH4 fluxes were also closely coupled with MBC, but only via the indirect influence of MBC on EEA. On day 13, CH4 flux increased with greater Cello EEA, and decreased with greater BG EEA (Figure 3b). On day 102, Xylo EEA was the only enzyme that was linked to soil CH4 flux, with higher Xylo EEA associated with decreasing CH4 flux (Figure 3b).
Based on the SEM, fluxes of N2O were not affected by the grazing regime either directly or indirectly, with the lone effect of grazing being an increase in NAG EEA in soil arising from AMP grazing (Figure 3c). The latter, however, did not link further to N2O flux. Overall, significant relationships evident between the grazing systems and associated soil N2O fluxes were limited to a consistent positive effect of soil temperature throughout the incubation period, and a positive effect of soil moisture at the start of the incubation (Figure 3c).

4. Discussion

4.1. Effects of Grazing Systems, Soil Temperature and Moisture on GHG Flux

We purposely conducted this study within an incubation environment to control extraneous sources of environmental variation common under field conditions. Furthermore, by using a paired design in which grasslands were on similar ecosites, we controlled many external physical factors (e.g., soil texture, SOM, etc.), and thereby isolated the influence of inherent differences in soil chemical and biological parameters on soil GHG fluxes [59] generated by the grazing treatments. In our study, by varying only soil temperature and moisture levels during the incubation, we were able to isolate soil-based influences on GHG fluxes, which in turn, were hypothesized to arise due to differences in prior grazing practices.
Our results showed that CH4 oxidation was higher in grasslands subject to AMP grazing rather than non-AMP grazing, and that fluxes of N2O did not vary in relation to grazing, while the flux of CO2 depended on soil temperature. Increases in soil temperature from 5 °C to 25 °C led to 2+ fold increases in N2O flux and 3+ fold increases in CO2 flux, but simultaneous increases in CH4 uptake. A similar pattern occurred with increases in soil moisture: soils at FC had marked increases in CO2 and N2O flux, as well as increased CH4 uptake. Overall, net GHG fluxes strongly paralleled those associated with CO2, which is not surprising given that the latter represented the primary contributor to net GHG emissions (~98%). Collectively, these findings corroborate the notion that mineralization of soil C increases with increasing temperature and moisture [33,60]. The emission of CO2, which is a key indicator of mineralizable C, is well known to be directly influenced by soil temperature and moisture [33,34,61,62,63,64]. For example, the low flux of GHGs in soils at PWP compared to other moisture levels shows that dry soils inhibit microbial activity, leading to decreased respiration [65]. An increasing flux of N2O with higher moisture may also reflect increased microbial activity involved in the formation of N2O [65].
While grazing effects were not as marked as soil temperature and moisture, distinct patterns were nevertheless evident in GHGs relative to whether soils originated from AMP- or non-AMP-grazed grasslands, and these differences were more likely to manifest in soils subject to a higher temperature or elevated moisture. Under warm and moist conditions, soils under AMP grazing had lower emissions of CO2 and increased uptake of CH4 compared to soils from non-AMP grasslands. Soils from AMP systems were generally a better sink for CH4 than soils from non-AMP systems within each temperature level during the entire experimental period, as determined by net GHG values. These results are indicative of a smaller GHG footprint in grasslands subject to AMP grazing and in line with findings of other studies such as CH4 sink capacity of the Northern Great Plains pastures [9] and lower GHG emissions from AMP-grazed than feedlot beef productions [66]. Another field experiment showed that AMP grazing led to a greater CH4 sink capacity compared to moderate and heavy continuous grazing [67]. Although the mechanisms accounting for these differences remain unknown, below, we discuss potential causes based on our lab-incubation study.
Soils from non-AMP grasslands may have more labile C that microbes can rapidly mineralize, particularly at high temperatures, leading to elevated CO2 fluxes. In contrast, AMP soils may contain elevated recalcitrant material from the incorporation of above-ground litter, induced by intensive animal activity (i.e., hoof action) [68], which in turn, could slow down decay [8].
Fluxes of N2O result from nitrification and denitrification processes in the soil [69]. Water content is crucial in these processes as it transports energy required by soil microorganisms to function [70]. A positive relationship between soil moisture and N2O emissions has been reported in an incubation study on mixed grassland soils [61], and is consistent with our current findings. In addition to moisture, soil temperature and aerobic conditions affect N2O flux, with the former two factors explaining almost 90% of the variation [70]. In a warming and defoliation field experiment conducted in the same northern temperate grasslands encompassed by our study, N2O flux increased with increasing temperature and more severe defoliation [7].
Soil compactness, together with organic C and N turnover induced by grazing, determines the abundance and diversity of active methanotrophs, as well as CH4 oxidation in grassland soils [23]. Under normal conditions, N-deposition reduces the CH4 sink capacity of soils [71]. Given the similar physical and chemical soil properties among our paired grasslands, the specific mechanism for the increased CH4 uptake in AMP soils is not clear but may be related to differences in soil microbes. However, our results show that increasing temperature facilitates CH4 uptake across all moisture levels in soils from both grazing systems, confirming the favorable temperature response of methanotrophs [12,72].
Grassland soils are well-documented CH4 sinks due to methanotrophy. The identity of methanotroph communities (Type I or II) responsible for CH4 oxidation depends on soil properties, including SOM and the synthesis of secondary chemicals during the SOM mineralization process, as well as SOC, N cycling, and soil pH [73]. In simulated global change experiments, Type II methanotrophs decreased with increased precipitation and temperature [74]. As our study did not test these factors, further investigation is warranted to determine which type of methanotrophs are specifically involved in the increased CH4 oxidation within AMP soils.

4.2. SOC Mineralization and the Temperature Sensitivity of CO2 Emissions

Our results showed that SOC mineralization as CO2-C was more than 4-fold higher at 25 °C compared to 5 °C, with a further increase in non-AMP grasslands at high temperatures. We found that Q10 increased as moisture increased within incubated soils from both the AMP and non-AMP grasslands. Importantly, Q10 was consistently greater in non-AMP soils in comparison to AMP soils, which suggests a greater risk of C loss exists within soils grazed under conventional grazing.
The Q10 value of grasslands found here (2.4 ± 0.1) falls within the range of globally observed values (2.5 ± 2.0), and temperature-normalized values (2.0 ± 1.7) for grasslands [59]. It also corroborates earlier findings that values of Q10 generally increase with soil moisture levels, where at the same temperature, soils with greater moisture have higher CO2 emissions [64]. Moreover, we found a strong synergistic effect of greater moisture and temperature in elevating Q10 values, highlighting the potential impact of simultaneous changes in both these climatic factors on future grassland soil C storage. While grassland managers are unlikely to seek lower soil moisture due to its fundamental importance in regulating plant (and forage) growth, it does highlight the crucial role that soil water plays in the decomposition of grassland SOM, with implications for various scenarios of global climate change [64,75]. Additionally, it reinforces the importance of adopting grazing management practices that limit soil temperatures, such as the retention of adequate insulating litter [76,77,78].
There may be several mechanisms accounting for this difference in temperature sensitivity between grazing systems. For example, as mentioned above, relative to non-AMP soils, AMP soils may contain more complex (recalcitrant) compounds [79] due to the so-called “herd effect”, that incorporates coarse standing litter and debris into the surface soil [68]. Should this be the case, the available pool of soil C in AMP soils may contain more structural plant materials such as lignin that are found in lower abundance within roots [80]. Grazing is known to influence nutrient cycling by modifying litter breakdown within species as well as the soil environment for decomposition [27]. Yet another explanation is that the microbial communities in soils between the grazing systems may differ, in part due to the differences in plant chemistry, but also differences in the microenvironment. The non-AMP-grazed areas are often grazed for longer periods of time with less rest, and this could lead to lower levels of insulating litter on the soil surface. Litter, in turn, is widely known to be important for regulating soil temperature [76,77,78]. As such, non-AMP soils may have had microbial communities better adapted to warmer soil conditions, which in turn could explain why non-AMP soils had greater CO2 flux at higher soil temperatures. This finding may have implications for the conservation of grassland soil health, including soil organic matter and SOC under future uncertainties associated with variation in growing conditions, including climatic warming.

4.3. Relative Effects of Grazing, Temperature and Moisture on EEA and GHG Fluxes

We used SEM to distinguish between direct effects of grazing on GHG fluxes, and indirect effects that were regulated through the microbial community and the associated levels of EEAs. Overall, the GHGs examined here were more likely to be directly and strongly influenced by soil temperature and moisture, rather than grazing. Contrary to our expectations, grazing had comparatively little impact on soil CO2 or N2O fluxes, particularly in comparison to the microclimate conditions. In contrast, soil CH4 uptake was the lone GHG that demonstrated a strong direct (and positive) response to AMP grazing. This finding suggests that AMP grazing may be altering the soil microbial community in such a way that it leads to increases in the abundance of methanotrophs responsible for CH4 oxidation. Previous studies have shown that grazing intensity affects the abundance and diversity of active methanotrophs responsible for CH4 oxidation [23]. Under field conditions, soil CH4 uptake was found to be influenced by moisture and available substrates [8], and field and incubation experiments showed that soil moisture and labile C and N content are the primary controlling factors for methanotrophy [81,82].
While we hypothesized a linkage would exist between the grazing systems and GHGs via MBC and the measured EEAs, we did not find this association. Instead, CO2 and CH4 were independently related to select EEAs, reinforcing the notion that EEAs may be a useful indicator of GHG fluxes [30]. Additionally, the EEAs explored in this study were associated with both MBC, indicating the key role of microbial population size in regulating EEAs [30,83], as well as microclimatic conditions, particularly soil moisture. These results substantiate the conclusion that while the EEAs responsible for C biogeochemical cycling were closely dependent on MBC and soil moisture, soil CO2 fluxes overall remain more dependent on ambient microclimatic conditions (temperature and moisture) rather than on the prior grazing system.
Finally, we observed divergent effects of the grazing systems over time. Grazing, temperature, and moisture effects were generally more prominent on days 1 and 13 compared to day 102, including in assessing the direct relationship between grazing and CH4 flux. This may reflect ongoing mineralization of the more labile soil organic matter compounds during the incubation, leading to a general reduction in microbial activity [84], and therefore GHGs. Our results corroborate the resource allocation theory of microbial enzyme production, which states that soil microbes regulate enzyme production proportionately to the availability of resources such as labile C and N [85].
The lack of a relationship between the grazing systems and either MBC or EEAs could be due to our simplified categorical differentiation between grazing systems as either AMP or non-AMP. This separation may be inadequate to test for grazing induced responses, particularly as the non-AMP ranches had more variation in management metrics [86].
As these findings occurred under lab incubation conditions and not in the field where factors such as litter and light levels varied, the most likely reason is a difference in either chemical properties (i.e., SOM composition) or biological properties (i.e., the microbial community). Moreover, this is likely to be the case given that most soil physical and chemical properties did not differ between AMP and non-AMP systems. Under field conditions, many biotic and abiotic factors simultaneously affect C and nutrient cycling, and thus it is imperative to evaluate in situ GHG fluxes from grassland soils under both types of grazing systems to derive results more indicative of fundamental conditions regulating these GHGs. Comparative field studies will provide a better insight into the benefit of AMP grazing in comparison to conventional grazing in terms of GHG dynamics across these northern temperate grasslands.

5. Conclusions

Our results showed that fluxes of different GHGs from grassland soils varied with grazing systems: cumulative CH4 uptake was higher in soils under AMP grazing compared to non-AMP, emissions of N2O were independent of grazing, and grazing interacted with temperature to affect the flux of CO2. The uptake of CH4 and emissions of CO2 and N2O increased with greater moisture levels and soil temperature. Irrespective of grazing systems, MBC had a vital role as an indirect driver on GHG fluxes by influencing the EEAs responsible for C and N cycling. Grazing affected CH4 uptake for the first two weeks but, thereafter, the grazing effect became less important and N2O emissions were indirectly influenced by grazing by affecting NAG. We conclude that AMP grazing has the potential to mitigate the effect of a warmer soil on GHG emissions by consuming more CH4 compared to non-AMP-grazed soils. Despite the increased uptake of CH4 in grassland soil under AMP grazing, including soils subject to the higher temperature and moisture conditions, this change was insufficient to offset increases in the other GHGs, particularly of CO2. As a result, environmental conditions favoring high CO2 flux produced the greatest net GHG footprint, and reinforces the importance of maintaining cool soil temperatures within these grasslands, as might occur with the retention of ample litter. This finding has implications for the conservation of grassland soil health, including soil organic matter and SOC, under future uncertainties associated with the variation in growing conditions, including climatic warming in northern temperate grasslands.

Supplementary Materials

The following are available online at https://www.mdpi.com/2073-4395/10/11/1781/s1, Figure S1. Conceptual SEM models for determining effects of grazing systems, soil temperature, and moisture on microbes and resultant fluxes of (a) CO2, (b) CH4, and (c) N2O during the incubation experiment. Table S1: Summary of soil physical and chemical properties for studied grasslands. Table S2. Summary of ANOVA, including the degree of freedom (df), F- and p- values, for the enzyme activities studied during a 102-day incubation. Enzyme activities were analyzed for days 1, 13, and 102 of the incubation period. p-values in bold are ≤0.05. Table S3. Summary of ANOVA, including degrees of freedom (df), F- and p-values, for the GHGs studied during a 102-day incubation. Fluxes of GHGs were analyzed for days 1, 13, and 102 of the incubation period. p-values in bold are ≤0.05. Table S4. Summary of ANOVA, including the degree of freedom (df), F- and p- values, for the studied soil microbial biomass carbon (MBC), microbial biomass nitrogen (MBN), and available nitrogen (AN) during a 102-day incubation. Enzyme activities were analyzed for days 1, 13, and 102 of the incubation period. p-values shown in bold are ≤0.05. Table S5: Fluxes of greenhouse gases (mean ± SE) from incubated soils on selected days of measurement (1, 13, and 102) coinciding with measurements of various extracellular enzyme activities. Table S6: Microbial biomass carbon (MBC), biomass nitrogen (MBN), and available N (mean ± SE) within incubated soils on selected days of measurement (1, 13, and 102) coinciding with measurements of various extracellular enzyme activities. Table S7: Extracellular enzyme activities (mean ± SE µmol g−1 h−1) within incubated soils on select days of a 102-day incubation.

Author Contributions

Conceptualization and methodology: B.M.S., S.X.C. and D.K.; validation and analyses: B.M.S., E.W.B., C.N.C. and Z.M.; investigation: B.M.S., and D.K.; data curation: B.M.S., D.K. and T.F.D.; writing and editing: B.M.S., E.W.B., C.N.C., S.X.C.; visualization: T.F.D., and Z.M.; resources and supervision, S.X.C., and M.S.B.; funding acquisition and project administration; M.S.B. All authors have read and agreed to the published version of the manuscript.

Funding

Funding for this study was provided by Agriculture and Agri-Food Canada through its Agricultural Greenhouse Gases Program (Project No RES0032548).

Acknowledgments

We acknowledge all participating ranchers for their permission to access their ranches for this project. Richard Teague, Ry Thompson, Steve Apfelbaum, and Jessica Grenke identified the ranches used in this study. We thank Miles Dyck for providing pressure plate extractors for soil moisture determination, and Gleb Kravchensky for assisting with the collection of soil samples and GHG samples during the incubation experiment. Soil texture data were provided by Upama K.C. Laio Sobrinho helped in data analysis in R environment. Finally, we thank Peter Blenis for providing advice on the statistical analysis. We acknowledge anonymous reviewers whose comments helped to improve the earlier version of the manuscript.

Conflicts of Interest

The authors declare no conflict of interest.

Ethical Statement

Researchers conducted the study at the University of Alberta. All pasture management data were collected at the University of Alberta following Human Ethics approval (Human Ethics # Pro00078581).

References

  1. WRI. A Guide to World Resources 2000–2001: People and Ecosystems; World Resources Institute: Washington, DC, USA, 2001. [Google Scholar]
  2. Leahy, P.; Kiely, G.; Scanlon, T.M. Managed Grasslands: A Greenhouse Gas Sink or Source? Geophys. Res. Lett. 2004, 31. [Google Scholar] [CrossRef] [Green Version]
  3. Jones, S.K.; Rees, R.M.; Skiba, U.M.; Ball, B.C. Greenhouse Gas Emissions from a Managed Grassland. Glob. Planet. Chang. 2005, 47, 201–211. [Google Scholar] [CrossRef]
  4. Asgedom, H.; Kebreab, E. Beneficial Management Practices and Mitigation of Greenhouse Gas Emissions in the Agriculture of the Canadian Prairie: A Review. Agron. Sustain. Dev. 2011, 31, 433–451. [Google Scholar] [CrossRef] [Green Version]
  5. Laca, E.A.; McEachern, M.-B.; Demment, M.W. Global Grazinglands and Greenhouse Gas Fluxes. Rangel. Ecol. Manag. 2010, 63, 1–3. [Google Scholar] [CrossRef]
  6. Follett, R.F.; Reed, D.A. Soil Carbon Sequestration in Grazing Lands: Societal Benefits and Policy Implications. Rangel. Ecol. Manag. 2010, 63, 4–15. [Google Scholar] [CrossRef] [Green Version]
  7. Bork, E.W.; Attaeian, B.; Cahill, J.F.; Chang, S.X. Soil Nitrogen and Greenhouse Gas Dynamics in a Temperate Grassland under Experimental Warming and Defoliation. Soil Sci. Soc. Am. J. 2019, 83, 780–790. [Google Scholar] [CrossRef]
  8. Tang, S.; Wang, K.; Xiang, Y.; Tian, D.; Wang, J.; Liu, Y.; Cao, B.; Guo, D.; Niu, S. Heavy Grazing Reduces Grassland Soil Greenhouse Gas Fluxes: A Global Meta-Analysis. Sci. Total Environ. 2019, 654, 1218–1224. [Google Scholar] [CrossRef]
  9. Liebig, M.A.; Gross, J.R.; Kronberg, S.L.; Phillips, R.L. Grazing Management Contributions to Net Global Warming Potential: A Long—Term Evaluation in the Northern Great Plains. J. Environ. Qual. 2010, 39, 799–809. [Google Scholar] [CrossRef]
  10. Braun, M.; Bai, Y.; McConkey, B.; Farrell, R.; Romo, J.T.; Pennock, D. Greenhouse Gas Flux in a Temperate Grassland as Affected by Landform and Disturbance. Landsc. Ecol. 2013, 28, 709–723. [Google Scholar] [CrossRef]
  11. Liu, Y.; Yan, C.; Matthew, C.; Wood, B.; Hou, F. Key Sources and Seasonal Dynamics of Greenhouse Gas Fluxes from Yak Grazing Systems on the Qinghai-Tibetan Plateau. Sci. Rep. 2017, 7, 40857. [Google Scholar] [CrossRef] [Green Version]
  12. García-Marco, S.; Ravella, S.R.; Chadwick, D.; Vallejo, A.; Gregory, A.S.; Cárdenas, L.M. Ranking Factors Affecting Emissions of GHG from Incubated Agricultural Soils. Eur. J. Soil Sci. 2014, 65, 573–583. [Google Scholar] [CrossRef]
  13. Teague, R.; Grant, B.; Wang, H.-H. Assessing Optimal Configurations of Multi-Paddock Grazing Strategies in Tallgrass Prairie Using a Simulation Model. J. Environ. Manag. 2015, 150, 262–273. [Google Scholar] [CrossRef]
  14. Teague, R.; Provenza, F.; Kreuter, U.; Steffens, T.; Barnes, M. Multi-Paddock Grazing on Rangelands: Why the Perceptual Dichotomy between Research Results and Rancher Experience? J. Environ. Manag. 2013, 128, 699–717. [Google Scholar] [CrossRef]
  15. Teague, W.R.; Dowhower, S.L.; Baker, S.A.; Haile, N.; DeLaune, P.B.; Conover, D.M. Grazing Management Impacts on Vegetation, Soil Biota and Soil Chemical, Physical and Hydrological Properties in Tall Grass Prairie. Agric. Ecosyst. Environ. 2011, 141, 310–322. [Google Scholar] [CrossRef]
  16. Savory, A.; Butterfield, J. Holistic Management: A New Framework for Decision Making; Island Press: Washington, DC, USA, 1998. [Google Scholar]
  17. Wang, Z.; Yun, X.J.; Wei, Z.J.; Schellenberg, M.P.; Wang, Y.F.; Yang, X.; Hou, X.Y. Responses of Plant Community and Soil Properties to Inter-Annual Precipitation Variability and Grazing Durations in a Desert Steppe in Inner Mongolia. J. Integr. Agric. 2014, 13, 1171–1182. [Google Scholar] [CrossRef]
  18. Byrnes, R.C.; Eastburn, D.J.; Tate, K.W.; Roche, L.M. A Global Meta-Analysis of Grazing Impacts on Soil Health Indicators. J. Integr. Agric. 2018, 47, 758–765. [Google Scholar] [CrossRef] [Green Version]
  19. Hillenbrand, M.; Thompson, R.; Wang, F.; Apfelbaum, S.; Teague, R. Impacts of Holistic Planned Grazing with Bison Compared to Continuous Grazing with Cattle in South Dakota Shortgrass Prairie. Agric. Ecosyst. Environ. 2019, 279, 156–168. [Google Scholar] [CrossRef]
  20. Roesch, A.; Weisskopf, P.; Oberholzer, H.; Valsangiacomo, A.; Nemecek, T. An Approach for Describing the Effects of Grazing on Soil Quality in Life-Cycle Assessment. Sustainability 2019, 11, 4870. [Google Scholar] [CrossRef] [Green Version]
  21. Halde, C.; Hammermeister, A.M.; Mclean, L.N.; Webb, K.T.; Martin, R.C. Soil Compaction under Varying Rest Periods and Levels of Mechanical Disturbance in a Rotational Grazing System. Can. J. Soil Sci. 2011, 91, 957–964. [Google Scholar] [CrossRef] [Green Version]
  22. Ahmed, R.S.; Mario, E.B.; Carolyn, E.G. Grazing Intensity Effects on Litter Decomposition and Soil Nitrogen Mineralization. J. Range Manag. 1994, 47, 444. [Google Scholar] [CrossRef] [Green Version]
  23. Li, Y.; Liu, Y.; Pan, H.; Hernández, M.; Guan, X.; Wang, W.; Zhang, Q.; Luo, Y.; Di, H.; Xu, J. Impact of Grazing on Shaping Abundance and Composition of Active Methanotrophs and Methane Oxidation Activity in a Grassland Soil. Biol. Fertil. Soils 2020, 56, 799–810. [Google Scholar] [CrossRef]
  24. Chuan, X.; Carlyle, C.N.; Bork, E.W.; Chang, S.X.; Hewins, D.B. Long-Term Grazing Accelerated Litter Decomposition in Northern Temperate Grasslands. Ecosystems 2018, 21, 1321–1334. [Google Scholar] [CrossRef]
  25. Briske, D.D.; Derner, J.D.; Brown, J.R.; Fuhlendorf, S.D.; Teague, W.R.; Gillen, R.L.; Ash, A.J.; Havstad, K.M.; Willms, W.D. Rotational Grazing on Rangelands: Reconciliation of Perception and Experimental Evidence. Rangel. Ecol. Manag. 2008, 61, 3. [Google Scholar] [CrossRef] [Green Version]
  26. Carter, J.; Jones, A.; Brien, M.; Ratner, J.; Wuerthner, G. Holistic Management: Misinformation on the Science of Grazed Ecosystems. Int. J. Biodivers. 2014, 2014, 1–10. [Google Scholar] [CrossRef]
  27. Semmartin, M.; Garibaldi, L.A.; Chaneton, E.J. Grazing History Effects on above- and Below-Ground Litter Decomposition and Nutrient Cycling in Two Co-Occurring Grasses. Plant Soil 2008, 303, 177–189. [Google Scholar] [CrossRef]
  28. Srinivasa Rao, C.; Grover, M.; Kundu, S.; Desai, S. Soil Enzymes. In Encyclopedia of Soil Science, 3rd ed.; Lal, R., Ed.; CRC Press: Boca Raton, FL, USA, 2016; pp. 2100–2107. [Google Scholar] [CrossRef]
  29. Sinsabaugh, R.L.; Hill, B.H.; Follstad Shah, J.J. Ecoenzymatic Stoichiometry of Microbial Organic Nutrient Acquisition in Soil and Sediment. Nature 2009, 462, 795–798. [Google Scholar] [CrossRef]
  30. Hewins, D.B.; Broadbent, T.; Carlyle, C.N.; Bork, E.W. Extracellular Enzyme Activity Response to Defoliation and Water Addition in Two Ecosites of the Mixed Grass Prairie. Agric. Ecosyst. Environ. 2016, 230, 79–86. [Google Scholar] [CrossRef]
  31. Bell, T.H.; Henry, H.A.L. Fine Scale Variability in Soil Extracellular Enzyme Activity Is Insensitive to Rain Events and Temperature in a Mesic System. Pedobiologia 2011, 54, 141–146. [Google Scholar] [CrossRef]
  32. Savage, K.; Phillips, R.; Davidson, E. High Temporal Frequency Measurements of Greenhouse Gas Emissions from Soils. Biogeosciences 2014, 11, 2709–2720. [Google Scholar] [CrossRef] [Green Version]
  33. Curtin, D.; Beare, M.H.; Hernandez-Ramirez, G. Temperature and Moisture Effects on Microbial Biomass and Soil Organic Matter Mineralization. Soil Sci. Soc. Am. J. 2012, 76, 2055–2067. [Google Scholar] [CrossRef]
  34. Lang, M.; Cai, Z.; Chang, S.X. Effects of Land Use Type and Incubation Temperature on Greenhouse Gas Emissions from Chinese and Canadian Soils. J. Soils Sediments 2011, 11, 15–24. [Google Scholar] [CrossRef]
  35. Canadian Society of Soil Science. Soils of Canada. Available online: https://soilsofcanada.ca/orders/chernozemic-soils.php (accessed on 5 July 2020).
  36. Mbogga, M.; Wang, T.; Hansen, C.; Hamann, A. A Comprehensive Set of Interpolated Climate Data for Alberta; Alberta Sustainable Resource Development, Government of Alberta: Edmonton, AB, Canada, 2010; p. 7. [Google Scholar]
  37. ClimateAB. Historical and Projected Climate Data for Alberta. Available online: https://sites.ualberta.ca/~ahamann/data/climateab.html (accessed on 15 September 2020).
  38. Wang, T.; Hamann, A.; Spittlehouse, D.L.; Aitken, S.N. Development of Scale-Free Climate Data for Western Canada for Use in Resource Management. Int. J. Climatol. 2006, 26, 383–397. [Google Scholar] [CrossRef]
  39. Hendershot, W.; Lalande, H.; Duquette, M. Soil Reaction and Exchangeable Acidity. In Soil Sampling and Methods of Analysis; Carter, M.R., Gregorich, E.G., Eds.; CRC Press: Boca Raton, FL, USA, 2006; pp. 173–178. [Google Scholar] [CrossRef]
  40. Hao, X.; Ball, B.; Culley, J.; Carter, M.; Parkin, G. Soil Density and Porosity. In Soil Sampling and Methods of Analysis; Carter, M.R., Gregorich, E.G., Eds.; CRC Press: Boca Raton, FL, USA, 2008; pp. 743–760. [Google Scholar] [CrossRef]
  41. Kroetsch, D.; Wang, C. Particle Size Distribution. In Soil Sampling and Methods of Analysis, 2nd ed.; Carter, M.R., Gregorich, E.G., Eds.; CRC Press: Boca Raton, FL, USA, 2007; pp. 161–178. [Google Scholar]
  42. Reynolds, W.D.; Topp, G.C. Soil Water Desorption and Imbibition: Tension and Pressure Techniques. In Soil Sampling and Methods of Analysis, 2nd ed.; Carter, M.R., Gregorich, E.G., Eds.; CRC Press: Boca Raton, FL, USA, 2006; pp. 981–1005. [Google Scholar]
  43. Buchan, G.D.; Tonkin, P.J. Estimation of Field Capacity and Wilting Point of Some New Zealand Soils from Their Saturation Percentages. N. Z. J. Crop Hortic. Sci. 1990, 18, 241–246. [Google Scholar] [CrossRef]
  44. Dane, J.H.; Hopmans, J.W. Water Retention and Storage. In Methods of Soil Analysis: Part 4 Physical Methods; SSSA Book Series; Dane, J.H., Topp, C.G., Eds.; SSSA: Madison, WI, USA, 2002; pp. 671–795. [Google Scholar] [CrossRef]
  45. McMinn, D. Chromatography: Gas Detectors: General (Flame Ionization Detectors and Thermal Conductivity Detectors). In Encyclopedia of Separation Science; Wilson, I.D., Ed.; Academic Press: Oxford, UK, 2000; pp. 443–447. [Google Scholar] [CrossRef]
  46. Lovelock, J.E. The Electron Capture Detector: Theory and Practice. J. Chromatogr. A 1974, 99, 3–12. [Google Scholar] [CrossRef]
  47. Sinsabaugh, R.L.; Saiya-Cork, K.; Long, T.; Osgood, M.P.; Neher, D.A.; Zak, D.R.; Norby, R.J. Soil Microbial Activity in a Liquidambar Plantation Unresponsive to CO2-Driven Increases in Primary Production. Appl. Soil Ecol. 2003, 24, 263–271. [Google Scholar] [CrossRef] [Green Version]
  48. Kaliaskar, D. Cultivation and Grazing Impacts on Extracellular Enzyme Activity in Alberta Grasslands; University of Alberta: Edmonton, AB, Canada, 2020. [Google Scholar]
  49. Brookes, P.C.; Landman, A.; Pruden, G.; Jenkinson, D.S. Chloroform Fumigation and the Release of Soil Nitrogen: A Rapid Direct Extraction Method to Measure Microbial Biomass Nitrogen in Soil. Soil Biol. Biochem. 1985, 17, 837–842. [Google Scholar] [CrossRef]
  50. Vance, E.D.; Brookes, P.C.; Jenkinson, D.S. An Extraction Method for Measuring Soil Microbial Biomass C. Soil Biol. Biochem. 1987, 19, 703–707. [Google Scholar] [CrossRef]
  51. Miranda, K.M.; Espey, M.G.; Wink, D.A. A Rapid, Simple Spectrophotometric Method for Simultaneous Detection of Nitrate and Nitrite. Nitric Oxide 2001, 5, 62–71. [Google Scholar] [CrossRef]
  52. Keeney, D.R.; Nelson, D.W. Nitrogen-Inorganic Forms. In Methods of Soil Analysis Part 2, Chemical and Microbiological Properties; Page, A.L., Miller, R.H., Keeney, D.R., Eds.; American Society of Agronomy Inc. and Soil Science Society of America Inc.: Madison, WI, USA, 1982; pp. 643–698. [Google Scholar]
  53. Ding, F.; Huang, Y.; Sun, W.; Jiang, G.; Chen, Y. Decomposition of Organic Carbon in Fine Soil Particles Is Likely More Sensitive to Warming Than in Coarse Particles: An Incubation Study with Temperate Grassland and Forest Soils in Northern China. PLoS ONE 2014, 9, e95348. [Google Scholar] [CrossRef] [Green Version]
  54. Shrestha, B.M.; Sitaula, B.K.; Singh, B.R.; Bajracharya, R.M. Fluxes of CO2 and CH4 in Soil Profiles of a Mountainous Watershed of Nepal as Influenced by Land Use, Temperature, Moisture and Substrate Addition. Nutr. Cycl. Agroecosyst. 2004, 68, 155–164. [Google Scholar] [CrossRef]
  55. Myhre, G.; Shindell, D.; Bréon, F.-M.; Collins, W.; Fuglestvedt, J.; Huang, J.; Koch, D.; Lamarque, J.-F.; Lee, D.; Mendoza, B.; et al. Anthropogenic and Natural Radiative Forcing. In Climate Change 2013: The Physical Science Basis. Contribution of Working Group I to the Fifth Assessment Report of the Intergovernmental Panel on Climate Change; Stocker, T.F., Qin, D., Plattner, G.-K., Tignor, M., Allen, S.K., Boschung, J., Nauels, A., Xia, Y., Bex, V., Midgley, P.M., Eds.; Cambridge University Press: Cambridge, UK; New York, NY, USA, 2013. [Google Scholar]
  56. RStudio Team. Rstudio: Integrated Development for R. Available online: http://www.rstudio.com/ (accessed on 5 July 2020).
  57. Grace, J.B. Structural Equation Modeling and Natural Systems; Cambridge University Press: Cambridge, UK, 2006. [Google Scholar]
  58. Lefcheck, J.S. Piecewisesem: Piecewise Structural Equation modelling in R for Ecology, Evolution, and Systematics. Methods Ecol. Evol. 2016, 7, 573–579. [Google Scholar] [CrossRef]
  59. Hamdi, S.; Moyano, F.; Sall, S.; Bernoux, M.; Chevallier, T. Synthesis Analysis of the Temperature Sensitivity of Soil Respiration from Laboratory Studies in Relation to Incubation Methods and Soil Conditions. Soil Biol. Biochem. 2013, 58, 115–126. [Google Scholar] [CrossRef]
  60. Ghimire, R.; Bista, P.; Machado, S. Long-Term Management Effects and Temperature Sensitivity of Soil Organic Carbon in Grassland and Agricultural Soils. Sci. Rep. 2019, 9, 12151. [Google Scholar] [CrossRef] [PubMed]
  61. Cai, Y.; Chang, S.X.; Ma, B.; Bork, E.W. Watering Increased DOC Concentration but Decreased N2O Emission from a Mixed Grassland Soil under Different Defoliation Regimes. Biol. Fertil. Soils 2016, 52, 987–996. [Google Scholar] [CrossRef]
  62. Fang, C.; Moncrieff, J.B. The Dependence of Soil CO2 Efflux on Temperature. Soil Biol. Biochem. 2001, 33, 155–165. [Google Scholar] [CrossRef]
  63. Wu, X.; Yao, Z.; Brüggemann, N.; Shen, Z.Y.; Wolf, B.; Dannenmann, M.; Zheng, X.; Butterbach-Bahl, K. Effects of Soil Moisture and Temperature on CO2 and CH4 Soil–Atmosphere Exchange of Various Land Use/Cover Types in a Semi-Arid Grassland in Inner Mongolia, China. Soil Biol. Biochem. 2010, 42, 773–787. [Google Scholar] [CrossRef]
  64. Zhou, W.; Hui, D.; Shen, W. Effects of Soil Moisture on the Temperature Sensitivity of Soil Heterotrophic Respiration: A Laboratory Incubation Study. PLoS ONE 2014, 9, e92531. [Google Scholar] [CrossRef]
  65. Smith, K.A.; Ball, T.; Conen, F.; Dobbie, K.E.; Massheder, J.; Rey, A. Exchange of Greenhouse Gases between Soil and Atmosphere: Interactions of Soil Physical Factors and Biological Processes. Eur. J. Soil Sci. 2003, 54, 779–791. [Google Scholar] [CrossRef] [Green Version]
  66. Stanley, P.L.; Rowntree, J.E.; Beede, D.K.; DeLonge, M.S.; Hamm, M.W. Impacts of Soil Carbon Sequestration on Life Cycle Greenhouse Gas Emissions in Midwestern USA Beef Finishing Systems. Agric. Syst. 2018, 162, 249–258. [Google Scholar] [CrossRef]
  67. Dowhower, S.L.; Teague, W.R.; Casey, K.D.; Daniel, R. Soil Greenhouse Gas Emissions as Impacted by Soil Moisture and Temperature under Continuous and Holistic Planned Grazing in Native Tallgrass Prairie. Agric. Ecosyst. Environ. 2020, 287, 106647. [Google Scholar] [CrossRef]
  68. Schuman, G.; Ingram, L.; Stahl, P.; Derner, J.; Vance, G.; Morgan, J. Influence of Management on Soil Organic Carbon Dynamics in Northern Mixed-Grass Rangeland. Soil Carbon Sequestration Greenh. Effect 2009, 57, 169–180. [Google Scholar]
  69. Ussiri, D.; Lal, R. Mitigation Options for Livestock and Pasture Lands. In Soil Emission of Nitrous Oxide and Its Mitigation; Springer: Berlin/Heidelberg, Germany, 2013; pp. 277–313. [Google Scholar]
  70. Oertel, C.; Matschullat, J.; Zurba, K.; Zimmermann, F.; Erasmi, S. Greenhouse Gas Emissions from Soils—A Review. Geochemistry 2016, 76, 327–352. [Google Scholar] [CrossRef] [Green Version]
  71. Zhuang, Q.; Chen, M.; Xu, K.; Tang, J.; Saikawa, E.; Lu, Y.; Melillo, J.M.; Prinn, R.G.; McGuire, A.D. Response of Global Soil Consumption of Atmospheric Methane to Changes in Atmospheric Climate and Nitrogen Deposition. Glob. Biogeochem. Cycles 2013, 27, 650–663. [Google Scholar] [CrossRef]
  72. Wnuk, E.; Walkiewicz, A.; Bieganowski, A. Methanogenesis and Aerobic Methanotrophy in Arable Soils Contaminated with Cadmium. CATENA 2020, 189, 104480. [Google Scholar] [CrossRef]
  73. Serrano-Silva, N.; Sarria-GuzmÁN, Y.; Dendooven, L.; Luna-Guido, M. Methanogenesis and Methanotrophy in Soil: A Review. Pedosphere 2014, 24, 291–307. [Google Scholar] [CrossRef]
  74. Horz, H.-P.; Rich, V.; Avrahami, S.; Bohannan, B.J.M. Methane-Oxidizing Bacteria in a California Upland Grassland Soil: Diversity and Response to Simulated Global Change. Appl. Environ. Microbiol. 2005, 71, 2642–2652. [Google Scholar] [CrossRef] [Green Version]
  75. Wang, D.; He, N.; Wang, Q.; LÜ, Y.; Wang, Q.; Xu, Z.; Zhu, J. Effects of Temperature and Moisture on Soil Organic Matter Decomposition Along Elevation Gradients on the Changbai Mountains, Northeast China. Pedosphere 2016, 26, 399–407. [Google Scholar] [CrossRef]
  76. Vaieretti, M.V.; Iamamoto, S.; Pérez Harguindeguy, N.; Cingolani, A.M. Livestock Grazing Affects Microclimate Conditions for Decomposition Process through Changes in Vegetation Structure in Mountain Grasslands. Acta Oecol. 2018, 91, 101–107. [Google Scholar] [CrossRef]
  77. Kirschbaum, M.U.F. The Temperature Dependence of Soil Organic Matter Decomposition, and the Effect of Global Warming on Soil Organic C Storage. Soil Biol. Biochem. 1995, 27, 753–760. [Google Scholar] [CrossRef]
  78. Naeth, M.A.; Bailey, A.W.; Pluth, D.J.; Chanasyk, D.; Hardin, R.T. Grazing Impacts on Litter and Soil Organic Matter in Mixed Prairie and Fescue Grassland Ecosystems of Alberta. J. Range Manag. 1991, 44, 7–12. [Google Scholar] [CrossRef] [Green Version]
  79. Piñeiro, G.; Paruelo, J.M.; Oesterheld, M.; Jobbágy, E.G. Pathways of Grazing Effects on Soil Organic Carbon and Nitrogen. Rangel. Ecol. Manag. 2010, 63, 109–119. [Google Scholar] [CrossRef]
  80. Parton, W.; Morgan, J.; Kelly, R.; Ojima, D.; Follett, R. Modeling Soil C Responses to Environmental Change in Grassland Systems. In The Potential of US Grazing Lands to Sequester Carbon and Mitigate the Greenhouse Effect; Lewis Publication: New York, NY, USA, 2000; pp. 371–398. [Google Scholar]
  81. Hartmann, A.A.; Buchmann, N.; Niklaus, P.A. A Study of Soil Methane Sink Regulation in Two Grasslands Exposed to Drought and N Fertilization. Plant Soil 2011, 342, 265–275. [Google Scholar] [CrossRef]
  82. Jacinthe, P.A.; Lal, R. Methane Oxidation Potential of Reclaimed Grassland Soils as Affected by Management. Soil Sci. 2006, 171. [Google Scholar] [CrossRef]
  83. Cenini, V.L.; Fornara, D.A.; McMullan, G.; Ternan, N.; Carolan, R.; Crawley, M.J.; Clément, J.-C.; Lavorel, S. Linkages between Extracellular Enzyme Activities and the Carbon and Nitrogen Content of Grassland Soils. Soil Biol. Biochem. 2016, 96, 198–206. [Google Scholar] [CrossRef] [Green Version]
  84. Xiao, W.; Chen, X.; Jing, X.; Zhu, B. A Meta-Analysis of Soil Extracellular Enzyme Activities in Response to Global Change. Soil Biol. Biochem. 2018, 123, 21–32. [Google Scholar] [CrossRef]
  85. Allison, S.D.; Vitousek, P.M. Responses of Extracellular Enzymes to Simple and Complex Nutrient Inputs. Soil Biol. Biochem. 2005, 37, 937–944. [Google Scholar] [CrossRef]
  86. Bork, E.W.; Dobert, T.F.; Grenke, J.S.J.; Carlyle, C.N.; Cahill, J.C.; Boyce, M.S. Comparative Pasture Management Regimes on Cattle Ranches with and without Adaptive Multi-Paddock (Amp) Grazing. Rangel. Ecol. Manag. submitted.
Figure 1. Left panels show effects of grazing and temperature on total fluxes of GHGs (mean ± SE) in a 102-day incubation experiment on soils from either adaptive multi-paddock (AMP) or conventional (non-AMP) grazing systems: (a) CO2-C, (b) N2O-N, (c) CH4-C, and (d) net GHG flux. Right panels show effects of grazing and moisture on total flux of GHGs: (e) CO2-C, (f) N2O-N, (g) CH4-C, and (h) net GHG flux. Negative values show the consumption of CH4 in the soil. Statistics in the inset box show an interaction between grazing and temperature on (a) CO2 flux and (d) net GHG flux (p < 0.05).
Agronomy 10 01781 g001
Figure 2. The proportion of SOC mineralized as CO2-C (mean ± SE) in soils from (a) adaptive multi-paddock (AMP) and conventional (non-AMP) grazing systems during a 102-day soil incubation under either (a) 5 °C or 25°C, or (b) at different moisture levels and subject to either 5 °C or 25 °C. Moisture levels were permanent wilting point (PWP), 40% of field capacity (0.4FC), and field capacity (FC). Statistics in inset boxes show the interaction between (a) grazing × temperature and (b) temperature × moisture (p < 0.05).
Agronomy 10 01781 g002
Figure 3. Structural equation models showing relationships between temperature, moisture, soil microbial properties, various extracellular enzyme activities, and fluxes of greenhouse gases (a) CO2, (b) CH4 and (c) N2O on either day 1 (top row), day 13 (middle row) and day 102 (bottom row) of the soil incubation. The green arrows depict a positive relationship, while red arrows depict a negative relationship on the response variable. Different thickness of arrows indicates the relative strength of the relationship between variables. Refer to text for enzyme names abbreviated in the figures.
Agronomy 10 01781 g003
Table 1. Summary of ANOVA, degree of freedom, F- and p- values for the cumulative flux of greenhouse gases (GHGs) during the 102-day long incubation period. p-values in bold are ≤0.05.
Response VariableFixed EffectDegree of Freedom¥F-Valuep-Value
Carbon dioxide (CO2)Grazing (G)1, 100.410.534
Temperature (T)1, 100555.63<0.001
Moisture (M)2, 100120.61<0.001
G × T1, 10010.060.020
G × M2, 1000.640.528
T × M2, 1001.130.326
G × M × T2, 1000.100.905
Nitrous oxide (N2O)G1, 100.330.578
T1, 10047.69<0.001
M2, 10045.21<0.001
G × T1, 1003.060.084
G × M2, 1000.420.660
T × M2, 1000.370.689
G × M × T2, 1000.440.645
Methane (CH4)G1, 106.810.026
T1, 10044.88<0.001
M2, 10024.65<0.001
G × T1, 1000.260.609
G × M2, 1000.680.510
T × M2, 1000.080.927
G × M × T2, 1000.160.852
Net GHG §G1, 100.390.547
T1, 100581.50<0.001
M2, 100122.82<0.001
G × T1, 10010.550.002
G × M2, 1000.640.528
T × M2, 1001.040.358
G × M × T2, 1000.110.898
Q10 (CO2) G1, 1012.190.006
M2, 407.270.002
G × M2, 400.680.514
Cmin/SOC G1, 100.950.354
T1, 100436.89<0.001
M2, 100110.22<0.001
G × T1, 1004.360.039
G × M2, 1001.690.190
T × M2, 10035.35<0.001
G × M × T2, 1000.350.703
¥ Degrees of freedom (numerator, denominator); § Net GHG = Resultant flux of greenhouse gases; Q10 = Temperature sensitivity of cumulative CO2 flux; Cmin/SOC = Percentage of soil organic C (SOC) mineralized as CO2-C.
Publisher’s Note: MDPI stays neutral with regard to jurisdictional claims in published maps and institutional affiliations.

