Article

Interactive Effects of Light and Nitrogen on Pakchoi (Brassica chinensis L.) Growth and Soil Enzyme Activity in an Underground Environment

State Key Laboratory of Hydraulics and Mountain River Engineering, College of Water Resource & Hydropower, Sichuan University, Chengdu 610065, China
*
Author to whom correspondence should be addressed.
Agronomy 2020, 10(11), 1772; https://doi.org/10.3390/agronomy10111772
Submission received: 17 October 2020 / Revised: 8 November 2020 / Accepted: 10 November 2020 / Published: 12 November 2020

Abstract

:
Light conditions and nitrogen fertilizer are crucial for plant growth, especially in the underground situations without sunlight and nitrogen deposition. In this paper, the effects of photoperiod (12 h and 16 h lighting time per day), light intensity (200, 300 and 400 μmol m−2 s−1) and nitrogen addition (0, 0.15, 0.3 and 0.45 g N kg−1 soil) on pakchoi growth and specific soil enzyme activity were investigated. The results demonstrated that there were strong interactive effects of light intensity and nitrogen addition on plant yield. The plant yield changed parabolically with increasing nitrogen addition when a light intensity was given between 200 and 300 μmol m−2 s−1, while the yield decreased linearly with increasing nitrogen application under the light intensity of 400 μmol m−2 s−1. The combination of 16 h photoperiod, 300 μmol m−2 s−1 light intensity and 0.3 g N kg−1 soil nitrogen addition was the best for pakchoi growth. The investigation of soil enzyme showed that the activity of urease responded negatively to nitrogen addition, whereas the activity of phosphatase had positive correlation with light intensity but was not affected by nitrogen addition. Our results suggested that the toxic effect of excessive nitrogen was a better explanation for the interactive effects of light and nitrogen than the plant-microbe interaction framework. The critical toxicity level of nitrogen for pakchoi was determined and showed negative correlation with light intensity.

1. Introduction

To meet the future challenges such as climate change, environment pollution and resource use, especially the potential agricultural resources limitation, an underground space utilization project has been launched to explore the feasibility of underground medicine and agriculture [1,2,3]. In underground agricultural production, the balance of crop yield and production costs can be achieved through the optimization of light and nutrient. It is therefore essential to study the effects of light and nutrient (here refers to nitrogen) on plant growth, and find an efficient light-nitrogen management for agricultural production in the underground environment.
Although most researches related to the influence of the light and nitrogen (N) on plant development have been conducted separately, the interaction between these two factors was also found and investigated for specific plants [4,5,6,7]. The study of Hernández et al. [6] showed an interactive effect of light and N on tomato (Solanum lycopersicum L.) growth that as the N dose (3, 7 and 14 mM) increased, the total fruit yield increased first, then decreased slightly under shade condition (60% natural light) while it kept increasing under natural light condition. The total fruit yield reached the maximum under the condition with natural light and 14 mM N. Stagnari et al. [5] found that the yield of lettuce (Lactuca sativa L.) changed parabolically with the N dose (0, 75, 150 and 300 kg N ha−1) under different light intensities (0, 50, 65 and 85% photosynthetically active radiation reduction). The harvested yield reached the maximum under the condition with 0.9% photosynthetically active radiation reduction (almost natural light) and 185 kg ha−1 N (moderate level). The differences in yield responding to light-nitrogen conditions between tomato and lettuce implied that the interactive effect could be species and variety specified.
A noteworthy light-nitrogen interaction in lettuce growth was proposed by Fu et al. [4] that as N dose (7, 15 and 23 mmol L−1) increased, the yield of lettuce increased under the low and moderate light intensity (60 and 140 μmol m−2 s−1) while it decreased under high light intensity (220 μmol m−2 s−1). The high light intensity and low N dose was the optimal combination for both yield and quality. Under high light intensity, the yield reduction induced by high N was ascribed to the toxic effect of high N dose [8]. However, the negative effect of N addition on plant growth was also observed even when N dose were under the toxicity level in most studies [9]. N addition aggravates the imbalance of N/P for plants, and ultimately leads to reduction in plant yield [10,11]. Hence, these inconsistent researches indicate that the mechanism is still unclear, where further investigations are needed.
As an important indicator of changes in soil biogeochemical cycling [12,13], soil enzymes could hydrolyze soil organic matters and release mineral nutrients that can be absorbed by plant root. This means that the soil nutrient availability could be affected by the soil enzyme activity. While some studies tried to explain the interaction between light and nitrogen from the aspect of plant physiology [4,14], rare of them has taken soil enzymes into account. It is therefore significant to reveal the interaction effects of light and N on plant growth considering soil enzymes.
Here we selected Pakchoi (Brassica chinensis L.), a traditional and popular cruciferous vegetable, as the target plant to conduct the underground agricultural experiments with different combinations of light condition and N supply. The objectives of this paper are to: (1) investigate the interactive effects of light and nitrogen on pakchoi growth considering soil enzymes; (2) propose an efficient light-nitrogen management for pakchoi growth in the underground environment.

2. Materials and Methods

2.1. Experimental Design

To investigate the interaction effect of light and N on the growth of pakchoi, two photoperiods, three levels of photosynthetic photon flux density (PPFD) and four N supply levels were included in our experiment. There were 24 treatments in total after the combination of these factors and the details of the treatments are shown in Table 1. Each of the treatments has three replications. The light resource was provided by white LED devices, which were automatically controlled to set the light intensity and photoperiod. The established N levels were manipulated by applying urea (46% N) solution at the 5th day after singling.
The experiment was carried out in the underground laboratory (3 m below ground) of Sichuan University (30°37′4′′ N, 104°04′32′′ E) from 20 April to 25 May 2019. The soil used in this study was the surface soil (0–10 cm) sampled from an agricultural field (30°25′00′′ N, 103°31′56′′ E) in Qionglai City, Sichuan Province, China. The soil samples were then air-dried and passed through 2 mm sieve. The soil was classified as silt loam using dry laser particle size analyzer (HELOS-RODOS, Sympatec GmbH, Clausthal-Zellerfeld, Germany). The physicochemical properties of the soil were measured according to Bao [15] and the relative data are shown in Table 2. The pakchoi seeds were soaked in distilled water for 6 h and seeds were then directly sown into each plastic pot (17.5 cm in height and 16 cm in diameter) containing 2.1 kg dry soil. Water was supplied every day to 80% of the field capacity to avoid water deficiency. Excessive seedlings were removed when the third true leaf emerged and three seedlings was left in each pot to grow for thirty days until harvest.
The environmental data including air pressure, temperature and humidity were collected by HOBO Micro Station (H21-USB, ONSET, Bourne, MA, USA). During the study period, the air pressure in the underground laboratory was 95 ± 0.4 KPa, while the ambient temperature ranged from 21 °C (night) to 25 °C (day), and the relative air humidity varied between 55% and 70%.

2.2. Plant Biomass and Chlorophyll Content Index

The third true leaf (fully expanded) of each individual plant was selected to determine the foliar Chlorophyll Content Index (CCI) [16]. CCI was measured using a nondestructive hand-held chlorophyll meter (CCM-200, Opti-Sciences, Tyngsboro, MA, USA) at the thirtieth day after singling. Then all the plants were harvested for biomass measurements. Fresh weight (FW) was measured by an electronic analytical balance (PR124ZH/E, OHAUS, Parsippany, NJ, USA), then the plant samples were dried at 105 °C for 1 h and 65 °C for another 48 h to determine the dry weight (DW).

2.3. Measurements of Soil Enzyme Activities

The rhizospheric soil was collected in the method referred to Chaparro et al. [17] for enzyme activity measurement after plants harvest. The activities of urease and acid phosphatase, which involved in N acquisition and P acquisition respectively, were determined using colorimetric methods.
The acid phosphatase enzyme activity was measured as follow: 4 mL of modified universal buffer (pH 6.5) and 1 mL of 4-Nitrophenylphosphoric acid disodium salt solution were added to 1 g air-dried soil for incubating at 37 °C for 1 h. Then 0.5 M CaCl2 and 0.5 M NaOH were added to the incubated solution followed by filtering. The filtered solutions were measured immediately using UV spectrophotometer (Yoke, Shanghai, China) at a wavelength of 420 nm [18].
The activity of urease was measured by incubating 5 g air-dried soil with 10 mL of 10% urea solution and 20 mL of citrate buffer (pH = 6.7) for 24 h at 37 °C. After being filtered, 1.35 M sodium phenoxide and 0.9% sodium hypochlorite were added to facilitate color development. Ammonium concentration was determined spectrophotometrically at 578 nm [19].

2.4. Theories Description

2.4.1. Toxic Effect Theory

Appropriate N addition favors the growth of plant, but excessive N addition can decrease the plant yield [20,21]. This negative effect of nutrient addition on plant primary production has been ascribed mainly to a potential toxic effect of N [22,23].
When NH4+ uptake exceeded the assimilation capacity and accumulated in the tissue, it can be harmful to plant [8]. High N content in plant tissue could impair plant photosynthetic function, lead to membrane dysfunction [24] and imbalance of C-N metabolism [25], and ultimately reduce plant yield. Previous studies have suggested that the critical toxicity level of N varied from plant species [26,27].

2.4.2. Plant-Microbe Interaction Framework

Capek et al. [9] provided a general conceptual framework of plant-microbe interactions considering the activity of the soil microorganisms and the level of cooperation with plants to explain the observed contrasting responses of primary production to nutrient addition.
The relative amount of available soil N and P is expressed as the molar ratio between available N and P in the soil (N/PSOIL), and the organism’s demand for these nutrients is expressed as the N/P critical ratio (N/PCR). In the following, N/ P CR plant denotes the plant N/PCR and N/ P CR mic denotes the N/PCR of the soil microbial community. When the organism critical ratio and N/PSOIL are equal, organisms experience optimal or balanced nutrition. When N/PSOIL is lower than the critical ratio, organism growth is N-limited; on the other hand when the N/PSOIL is higher than the critical ratio, the organism growth is P-limited. Addition of N or P to an organism whose growth is N or P-limited promotes growth and thus biomass production. Although plant and microorganisms experience the same N/PSOIL since they share the same pool of soil nutrients, their nutrient demand differs. N/ P CR plant is generally higher than N/ P CR mic along a gradient of N/PSOIL. Thus, plants require more N per unit of P than soil microorganisms and can be N-limited when soil microorganisms are P-limited. Based on the data from 51 factorial N-P fertilization experiments conducted in a range of ecosystems, soil microorganisms are considered P-limited at N/PSOIL above 6.3 (±1.0 s.e.m.) and plants are considered P-limited at N/PCR above 42.4 (±8.5 s.e.m.). Plants are therefore N-limited between N/PSOIL = 6.3 and 42.4, whereas soil microorganisms are P-limited.

2.5. Statistical Analysis

Three-way Analysis of Variance (ANOVA) was used to examine the effects of photoperiod, light intensity and N fertilization, and their interactions on all respective variables. Individual treatment means were statistically evaluated using Duncan’s multiple range test to identify whether they were significantly different at the 0.05 probability level. Linear and quadratic regression models were used to analyze the relationships between pakchoi dry weight and N addition under different light conditions. All statistical analysis was performed using the IBM SPSS Statistics 19 (SPSS, Chicago, IL, USA). Graphs are made by OriginPro 2016 (OriginLab, Northampton, MA, USA).

3. Results

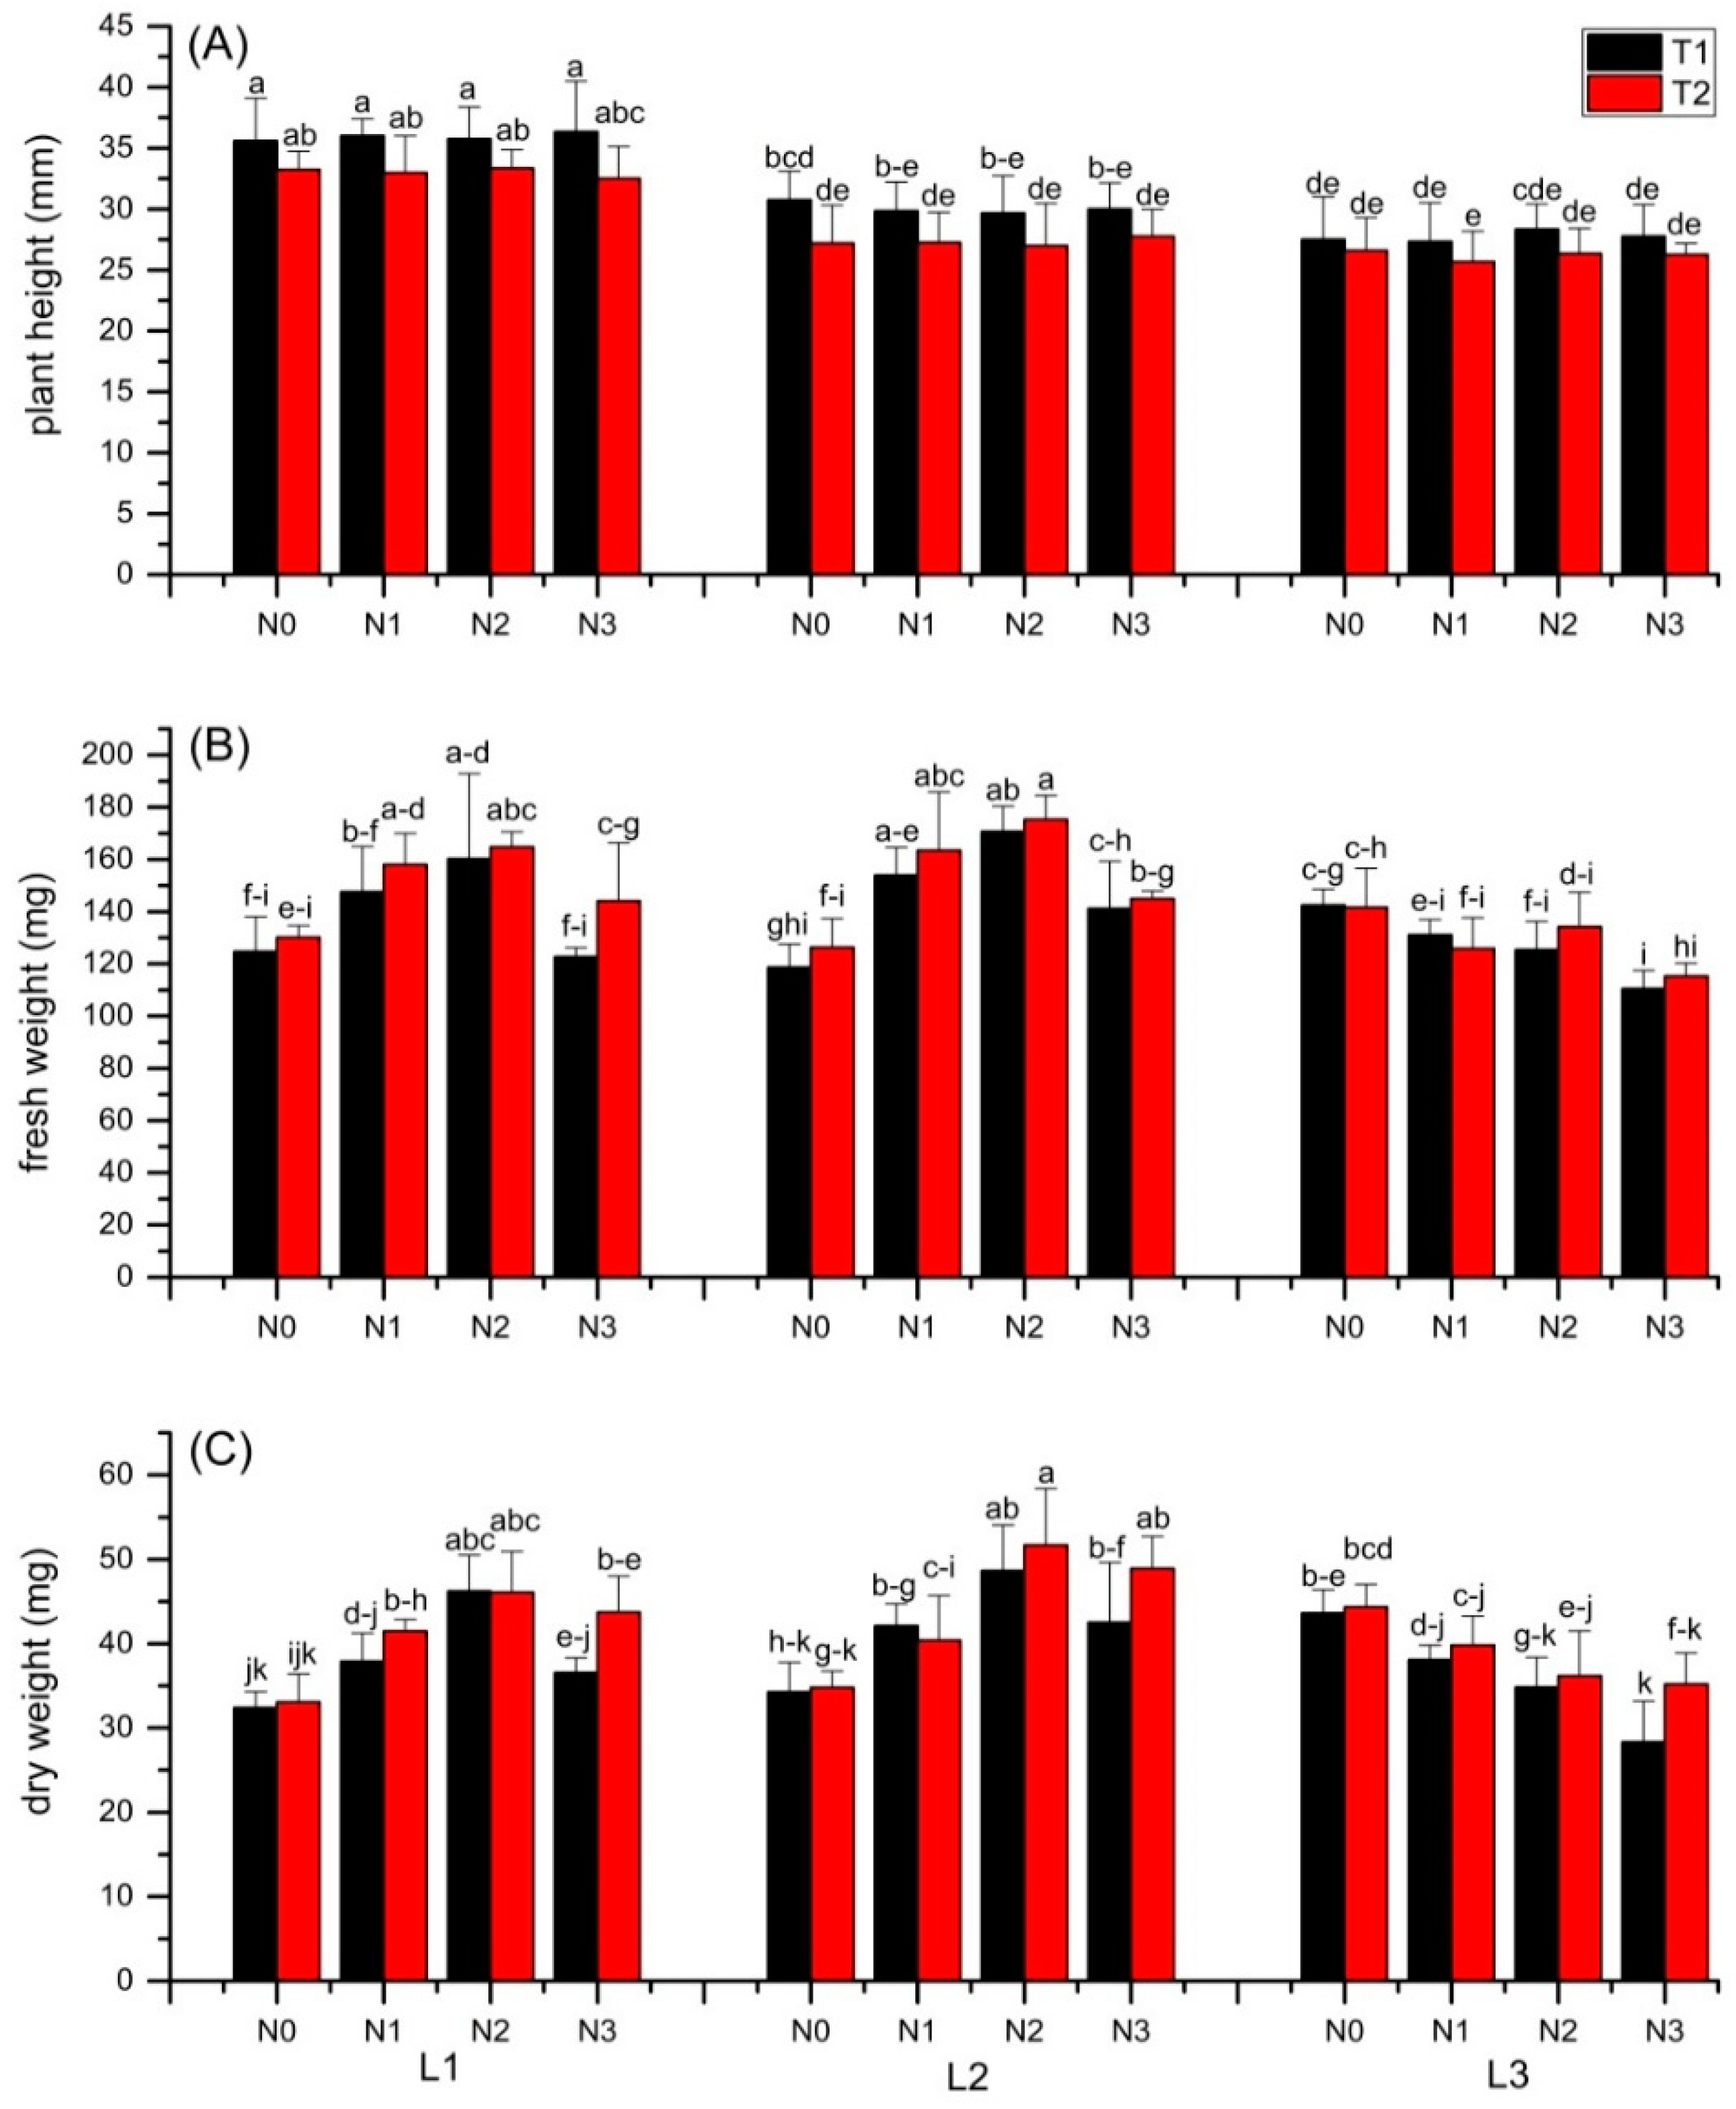
3.1. Plant Growth and Yield

Figure 1 presents the plant height, fresh weight and dry weight of pakchoi in different treatments. The height of pakchoi was found to be significantly affected by light conditions (Table 3). Plant height decreased with increasing light intensity. The average plant height under L1 light intensities were 20% and 28% higher than that under L2 and L3, respectively. Plant height also decreased under prolonged photoperiod. The average plant height under T2 photoperiod was 10% lower than that under T1 (Figure 1A). However, the results showed no obvious correlation between plant height and N addition (Table 3).
Strong interactive effects of light intensity and N addition on plant biomass were observed in this study (Table 3). At the light intensity of 200 and 300 μmol m−2 s−1, the dry biomass changed parabolically with increasing N addition (Figure 2A,B,D,E). The dry biomasses of pakchoi at N2 were 41% and 15% greater than that at N0 and N3 respectively at the light intensity of 200 μmol m−2 s−1, and were 45% and 10% greater than that at N0 and N3 at the light intensity of 300 μmol m−2 s−1. Interestingly, when light intensity increased to 400 μmol m−2 s−1, dry biomass decreased linearly with increasing N addition (Figure 2C,F). Our results suggested that the optimal N addition level for pakchoi under the light intensities of 200 and 300 μmol m−2 s−1 was around 0.3 g N kg−1 while the N addition of 0.15 g N kg−1 may exceed the optimal N demand of pakchoi at the light intensity of 400 μmol m−2 s−1. Besides, the dry weight of pakchoi under T2 was 7% higher than that under T1, which indicated the positive effect of photoperiod on the yield of pakchoi. In conclusion, the highest yield of pakchoi was observed under the combination of T2L2N2 (no significant difference from T1L2N2), while T1L3N3 induced the lowest yield. The fresh weight showed a similar trend with the dry weight in different treatments (Figure 1B,C).

3.2. Chlorophyll Content Index

CCI can be used to evaluate foliar chlorophyll content [28], and high CCI indicates high chlorophyll content in plant leaf. As shown in Table 3, CCI increased significantly (p < 0.05) with the increasing N addition. The N0 treatment induced the lowest CCI, while CCI increased by 30–50% in N3 treatment than that in N0 treatment (Figure 3).
Table 3 demonstrated that there was also significant impact of light intensity and photoperiod on CCI. The pakchoi under the 16 h photoperiod contained relatively higher CCI (7% on average) than that under the 12 h photoperiod, whereas CCI in the L1 treatment was on average 8% and 10% higher than that in L2 and L3, respectively (Figure 3).

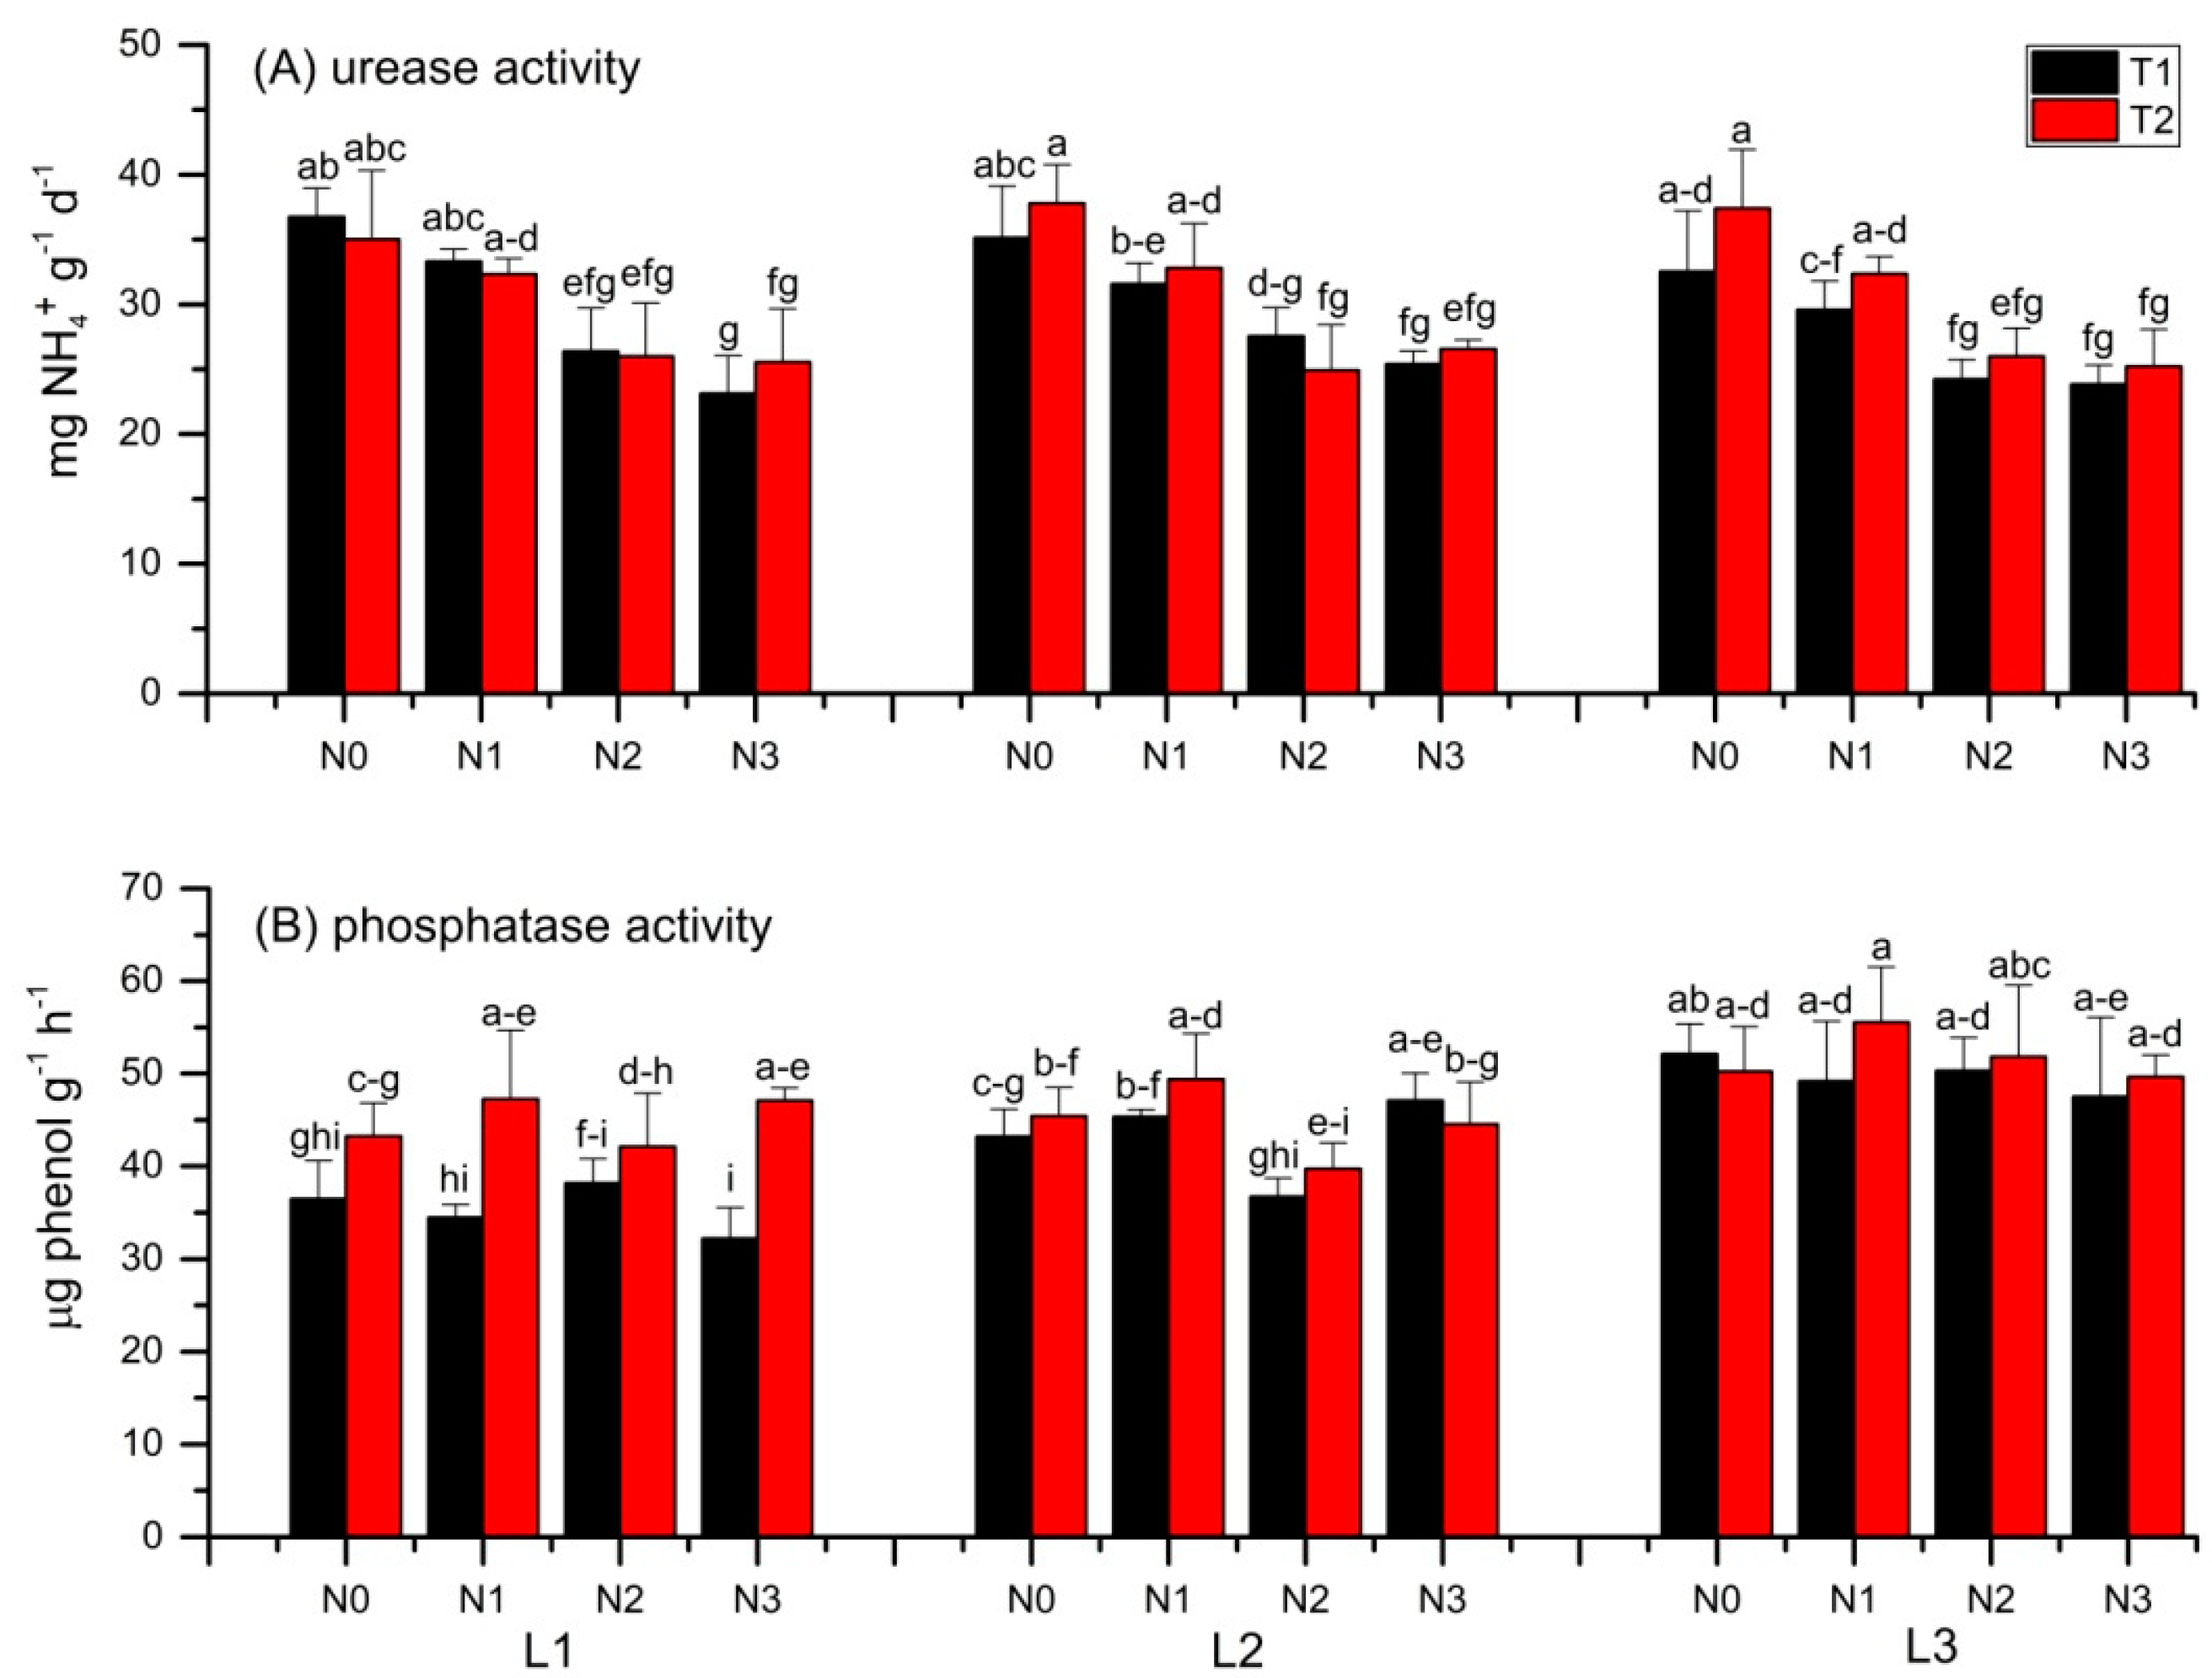
3.3. Soil Urease and Phosphatase Activities

Figure 4A shows the activity of soil urease in different treatments. Irrespective of the light conditions, the activity of urease significantly (p < 0.05) decreased with the increasing N addition. The N3 treatment induced the lowest urease activity which was 30% lower than that in the N0 treatment on average. No remarkable differences in the activities of urease were found among different light conditions.
Unlike the urease, the activity of phosphatase was influenced by the light condition (Table 3). Both of the increasing light intensity and the prolonged photoperiod enhanced the phosphatase activity (Figure 4B). The activity of phosphatase in the treatment of L3 was 27% and 16% higher than that in L1 and L2 respectively, and was 10% higher in T2 than that in T1. However, N addition had no significant impact on the activity of phosphatase.

4. Discussion

4.1. Effects of Light or N

Pakchoi height decreased with increasing light (Figure 1A). Similar phenomenon was also found in previous studies [29,30]. On one hand, many plants can express the shade-avoidance syndrome by growing taller to compete for light when exposed to low light intensity [31,32]. On the other hand, plant can also increase the chlorophyll content to cope with the shade since high chlorophyll content can help plant intercept the available light efficiently at low light intensity [33]. In our study, high chlorophyll content was not only observed at the low light intensity, but also detected at the high N addition (Figure 3). In fact, the synthesis of chlorophyll requires the participation of N. Moriwaki et al. [34] concluded that up to 2.5% of the total leaf N was allocated to chlorophyll biosynthesis, and therefore increasing N supply could promote leaf chlorophyll content. Besides, the study of Wang et al. [35] found that longer photoperiod could provide more time for high-efficiency chlorophyll biosynthesis and increase chlorophyll content.
The pakchoi yield was affected by both the light conditions (light intensity and photoperiod) and the N addition. Plant yield benefited from prolonged photoperiod (Figure 1C). Under a longer photoperiod, plants have more time for photosynthesis and may have higher net photosynthesis rate due to the increased CCI (Figure 3). Moreover, light exposure seemed to promote plant N uptake through transcriptional regulation of N uptake-related genes [36]. Taken together, a longer photoperiod may improve both the photosynthesis and the plant nutrition acquisition, resulting in higher plant yield.

4.2. Interactive Effects of Light and N

Strong interactive effects of light intensity and N addition on pakchoi yield were found that at the light intensities of 200 and 300 μmol m−2 s−1, appropriate N addition favored the yield, but excessive N addition reduced the yield (Figure 1C). However, the situation was different at the light intensity of 400μmol m−2 s−1 where a linear decrease in plant yield was found with increasing N. In fact, the negative (and counterintuitive) effects of nutrient addition beyond the optimum rate on plant primary production were frequently observed [37,38]. It is significant to determine the critical toxicity level before applying the toxic effect theory to explain the yield reduction, whereas the plant-microbe interaction framework can be applied regardless of the toxicity level. Here, both of the two theories were applied with the lack of determined toxicity level for pakchoi.

4.2.1. Toxic Effect of N

As shown in Figure 1C, regardless of the photoperiod, the plant achieved the optimal yield at N2 under L1 and L2, while the optimal yield was achieved at N0 under L3, which implied that the critical toxicity level of N for pakchoi was about 2.2 g N kg−1 (background value + N addition = 1.9 + 0.3 g N kg−1) under L1 and L2, and about 1.9 g N kg-1 under L3. Hence, more N was adsorbed by plants with N addition, resulting in production increase, till the critical toxicity level. Moreover, our results also showed that the critical toxicity level was negatively correlated to the light intensity. It has been reported that the ratio of in vitro ribulose-1,5-bisphosphate carboxylase activity to electron transport/photophosphorylation activity decreased with the increase of light intensity [14], suggesting that the optimal nitrogen dosage for plant under high light intensity is lower than that under low light intensity.

4.2.2. Plant-Microbe Interaction Effect of N

As shown in Table 4, the N/PSOIL s were all in the range of 10.4~12.6 at N0, which indicated that the plant was limited by N and the microorganisms was limited by P. When N addition increased to N1, the plant yield increased since the plant N limitation was alleviated by the N addition under L1 and L2. However, the N/ P CR plant is not a constant value due to the impact of light. Under high light intensity, the optimal nitrogen amount for plant was lower than that under low light intensity [14]. Moreover, previous study showed that the critical soil available P value for plant aboveground biomass was higher under high light than low light [39]. Hence, the potential N/ P CR plant will decrease with the increasing light intensity. When N/PSOIL increased above the relatively low N/ P CR plant under L3, P became limiting for both plants and soil microorganisms. The more N is added, the more limiting P becomes (Figure 5), leading to increased plant-microbe competition. Microorganisms may decrease the availability of P for plants by P immobilization in the microbial biomass, decomposition of P-mobilizing organic compounds released by roots, and counteracting root-induced pH decrease by proton consumption during ammonification to compete the limited P with plant, resulting in plant yield reduction [40]. When N addition increased to N3, the N/PSOIL s (31.1~35.3) increased above the N/ P CR plant under L1 and L2, leading to the similar yield reduction as under L3. Meanwhile, plant yield declined further with the more severe P limitation induced by N addition under L3.

4.3. Urease and Phosphatase Activity

As the only N source in our study, the added urea is unable to be utilized directly by plants, and urease is the enzyme that can catalyze the hydrolysis of urea [41]. A negative response of urease activity to N addition was observed in our study (Figure 4A). Previous study showed that soil microbes suffer from N limitation under low N treatment [42] and release more urease to facilitate N acquisition, resulting in higher urease activity [43]. Besides, N addition was found to aggravate microbial carbon limitation [44], causing an imbalance of C/N, and a relatively lower urease activity was helpful to avoid severe imbalance of C/N [42,44] under high N treatment.
The activity of extracellular phosphatases in soil has been reported many times to be positively correlated with N fertilization across different ecosystems [43,45]. As explained by the plant-microbe interaction framework, the N/PSOIL increased with the N addition, resulting in the transfer from N-limitation to P-limitation for plants, and the more serious P-limitation for microorganisms. Hence, high phosphatase activity in high N treatment was expected since more phosphatases were produced by plants and microorganisms to alleviate the P-limitation. However, the phosphatase activity showed no response to N addition in our study. The inconsistence between measurement and prediction indicated that plants might not be suffering P-limitation at all. Hence, rather than the imbalance of N and P resulting from excess N addition, the studies we identified that show negative responses to N were more consistent with the toxic effect.
Both of the urease and phosphatase can be produced by plants and microorganisms, e.g., microbes are capable of producing both acid and alkaline phosphatases, plants can only produce acid phosphatases [46,47,48]. In our study, the urease activity showed no response to light conditions, whereas the phosphatase activity was positively correlated to light intensity and photoperiod (Figure 4). The photosynthesis of plant increasing with light intensity till light saturation point induces more nutrient requirement, which could stimulate plant root to produce more enzymes or more rhizosphere exudates to enhance the extracellular enzyme production. This means that enzymes produced by plants could have positive correlation with light intensity. However, most microorganisms in soils are not exposed to light, and moreover are heterotrophs that cannot use energy from light, which implies that enzymes produced by microorganisms have no response to light intensity. Hence, we can make a reasonable speculation that the urease is mainly produced by microorganisms while the acid phosphatase is primarily produced by plants.

5. Conclusions

In this study, we investigated the influence of different light conditions and nitrogen additions on pakchoi growth and specific soil enzyme activities in an underground environment. Strong interactive effects of light intensity and nitrogen addition on pakchoi yield were observed. Under the light intensity of 200 and 300 μmol m−2 s−1, the plant yield firstly increased with increasing nitrogen addition then decreased when excessive nitrogen was added. However, the plant yield decreased linearly with nitrogen addition under high light intensity of 400 μmol m−2 s−1. Furthermore, a longer photoperiod could benefit plant yield through increasing chlorophyll content and enhanced nutrition acquisition. The combination of 16 h photoperiod, 300 μmol m−2 s−1 light intensity and 0.3 g N kg−1 soil nitrogen addition induced the highest yield for pakchoi. This result could provide a guide to the pakchoi planting in greenhouse or underground space. Both of the toxic effect of excessive N and plant-microbe interaction framework explained the interactive effect of light and N well. However, the soil enzyme investigation showed that the phosphatase activity had no response and positive response to N addition and light intensity respectively, suggesting that the toxic effect of excess N was more proper for our study. However, recent mechanisms are still far from clear, and more comprehensive studies including effects of soil P and C pools and relevant microbial dynamic to nutrient addition are needed to strengthen the findings.

Author Contributions

Conceptualization, S.L., C.L. and X.T.; investigation, S.L.; methodology, C.L. and X.T.; writing–original draft, S.L.; writing–review and editing, X.T.; supervision, B.T., Y.H. and N.L.; funding acquisition, C.L. and X.T. All authors have read and agreed to the published version of the manuscript.

Funding

This research was funded by the Major Scientific and Technological Special Program of Sichuan Province, China, grant number 2018SZDZX0027 and Key Research and Development Program of Sichuan Province, China, grant number 2016FZ0111, 2018SZ0279, 2019YFN0153.

Conflicts of Interest

The authors declare no conflict of interest.

References

  1. Liu, J.F. History, advancements, and perspective of biological research in deep-underground laboratories: A brief review. Environ. Int. 2018, 120, 207–214. (In English) [Google Scholar] [CrossRef]
  2. Xie, H.P.; Gao, M.Z.; Zhang, R.; Xu, H.; Wang, Y.; Deng, J.H. The subversive idea and its key technical prospect on underground ecological city and ecosystem. Chin. J. Rock Mech. Eng. 2017, 36, 1301–1313. [Google Scholar]
  3. Xie, H.; Zhang, Y.; Chen, Y.; Peng, Q.; Liao, Z.; Zhu, J. A case study of development and utilization of urban underground space in Shenzhen and the Guangdong-Hong Kong-Macao Greater Bay Area. Tunn. Undergr. Space Technol. 2021, 107, 103651. [Google Scholar] [CrossRef]
  4. Fu, Y.M. Interaction effects of light intensity and nitrogen concentration on growth, photosynthetic characteristics and quality of lettuce (Lactuca sativa L. Var. youmaicai). Sci. Hortic. 2017, 214, 51–57. (In English) [Google Scholar] [CrossRef]
  5. Stagnari, F.; Galieni, A.; Pisante, M. Shading and nitrogen management affect quality, safety and yield of greenhouse-grown leaf lettuce. Sci. Hortic. 2015, 192, 70–79. [Google Scholar] [CrossRef]
  6. Hernández, V.; Hellín, P.; Fenoll, J.; Flores, P. Interaction of nitrogen and shading on tomato yield and quality. Sci. Hortic. 2019, 255, 255–259. [Google Scholar] [CrossRef]
  7. Li, Y.; Yang, S.Y.; Hao, D.Y.; Su, Y.H. Effects of light and nitrogen interaction on carbon-nitrogen metabolism of Arabidopsis thaliana col-0 and mutant CS3721512. J. Nanjing Agric. Univ. 2018, 41, 873–880. [Google Scholar]
  8. Zhou, X.-J.; Liang, Y.; Chen, H.; Shen, S.-H.; Jing, Y.-X. Effects of rhizobia inoculation and nitrogen fertilization on photosynthetic physiology of soybean. Photosynthetica 2006, 44, 530–535. [Google Scholar] [CrossRef]
  9. Capek, P. A plant-microbe interaction framework explaining nutrient effects on primary production. Nat. Ecol. Evol. 2018, 2, 1588–1596. (In English) [Google Scholar] [CrossRef] [Green Version]
  10. Gusewell, S. High nitrogen: Phosphorus ratios reduce nutrient retention and second-year growth of wetland sedges. New Phytol. 2005, 166, 537–550. (In English) [Google Scholar] [CrossRef]
  11. Venterink, H.O.; Gusewell, S. Competitive interactions between two meadow grasses under nitrogen and phosphorus limitation. Funct. Ecol. 2010, 24, 877–886. (In English) [Google Scholar] [CrossRef]
  12. Dick, W.A.; Tabatabai, W.A. Significance and Potential Use of Soil Enzymes; Soil Microbial Ecology. Marcel Dekker Inc.: New York, NY, USA, 1993; pp. 95–127. [Google Scholar]
  13. Burns, R.G.; Deforest, J.L.; Marxsen, J.; Sinsabaugh, R.L.; Stromberger, M.E.; Wallenstein, M.D.; Weintraub, M.N.; Zoppini, A. Soil enzymes in a changing environment: Current knowledge and future directions. Soil Biol. Biochem. 2013, 58, 216–234. [Google Scholar] [CrossRef]
  14. Terashima, I.; Evans, J.R. Effects of Light and Nitrogen Nutrition on the Organization of the Photosynthetic Apparatus in Spinach. Plant Cell Physiol. 1988, 29, 143–155. [Google Scholar]
  15. Bao, S.D. Soil Agrochemical Analysis; China Agriculture Press: Beijing, China, 2000. [Google Scholar]
  16. Fitzgerald, G.J.; Rodriguez, D.; O’Leary, G. Measuring and predicting canopy nitrogen nutrition in wheat using a spectral index—The canopy chlorophyll content index (CCCI). Field Crop. Res. 2010, 116, 318–324. [Google Scholar] [CrossRef]
  17. Chaparro, J.M.; Badri, D.V.; Vivanco, J.M. Rhizosphere microbiome assemblage is affected by plant development. ISME J. 2014, 8, 790–803. [Google Scholar] [CrossRef] [Green Version]
  18. Tabatabai, M.A. Soil enzymes. In Soil Science Society of America, Book Series; John Wiley & Sons, Ltd.: Madison, WI, USA, 1994; pp. 775–833. [Google Scholar]
  19. Klose, S.; Tabatabai, M. Urease activity of microbial biomass in soils. Soil Biol. Biochem. 1999, 31, 205–211. [Google Scholar] [CrossRef]
  20. Gao, N.; Liu, Y.; Wu, H.; Zhang, P.; Yu, N.; Zhang, Y.; Zou, H.; Fan, Q.; Zhang, Y. Interactive effects of irrigation and nitrogen fertilizer on yield, nitrogen uptake, and recovery of two successive Chinese cabbage crops as assessed using 15N isotope. Sci. Hortic. 2017, 215, 117–125. [Google Scholar] [CrossRef]
  21. Aydinsakir, K.; Karaca, C.; Ozkan, C.F.; Dinc, N.; Buyuktas, D.; Isik, M. Excess nitrogen exceeds the european standards in lettuce grown under greenhouse conditions. Agron. J. 2019, 111, 764–769. [Google Scholar] [CrossRef]
  22. Gunnarsson, U.; Ydin, H.R. Nitrogen fertilization reduces Sphagnum production in bog communities. New Phytol. 2000, 147, 527–537. [Google Scholar] [CrossRef]
  23. Lucassen, E.; Bobbink, R.; Smolders, A.; Van Der Ven, P.; Lamers, L.; Roelofs, J. Interactive effects of low pH and high ammonium levels responsible for the decline of Cirsium dissectum (L.) Hill. Plant Ecol. 2003, 165, 45–52. [Google Scholar] [CrossRef]
  24. Krupa, S. Effects of atmospheric ammonia (NH3) on terrestrial vegetation: A review. Environ. Pollut. 2003, 124, 179–221. [Google Scholar] [CrossRef]
  25. Shi, D.; Zhuang, K.; Chen, Y.; Xu, F.; Hu, Z.; Shen, Z. Effects of excess ammoniacal nitrogen (NH4+-N) on pigments, photosynthetic rates, chloroplast ultrastructure, proteomics, formation of reactive oxygen species and enzymatic activity in submerged plant Hydrilla verticillata (L.f.) Royle. Aquat. Toxicol. 2020, 226, 105585. [Google Scholar] [CrossRef] [PubMed]
  26. Esteban, R.; Ariz, I.; Cruz, C.; Moran, J.F. Review: Mechanisms of ammonium toxicity and the quest for tolerance. Plant Sci. 2016, 248, 92–101. [Google Scholar] [CrossRef] [PubMed] [Green Version]
  27. Domínguez-Valdivia, M.D.; Aparicio-Tejo, P.M.; Lamsfus, C.; Cruz, C.; Martins-Loução, M.A.; Moran, J.F. Nitrogen nutrition and antioxidant metabolism in ammonium-tolerant and -sensitive plants. Physiol. Plant. 2008, 132, 359–369. [Google Scholar] [CrossRef]
  28. Richardson, A.D.; Duigan, S.P.; Berlyn, G.P. An evaluation of noninvasive methods to estimate foliar chlorophyll content. New Phytol. 2002, 153, 185–194. [Google Scholar] [CrossRef] [Green Version]
  29. Feng, L.; Raza, M.A.; Li, Z.; Chen, Y.; Bin Khalid, M.H.; Du, J.; Liu, W.; Wu, X.; Song, C.; Yu, L.; et al. The Influence of Light Intensity and Leaf Movement on Photosynthesis Characteristics and Carbon Balance of Soybean. Front. Plant Sci. 2019, 9, 16. [Google Scholar] [CrossRef]
  30. Fan, X.-X.; Xu, Z.-G.; Liu, X.-Y.; Tang, C.-M.; Wang, L.-W.; Han, X.-L. Effects of light intensity on the growth and leaf development of young tomato plants grown under a combination of red and blue light. Sci. Hortic. 2013, 153, 50–55. [Google Scholar] [CrossRef]
  31. Franklin, K.A. Shade avoidance. New Phytol. 2010, 179, 930–944. [Google Scholar] [CrossRef]
  32. Gommers, C.M.; Visser, E.J.; Onge, K.R.S.; Voesenek, L.A.; Pierik, R. Shade tolerance: When growing tall is not an option. Trends Plant Sci. 2013, 18, 65–71. [Google Scholar] [CrossRef]
  33. Valladares, F.; Niinemets, U. Shade Tolerance, a Key Plant Feature of Complex Nature and Consequences. Annu. Rev. Ecol. Evol. Syst. 2008, 39, 237–257. [Google Scholar] [CrossRef] [Green Version]
  34. Moriwaki, T.; Falcioni, R.; Tanaka, F.A.O.; Cardoso, K.A.K.; Souza, L.; Benedito, E.; Nanni, M.; Bonato, C.M.; Antunes, W.C. Nitrogen-improved photosynthesis quantum yield is driven by increased thylakoid density, enhancing green light absorption. Plant Sci. 2019, 278, 1–11. [Google Scholar] [CrossRef] [PubMed]
  35. Wang, Z.; Hong, X.; Hu, K.; Wang, Y.; Wang, X.; Du, S.; Li, Y.; Hu, D.; Cheng, K.; An, B.; et al. Impaired Magnesium Protoporphyrin IX Methyltransferase (ChlM) Impedes Chlorophyll Synthesis and Plant Growth in Rice. Front. Plant Sci. 2017, 8, 1694. [Google Scholar] [CrossRef] [PubMed] [Green Version]
  36. Sakuraba, Y.; Yanagisawa, S. Light signalling-induced regulation of nutrient acquisition and utilisation in plants. Semin. Cell Dev. Biol. 2018, 83, 123–132. [Google Scholar] [CrossRef] [PubMed]
  37. Gotelli, N.J.; Ellison, A.M. Nitrogen deposition and extinction risk in the northern pitcher plant, sarracenia purpurea. Ecology 2002, 83, 2758–2765. [Google Scholar] [CrossRef]
  38. Carroll, J.A.; Caporn, S.J.M.; Johnson, D.; Morecroft, M.D.; Lee, J.A. The interactions between plant growth, vegetation structure and soil processes in semi-natural acidic and calcareous grasslands receiving long-term inputs of simulated pollutant nitrogen deposition. Environ. Pollut. 2003, 121, 363–376. [Google Scholar] [CrossRef]
  39. Zhou, T.; Wang, L.; Sun, X.; Wang, X.; Chen, Y.; Rengel, Z.; Liu, W.-G.; Yang, W. Light intensity influence maize adaptation to low P stress by altering root morphology. Plant Soil 2019, 447, 183–197. [Google Scholar] [CrossRef]
  40. Marschner, P.; Crowley, D.; Rengel, Z. Rhizosphere interactions between microorganisms and plants govern iron and phosphorus acquisition along the root axis—model and research methods. Soil Biol. Biochem. 2011, 43, 883–894. [Google Scholar] [CrossRef]
  41. Pettit, N.; Smith, A.; Freedman, R.; Burns, R. Soil urease: Activity, stability and kinetic properties. Soil Biol. Biochem. 1976, 8, 479–484. [Google Scholar] [CrossRef]
  42. Mooshammer, M.; Wanek, W.; Hämmerle, I.; Fuchslueger, L.; Hofhansl, F.; Knoltsch, A.; Schnecker, J.; Takriti, M.; Watzka, M.; Wild, B.; et al. Adjustment of microbial nitrogen use efficiency to carbon:nitrogen imbalances regulates soil nitrogen cycling. Nat. Commun. 2014, 5, 3694. [Google Scholar] [CrossRef]
  43. Olander, L.P.; Vitousek, P.M. Regulation of soil phosphatase and chitinase activity by N and P availability. Biogeochem. 2000, 49, 175–191. [Google Scholar] [CrossRef]
  44. Chen, H.; Li, D.; Zhao, J.; Zhang, W.; Xiao, K.; Wang, K. Nitrogen addition aggravates microbial carbon limitation: Evidence from ecoenzymatic stoichiometry. Geoderma 2018, 329, 61–64. [Google Scholar] [CrossRef]
  45. Widdig, M.; Schleuss, P.-M.; Weig, A.R.; Guhr, A.; Biederman, L.A.; Borer, E.T.; Crawley, M.J.; Kirkman, K.P.; Seabloom, E.W.; Wragg, P.D.; et al. Nitrogen and Phosphorus Additions Alter the Abundance of Phosphorus-Solubilizing Bacteria and Phosphatase Activity in Grassland Soils. Front. Environ. Sci. 2019, 7. [Google Scholar] [CrossRef] [Green Version]
  46. Playsted, C.W.S.; Johnston, M.E.; Ramage, C.M.; Edwards, D.G.; Cawthray, G.R.; Lambers, H. Functional significance of dauciform roots: Exudation of carboxylates and acid phosphatase under phosphorus deficiency in Caustis blakei (Cyperaceae). New Phytol. 2006, 170, 491–500. [Google Scholar] [CrossRef] [PubMed]
  47. Nannipieri, P.; Giagnoni, L.; Landi, L.; Renella, G. Role of Phosphatase Enzymes in Soil. Soil Biol. 2011, 215–243. [Google Scholar] [CrossRef]
  48. Klose, S.; Tabatabai, M.A. Urease activity of microbial biomass in soils as affected by cropping systems. Biol. Fertil. Soils 2000, 31, 191–199. [Google Scholar] [CrossRef]
Figure 1. Plant height (A), fresh weight (B) and dry weight (C) of pakchoi under different treatments. Error bars represent the standard error of the means (n = 3). Bars with different lowercase letters are significantly different according to the Duncan test at p < 0.05. T, L, and N represents photoperiod, photosynthetic photon flux density, and nitrogen supply respectively.
Agronomy 10 01772 g001
Figure 2. Relationships between pakchoi dry weight and N addition under different light conditions of T1L1(A), T1L2(B), T1L3(C), T2L1(D), T2L2(E), T2L3(F). Regression equation, R2 and root mean square error (RMSE) are also presented.
Agronomy 10 01772 g002
Figure 3. CCI of pakchoi leaves in different treatments. Error bars represent the standard error of the means (n = 3). Bars with different letters lowercase are significantly different according to the Duncan test at p < 0.05.
Agronomy 10 01772 g003
Figure 4. The activities of soil urease (A) and phosphatase (B) in different treatments. Error bars represent the standard error of the means (n = 3). Bars with different letters lowercase are significantly different according to the Duncan test at p < 0.05.
Agronomy 10 01772 g004
Figure 5. Conceptual scheme of plant-microbe interactions based on plant and microbial N/PCR. Plant demand for P (in relation to N demand) is lower than microbial demand for P. (A) pakchoi suffered N limitation and microorganisms suffered P limitation at N/PSOIL between plant and microbial N/PCR; (B) pakchoi and microorganisms shared P limitation when N/ P CR plant decreased with light intensity.
Agronomy 10 01772 g005
Table 1. Details of the treatments.
Photoperiod (T)PPFD (L)Nitrogen Supply (N)
T1: 12-h light,12-h darkL1: 200 μmol m−2 s−1
L2: 300 μmol m−2 s−1
L3: 400 μmol m−2 s−1
N0: 0 g N kg−1
N1: 0.15 g N kg−1
T2:16-h light, 8-h darkN2: 0.3 g N kg−1
N3: 0.45 g N kg−1
Abbreviations: T = Photoperiod, L = Photosynthetic photon flux density, N = Nitrogen supply. For example, the combination T1L1N1 means a photoperiod of 12-h light a day with the light intensity of 200 μmol m−2 s-1, and the soil was fertilized with 0.15 g N kg-1. PPFD denotes photosynthetic photon flux density.
Table 2. Soil physicochemical properties.
Soil Bulk
Density
Field CapacitypHElectrical ConductivityOrganic CarbonTotal N ContentTotal P ContentTotal K Content
1.12 g/cm340.72%6.58219 μS/cm27.69 g kg−11.90 g kg−10.62 g kg−114.03 g kg−1
Table 3. Three-way ANOVA indicating the effects of independent variables (photoperiod, light intensity and N fertilization) and their interactions on dependent variables with significant p < 0.05. n.s. represents no significant difference at the 5% level. CCI denotes chlorophyll content index.
TreatmentPlant HeightFresh WeightDry WeightCCIUrease ActivityPhosphatase Activity
T<0.00010.03920.00850.0299n.s.<0.0001
L<0.0001<0.0001<0.00010.0263n.s.<0.0001
Nn.s.<0.0001<0.0001<0.0001<0.0001n.s.
TLn.s.n.s.n.s.n.s.n.s.0.0039
TNn.s.n.s.n.s.n.s.n.s.n.s.
LNn.s.<0.0001<0.0001n.s.n.s.n.s.
TLNn.s.n.s.n.s.n.s.n.s.n.s.
Table 4. The available N and P in soils and the molar ratio of N and P in soils (N/PSOIL).
L1L2L3
N0N1N2N3N0N1N2N3N0N1N2N3
T1N (mg kg−1)80.7(±11.5)131.1(±16.9)182.5(±26.8)248.3(±17.2)73.3(±7.0)126.5(±8.7)167.5(±16.5)230.1(±19.4)87.2(±26.5)122.7(±11.7)193.7(±14.9)243.1(±25.2)
P (mg kg−1)16.3(±0.7)15.7(±0.7)16.0(±0.7)15.6(±0.1)15.6(±0.5)16.3(±0.3)15.7(±0.4)16.1(±0.9)16.0(±0.8)15.7(±0.4)15.8(±1.0)16.6(±0.9)
N/PSOIL11.0(±1.5)18.5(±2.6)25.2(±5.0)35.3(±2.6)10.4(±1.2)17.2(±1.5)23.6(±2.8)31.6(±2.4)12.1(±4.4)17.3(±2.0)27.2(±2.4)32.4(±5.0)
T2N (mg kg−1)85.4(±21.8)113.4(±9.1)173.1(±8.7)225.4(±33.7)90.1(±18.5)113.4(±21.8)165.7(±29.5)242.2(±12.7)88.2(±7.9)145.1(±8.0)194.6(±23.9)238.6(±13.0)
P (mg kg−1)15.6(±0.6)15.9(±0.4)16.5(±1.6)16.1(±0.4)16.0(±0.6)15.5(±0.3)16.0(±0.2)15.9(±0.5)15.5(±0.6)15.9(±0.5)15.5(±0.6)16.0(±0.2)
N/PSOIL12.1(±2.8)15.8(±1.7)23.3(±2.1)31.1(±3.9)12.4(±2.5)16.2(±3.0)22.9(±3.9)33.8(±2.8)12.6(±1.5)20.2(±0.7)27.9(±2.3)33.0(±2.2)
Publisher’s Note: MDPI stays neutral with regard to jurisdictional claims in published maps and institutional affiliations.

