Primary, Secondary Metabolites and Molecular Characterization of Hawthorn (Crataegus spp.) Genotypes


Abstract
:1. Introduction
2. Materials and Methods
2.1. Plant Materials
2.2. Extraction of Organic Acids
2.3. Extraction of Phenolics
2.4. Determination of Pomological Properties of Fruits
2.5. Molecular Characterization
2.6. Statistical Analysis
3. Results and Discussion
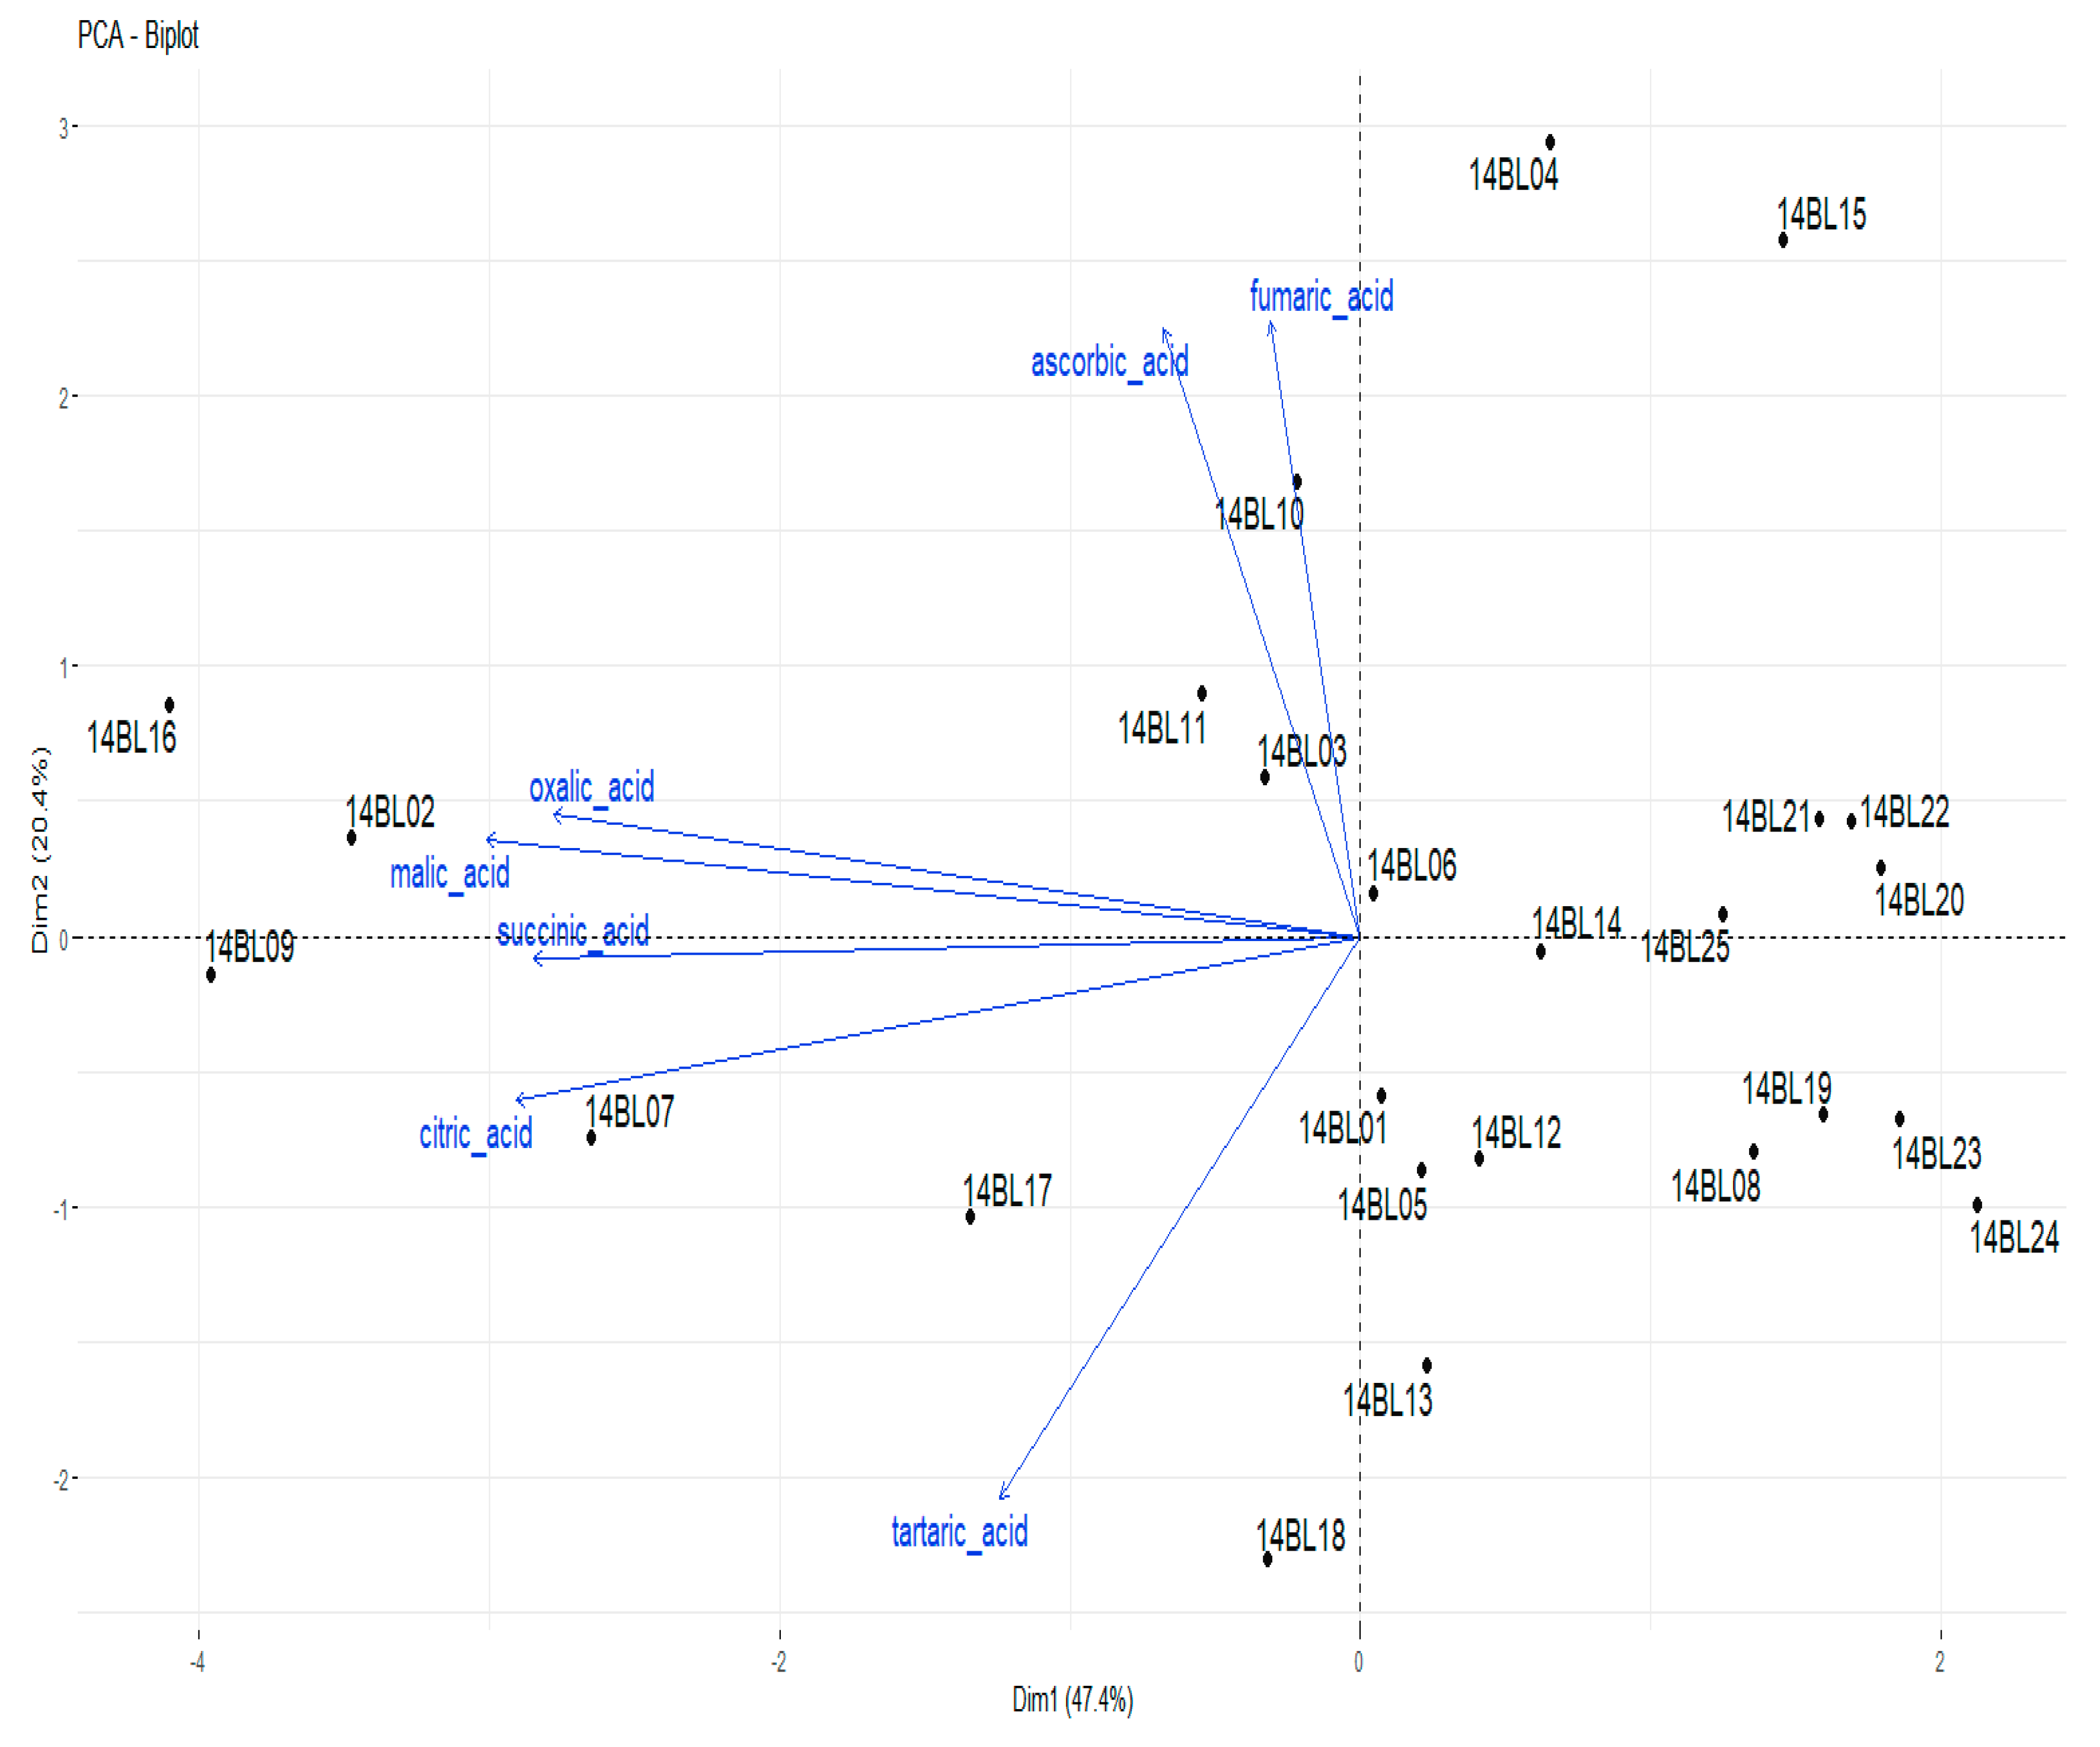
3.1. Organic Acid Contents
3.2. Phenolic Compound Contents
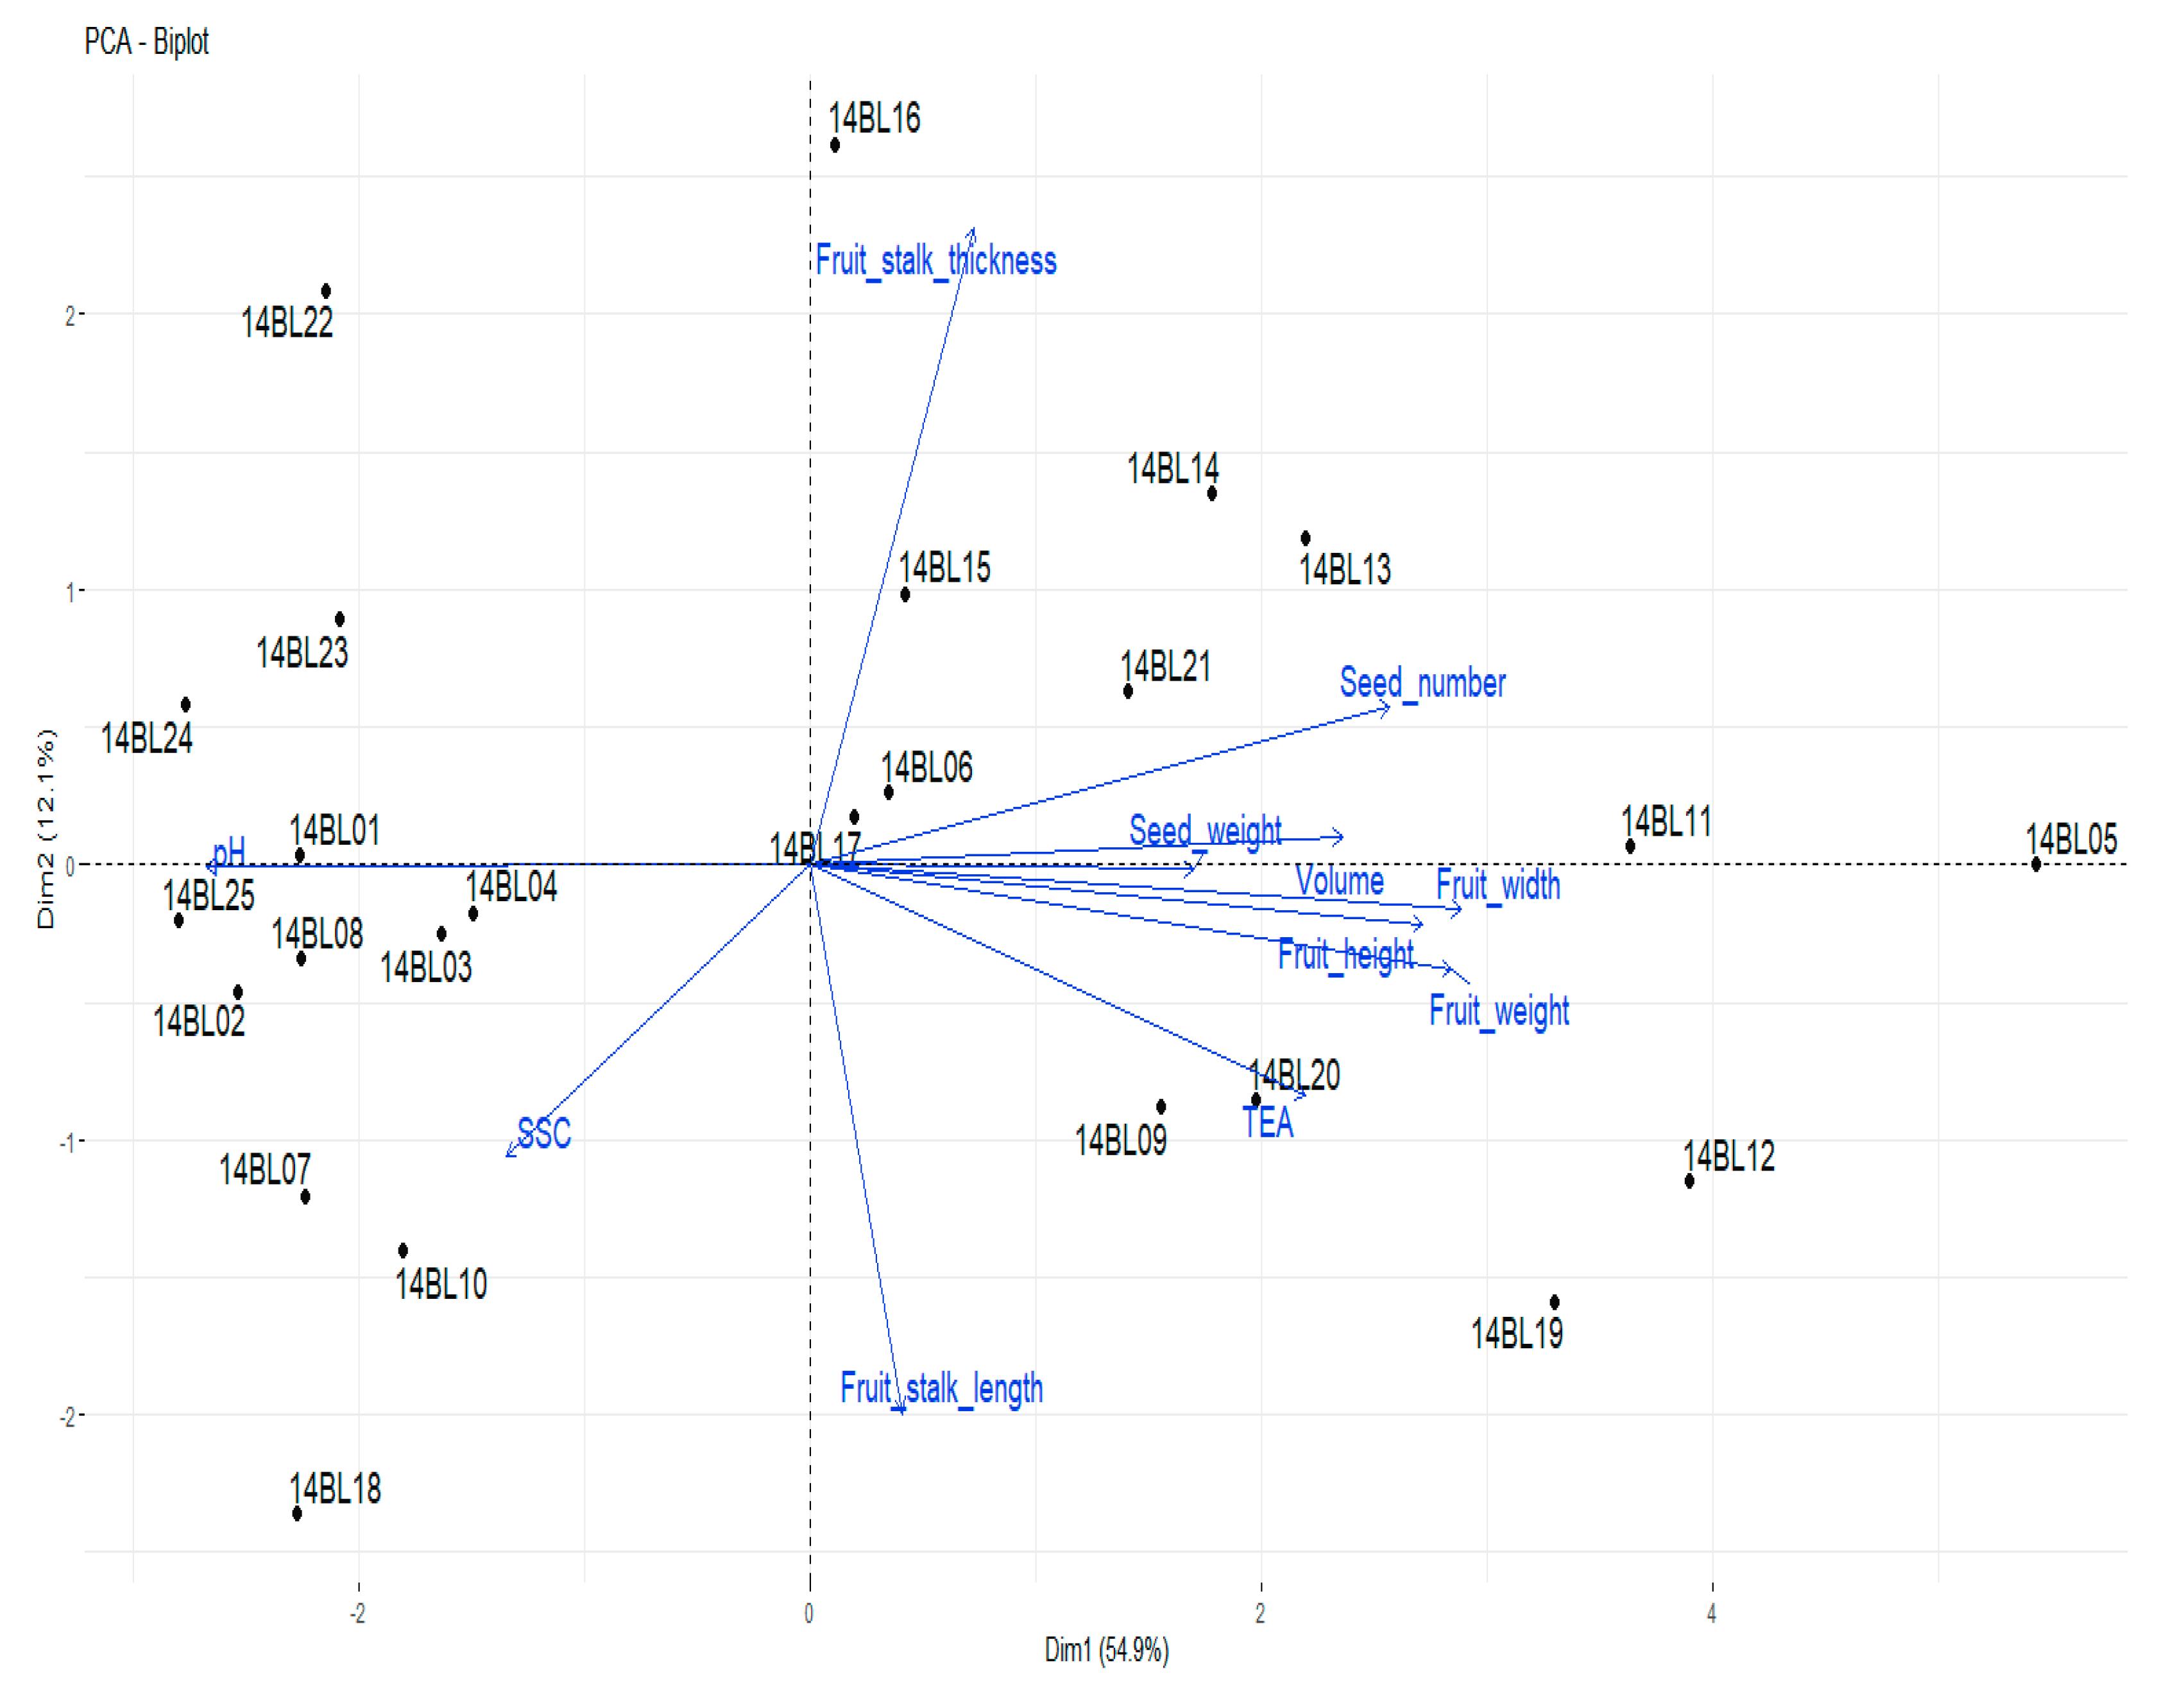
3.3. Agro-Morphological Properties
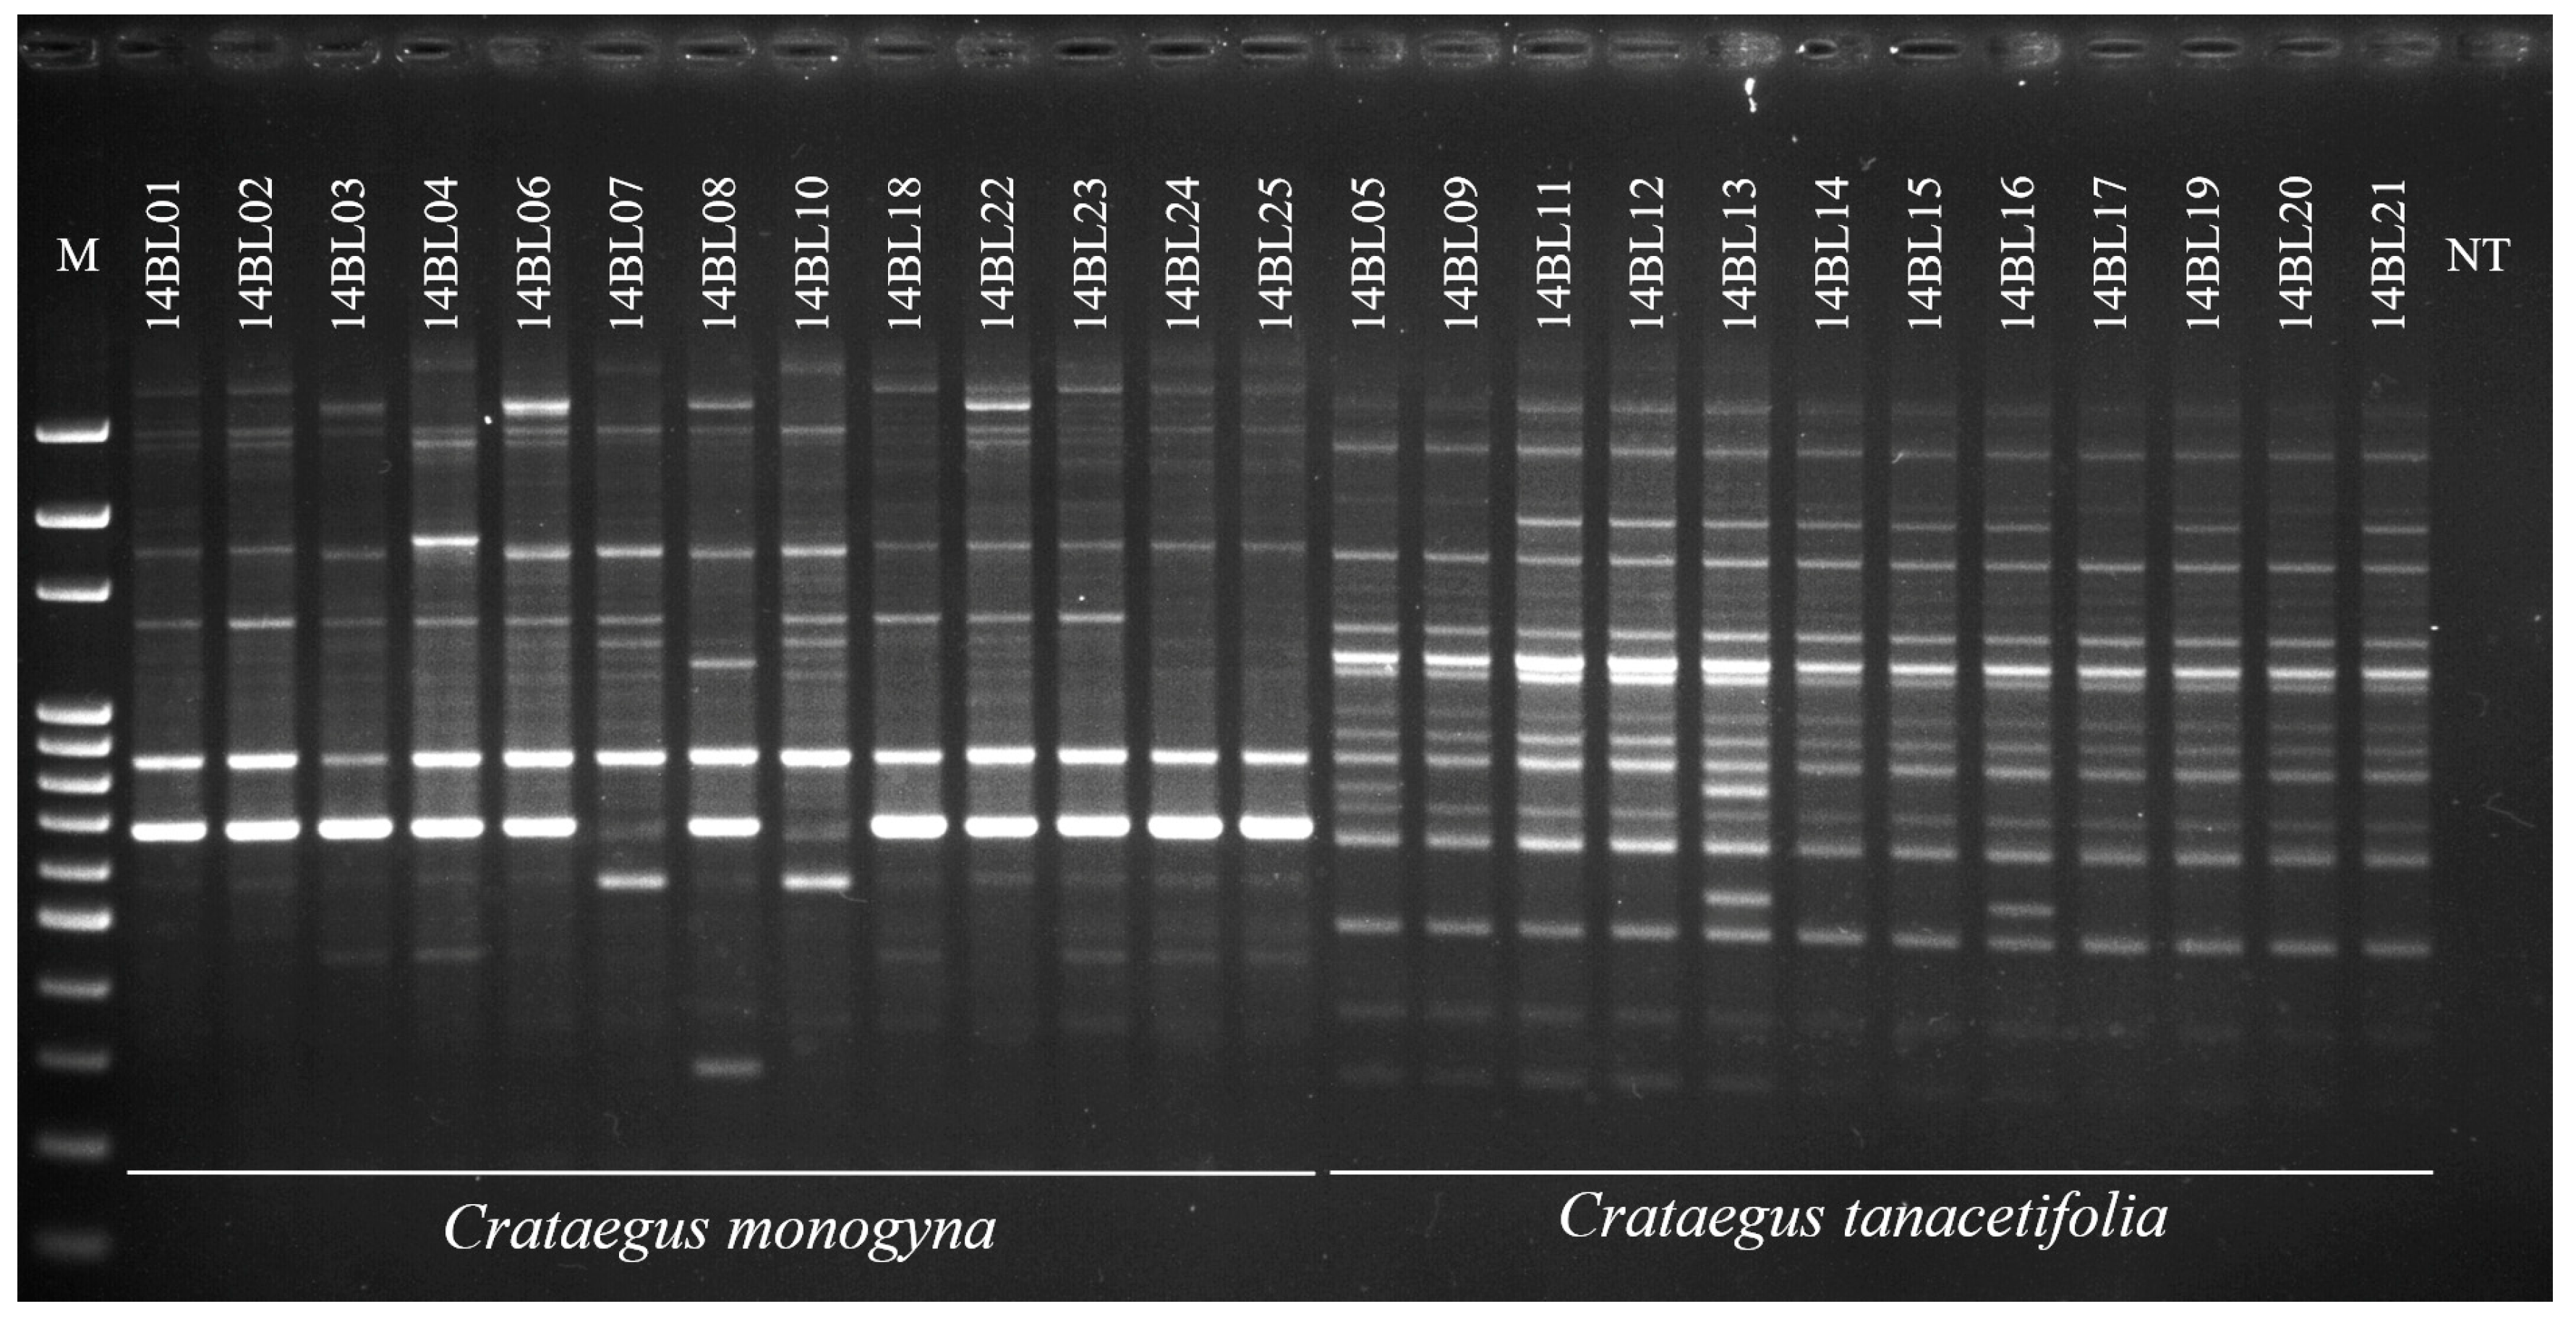
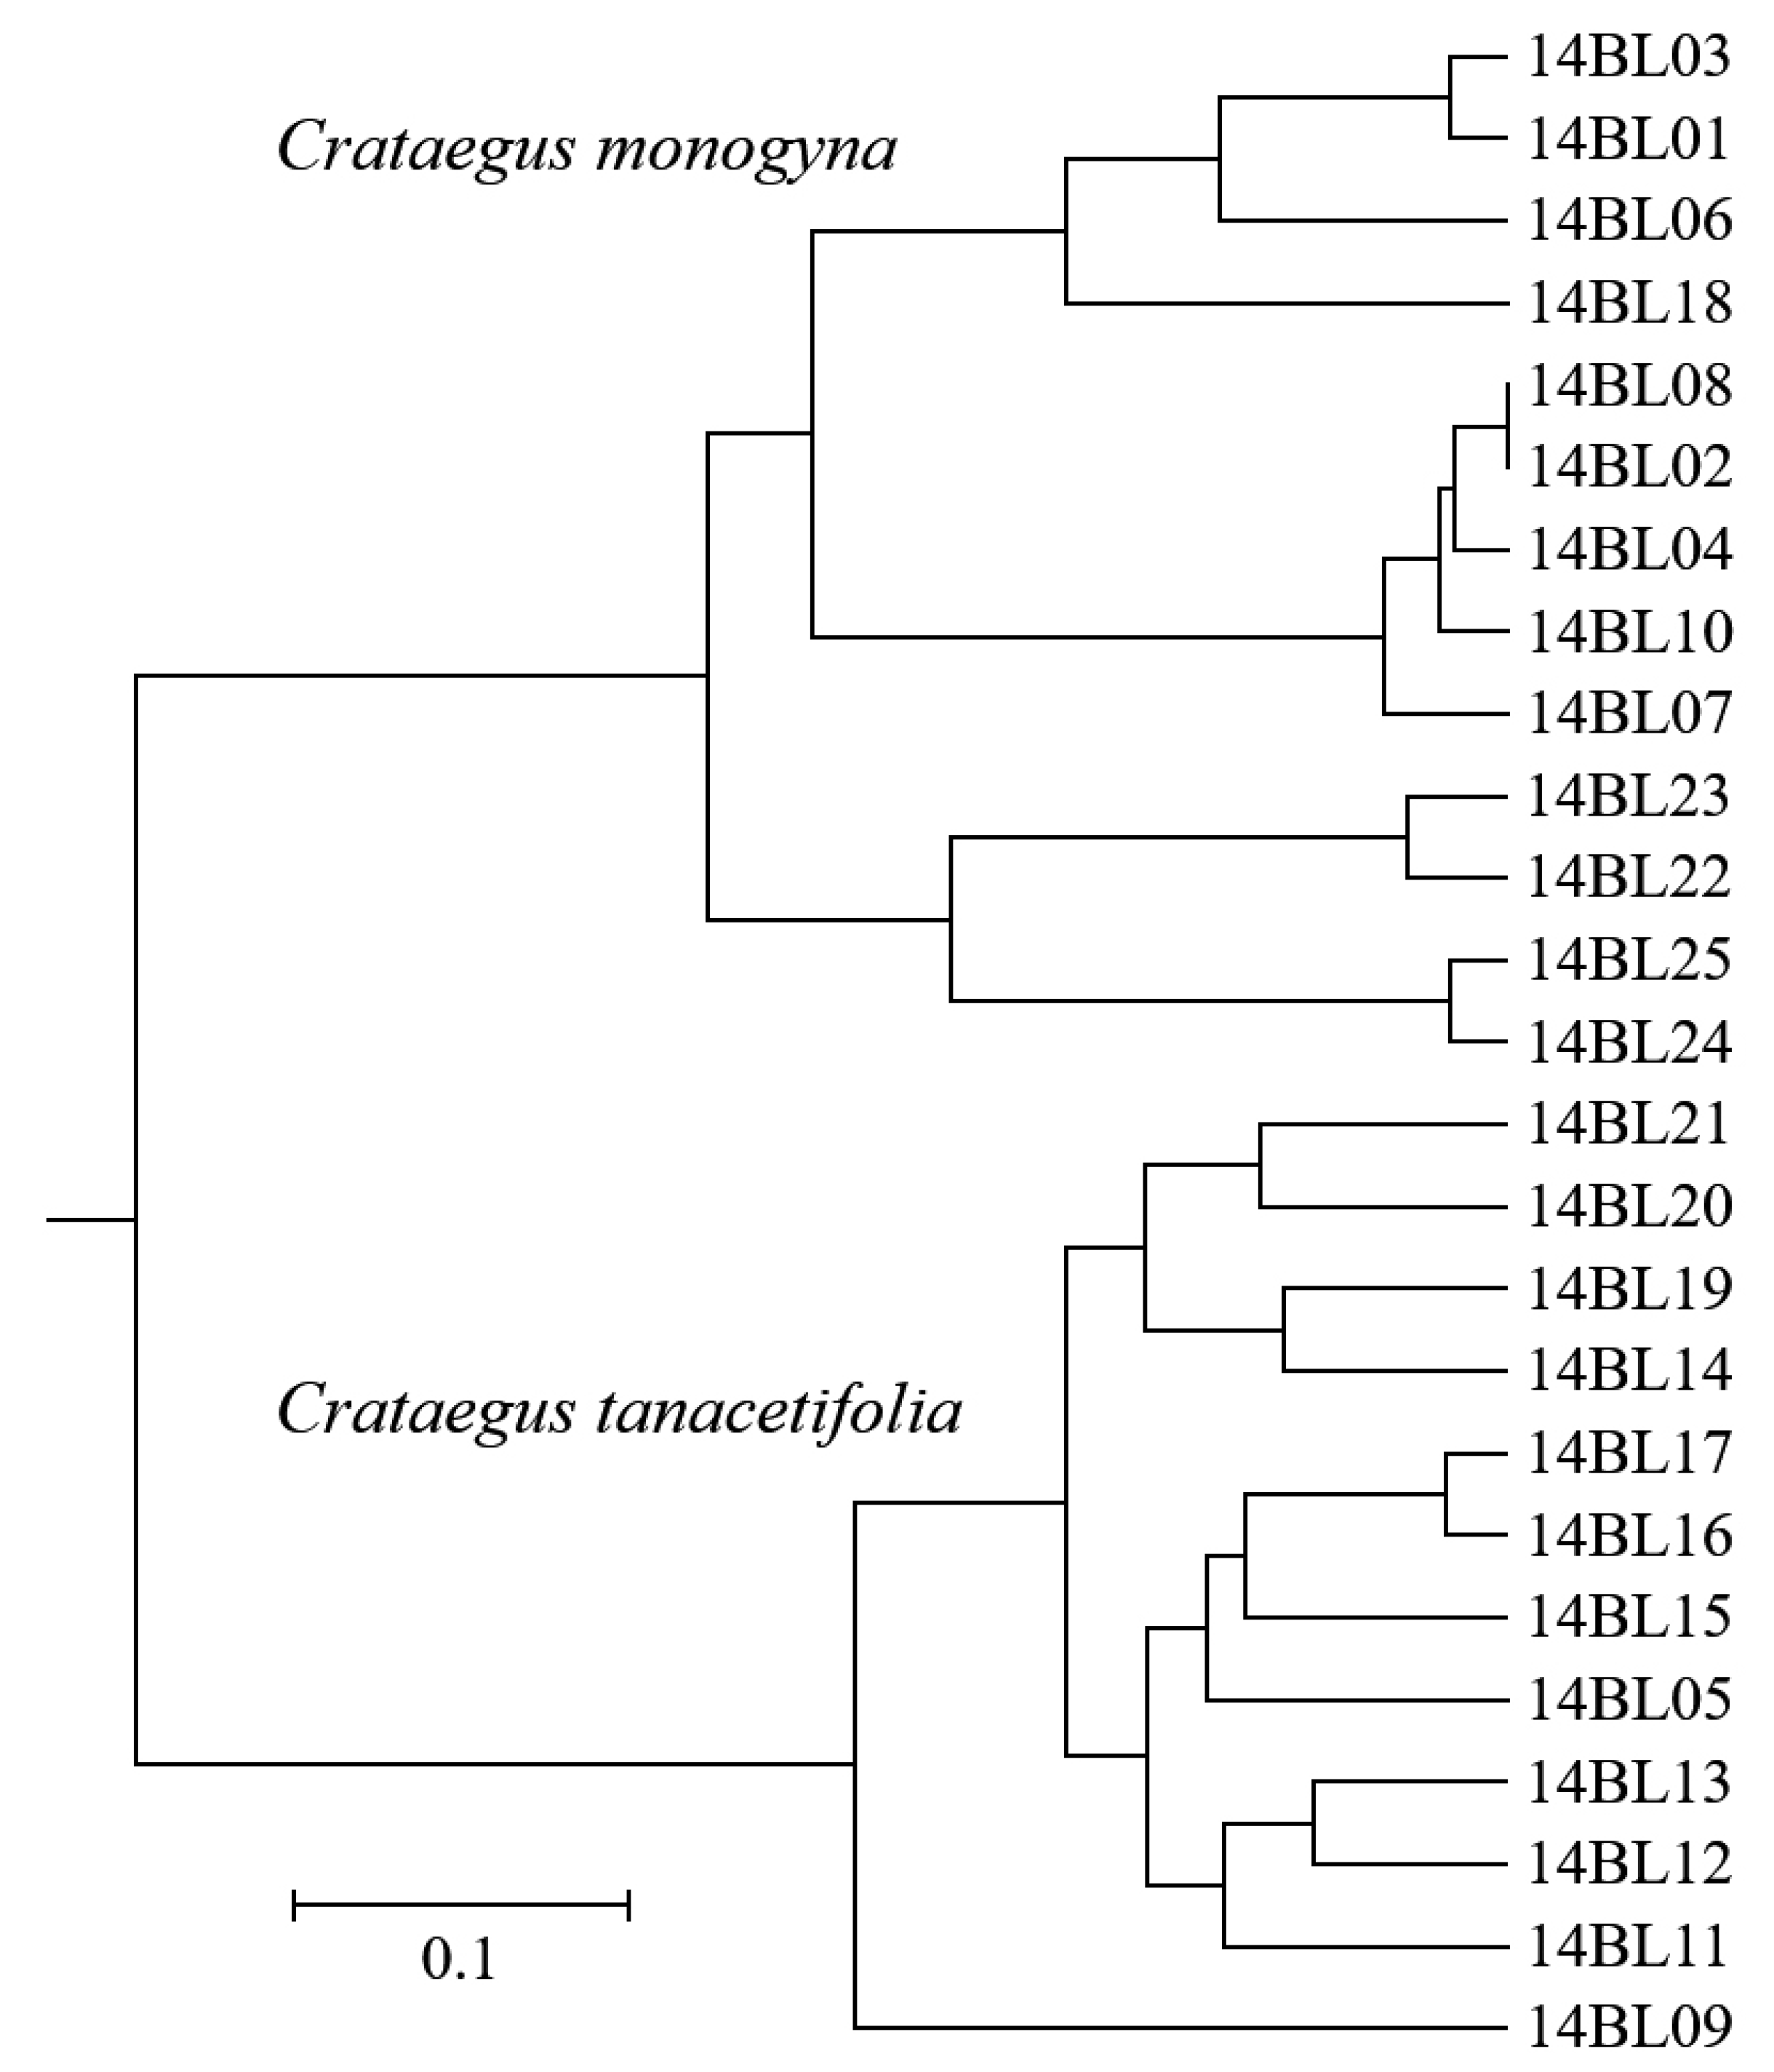
3.4. Molecular Characterization
4. Conclusions
Author Contributions
Funding
Acknowledgments
Conflicts of Interest
References
- Ercisli, S.; Orhan, E.; Esitken, A.; Yildirim, N.; Agar, G. Relationships among some cornelian cherry genotypes (Cornus mas L.) based on RAPD analysis. Genet. Resour. Crop Evol. 2008, 55, 613–618. [Google Scholar] [CrossRef]
- Serce, S.; Ozgen, M.; Torun, A.A.; Ercisli, S. Chemical composition, antioxidant activities and total phenolic content of Arbutus andrachne L. (Fam. Ericaceae) (the Greek strawberry tree) fruits from Turkey. J. Food Compos. Anal. 2010, 23, 619–623. [Google Scholar] [CrossRef]
- Ercisli, S.; Ipek, A.; Barut, E. SSR marker-based DNA fingerprinting and cultivar identification of olives (Olea europaea). Biochem. Genet. 2011, 49, 555–561. [Google Scholar] [CrossRef] [PubMed]
- Eyduran, S.P.; Ercisli, S.; Akin, M.; Beyhan, Ö.; Geçer, M.K. Organic acids, sugars, vitamin c, antioxidant capacity, and phenolic compounds in fruits of white (Morus alba L.) and black (Morus nigra L.) mulberry genotypes. J. Appl. Bot. Food Qual. 2015, 88, 134–138. [Google Scholar]
- Gecer, M.K.; Kan, T.; Gundogdu, M.; Ercisli, S.; Ilhan, G.; Sagbas, H.I. Physicochemical characteristics of wild and cultivated apricots (Prunus armeniaca L.) from Aras valley in Turkey. Genet. Resour. Crop Evol. 2010, 67, 935–945. [Google Scholar] [CrossRef]
- Dönmez, A.A. Taxonomic note on the genus Crataegus (Rosaceae) in Turkey. Bot. J. Linn. Soc. 2007, 155, 231–240. [Google Scholar] [CrossRef]
- Davis, P.H. Flora of Turkey and the East Aegean Islands; Edinburgh University Press: Edinburgh, UK, 1972; Volume 4, pp. 133–147. [Google Scholar]
- Dönmez, A. The genus Crataegus L. (Rosaceae) with special reference to hybridisation and biodiversity in Turkey. Turk. J. Bot. 2004, 28, 29–37. [Google Scholar]
- Available online: https://en.wikipedia.org/wiki/Binomial_nomenclature#Authority (accessed on 6 November 2020).
- Hobbs, C.; Foster, S. Hawthorn. HerbalGram. 1990, 22, 30–31. [Google Scholar]
- Guo, T.; Jiao, P. Hawthorn (Crataegus) resources in China. HortScience 1995, 30, 1132–1134. [Google Scholar] [CrossRef]
- Keser, S. Determination of Total Antioxidant Activities of Yarrow (Achillea millefolium), Hawthorn (Crataegus monogyna) and Blackberry (Rubus discolor) and Investigation of Their Effects on Some Biochemical Parameters in Oxidative Stress Generated Rats. Ph.D. Thesis, Firat University, Elazig, Turkey, 2012. [Google Scholar]
- Gundogdu, M.; Ozrenk, K.; Ercisli, S.; Kan, T.; Kodad, O.; Hegedus, A. Organic acids, sugars, vitamin C content and some pomological characteristics of eleven hawthorn species (Crataegus spp.) from Turkey. Biol. Res. 2014, 47, 21. [Google Scholar] [CrossRef] [Green Version]
- Yilmaz, K.U.; Yanar, M.; Ercisli, S.; Sahiner, H.; Taskin, T.; Zengin, Y. Genetic relationships among some hawthorn (Crataegus spp.) species and genotypes. Biochem. Genet. 2010, 48, 873–878. [Google Scholar] [CrossRef] [PubMed]
- MirAli, N.; Al-Odat, M.; Haider, N.; Nabulsi, I. The genus Crataegus L.: An ecological and molecular study. Russ. J. Genet. 2011, 47, 26–34. [Google Scholar] [CrossRef]
- Güney, M.; Kafkas, S.; Keles, H.; Aras, S.; Ercisli, S. Characterization of hawthorn (Crataegus spp.) genotypes by SSR markers. Physiol. Mol. Biol. Plants 2018, 24, 1221–1230. [Google Scholar] [CrossRef] [PubMed]
- Zemojtel, T.; Kielbasa, S.M.; Arndt, P.F.; Chung, H.R.; Vingron, M. Methylation and deamination of CpGs generate p53-binding sites on a genomic scale. Trends Genet. 2009, 25, 63–66. [Google Scholar] [CrossRef]
- Morse, A.M.; Peterson, D.G.; Islam-Faridi, M.N.; Smith, K.E.; Magbanua, Z.; Garcia, S.A.; Davis, J.M. Evolution of genome size and complexity in Pinus. PLoS ONE 2009, 4, e4332. [Google Scholar] [CrossRef] [Green Version]
- Feschotte, C.; Wessler, S.R. Mariner-like transposes are widespread and diverse in flowering plants. Proc. Natl. Acad. Sci. USA 2002, 99, 280–285. [Google Scholar] [CrossRef] [Green Version]
- Schulman, A.H.; Flavell, A.J.; Ellis, T.N. The application of LTR retrotransposons as molecular markers in plants. Methods Mol. Biol. 2012, 859, 115–153. [Google Scholar]
- Kalendar, R.; Schulman, A. IRAP and REMAP for retrotranspozon-based genotyping and finterprinting. Nat. Protoc. 2006, 1, 2478–2484. [Google Scholar] [CrossRef]
- Kalendar, R.; Antonıus, K.; Smykal, P.; Schulman, A.H. iPBS: A universal method for DNA Fingerprinting and retrotranspozon isolation. Theor. Appl. Genet. 2010, 121, 1419–1430. [Google Scholar] [CrossRef]
- Ozer, G.; Bayraktar, H.; Baloch, F.S. iPBS retrotransposons ‘A Universal Retrotransposons’ now in molecular phylogeny of fungal pathogens. Biochem. Syst. Ecol. 2016, 68, 142–147. [Google Scholar] [CrossRef]
- Bevilacqua, A.E.; Califano, A.N. Determination of organic acids in dairy products by high performance liquid chromatography. J. Food Sci. 1989, 54, 1076–1079. [Google Scholar] [CrossRef]
- Rodriguez-Delgado, A.; Malovana, S.; Perez, J.P.; Borges, T.; Garcia-Montelongo, F.J. Separation of phenolic compounds by high-performance liquid chromatography with absorbance and fluorimetric detection. J. Chromatogr. 2001, 912, 249–257. [Google Scholar] [CrossRef]
- DArT. Diversity Arrays Technology. 2019. Available online: http://www.diversityarrays.com (accessed on 3 November 2019).
- Team, R.C. R: A Language and Environment for Statistical Computing; R Foundation for Statistical Computing: Vienna, Austria, 2018; Available online: https://www.R-project.org/ (accessed on 3 August 2018).
- Kumar, S.; Stecher, G.; Tamura, K. MEGA7: Molecular evolutionary genetics analysis version 7.0 for bigger datasets. Mol. Biol. Evol. 2016, 33, 1870–1874. [Google Scholar] [CrossRef] [PubMed] [Green Version]
- Roldàn-Ruiz, I.; Dendauw, J.; Van Bockstaele, E.; Depicker, A.; De Loose, M.A.F.L.P. AFLP markers reveal high polymorphic rates in ryegrasses (Lolium spp.). Mol. Breed. 2000, 6, 125–134. [Google Scholar] [CrossRef]
- Wickham, H. ggplot2: Elegant Graphics for Data Analysis; Springer: New York, NY, USA, 2016; ISBN 978-3-319-24277-4. [Google Scholar]
- Sorkun, E. Determination of Pomological and Phytochemical Properties of Hawthorn Berries of Different Colors. Master’s Thesis, Gaziosmanpaşa University, Tokat, Turkey, 2012. [Google Scholar]
- Liu, P.; Kallio, H.; Li, D.; Zhou, C.; Ou, S.; Yang, B. Acids, sugars, and sugar alcohols in Chinese hawthorn (Crataegus spp.) fruits. J. Agric. Food Chem. 2010, 58, 1012–1019. [Google Scholar] [CrossRef]
- Sun, J.; Chu, Y.F.; Wu, X.; Liu, R.H. Antioxidant and antiproliferative activities of common fruits. J. Agric. Food Chem. 2002, 50, 7449–7454. [Google Scholar] [CrossRef]
- Liu, P.; Kallioa, H.; Lu, D.; Zhou, C.; Baoru, Y. Quantitative analysis of phenolic compounds in Chinese hawthorn (Crataegus spp.) fruits by high performance liquid chromatography–electrosprayionisation mass spectrometry. Food Chem. 2011, 127, 1370–1377. [Google Scholar] [CrossRef]
- Okatan, V.; Gündoğdu, M.; Çolak, A.M. Determination of some chemical and pomological characters of different hawthorn (Crataegus spp.) genotype fruits grown in Uşak. Iğdır Univ. J. Sci. Technol. 2017, 7, 39–44. [Google Scholar]
- Karadeniz, T.; Kalkışım, Ö. Fruit characteristics and selection of hopeful types of hawthorn (Crataegus azarolus) types grown in Edremit and Gevaş districts. J. Agric. Fac. Yuzuncu Yil Univ. 1996, 6, 27–33. [Google Scholar]
- Balta, M.F.; Karakaya, O.; Kaptan, E.G. Physical properties of hawthorn (Crataegus spp.) growing in Çorum. Ordu Univ. Sci. Tech. J. 2015, 5, 35–41. [Google Scholar]
- Keles, H. Selection, Morphological and Molecular Characterization of Hawthorn (Crataegus spp.) Genetic Resources from Yozgat Province and Districts. Ph.D. Thesis, Ataturk University, Erzurum, Turkey, 2018; 125p. [Google Scholar]
- Rajeb, C.; Messaoud, C.; Chograni, H.; Bejaoui, A.; Boulila, A.; Rejeb, M.N.; Boussaid, M. Genetic diversity in Tunisian Crataegus azarolus L. var. aronia L. populations assessed using RAPD markers. Ann. For. Sci. 2010, 67, 512. [Google Scholar]
- Beigmohamadi, M.; Rahmani, F. Genetic variation in hawthorn (Crataegus spp.) using RAPD markers. Afr. J. Biotechnol. 2011, 10, 7131–7135. [Google Scholar]
- Serçe, S.; Şimşek, Ö.; Toplu, C.; Kamiloğlu, Ö.; Çalışkan, O.; Gündüz, K.; Özgen, M.; Kaçar, Y.A. Relationships among Crataegus accessions sampled from Hatay, Turkey, as assessed by fruit characteristics and RAPD. Genet. Resour. Crop Evol. 2011, 58, 933–942. [Google Scholar] [CrossRef]


| Species | Genotypes | Malic | Succinic | Fumaric | Ascorbic | Oxalic | Citric | Tartaric |
|---|---|---|---|---|---|---|---|---|
| C. monogyna | 14BL01 | 2.347 ± 0.028 n* | 2.537 ± 0.012 h | 0.106 ± 0.004 e | 5.182 ± 0.006 ghı | 1.429 ± 0.010 g | 7.666 ± 0.015 j | 1.131 ± 0.006 b |
| 14BL02 | 6.265 ± 0.023 b | 2.738 ± 0.007 f | 0.095 ± 0.002 f | 6.550 ± 0.001 cde | 4.755 ± 0.042 a | 23.458 ± 0.021 c | 0.878 ± 0.002 f | |
| 14BL03 | 3.472 ± 0.007 ıj | 2.510 ± 0.000 ı | 0.143 ± 0.003 c | 3.161 ± 0.006 lm | 3.296 ± 0.028 c | 5.132 ± 0.003 o | 0.652 ± 0.003 j | |
| 14BL04 | 3.454 ± 0.024 j | 1.466 ± 0.009 s | 0.173 ± 0.006 b | 9.379 ± 0.007 ab | 0.512 ± 0.097 l | 7.029 ± 0.006 kl | 0.563 ± 0.003 k | |
| C. tanacetifolia | 14BL05 | 3.637 ± 0.024 h | 2.043 ± 0.001 l | 0.065 ± 0.004 hıjk | 6.159 ± 0.004 efg | 0.557 ± 0.000 kl | 7.347 ± 0.002 jk | 1.113 ± 0.003 b |
| C. monogyna | 14BL06 | 3.944 ± 0.040 g | 2.603 ± 0.003 g | 0.098 ± 0.002 ef | 4.183 ± 0.005 jk | 1.877 ± 0.003 f | 4.128 ± 0.007 qr | 0.641 ± 0.006 j |
| 14BL07 | 5.035 ± 0.008 c | 3.224 ± 0.017 d | 0.076 ± 0.003 gh | 5.172 ± 0.003 ghı | 3.343 ± 0.011 c | 21.951 ± 0.045 d | 0.974 ± 0.007 d | |
| 14BL08 | 2.123 ± 0.018 o | 1.869 ± 0.005 m | 0.046 ± 0.002 l | 4.621 ± 0.006 ıjk | 0.557 ± 0.005 kl | 6.365 ± 0.484 m | 0.648 ± 0.005 j | |
| C. tanacetifolia | 14BL09 | 4.550 ± 0.038 d | 4.720 ± 0.009 b | 0.090 ± 0.003 f | 6.752 ± 0.004 cde | 4.235 ± 0.005 b | 26.745 ± 0.027 a | 0.986 ± 0.003 d |
| C. monogyna | 14BL10 | 4.230 ± 0.011 e | 2.038 ± 0.005 l | 0.063 ± 0.003 ıjk | 9.621 ± 0.008 a | 2.478 ± 0.001 e | 4.519 ± 0.007 pq | 0.510 ± 0.006 l |
| C. tanacetifolia | 14BL11 | 3.531 ± 0.027 ı | 2.974 ± 0.000 e | 0.079 ± 0.004 g | 7.349 ± 0.006 c | 1.365 ± 0.003 g | 14.275 ± 0.006 f | 0.474 ±0.003 m |
| 14BL12 | 2.891 ± 0.001 l | 2.131 ± 0.008 k | 0.094 ± 0.003 f | 5.131 ± 0.005 hıj | 0.496 ± 0.000 l | 8.161 ± 0.025 ı | 1.116 ± 0.014 b | |
| 14BL13 | 3.049 ± 0.028 k | 2.614 ± 0.003 g | 0.057 ± 0.002 k | 3.754 ± 0.006 kl | 0.588 ± 0.006 k | 9.761 ± 0.007 g | 0.979 ± 0.006 d | |
| 14BL14 | 3.055 ± 0.018 k | 1.841 ± 0.005 n | 0.062 ± 0.002 jk | 6.138 ± 0.004 efg | 0.819 ± 0.002 ıj | 9.642 ± 0.010 g | 0.649 ± 0.006 j | |
| 14BL15 | 1.362 ± 0.015 s | 1.705 ± 0.000 p | 0.191 ± 0.004 a | 8.522 ± 0.003 b | 0.315 ± 0.003 mn | 3.711 ± 0.078 r | 0.716 ± 0.005 ı | |
| 14BL16 | 6.482 ± 0.000 a | 4.864 ± 0.005 a | 0.132 ± 0.003 d | 7.187 ± 0.010 cd | 2.917 ± 0.002 d | 24.782 ± 0.054 b | 0.910 ± 0.007 e | |
| 14BL17 | 4.161 ± 0.022 f | 4.161 ± 0.021 c | 0.094 ± 0.002 f | 4.163 ± 0.003 jk | 1.126 ± 0.005 h | 13.872 ± 0.004 f | 1.057 ± 0.009 c | |
| C. monogyna | 14BL18 | 2.668 ± 0.029 m | 1.574 ± 0.003 q | 0.068 ± 0.004 ghıj | 5.155 ± 0.006 ghı | 0.558 ± 0.004 kl | 18.941 ± 0.512 e | 1.548 ± 0.011 a |
| C. tanacetifolia | 14BL19 | 1.820 ± 0.019 p | 0.780 ±0.003 v | 0.073 ± 0.003 ghı | 4.606 ± 0.006 ıjk | 0.775 ± 0.007 j | 8.663 ± 0.009 h | 0.778 ± 0.008 h |
| 14BL20 | 1.168 ± 0.009 u | 1.436 ± 0.001 t | 0.134 ± 0.005 cd | 2.681 ± 0.006 m | 0.844 ± 0.003 ı | 8.137 ± 0.022 ı | 0.472 ± 0.005 m | |
| 14BL21 | 1.642 ± 0.015 r | 1.775 ± 0.011 o | 0.069 ± 0.003 ghıj | 5.968 ± 0.005 efgh | 0.611 ± 0.001 k | 6.737 ± 0.023 lm | 0.417 ± 0.008 n | |
| C. monogyna | 14BL22 | 1.870 ± 0.003 p | 1.130 ± 0.015 u | 0.091 ± 0.001 f | 6.158 ± 0.008 efg | 0.592 ± 0.006 k | 5.274 ± 0.020 o | 0.649 ± 0.009 j |
| 14BL23 | 1.163 ± 0.013 u | 1.521 ± 0.001 r | 0.044 ± 0.001 l | 6.260 ± 1.506 def | 0.258 ± 0.002 n | 4.219 ±0.015 pq | 0.822 ± 0.006 g | |
| 14BL24 | 1.248 ± 0.011 t | 1.423 ± 0.015 t | 0.062 ± 0.002 ıjk | 3.180 ± 0.005 lm | 0.375 ± 0.003 m | 4.584 ± 0.016 p | 0.636 ± 0.006 j | |
| 14BL25 | 1.728 ± 0.009 q | 2.238 ± 0.003 j | 0.097 ± 0.003 ef | 5.456 ± 0.006 fghı | 0.357 ± 0.008 m | 5.754 ± 0.025 n | 0.722 ± 0.011 ı |
| Species | Genotypes | Gallic | Protocatechuic | Catechin | Chlorogenic | Vanillic | Caffeic |
| C. monogyna | 14BL01 | 0.264 ± 0.004 a* | 0.280 ± 0.003 k | 15.533 ± 0.009 j | 11.535 ± 0.006 k | 0.016 ± 0.000 jkl* | 2.245 ± 0.005 b |
| 14BL02 | 0.086 ± 0.000 f | 0.592 ± 0.005 g | 11.168 ± 0.008 l | 14.626 ± 0.007 ı | 0.012 ± 0.000 klm | 1.637 ± 0.003 e | |
| 14BL03 | 0.088 ± 0.002 f | 0.240 ± 0.004 l | 22.443 ± 0.036 f | 9.629 ± 0.008 o | 0.023 ± 0.002 jk | 1.913 ± 0.003 c | |
| 14BL04 | 0.130 ± 0.001 d | 0.410 ± 0.008 ı | 25.429 ± 0.066 d | 10.180 ± 0.006 l | 0.085 ± 0.003 h | 4.407 ± 0.007 a | |
| C. tanacetifolia | 14BL05 | 0.217 ± 0.002 b | 0.412 ± 0.004 ı | 19.570 ± 0.015 h | 16.059 ± 0.016 h | 0.125 ± 0.005 g | 0.773 ± 0.003 n |
| C. monogyna | 14BL06 | 0.026 ± 0.000 jkl | 0.233 ± 0.006 l | 18.356 ± 0.030 ı | 9.960 ± 0.004 m | 0.005 ± 0.000 m | 1.222 ± 0.002 g |
| 14BL07 | 0.164 ± 0.005 c | 1.022 ± 0.013 c | 51.393 ± 0.062 a | 11.621 ± 0.004 j | 0.013 ± 0.001 klm | 1.025 ± 0.005 k | |
| 14BL08 | 0.096 ± 0.000 f | 0.637 ± 0.003 f | 28.618 ± 0.030 c | 5.844 ± 0.042 r | 0.027 ± 0.000 j | 0.754 ± 0.004 op | |
| C. tanacetifolia | 14BL09 | 0.132 ± 0.005 d | 1.964 ± 0.011 a | 11.530 ± 0.054 k | 33.915 ± 0.012 b | 0.138 ± 0.002 f | 1.877 ± 0.007 d |
| C. monogyna | 14BL10 | 0.037 ± 0.000 ıj | 0.840 ± 0.008 d | 41.539 ± 0.146 b | 5.494 ± 0.002 t | 0.019 ± 0.000 jkl | 0.914 ± 0.013 m |
| C. tanacetifolia | 14BL11 | 0.052 ± 0.001 h | 0.340 ± 0.005 j | 5.233 ± 0.017 u | 19.161 ± 0.001 f | 0.158 ± 0.005 e | 0.761 ± 0.003 no |
| 14BL12 | 0.032 ± 0.000 jk | 0.762 ± 0.010 e | 10.906 ± 0.048 m | 29.558 ± 0.037 c | 0.186 ± 0.001 d | 0.644 ± 0.004 q | |
| 14BL13 | 0.030 ± 0.002 jk | 0.135 ± 0.003 o | 6.260 ± 0.035 t | 7.544 ± 0.040 p | 0.014 ± 0.000 klm | 1.044 ± 0.004 j | |
| 14BL14 | 0.027 ± 0.001 jk | 0.137 ± 0.005 o | 8.733 ± 0.015 p | 27.776 ± 0.010 d | 0.164 ± 0.002 e | 0.742 ± 0.004 p | |
| 14BL15 | 0.033 ± 0.001 jk | 0.432 ± 0.004 h | 5.169 ± 0.029 u | 42.361 ± 0.033 a | 0.160 ± 0.005 e | 1.605 ± 0.005 f | |
| 14BL16 | 0.067 ± 0.003 g | 0.192 ± 0.004 mn | 21.316 ± 0.038 g | 6.922 ± 0.004 q | 0.290 ± 0.004 a | 0.970 ± 0.005 l | |
| 14BL17 | 0.013 ± 0.010 m | 0.064 ± 0.001 q | 7.037 ± 0.026 r | 3.768 ± 0.013 v | 0.038 ± 0.000 ı | 0.739 ± 0.003 p | |
| C. monogyna | 14BL18 | 0.012 ± 0.001 m | 0.122 ± 0.004 o | 28.506 ± 0.033 c | 2.254 ± 0.013 x | 0.013 ± 0.000 klm | 1.206 ± 0.006 h |
| C. tanacetifolia | 14BL19 | 0.016 ± 0.001 lm | 0.084 ± 0.002 pq | 10.346 ± 0.037 n | 22.275 ± 0.008 e | 0.168 ± 0.003 e | 0.653 ± 0.004 q |
| 14BL20 | 0.045 ± 0.001 hı | 0.210 ± 0.004 m | 6.630 ± 0.027 s | 4.979 ± 0.007 u | 0.256 ± 0.006 c | 0.974 ± 0.004 l | |
| 14BL21 | 0.025 ± 0.000 kl | 0.095 ± 0.002 p | 9.846 ± 0.015 o | 17.454 ± 0.026 g | 0.270 ± 0.008 b | 0.624 ± 0.004 r | |
| C. monogyna | 14BL22 | 0.026 ± 0.000 jkl | 0.073 ± 0.003 q | 4.140 ± 0.014 v | 3.110 ± 0.005 w | 0.012 ± 0.001 klm | 1.184 ± 0.005 ı |
| 14BL23 | 0.011 ± 0.000 m | 1.264 ± 0.010 b | 23.181 ± 0.017 e | 5.508 ± 0.006 t | 0.023 ± 0.000 jk | 0.920 ± 0.005 m | |
| 14BL24 | 0.111 ± 0.006 e | 0.856 ± 0.009 d | 6.355 ± 0.010 t | 9.845 ± 0.033 n | 0.011 ± 0.000 lm | 0.643 ± 0.003 q | |
| 14BL25 | 0.130 ± 0.002 d | 0.180 ± 0.004 n | 7.172 ± 0.012 q | 5.765 ± 0.004 s | 0.014 ± 0.001 klm | 0.910 ± 0.005 m | |
| Species | Genotypes | Ferulic | o-coumaric | Rutin | Quercetin | p-coumaric | Syringic |
| C. monogyna | 14BL01 | 0.340 ± 0.006 e* | 0.083 ± 0.001 c | 3.733 ± 0.010 k | 0.949 ± 0.007 e | 0.369 ± 0.000 a | 0.093 ± 0.004 b |
| 14BL02 | 0.675 ± 0.009 b | 0.054 ± 0.001 f | 1.829 ± 0.013 n | 0.622 ± 0.004 j | 0.167 ± 0.002 c | 0.062 ± 0.002 d | |
| 14BL03 | 0.112 ± 0.003 j | 0.074 ± 0.004 d | 1.241 ± 0.039 r | 0.921 ± 0.006 f | 0.046 ± 0.001 hı | 0.023 ± 0.002 ghı | |
| 14BL04 | 0.063 ± 0.001 k | 0.065 ± 0.002 e | 1.670 ± 0.004 p | 0.577 ± 0.001 k | 0.072 ± 0.002 f | 0.011 ± 0.000 l | |
| C. tanacetifolia | 14BL05 | 0.130 ± 0.002 ı | 0.047 ± 0.001 g | 4.735 ± 0.024 j | 0.621 ± 0.002 j | 0.051 ± 0.001 h | 0.134 ± 0.003 a |
| C. monogyna | 14BL06 | 0.076 ± 0.002 k | 0.093 ± 0.003 b | 2.346 ± 0.015 m | 0.859 ± 0.004 g | 0.238 ± 0.004 b | 0.025 ± 0.000 gh |
| 14BL07 | 0.434 ± 0.005 d | 0.024 ± 0.000 jk | 7.843 ± 0.030 g | 1.022 ± 0.006 c | 0.083 ± 0.002 e | 0.017 ± 0.001 h–l | |
| 14BL08 | 0.074 ± 0.001 k | 0.042 ± 0.000 g | 2.318 ± 0.009 m | 0.908 ± 0.007 f | 0.037 ± 0.001 jk | 0.015 ± 0.000 jkl | |
| C. tanacetifolia | 14BL09 | 1.068 ± 0.011 a | 0.031 ± 0.001 hı | 8.144 ± 0.006 e | 1.823 ± 0.015 a | 0.041 ± 0.001 ıj | 0.035 ± 0.001 f |
| C. monogyna | 14BL10 | 0.045 ± 0.004 l | 0.150 ± 0.002 a | 8.973 ± 0.002 d | 0.445 ± 0.005 m | 0.119 ± 0.005 d | 0.023 ± 0.000 g–j |
| C. tanacetifolia | 14BL11 | 0.238 ± 0.001 h | 0.019 ± 0.001 klm | 4.719 ± 0.004 j | 0.981 ± 0.003 d | 0.024 ± 0.001 lm | 0.022 ± 0.002 g–k |
| 14BL12 | 0.292 ± 0.006 f | 0.046 ± 0.002 g | 8.074 ± 0.011 f | 0.678 ± 0.003 ı | 0.041 ± 0.001 ıj | 0.027 ± 0.000 g | |
| 14BL13 | 0.116 ± 0.003 ıj | 0.029 ± 0.003 hıj | 1.777 ± 0.010 o | 0.759 ± 0.004 h | 0.033 ± 0.001 k | 0.078 ± 0.006 c | |
| 14BL14 | 0.572 ± 0.009 c | 0.021 ± 0.001 kl | 10.029 ± 0.004 a | 0.464 ± 0.001 l | 0.013 ± 0.000 o | 0.011 ± 0.000 l | |
| 14BL15 | 0.272 ± 0.006 g | 0.015 ± 0.001 mno | 9.595 ± 0.003 c | 0.925 ± 0.007 f | 0.031 ± 0.002 k | 0.014 ± 0.002 kl | |
| 14BL16 | 0.074 ± 0.002 k | 0.021 ± 0.002 kl | 4.706 ± 0.004 j | 1.050 ± 0.009 b | 0.030 ± 0.000 kl | 0.027 ± 0.001 g | |
| 14BL17 | 0.014 ± 0.001 o | 0.014 ± 0.001 mno | 9.781 ± 0.009 b | 0.365 ± 0.003 n | 0.076 ± 0.002 f | 0.012 ± 0.001 l | |
| C. monogyna | 14BL18 | 0.021 ± 0.004 no | 0.011 ± 0.000 o | 1.480 ± 0.004 q | 0.762 ± 0.003 h | 0.064 ± 0.004 g | 0.022 ± 0.000 g–j |
| C. tanacetifolia | 14BL19 | 0.076 ± 0.002 k | 0.012 ± 0.002 no | 5.881 ± 0.006 h | 0.355 ± 0.004 n | 0.014 ± 0.000 o | 0.021 ± 0.002 g–k |
| 14BL20 | 0.032 ± 0.001 lmn | 0.016 ± 0.000 l–o | 2.891 ± 0.006 l | 0.108 ± 0.006 p | 0.016 ± 0.000 no | 0.053 ± 0.002 e | |
| 14BL21 | 0.075 ± 0.002 k | 0.018 ± 0.002 k–n | 4.922 ± 0.001 ı | 0.633 ± 0.005 j | 0.018 ± 0.001 mno | 0.082 ± 0.003 c | |
| C. monogyna | 14BL22 | 0.023 ± 0.002 no | 0.034 ± 0.001 h | 1.843 ± 0.031 n | 0.477 ± 0.006 l | 0.021 ± 0.001 mn | 0.025 ± 0.000 gh |
| 14BL23 | 0.016 ± 0.000 o | 0.018 ± 0.001 k–n | 1.019 ± 0.002 t | 0.188 ± 0.000 o | 0.017 ± 0.001 mno | 0.042 ± 0.002 f | |
| 14BL24 | 0.038 ± 0.000 lm | 0.015 ± 0.000 l–o | 1.777 ± 0.007 o | 0.184 ± 0.001 o | 0.035 ± 0.002 jk | 0.016 ± 0.000 ı–l | |
| 14BL25 | 0.026 ± 0.000 mno | 0.028 ± 0.002 j | 1.130 ± 0.004 s | 0.117 ± 0.003 p | 0.023 ± 0.001 m | 0.077 ± 0.004 c |
| Species | Genotypes | Fruit Weight | Fruit Width | Fruit Length | Seed Weight | Fruit Volume |
|---|---|---|---|---|---|---|
| C. monogyna | 14BL01 | 0.733 ± 0.067 hıj* | 9.456 ± 0.443 fgh | 11.510 ± 0.734 ghı | 0.133 ± 0.033 hı | 1.167 ± 0.166 g |
| 14BL02 | 0.430 ± 0.006 ıj | 8.593 ± 0.484 ghı | 9.946 ± 0.901ıj | 0.100 ± 0.010 ı | 1.000 ± 0.022 gh | |
| 14BL03 | 1.043 ± 0.077 ghı | 11.030 ± 0.487 f | 13.000 ± 0.226 efg | 0.233 ± 0.067 h | 0.500 ± 0.007 hı | |
| 14BL04 | 0.760 ± 0.055 hıj | 10.316 ± 0.182 fgh | 12.536 ± 0.599 efg | 0.100 ± 0.010 ı | 0.500 ± 0.007 hı | |
| C. tanacetifolia | 14BL05 | 4.203 ± 0.130 a | 20.783 ± 0.632 a | 17.580 ± 0.229 a | 0.800 ± 0.010 cd | 5.333 ± 0.167 a |
| C. monogyna | 14BL06 | 0.969 ± 0.109 g-j | 13.616 ± 1.817 de | 14.903 ± 1.904 bcd | 0.200 ± 0.058 hı | 0.100 ± 0.010 ı |
| 14BL07 | 0.293 ± 0.034 j | 6.563 ± 0.933 ı | 10.030 ± 0.495 ıj | 0.100 ± 0.010 ı | 0.300 ± 0.06 ı | |
| 14BL08 | 0.490 ± 0.026 ıj | 8.850 ± 0.558 f-ı | 12.086 ± 0.153 fgh | 0.100 ± 0.010 ı | 1.000 ± 0.011 gh | |
| C. tanacetifolia | 14BL09 | 1.943 ± 0.098 ef | 15.703 ± 0.764 cd | 15.516 ± 0.139 bcd | 0.866 ± 0.145 c | 1.833 ± 0.333 def |
| C. monogyna | 14BL10 | 0.400 ± 0.031 ıj | 7.940 ± 0.438 hı | 11.820 ± 0.284 ghı | 1.000 ± 0.020 b | 1.300 ± 0.031 fg |
| C. tanacetifolia | 14BL11 | 3.076 ± 0.038 b | 17.760 ± 0.276 bc | 16.656 ± 0.188 ab | 0.800 ± 0.030 cd | 4.867 ± 0.371 a |
| 14BL12 | 4.210 ± 0.494 a | 20.710 ± 1.222 a | 16.550 ± 0.099 ab | 1.200 ± 0.022 a | 4.333 ± 0.667 b | |
| 14BL13 | 2.693 ± 0.353 bcd | 16.956 ± 0.558 c | 13.763 ± 0.261 def | 1.000 ± 0.023 b | 2.000 ± 0.023 de | |
| 14BL14 | 2.246 ±0.272 cde | 15.970 ± 1.147 c | 14.320 ± 0.117 cde | 0.600 ± 0.032 ef | 3.000 ± 0.025 c | |
| 14BL15 | 1.223 ± 0.094 gh | 13.263 ± 0.452 e | 11.973 ± 0.209 fgh | 0.500 ± 0.045 fg | 1.500 ± 0.028 efg | |
| 14BL16 | 0.923 ± 0.109 g-j | 10.936 ± 0.470 fg | 12.583 ± 0.381 efg | 0.400 ± 0.056 g | 1.000± 0.016 gh | |
| 14BL17 | 1.403 ± 0.097 fg | 13.573 ± 0.223 de | 14.363 ± 0.792 cde | 0.600 ± 0.033 ef | 1.000 ± 0.033 gh | |
| C. monogyna | 14BL18 | 0.673 ± 0.035 hıj | 9.663 ± 0.409 fgh | 11.113 ± 0.331 ghı | 0.200 ± 0.021 hı | 0.500 ± 0.012 hı |
| C. tanacetifolia | 14BL19 | 3.810 ± 0.471 a* | 19.616 ± 0.784 ab | 15.993 ± 0.555 abc | 0.800 ± 0.021 cd | 0.500 ± 0.0561 hı |
| 14BL20 | 2.770 ± 0.335 bc | 17.086 ± 0.861 c | 14.406 ± 0.694 cde | 0.700 ± 0.010 de | 2.333 ± 0.333 d | |
| 14BL21 | 2.143 ± 0.355 de | 16.316 ± 1.011 c | 14.436 ± 0.701 cde | 0.500 ± 0.015 fg | 2.000 ± 0.098 de | |
| C. monogyna | 14BL22 | 0.446 ± 0.063 ıj | 7.920 ± 0.040 hı | 10.270 ± 0.165 hı | 1.000 ± 0.007 b | 1.000 ± 0.077 gh |
| 14BL23 | 0.696 ± 0.084 hıj | 9.966 ± 0.677 fgh | 12.256 ± 0.429 fg | 0.100 ± 0.009 ı | 0.500 ± 0.038 hı | |
| 14BL24 | 0.546 ± 0.012 ıj | 8.830 ± 0.032 f-ı | 11.256 ± 0.199 ghı | 0.100 ± 0.009 ı | 0.500 ± 0.038 hı | |
| 14BL25 | 0.383 ± 0.024 ıj | 8.450 ± 0.306 hı | 8.433 ± 0.199 j | 1.000 ± 0.083 b | 0.500 ± 0.012 hı |
| Species | Genotypes | SSC | pH | TA | Stalk Length | Stalk Thickness |
|---|---|---|---|---|---|---|
| C. monogyna | 14BL01 | 32.000 ± 0.600 a* | 4.800 ± 0.033 d | 1.400 ± 0.012 l | 14.430 ± 2.293 cde | 0.613 ± 0.058 c |
| 14BL02 | 18.000 ± 0.700 g | 4.800 ± 0.048 d | 1.200 ± 0.033 m | 17.253 ± 2.052 a–d | 0.420 ± 0.085 d | |
| 14BL03 | 18.000 ± 0.800 g | 4.900 ± 0.028 c | 1.600 ± 0.018 j | 14.640 ± 1.323 cde | 0.443 ± 0.047 d | |
| 14BL04 | 18.000 ± 0.500 g | 4.600 ± 0.026 e | 1.900 ± 0.020g | 15.323 ± 2.116 bcd | 0.500 ± 0.017 cd | |
| C. tanacetifolia | 14BL05 | 8.000 ± 0.400 k | 3.800 ± 0.034 n | 3.900 ± 0.023 a | 15.203 ± 3.575 bcd | 0.627 ± 0.052 c |
| C. monogyna | 14BL06 | 20.000 ± 0.200 e | 4.300 ± 0.019 h | 2.300 ± 0.036 d | 22.357 ± 1.835 ab | 0.783 ± 0.065 b |
| 14BL07 | 18.000 ± 0.100 g | 4.600 ± 0.033 e | 2.127 ± 0.018 e | 21.723 ± 4.065 abc | 0.483 ± 0.047 d | |
| 14BL08 | 22.000 ± 0.300 d | 4.900 ± 0.030 c | 1.200 ± 0.033 m | 18.303 ± 2.885 a–d | 0.550 ± 0.061 cd | |
| C. tanacetifolia | 14BL09 | 13.333 ± 0.882 ı | 4.153 ± 0.034 j | 1.653 ± 0.034 ıj | 16.953 ± 1.840 a–d | 0.310 ± 0.108 e |
| C. monogyna | 14BL10 | 30.000 ± 0.600 b | 4.900 ± 0.018 c | 1.800 ± 0.018 h | 18.653 ± 0.545 a–d | 0.430 ± 0.099 d |
| C. tanacetifolia | 14BL11 | 14.000 ± 0.400 h | 4.100 ± 0.023 k | 2.700 ± 0.026 c | 15.790 ± 1.684 a–d | 0.597 ± 0.059 cd |
| 14BL12 | 10.000 ± 0.500 j | 4.300 ± 0.015 h | 1.700 ± 0.019 ı | 22.223 ± 0.717 ab | 0.467 ± 0.030 d | |
| 14BL13 | 10.000 ± 0.600 j | 4.400 ± 0.056 g | 1.700 ± 0.026 ı | 21.730 ± 0.474 abc | 0.973 ± 0.103 a | |
| 14BL14 | 18.000 ± 0.700 g | 4.400 ± 0.048 g | 2.000 ± 0.037 f | 15.477 ± 1.682 bcd | 0.985 ± 6.212 a | |
| 14BL15 | 10.000 ± 0.400 j | 4.300 ± 0.042 h | 1.500 ± 0.025 k | 16.030 ± 0.190 a–d | 0.627 ± 0.192 c | |
| 14BL16 | 13.333 ± 0.333 ı | 4.190 ± 0.038 ı | 1.433 ± 0.088 l | 11.527 ± 1.078 de | 0.873 ± 0.112 a | |
| 14BL17 | 22.000 ± 0.300 d | 4.500 ± 0.016 f | 1.400 ± 0.066 l | 14.467 ± 2.449 cde | 0.507 ± 0.080 cd | |
| C. monogyna | 14BL18 | 30.000 ± 0.400 b | 4.800 ± 0.033 d | 1.700 ± 0.071 ı | 23.013 ± 3.058 a | 0.367 ± 0.043 e |
| C. tanacetifolia | 14BL19 | 18.000 ± 0.400 g | 3.900 ± 0.026 m | 3.500 ± 0.016 b | 18.580 ± 3.194 a–d | 0.443 ± 0.048 d |
| 14BL20 | 28.000 ± 0.600 c | 4.000 ± 0.033 l | 1.800 ± 0.018 h | 20.940 ± 1.849 abc | 0.640 ± 0.021 c | |
| 14BL21 | 19.000 ± 0.500 f | 4.300 ± 0.061 h | 1.800 ± 0.023 h | 15.920 ± 0.961 a–d | 0.697 ± 0.023 c | |
| C. monogyna | 14BL22 | 18.000 ± 0.200 g | 4.900 ± 0.029 c | 1.000 ± 0.026 o | 8.087 ± 0.411 e | 0.670 ± 0.040 c |
| 14BL23 | 20.000 ± 0.300 e | 4.800 ± 0.033 d | 1.100 ± 0.036 n | 13.650 ± 0.602 de | 0.650 ± 0.055 c | |
| 14BL24 | 18.000 ± 0.400 g | 5.100 ± 0.041 b | 0.600 ± 0.029 q | 17.513 ± 2.457 a–d | 0.653 ± 0.122 c | |
| 14BL25 | 13.000 ± 0.500 ı | 5.200 ± 0.016 a | 0.700 ± 0.011 p | 17.790 ± 2.611 a–d | 0.407 ± 0.057 d |
| Species | Genotypes | L | a | b | Chroma | Hue |
|---|---|---|---|---|---|---|
| C. monogyna | 14BL01 | 32.35 f* | 40.552 ab | 20.107 fg | 45.331 bcd | 26.211 fgh |
| 14BL02 | 36.078 e | 41.939 a | 23.090 f | 47.921 ab | 28.665 f | |
| 14BL03 | 26.369 ıj | 34.39 cde | 12.590 ı | 36.623 ghı | 20.106 g–j | |
| 14BL04 | 27.909 ghı | 33.784 cde | 14.399 hı | 36.734 ghı | 23.094 f–ı | |
| C. tanacetifolia | 14BL05 | 57.095 a | 7.546 kl | 38.660 de | 39.393 fgh | 78.961 c |
| C. monogyna | 14BL06 | 25.765 ıj | 27.778 f | 8.224 jk | 28.995 k | 16.349 ıj |
| 14BL07 | 30.248 fg | 35.859 bcd | 18.125 gh | 40.244 fg | 26.755 fg | |
| 14BL08 | 28.027 ghı | 35.801 bcd | 14.807 hı | 38.759 fgh | 22.403 f–ı | |
| C. tanacetifolia | 14BL09 | 52.023 c | 3.614 lm | 40.714 cd | 41.454 def | 85.853 b |
| C. monogyna | 14BL10 | 23.984 j | 29.112 ef | 7.060 k | 29.966 jk | 13.541 j |
| C. tanacetifolia | 14BL11 | 56.635 a | 13.526 g-j | 44.792 ab | 46.791 ab | 73.199 cde |
| 14BL12 | 54.971 abc | 17.794 g | 46.566 a | 49.856 a | 69.097 e | |
| 14BL13 | 53.175 bc | 9.097 jk | 43.214 abc | 44.228 b–e | 78.171 cd | |
| 14BL14 | 52.080 c | 11.806 h-k | 43.842 abc | 45.480 bc | 74.994 cde | |
| 14BL15 | 54.961 abc | 9.767 ıjk | 43.178 abc | 44.503 b–e | 77.559 cd | |
| 14BL16 | 47.303 d | −2.810 n | 35.840 e | 35.951 hı | 94.483 a | |
| 14BL17 | 56.651 a | −4.683 mn | 41.170 bcd | 41.514 def | 90.128 ab | |
| C. monogyna | 14BL18 | 25.546 ıj | 31.433 def | 10.974 ıj | 33.335 ıj | 19.104 hıj |
| C. tanacetifolia | 14BL19 | 58.111 a | 13.357 g-j | 44.296 abc | 46.267 ab | 73.217 cde |
| 14BL20 | 57.354 a | 14.597 ghı | 43.399 abc | 45.793 bc | 71.412 de | |
| 14BL21 | 55.873 ab | 16.046 gh | 44.600 abc | 47.401 ab | 70.217 e | |
| C. monogyna | 14BL22 | 30.259 fg | 36.327 bcd | 18.081 gh | 40.582 efg | 26.463 fgh |
| 14BL23 | 29.646 fgh | 38.050 abc | 17.499 gh | 41.890 c–f | 24.692 fgh | |
| 14BL24 | 26.591 hıj | 32.738 ± c-f | 11.402 ıj | 34.673 ı | 19.167 hıj | |
| 14BL25 | 28.378 ghı | 36.029 bcd | 14.495 hı | 38.890 fgh | 21.633 f–ı |
| Primers | Primer Sequences (5′–3′) | T (°C) | TB | PB | PPB (%) | PIC | RP |
|---|---|---|---|---|---|---|---|
| iPBS2074 | GCTCTGATACCA | 50 | 14 | 13 | 92.86 | 0.30 | 7.00 |
| iPBS2257 | CTCTCAATGAAAGCACCA | 50 | 6 | 4 | 66.67 | 0.12 | 0.78 |
| iPBS2388 | TTGGAAGACCCA | 51 | 13 | 13 | 100 | 0.35 | 6.67 |
| iPBS2232 | AGAGAGGCTCGGATACCA | 55 | 12 | 12 | 100 | 0.37 | 7.00 |
| iPBS2239 | ACCTAGGCTCGGATGCCA | 55 | 12 | 12 | 100 | 0.42 | 8.11 |
| iPBS2415 | ACGAAGGGACCA | 60 | 11 | 11 | 100 | 0.37 | 6.11 |
| Total | 68 | 65 | |||||
| Avg./primer | 11.33 | 10.83 | 95.59 | 0.32 | 5.95 |
Publisher’s Note: MDPI stays neutral with regard to jurisdictional claims in published maps and institutional affiliations. |
© 2020 by the authors. Licensee MDPI, Basel, Switzerland. This article is an open access article distributed under the terms and conditions of the Creative Commons Attribution (CC BY) license (http://creativecommons.org/licenses/by/4.0/).
Share and Cite
Gurlen, A.; Gundogdu, M.; Ozer, G.; Ercisli, S.; Duralija, B. Primary, Secondary Metabolites and Molecular Characterization of Hawthorn (Crataegus spp.) Genotypes. Agronomy 2020, 10, 1731. https://doi.org/10.3390/agronomy10111731
Gurlen A, Gundogdu M, Ozer G, Ercisli S, Duralija B. Primary, Secondary Metabolites and Molecular Characterization of Hawthorn (Crataegus spp.) Genotypes. Agronomy. 2020; 10(11):1731. https://doi.org/10.3390/agronomy10111731
Chicago/Turabian StyleGurlen, Aysen, Muttalip Gundogdu, Goksel Ozer, Sezai Ercisli, and Boris Duralija. 2020. "Primary, Secondary Metabolites and Molecular Characterization of Hawthorn (Crataegus spp.) Genotypes" Agronomy 10, no. 11: 1731. https://doi.org/10.3390/agronomy10111731
APA StyleGurlen, A., Gundogdu, M., Ozer, G., Ercisli, S., & Duralija, B. (2020). Primary, Secondary Metabolites and Molecular Characterization of Hawthorn (Crataegus spp.) Genotypes. Agronomy, 10(11), 1731. https://doi.org/10.3390/agronomy10111731