Article

Sensitivity of Zasmidium citri-griseum to Fenbuconazole and Control of Citrus Greasy Spot in Panama

by
Vidal Aguilera-Cogley
1,* and
Antonio Vicent
2
1
Grupo de Investigación de Protección Vegetal, Centro de Investigación Agropecuaria Divisa, Instituto de Investigación Agropecuaria de Panamá (IDIAP), Herrera 0619, Panama
2
Centre de Protecció Vegetal i Biotecnologia, Institut Valencià d’Investigacions Agràries (IVIA), 46113 Moncada, Valencia, Spain
*
Author to whom correspondence should be addressed.
Agronomy 2020, 10(10), 1577; https://doi.org/10.3390/agronomy10101577
Submission received: 2 August 2020 / Revised: 4 October 2020 / Accepted: 9 October 2020 / Published: 15 October 2020

Abstract

:
Citrus greasy spot, caused by Zasmidium citri-griseum ( = Mycosphaerella citri) is the most prevalent fungal disease of citrus in Panama, causing premature defoliation and yield reduction. Fungicide applications are generally needed for the control of greasy spot. In this study, the sensitivity to fenbuconazole of 34 isolates of Z. citri-griseum from Panama was determined by calculating the effective concentration needed to reduce mycelial growth by 50% (EC 50 ). Two field trials were conducted from 2011 to 2013, to evaluate the efficacy of fenbuconazole to reduce disease severity and yield loss. The EC 50 values for fenbuconazole ranged from 0.09 to 7.62 μ g mL 1 , with a mean EC 50 value of 2.66 ± 0.36 SE μ g mL 1 for mycelial growth. These data can be used for monitoring sensitivity shifts in Z. citri-griseum to fenbuconazole and reduce risk of fungicide resistance in Panama. In the field trials, sprays with fenbuconazole significantly reduced (p < 0.0001) the severity of greasy spot on leaves compared with the non-treated control. Greater disease control was obtained when three sprays of fenbuconazole were applied instead of one. Nevertheless, no significant differences (p > 0.05) were detected in yield.

1. Introduction

Citrus greasy spot, caused by Zasmidium citri-griseum (F.E. Fisher) U. Braun and Crous (=Mycosphaerella citri Whiteside), is one of the most important fungal diseases of citrus in the Caribbean Basin, including Florida (US), the Caribbean islands, Mexico, and Central America [1,2,3]. Greasy spot is widely distributed in Panama affecting mainly sweet orange [Citrus sinensis (L.) Osbeck] and Tahiti lime [C. latifolia (Yu.Tanaka) Tanaka] [4]. Trees affected by greasy spot typically show yellow mottle on the adaxial surface of leaves and yellow-brown spot, slightly raised pustules on the abaxial surface, resulting in premature defoliation and yield reduction. In Florida, fruit symptoms have been reported mainly in grapefruit (C. paradisi Macf.), consisting of minute black flecks on the peel which coalesce to form rind blotch [3]. In Florida, losses up to 45% have been reported in grapefruit and 25% in sweet orange [2]. In Cuba, yield losses up to 5 tons ha 1 were reported in sweet orange associated with greasy spot [5].
The main inoculum source of Z. citri-griseum are the ascospores formed in pseudothecia on decaying leaves on the orchard floor. Ascospores are discharged in response to wetting and dispersed by wind currents [6]. Once deposited on the leaf surface, ascospores germinate and the resulting mycelia grow epiphytically [7]. Conidia of Z. citri-griseum have also been reported, but they are considered of minor epidemiological relevance [2].The disease is characterized by a relatively long incubation period, and foliar symptoms of greasy spot on lemon [C. limon (L.) Burm f.] and grapefruit are visible 3–4 months after infection, while in sweet orange the appearance of symptoms takes much longer [2].
Leaf litter removal can be effective in reducing the inoculum of the pathogen in orchards [8]. Application of urea to the leaf litter reduced the production of pseudothecia and ascospores of Z. citri-griseum, but did not affect the rate of leaf decomposition [9]. In contrast, the application of lime and additional irrigations accelerate litter decay, and leaf tissues are decomposed so rapidly that pseudothecia do not form [3]. Foliar sprays with fertilizers such as zinc, manganese, and iron, are effective for greasy spot control if applied at sufficiently high rates [10]. In Texas (US), foliar sprays with aqueous organic mixtures and aqueous suspension of vegetable oil reduced the incidence of greasy spot on grapefruit leaves. [11].
Nevertheless, the primary means of greasy spot control is the application of fungicides to reduce disease severity on the leaves and subsequent defoliation. Z. citri-griseum is sensitive to a wide range of fungicides from different groups and mode of actions such as benzimidazoles, demethylation inhibitors (DMIs), quinone outside inhibitors (QoIs), copper compounds and petroleum oils [2,3]. The pathogen is affected by fungicides mainly during its epiphytic growth on the leaf surface [3]. In Florida, fungicide sprays applied any time in May or June provided the best control of disease on the spring flush [3,12]. In Costa Rica, fungicide applications in June and August provided effective disease control [1].
The group of DMI fungicides was introduced in the mid-1970s and they are effective against numerous fungal diseases, especially powdery mildews, rusts and leaf spots in general [13]. The chemical group of triazoles is the most represented within the DMI fungicides [14]. These fungicides inhibit the removal of the C14-methyl group from 24-methylenedihydrolanosterol or eburicol, and disrupt sterol production by the fungus [14]. According to the Fungicide Resistance Action Committee (FRAC) classification [15], there is medium risk for the development of resistance to DMI fungicides.
The fungicide fenbuconazole is a triazole first introduced in 1988 [16]. Fenbuconazole is a systemic fungicide with protectant and curative activity, used for the control of rusts, powdery mildews, bunts and smuts on different crops [17]. This triazole fungicide has also been reported to provide effective control of greasy spot and rind blotch [18,19,20,21,22,23]. The establishment of the sensitivity distribution is the first step to develop a strategy for monitoring and managing fungicide resistance [24]. Baseline studies with fenbuconanzole have been performed in Florida with Z. citri-griseum, Colletotrichum acutatum J. H. Simmonds and Elsinoë fawcettii Bitanc. and Jenkins on citrus [25], Venturia effusa (G. Winter) Rossman and W.C. Allen in pecan [26] and Monilinia oxycocci (Woronin) Honey in cranberry in Wisconsin (US) [27]. There is no information on the sensitivity of Z. citri-griseum isolates from Panama to fenbuconazole. Neither is there any information on the efficacy of fenbuconazole for the control of greasy spot under the particular agroclimatic conditions of Panama. Therefore, the objectives of this study were to determine the sensitivity of Z. citri-griseum isolates from Panama to fenbuconazole and evaluate its efficacy for the control of greasy spot under field conditions.

2. Materials and Methods

2.1. Mycelial Growth Inhibition Assay

A total of 34 isolates of Z. citri-griseum were collected during the rainy season from May to December in 2010, 2011 and 2012 on symptomatic citrus trees in three provinces of Panama, namely Chiriquí, Veraguas and Coclé (Table 1). Isolates were obtained from symptomatic leaves of different citrus species. Leaves were surface disinfested with 1% sodium hypochlorite solution for 5 min and rinsed twice in sterile distilled water [25]. On the abaxial side with lesions, small pieces of mesophyll were removed with a sterile scalpel [28]. Small pieces were plated on potato dextrose agar (PDA) (Liofilchem, Italy) amended with 0.5 g L 1 of streptomycin sulphate (Sigma-Aldrich, USA) (PDAS), and incubated at 25 C in the dark for 10 to 14 days. The fungal colonies obtained were transferred to PDA, and monohyphal isolates were obtained by serial dilution [29].
Isolations from leaf litter were carried out by attaching wetted small leaf pieces (∼5 mm 2 ) with pseudothecia to the top of Petri dishes using double-sided adhesive tape (Scotch, 3M, USA) and allowing the ascospores to be ejected onto PDAS. Plates were incubated at 25 C in the dark for one week and examined daily. Individual germinating ascospores were selected under the stereomicroscope and transferred with a sterile needle to malt extract agar (MEA) (Oxoid Ltd., England) plates, which were incubated at 25 C in the dark for two weeks [30].
All isolates were identified by morphological analysis, sequencing of the internal transcribed spacer region (ITS) and translation elongation factor 1-alpha (EF-1 α ) based on previously described procedures by Aguilera et al. [31]. For long-term storage, all isolates were kept in 15% glycerol solution at −80 C in 1.5 mL cryovials until further use. For mycelium production, Z. citri-griseum isolates were transferred to PDA and grown at 25 C in the dark for 30 days.
A commercial formulation of fenbuconazole (Indar 25% w/v OF; Dow Agrosciences, US) was used in the mycelial growth inhibition assay of Z. citri-griseum. Appropriate volumes of fungicide were added to PDA at about 50 C to obtain final concentrations of active ingredient (a.i.) of 0.01, 0.1, 1, 10 and 100 μ g mL 1 . Non-amended PDA medium was used as the control. Amended and non-amended PDA (20 mL) was poured into 90-mm-diameter Petri dishes. Mycelial plugs, 5 mm in diameter, from the actively growing area of the fungal colonies were placed in the center of each plate. A sample size of four replicate plates was used for each combination of isolate and fungicide concentration. Plates were incubated at 25 C in the dark for 30 days until the control plates were 50% covered with mycelium. Colony diameter was determined as the average of two perpendicular measurements, substracting the 5 mm of the mycelial plug. Growth inhibition (%) was calculated relative to the non-amended control for each isolate. Dose-response curves were obtained and the effective concentration needed to reduce mycelial growth by 50% (EC 50 ) was calculated with the nplr package for R [32]. This package is commonly used for n-parameter logistic regression models, in our case with four-parameter logistic regressions. The box-whisker plot and histogram of EC 50 values were obtained. The shape of frequency distribution was analyzed by examining curve shape, range, and mean values of EC 50 . The R version 3.2.5 was used in all statistical and graphical analyses [33].

2.2. Field Trials

To evaluate the efficacy of fenbuconazole for the control of greasy spot, two field experiments were conducted in commercial citrus orchards severely affected by the disease. Experiment 1 was located in a ‘Star Ruby’ grapefruit orchard at Tambo with 6-year-old trees grafted on ‘Swingle’ citrumelo [C. paradisi × Poncirus trifoliata (L.) Raf.] rootstock and with 5 × 10 m tree spacing. Experiment 2 was located in a ‘Valencia’ sweet orange orchard at Miraflores with 5-year-old trees grafted on ‘Swingle’ citrumelo and with 3.5 × 7 m tree spacing. Both orchards were rainfed. The same commercial formulation of fenbuconazole indicated for the mycelial growth inhibition assay was used. According to the label rate, a concentration of fenbuconazole of 0.12 g a.i. L 1 was compared with a non-treated control. Treatments were arranged in a completely randomized design with six replications of 10 trees each. A guard tree was located between plots within rows. Trees were sprayed with a volume of ∼ 6.5 L tree 1 in experiment 1 and ∼ 3 L tree 1 in experiment 2 using a hydraulic sprayer (Arbus 2000 Jacto, Brasil) at 300 psi. In 2011, spray applications were performed on 20 May, 7 June and 30 June in experiment 1 and 9 June, 1 July and 21 July in experiment 2. In order to evaluate a more cost-effective program, in 2012 only one spray application was carried out on 18 May in experiment 1 and 15 May in experiment 2. In 2013, one spray application was made on 21 May in experiment 1 and no fungicides were applied in experiment 2. In all cases, the first spray coincided with the appearance of new shoots at phenological stage BBCH 32–39 (between 20% and 90% of final shoot length) [34].
Disease severity was assessed in December 2011–2013 in experiment 1 and December 2011–2012 in experiment 2. Ten shoots were arbitrarily selected in each tree (∼ 70 leaves tree 1 ) and tagged before the first spray. All leaves in the tagged shoots were assessed according to the following rating scale: 0 = no lesions observed; 1 = 1–10 leaf spots; 2 = 11–20 leaf spots; 3 = more than 20 leaf spots per leaf [31]. Descriptive statistics were obtained for disease severity categories in each experiment. Disease severity categories were treated as an order factor, which was modelled with a proportional odds logistic regression model using the polr function of the MASS package for R [35].
l o g i t [ P ( Y i j ) ] = α j 0 β t r I t r ( i ) i = 1 , . . . , n
where P(Y i j ) is the cumulative probability between 0 and 1 for category j of Yi, j = 0, …, 2 are categories of greasy spot severity, α j 0 are the thresholds for greasy spot severity categories, β t r , is the coefficient for the fungicide treatment evaluated (I t r ), and n is the total number of ten-tree plots. The proportional odds model assumes that the logit of the cumulative probabilities changes linearly as the explanatory variables change, and also that the slope of this relationship is the same regardless of the disease severity category [36]. In our case, the non-treated control was used as the reference level and the odds ratio for the fungicide treatment was calculated as e β based on the cumulative probabilities. Owing to the proportional odds assumption, the odds ratio for the fungicide treatment stays the same no matter how disease severity is dichotomized into two levels. This proportional odds assumption was evaluated by the Likelihood Ratio Test (LRT) between the proportional odds model and the non proportional odds model [37] using the VGAM package for R [38]. The goodness of fit was assessed by a χ 2 –test of the residual deviance against the null model (i.e., including only the intercept). A significant effect for the fungicide treatment was considered when the 95% confidence interval of the odds ratio did not overlap the null value of 1 [36].
All fruit in each tree were harvested and weighed. In each experiment, descriptive statistics and analysis of variance (ANOVA) were performed for yield data (kg tree 1 ) using the stats package for R [39]. Prior to ANOVA the normality assumptions were verified by the test by Shapiro–Wilk and the homogeneity of variance using the Bartlett test. A diagnosis of the studied residues was made applying the test of Breusch–Pagan to determine the homocedasticity of the variance.

3. Results

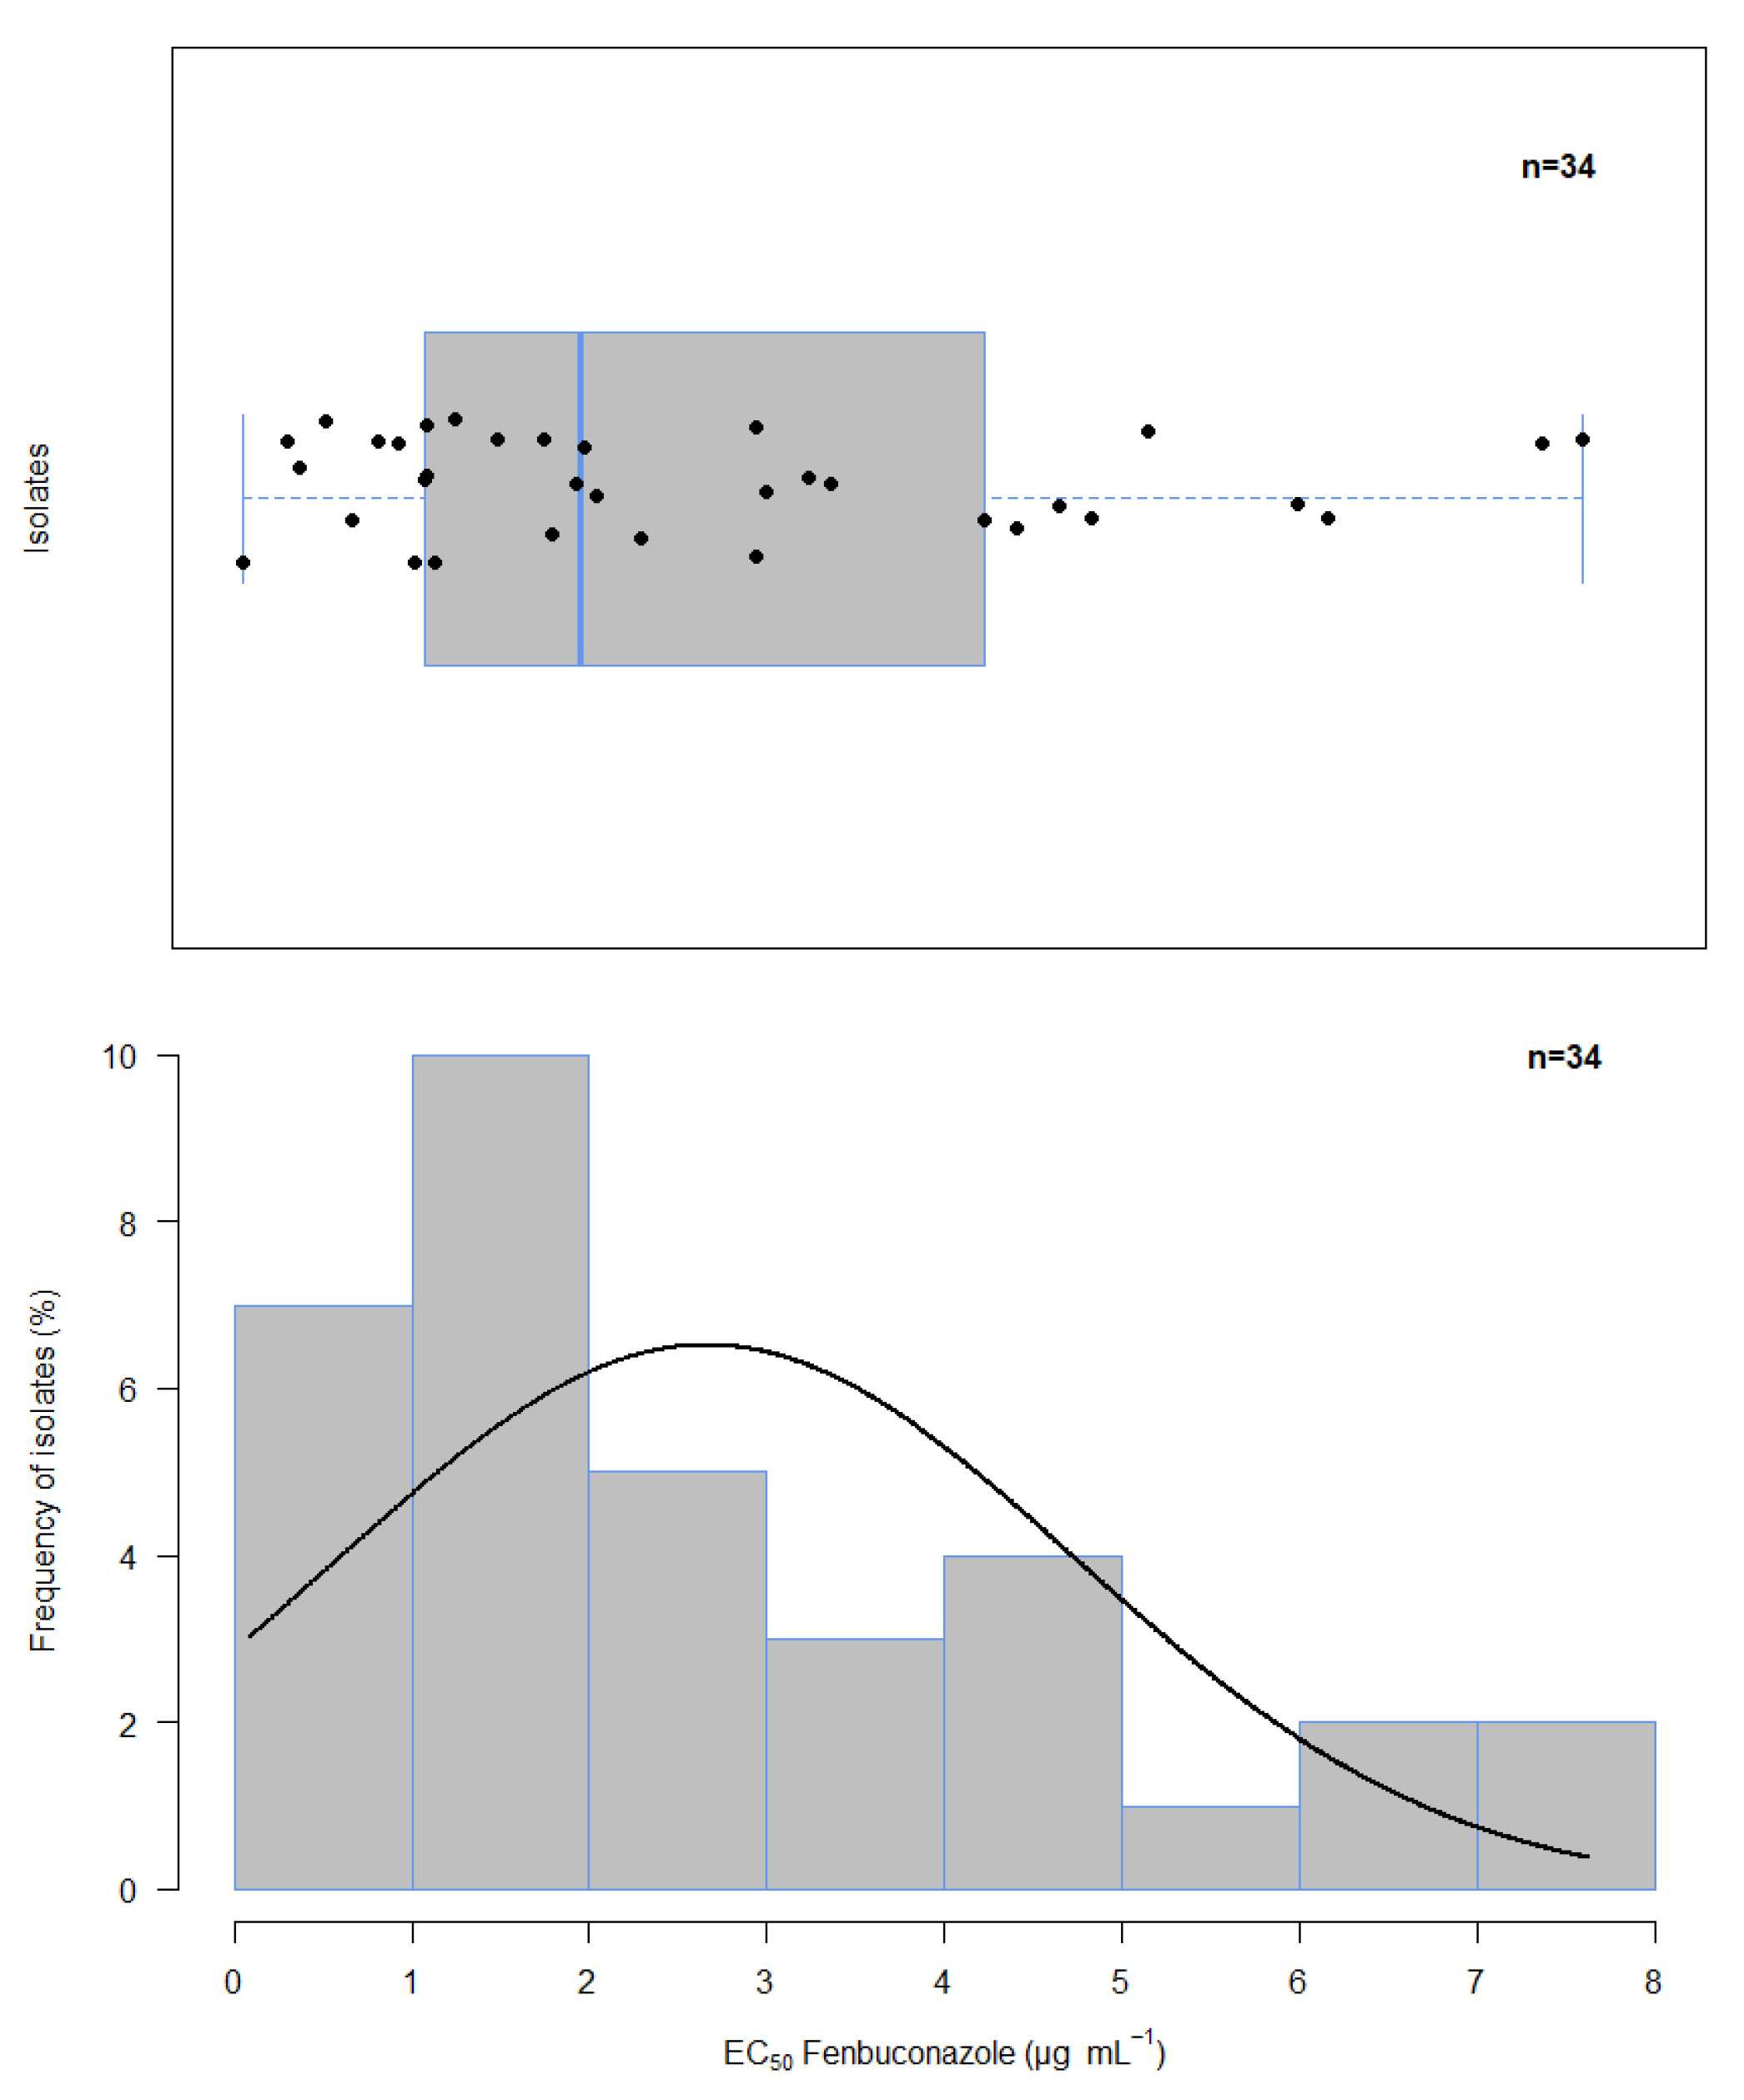
3.1. Mycelium Growth Inhibition Assay
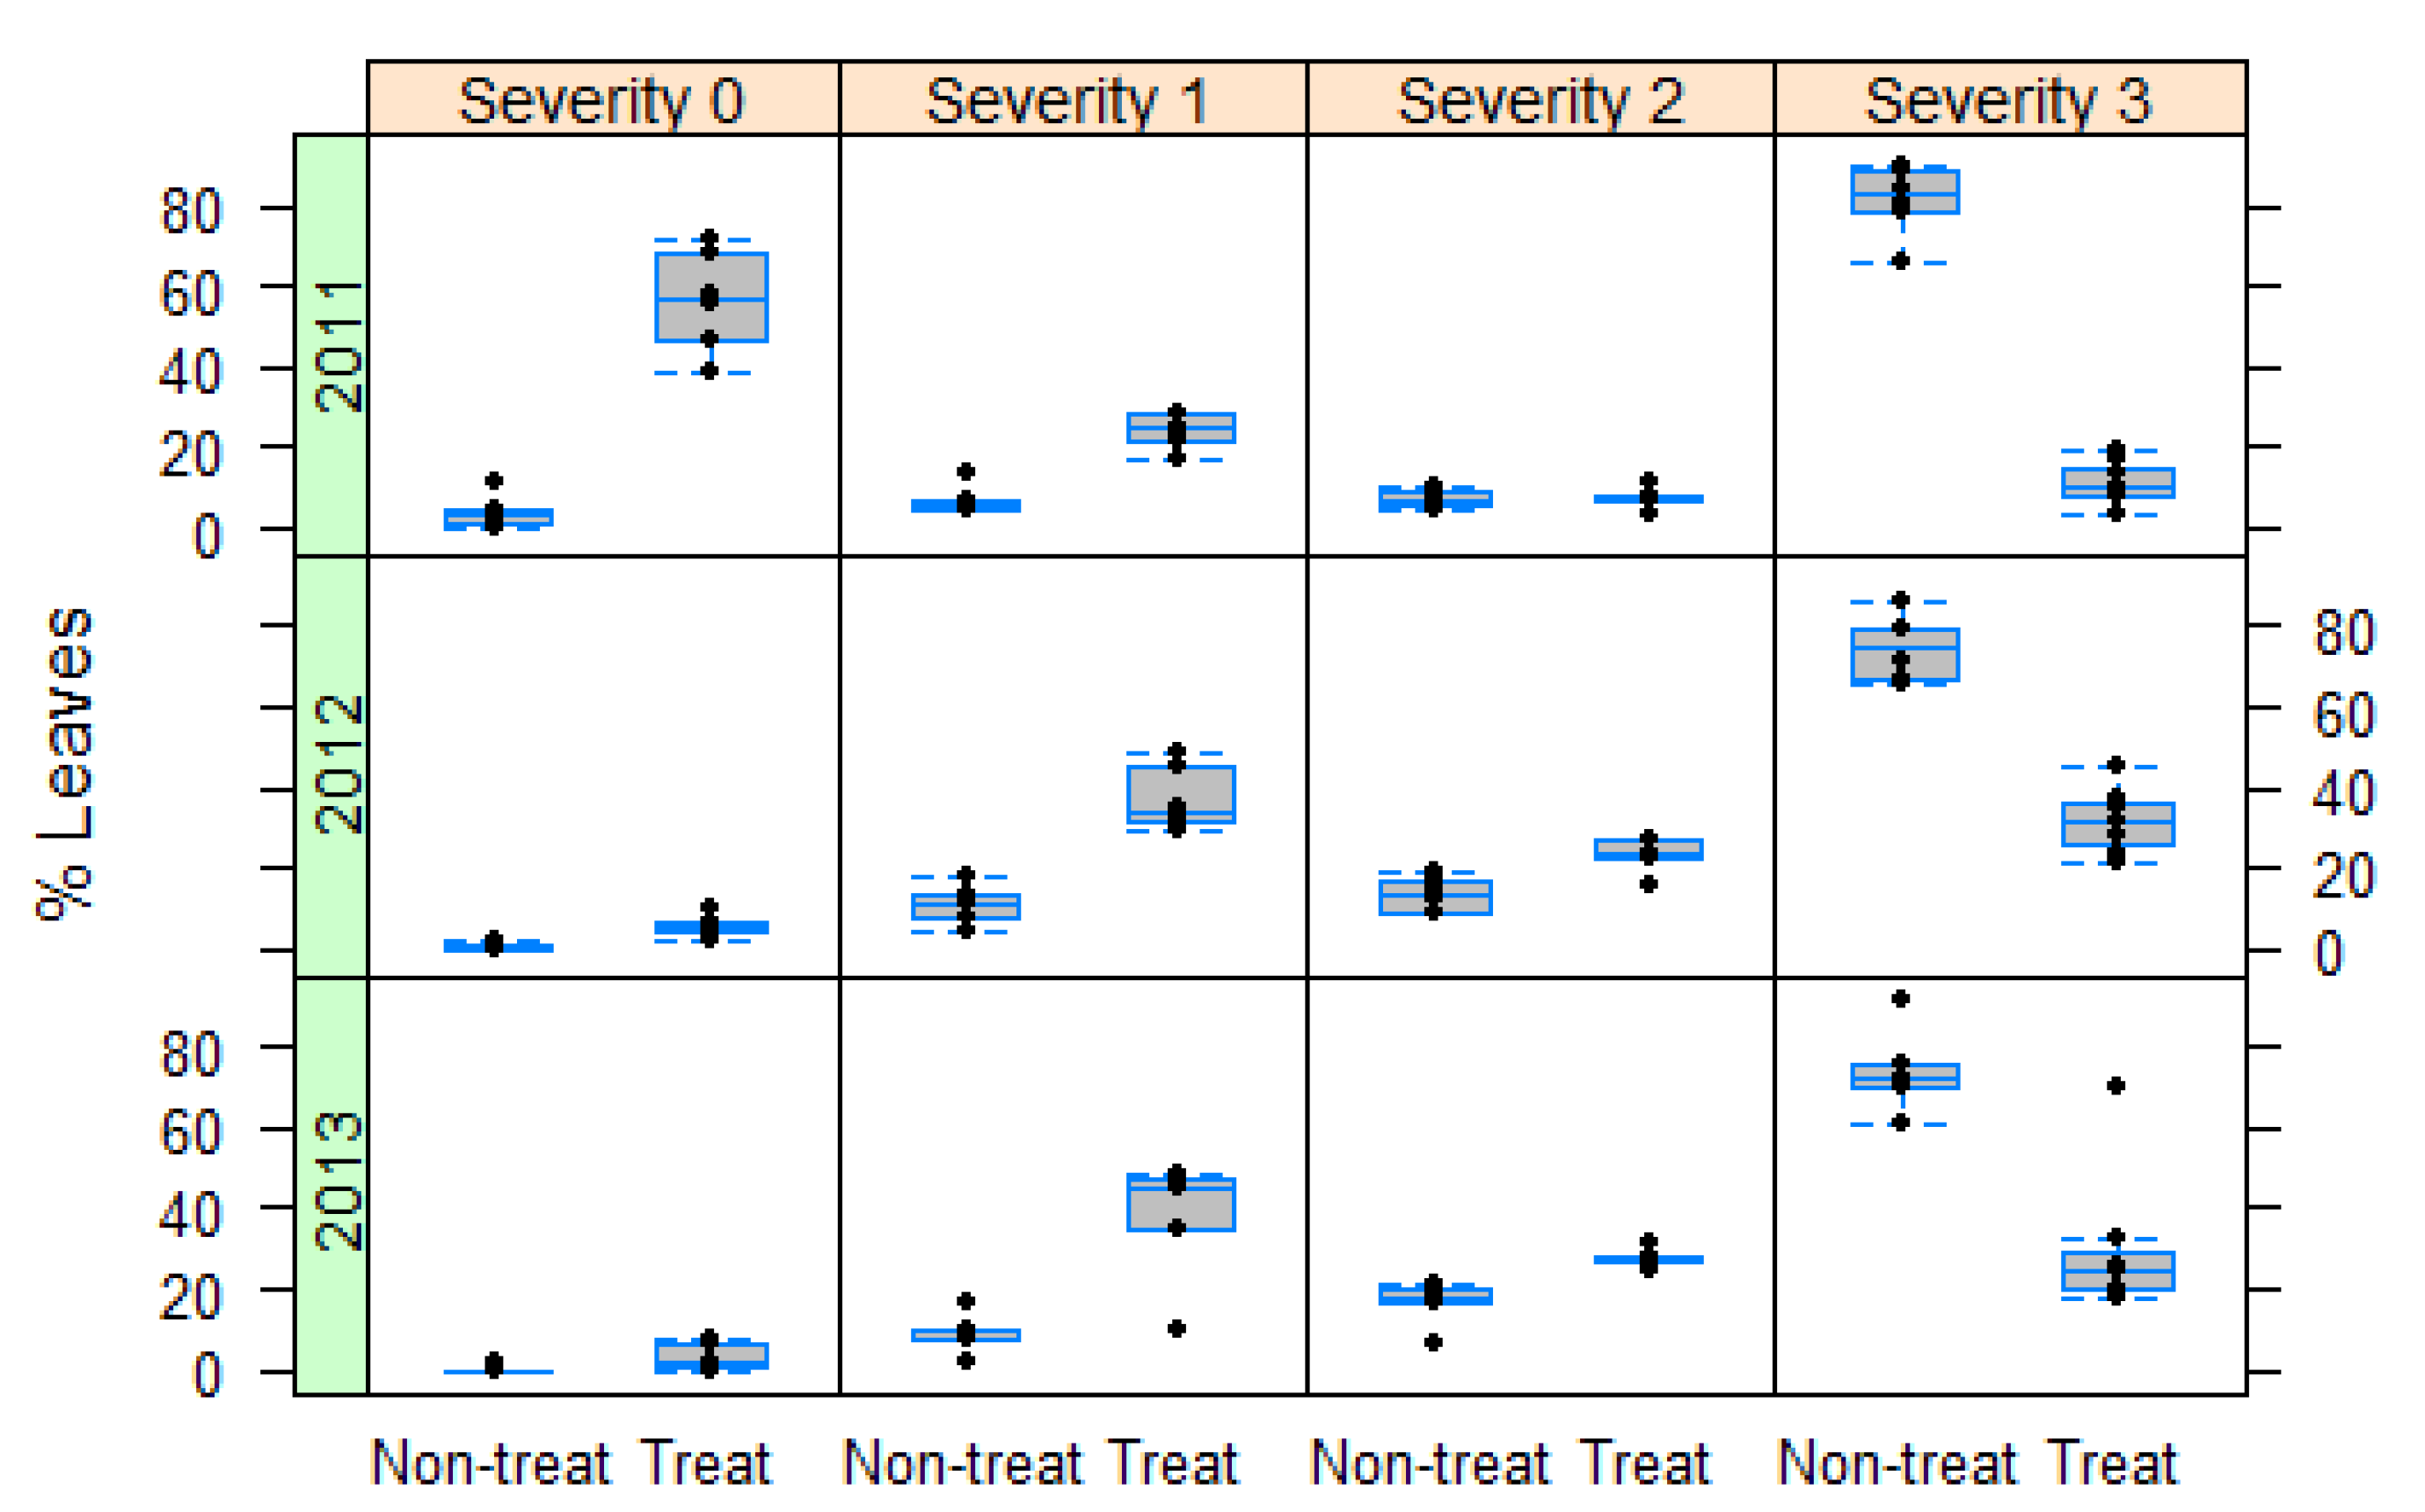
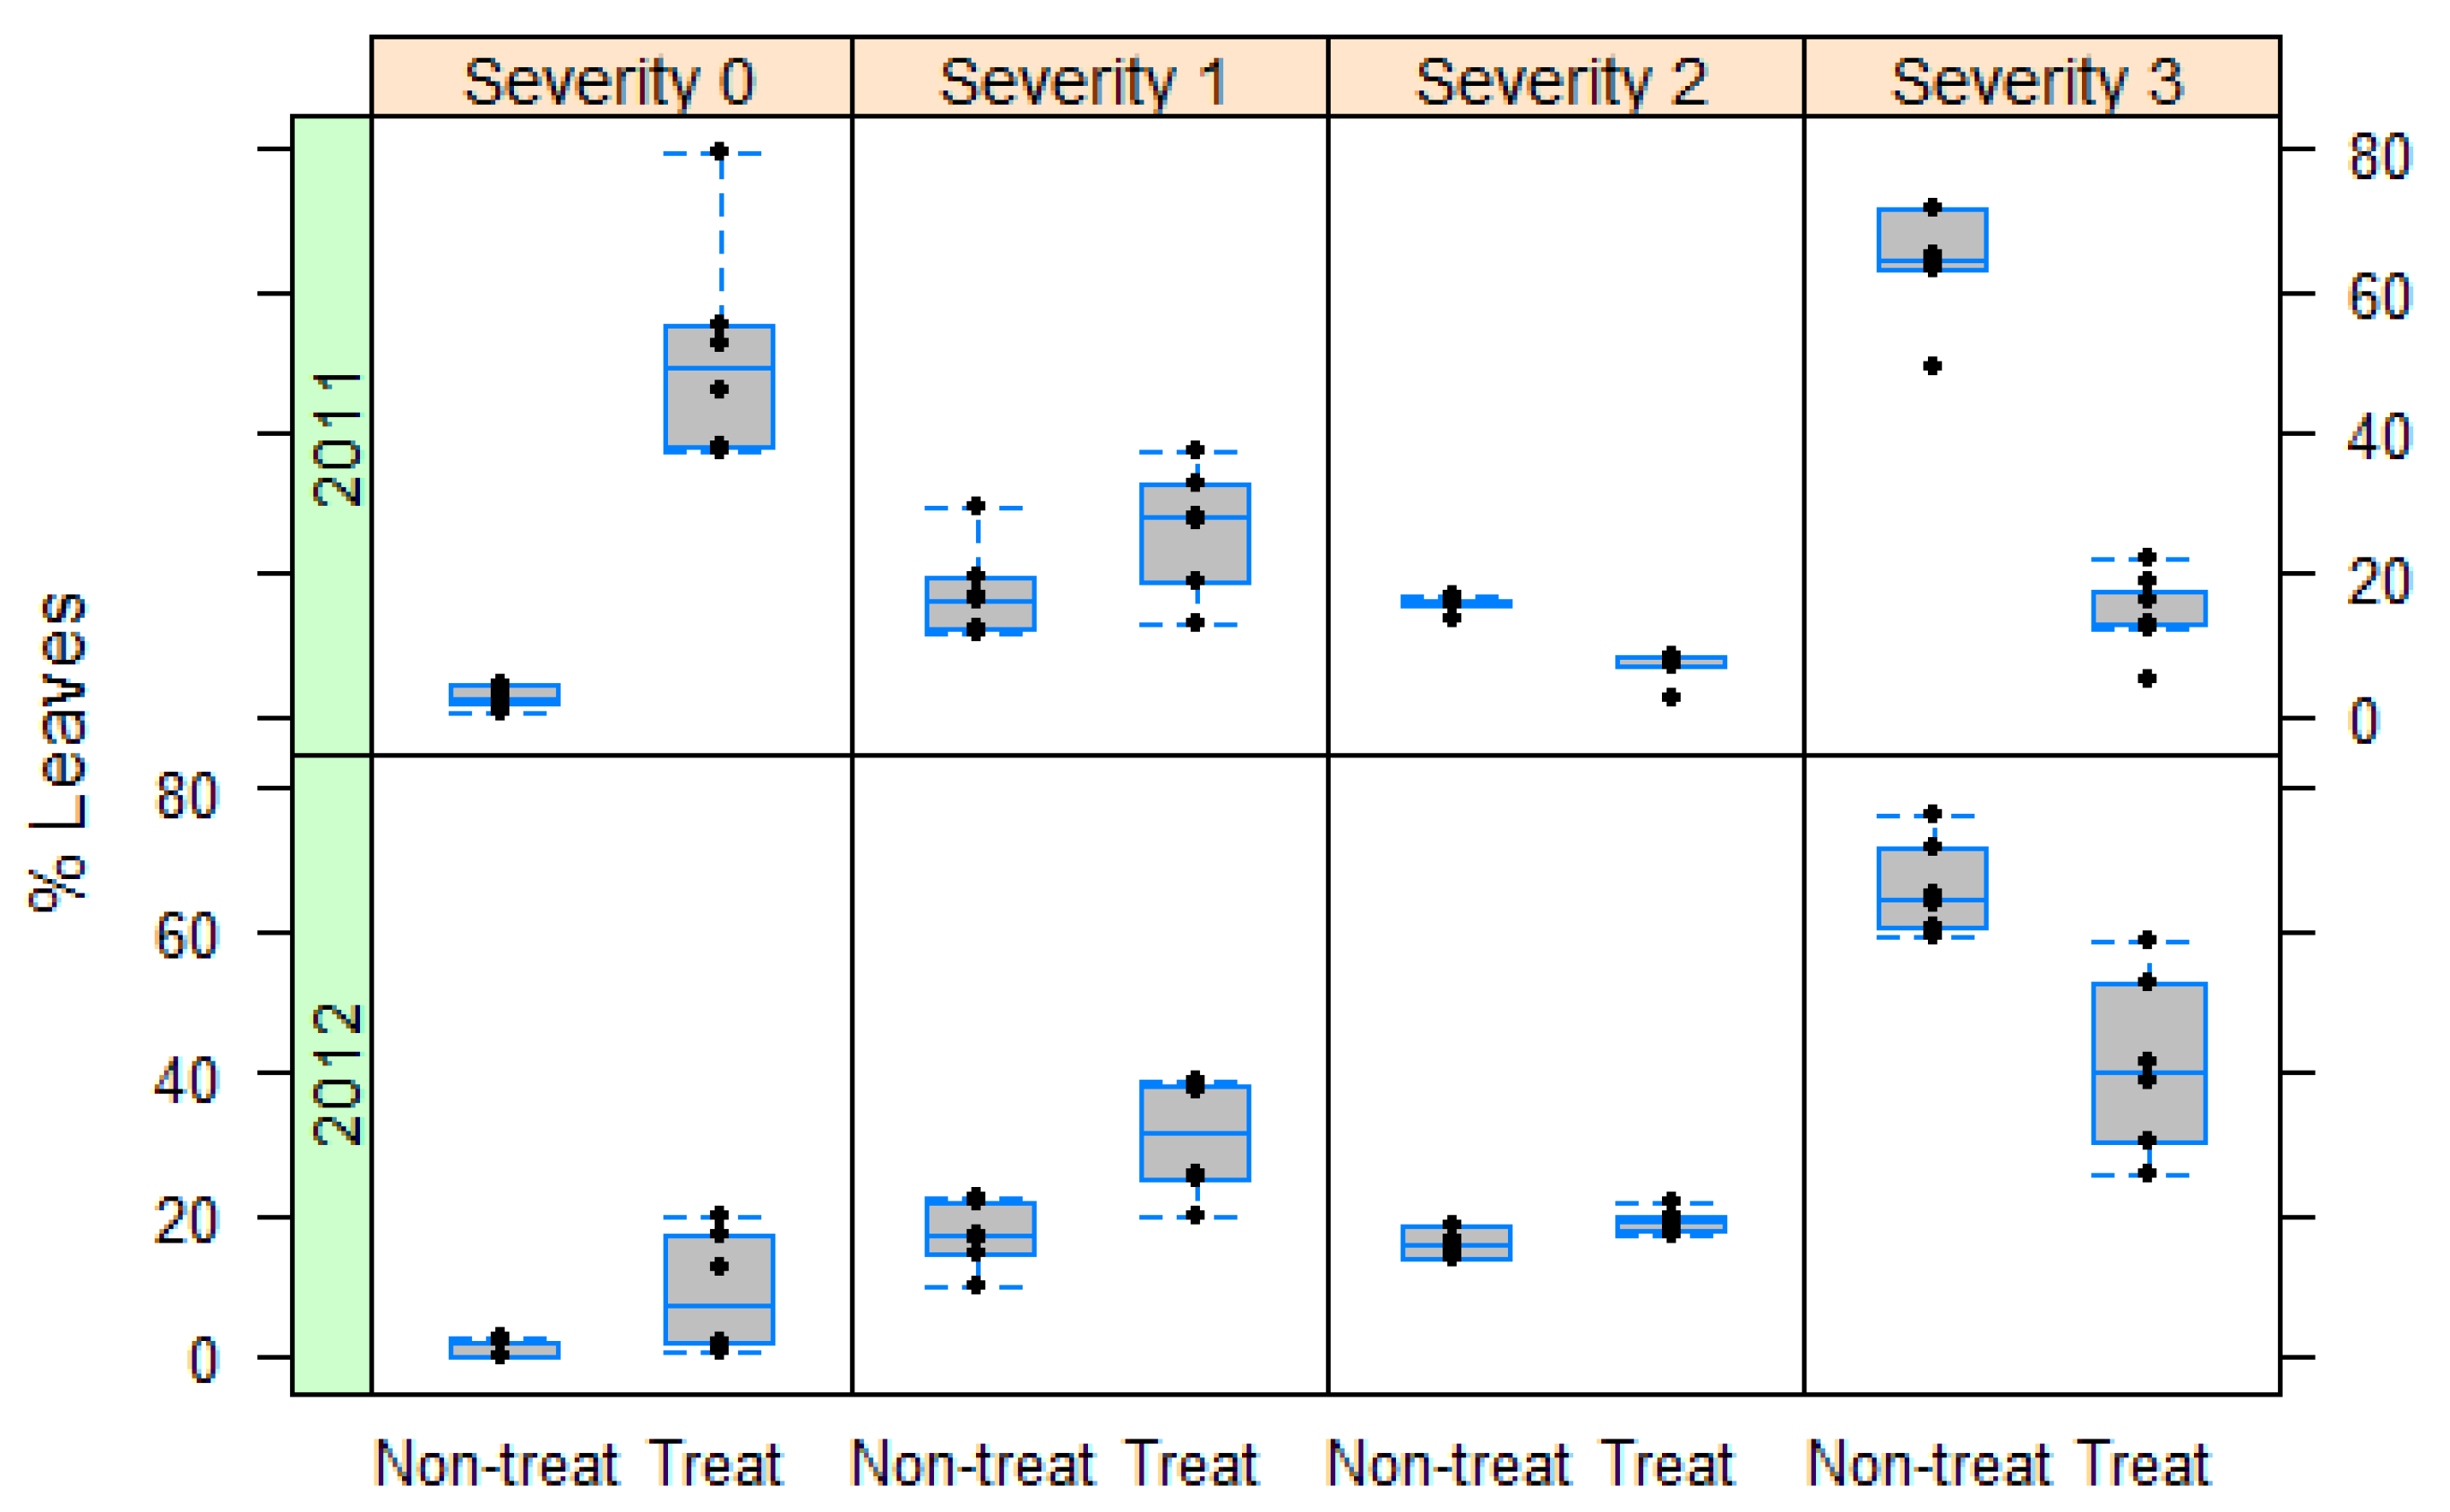
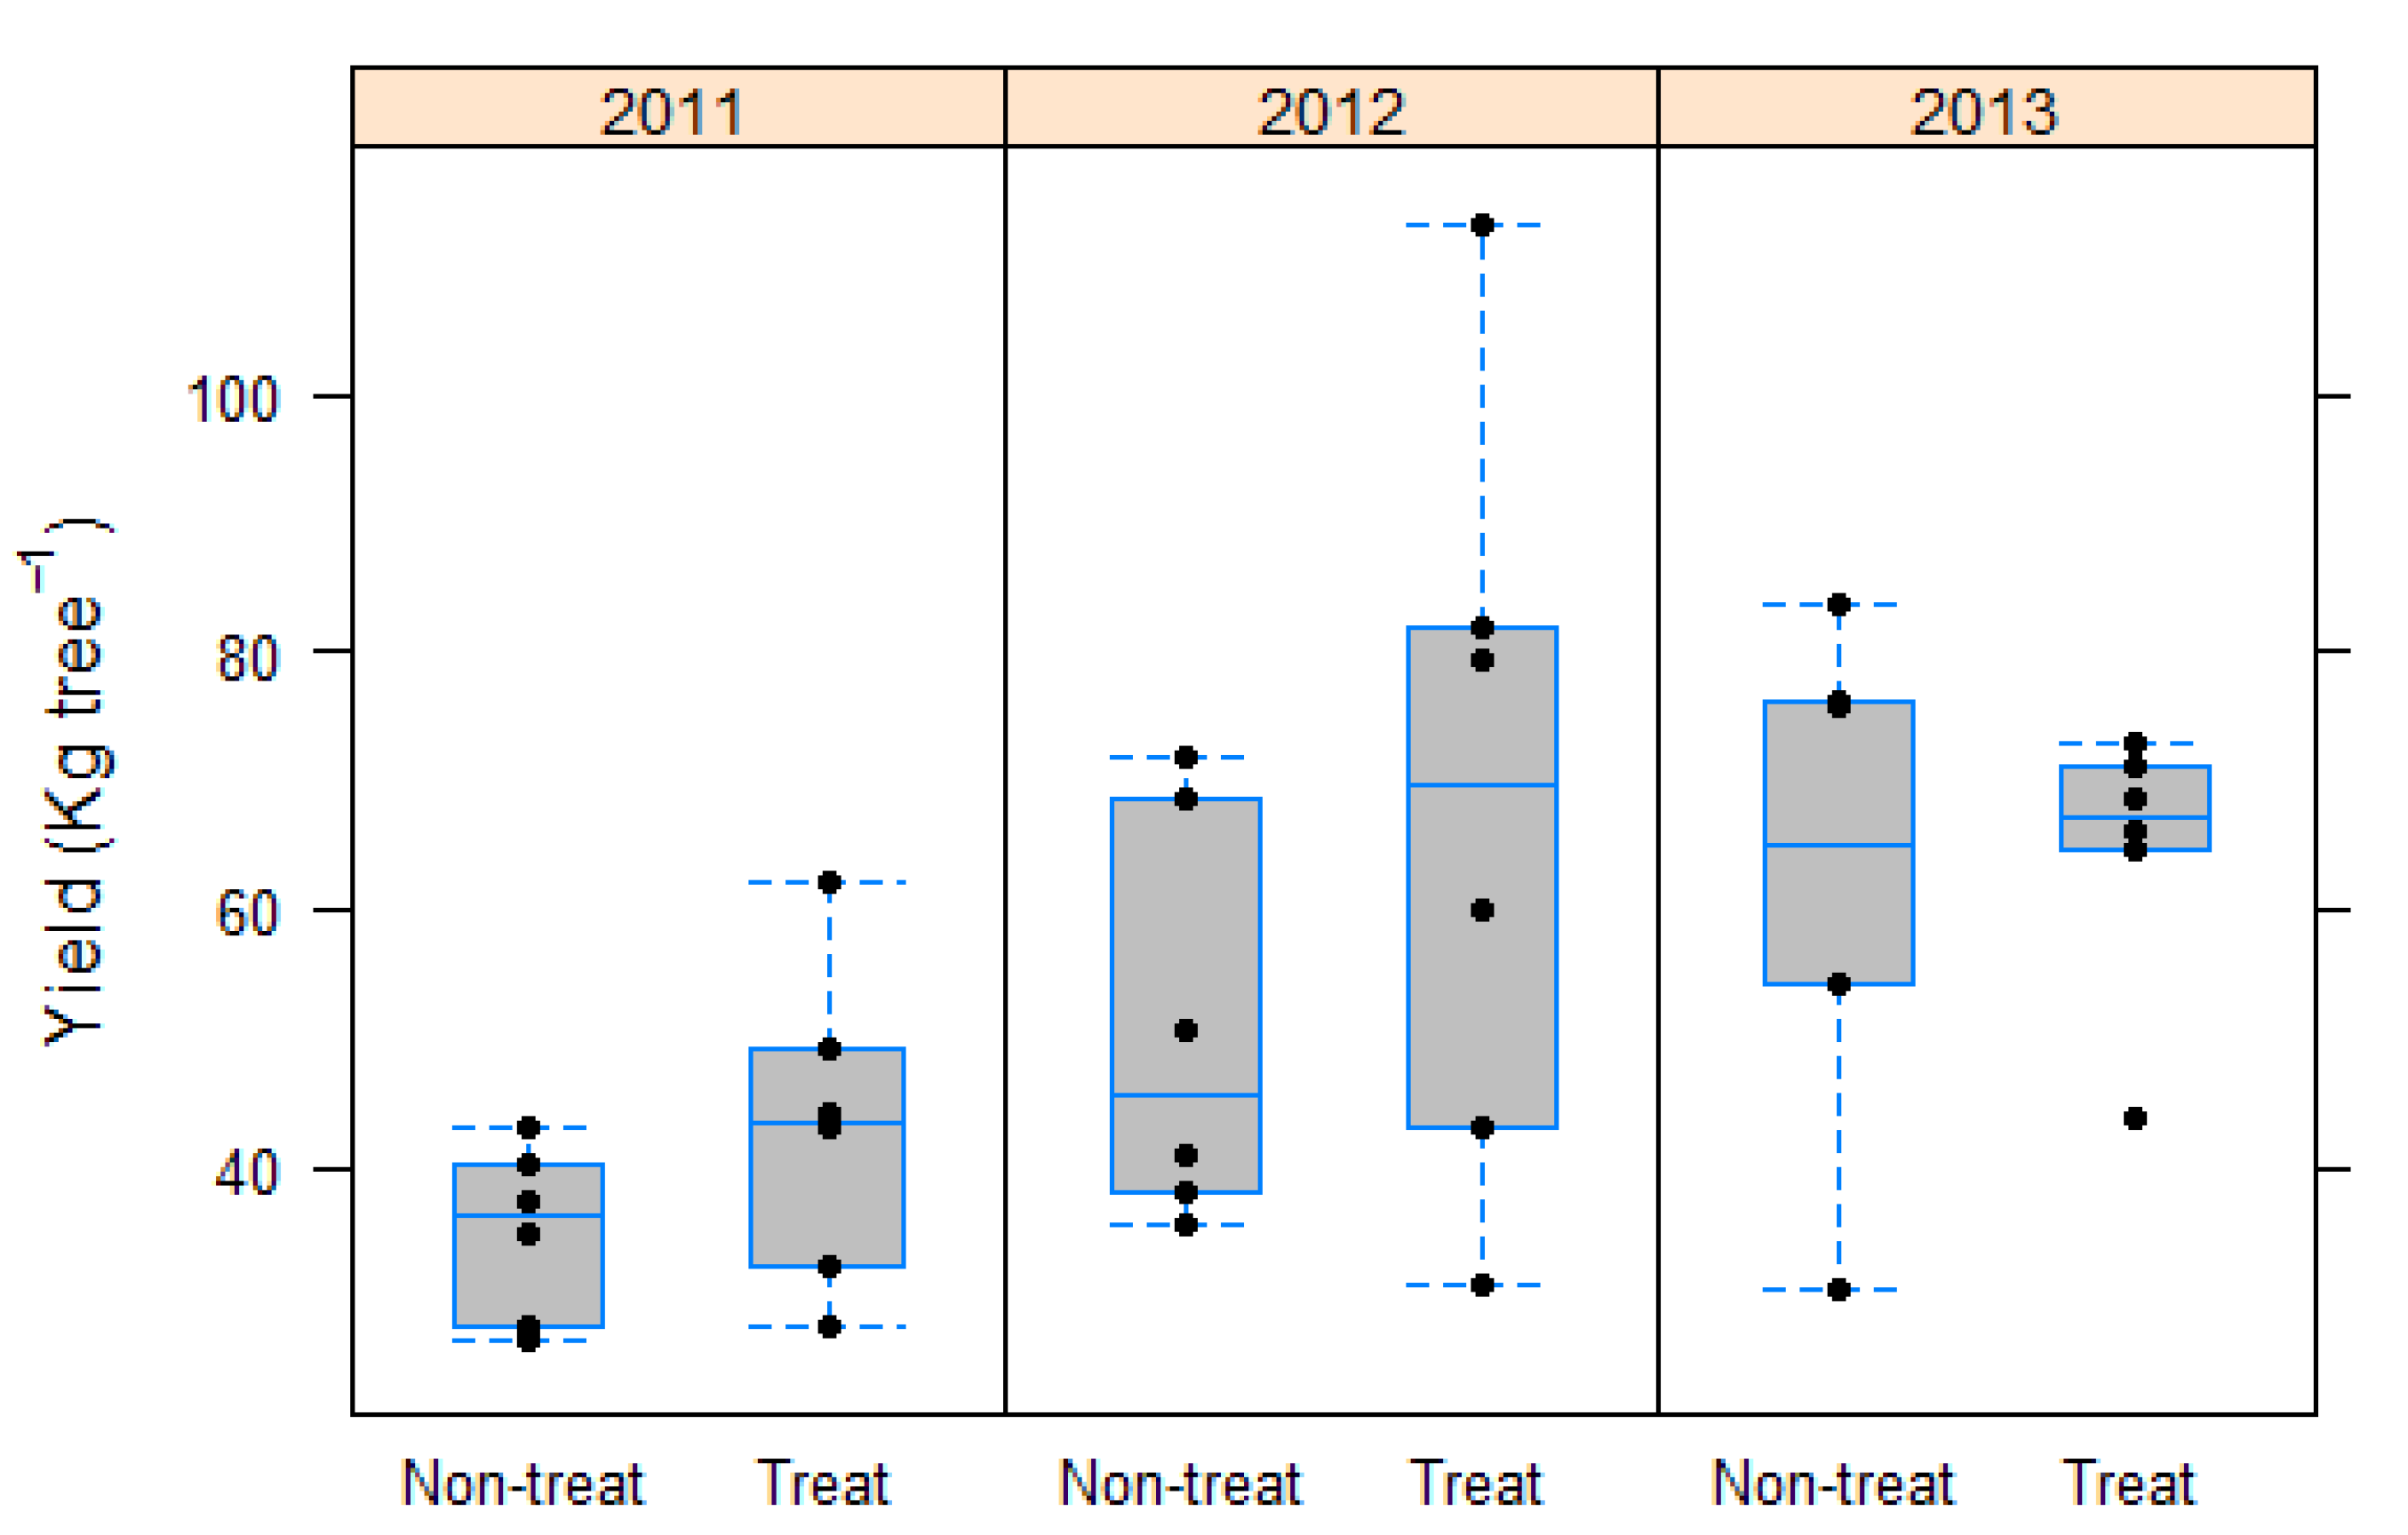
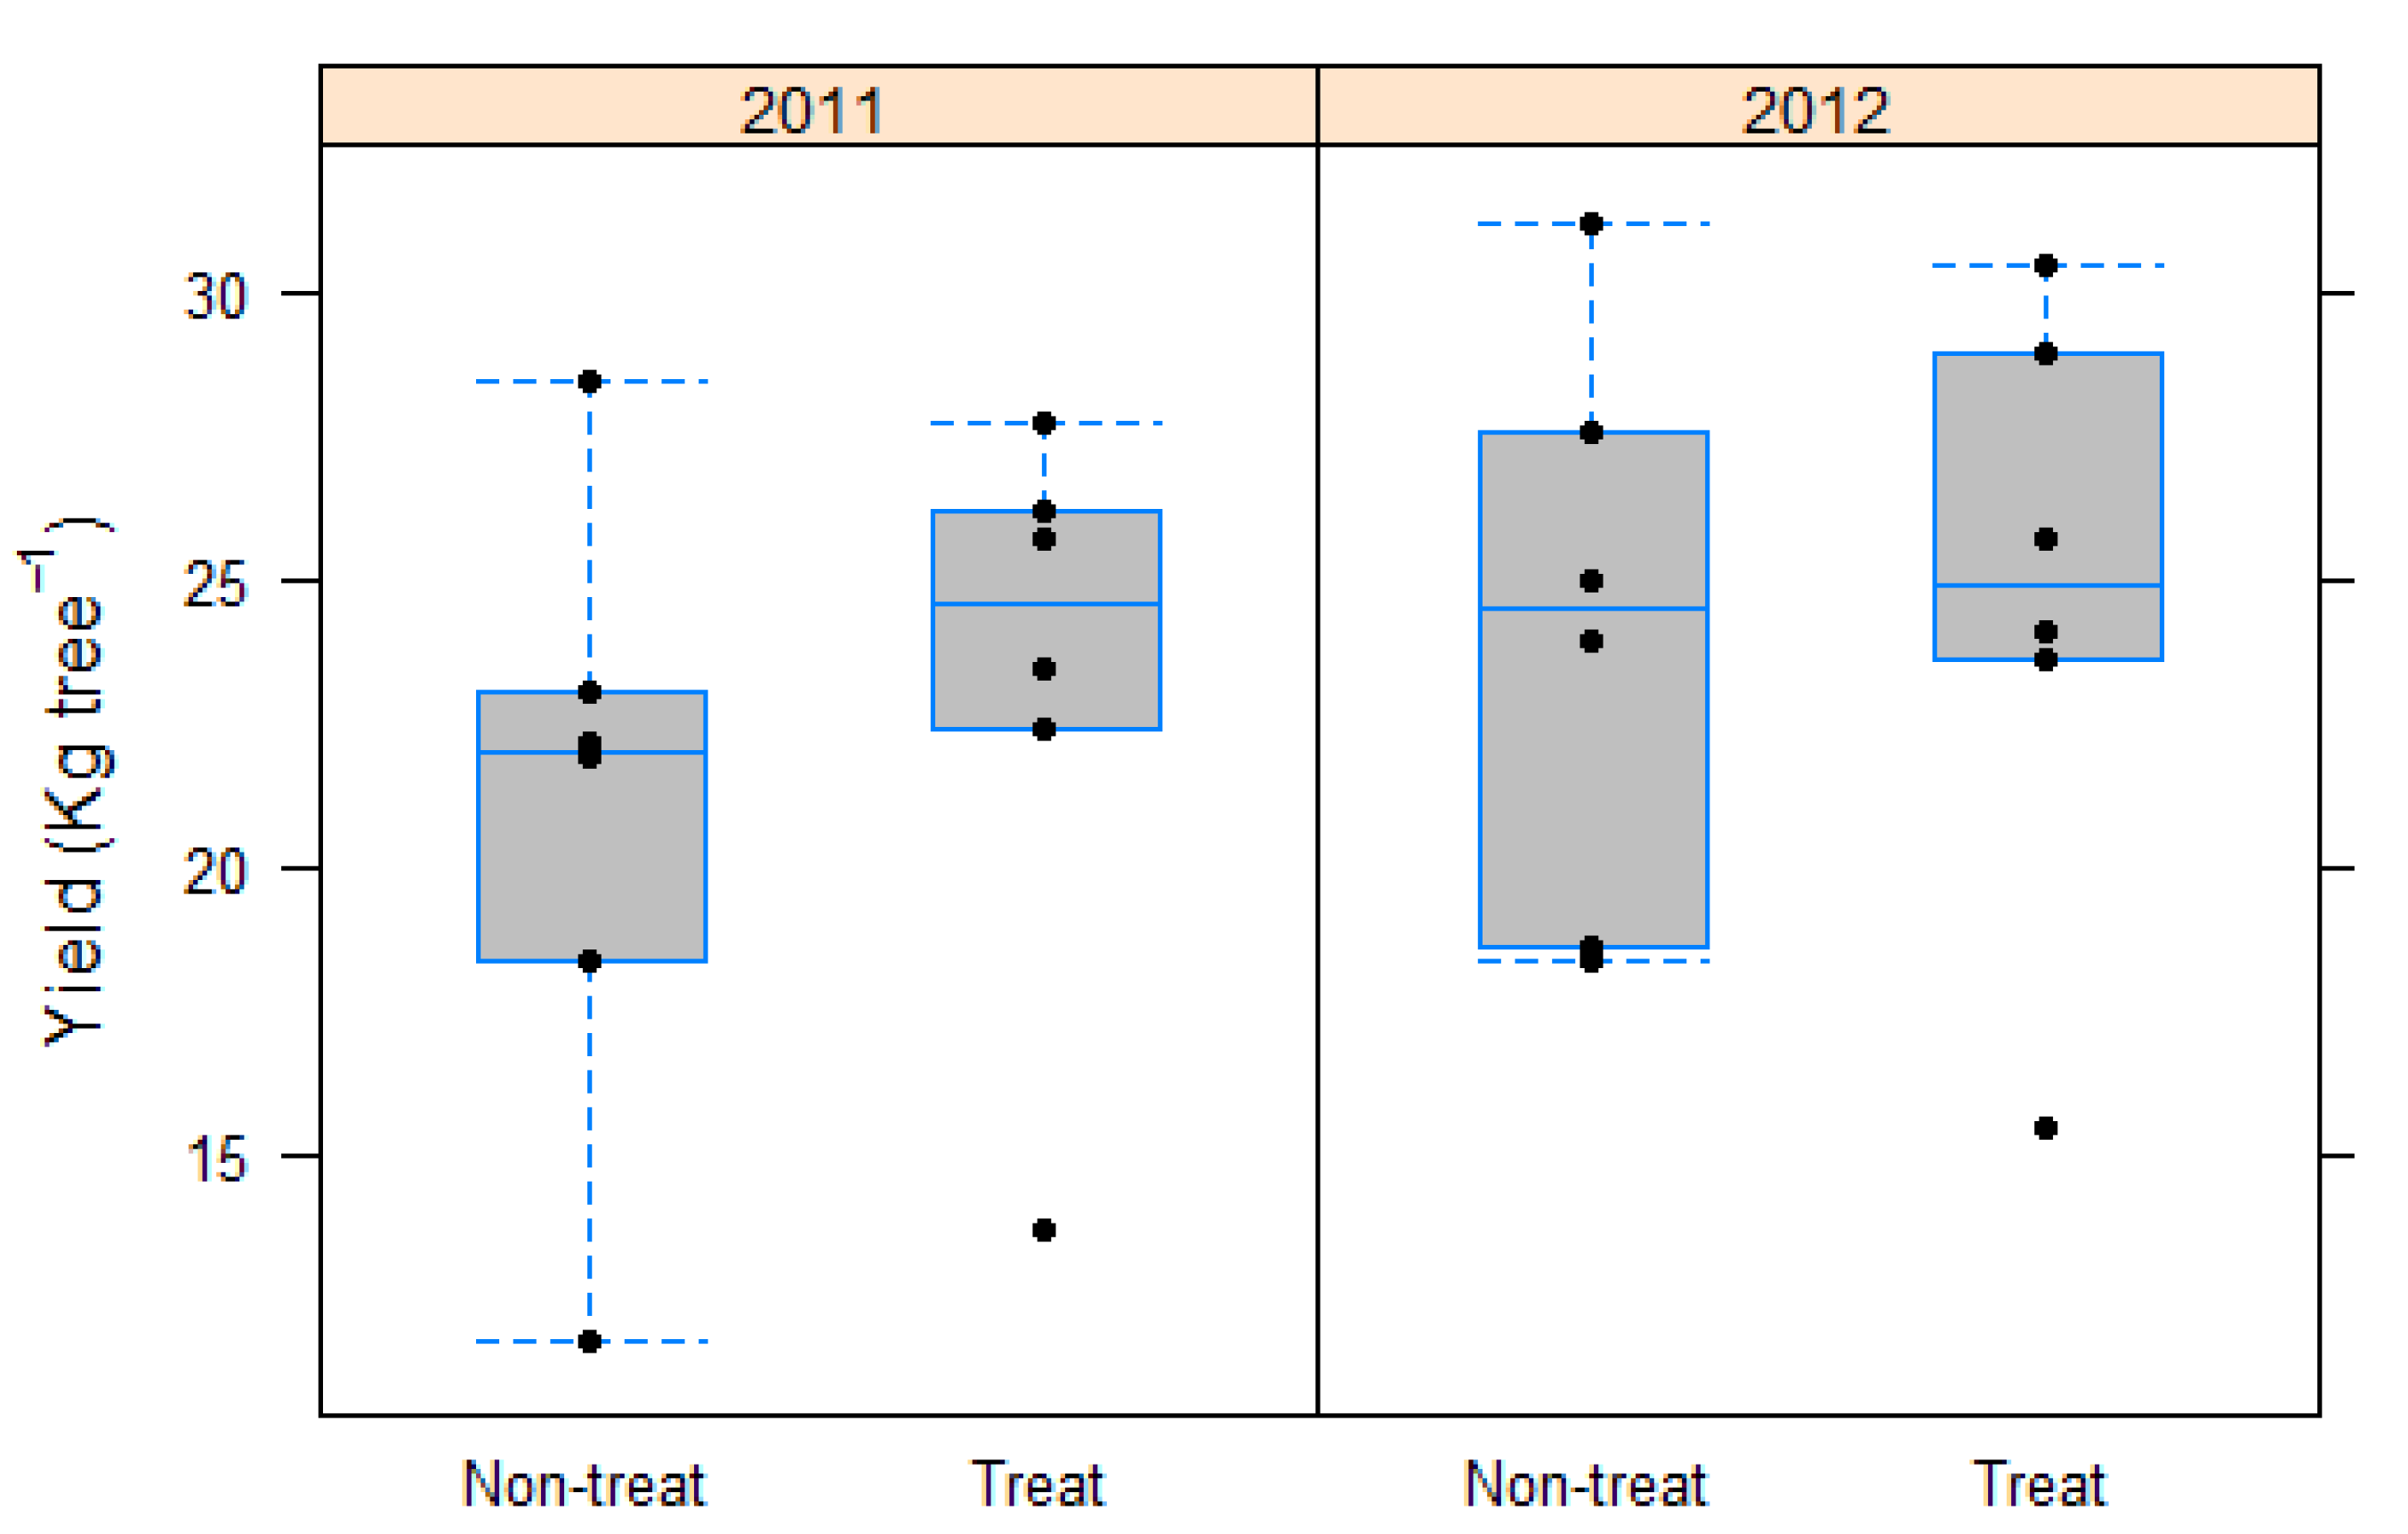
The EC 50 values of 34 isolates of Z. citri-griseum collected from different provinces of Panama exposed to fenbuconazole ranged from 0.09 to 7.62 μ g mL 1 (Table 1), with a mean ± standard error (SE) of 2.66 ± 0.36 μ g mL 1 . The box-whisker plot (Figure 1) showed a median value of 1.98 μ g mL 1 with a interquartile range from 1.11 to 4.04 μ g mL 1 and no outliers were observed. The frequency distribution of EC 50 to fenbuconazole of the 34 isolates of Z. citri-griseum included in the assay showed a unimodal curve with a positive skew (Figure 1). The frequency of isolates with EC 50 values <1 μ g mL 1 represented 20.6% (n = 7). For EC 50 from 1 to 5 μ g mL 1 the frequency was 64.7% (n = 22) and for EC 50 values >5 μ g mL 1 represented 14.7% (n = 5).

3.2. Field Trials

In experiment 1 in 2011, 57.22% of the leaves were in the severity category 0 (no lesions) in the trees treated with three fenbuconazole sprays while only 3.95% in the non-treated control (Figure 2). The non-treated control showed 81.39% of the leaves in the severity category 3 (>20 leaf spots) in contrast to the 10.82% in the trees treated with fenbuconazole. In 2012 and 2013, the percentages of leaves in the severity category 0 in the trees with one spray of fenbuconazole decreased to 5.83% and 3.14%, respectively. The percentage of leaves in category 0 in the non-treated control was 0.54% in 2012 and 0.27% in 2013. Values for category 3 in the non-treated control were 74.96% in 2012 and 74.26% in 2013. In the trees with one spray of fenbuconazole, the percentage of leaves in category 3 was 33.38% and 33.15% in 2012 and 2013, respectively.
In experiment 2 in 2011, the percentage of leaves in the severity category 0 (no lesions) in the trees with three sprays of fenbuconazole was 51.55% whereas only 2.62% in the non-treated control (Figure 3). The percentage of leaves in the severity category 3 (>20 leaf spots) was 14.66% in the trees treated with fenbuconazole and 64.31% in the non-treated control. In 2012, the percentage of leaves in category 0 decreased to 8.34% in the trees treated with one spray of fenbuconazole and 0.82% in the non-treated control. On the contrary, the percentage of leaves in category 3 increased to 42% in trees treated with fenbuconazole and 66.12% in the non-treated control.
In experiment 1, the proportional odds logistic regression model applied to the disease severity categories showed a significant effect (p < 0.0001) of the factor treatment in the three years of study (2011, 2012 and 2013) (Table 2). The negative values of the estimate for the treatment factor in the years 2011 (−3.55), 2012 (−1.79) and 2013 (−1.80) indicated a higher probability of obtaining lower values of disease severity in trees treated with fenbuconazole. In experiment 2, the results of the proportional odds logistic regression model also showed a significant effect (p < 0.0001) of the factor treatment in the two years of study (Table 3). Likewise, the negative values of the estimate in the years 2011 (−2.70) and 2012 (−1.05) indicated a higher probability of obtaining lower values of disease severity in the trees treated with fenbuconazole.
Odds ratio and 95% confidence interval values for the trees treated with fenbuconazole in experiment 1 are shown in Table 4. As it is observed, for non-treated trees, the odds of presenting higher disease severity were 34.81, 5.99 and 6.05 times than for treated trees in 2011, 2012 and 2013, respectively. Fenbuconazole applied 1 or 3 times reduced disease severity compared with the non-treated control in all years as the 95% confidence interval of the odds ratio did not overlap the null value of 1. The predicted probabilities for disease severity categories in the trees treated with fenbuconazole and the non-treated control in experiment 1 are shown in Table 4. In 2011, a high probability of occurrence of severity category 0 (no lesions) was observed in the trees treated with three sprays of fenbuconazole (0.57), in contrast with the low probability (0.04) of occurrence of this severity category in the non-treated control. On the other hand, a high probability (0.81) of occurrence of severity category 3 (>20 leaf spots) was obtained for the non-treated control compared with a low probability (0.11) for the trees treated with fenbuconazole. In 2012 and 2013, the predicted probability for the severity category 3 in the non-treated control was higher (0.74) than in the trees treated with one spray of fenbuconazole (0.33).
Odds ratio and 95% confidence interval values for the trees treated with fenbuconazole in experiment 2 are shown in Table 4. As it is observed, for non-treated trees, the odds of presenting higher disease severity were 14.88 and 2.86 times than for treated trees in 2011 and 2012, respectively. Fenbuconazole applied 1 or 3 times reduced disease severity compared with the non-treated control in all years as the 95% confidence interval of the odds ratio did not overlap the null value of 1. The predicted probabilities for disease severity categories in the trees treated with fenbuconazole and the non-treated control in experiment 2 are shown in Table 4. In 2011, the trees with three sprays of fenbuconazole showed a high probability (0.50) of occurrence for the severity category 0 (no lesions) in contrast with the non-treated control that showed a very low probability (0.06). On the other hand, the non-treated control showed a high probability (0.66) of occurrence of severity category 3 (>20 leaf spots) compared with the trees treated with fenbuconazole that showed a low probability (0.11) for this same severity category. In 2012, the predicted probability for the severity category 3 in the non-treated control was still high (0.67) compared with the trees with one spray of fenbuconazole (0.41) (Table 4).
In experiment 1 conducted at Tambo, average yield in the grapefruit trees treated with fenbuconazole was 42.98 kg tree 1 in 2011, 68.12 kg tree 1 in 2012 and 64.45 kg tree 1 in 2013 (Figure 4). Average yield in the non-treated control was 35.01 kg tree 1 in 2011, 50.87 kg tree 1 in 2012, 62.46 kg tree 1 in 2013. In experiment 2 conducted at Miraflores, average yield in the sweet orange trees treated with fenbuconazole was 23.19 kg tree 1 in 2011 and 24.71 kg tree 1 in 2012 (Figure 5). Average yield in the non-treated control trees was 20.97 kg tree 1 in 2011 and 24.10 kg tree 1 in 2012.
Yield data (kg tree 1 ) from experiments 1 and 2 were normally distributed (p > 0.05) in all years, with homogeneous variances (p > 0.05). In experiment 1, no significant differences in yield were detected between the grapefruit trees treated with fenbuconazole and the non-treated control in 2011 (F = 1.96, d.f. = 1, 10, p = 0.19), 2012 (F = 1.57, d.f. = 1, 10, p = 0.24) and 2013 (F = 0.05, d.f. = 1, 10, p = 0.83). Likewise, in experiment 2 no significant differences in yield were detected between the sweet orange trees treated with fenbuconazole and the non-treated control in 2011 (F = 0.53, d.f. = 1, 10, p = 0.48) and 2012 (F = 0.04, d.f. = 1, 10, p = 0.84). The Breusch-Pagan test performed on the models residuals did not detect heterocedasticity of the variances (p > 0.05).

4. Discussion

In this study, the EC 50 values for mycelial growth of Z. citri-griseum isolates from Panama (n = 34) to fenbuconazole ranged from 0.09 to 7.62 μ g mL 1 (Table 1, Figure 1). In Florida, Mondal et al. [25] reported EC 50 values for Z. citri-griseum to fenbuconazole ranging from 0.13 to 0.75 μ g mL 1 . Our results showed a considerable variability of EC 50 , with some Z. citri-griseum isolates showing a phenotype of reduced sensitivity to fenbuconazole. In our study, 20.6% of Z. citri-griseum isolates tested had EC 50 <1 μ g mL 1 , similar to the EC 50 values reported by Mondal et al. [25] indicating sensitivity to fenbuconazole. Isolates with lower sensitivity to fenbuconazole had EC 50 values from 1 to 5 μ g mL 1 (64.7%) and >5 μ g mL 1 (14.7%). Rosenzweig et al. [40] categorized phenotypically the sensitivity of Cercospora beticola Sacc. to fenbuconazole and other DMI fungicides based on mean EC 50 values as being sensitive (<1 μ g mL 1 ); with reduced sensitivity (1–10 μ g mL 1 ); moderately insensitive (10–50 μ g mL 1 ); insensitive (50–100 μ g mL 1 ), and resistant (>100 μ g mL 1 ). Based on this classification, our results indicated that 20.6% of the isolates of Z. citri-griseum analyzed could be considered sensitive to fenbuconazole and 79.4% with reduced sensitivity.
The reduced sensitivity of Z. citri-griseum isolates to fenbuconazole detected in our study suggest that the isolates tested were previously exposed to this fungicide and/or other DMIs. Corio-Costet [41] indicated that the resistance to one DMI fungicide can confer positive cross-resistance to other molecules in the same group. Nevertheless, to elucidate the presence of resistance to DMIs in Z. citri-griseum populations in Panama, it would be necessary to detect point mutations or overexpression of the C14 α -demethylase (CYP51) by molecular analysis [16]. Another important aspect to consider when interpreting our results is the sample size used to determine the EC 50 . Franke et al. [42] indicated that is important to define the appropriate sample size to detect differences in fungicide sensitivity. In our study, a total of 34 isolates of Z. citri-griseum from different geographic areas of Panama were collected to calculate the EC 50 . However, in the study carried out by Mondal et al. [25] only five isolates were evaluated. The greater variability in EC 50 values of Z. citri-griseum to fenbuconazole detected in our study might be associated with the greater sample size used, capturing differences associated with the origin of the isolates and potential previous exposure to DMIs. Actually, Franke et al. [42] indicated that the minimum sample size depends on the variation of the EC 50 values, as a number of individuals less sensitive to the fungicides could significantly change the variance. Our results provide important data for monitoring sensitivity shifts in Z. citri-griseum to fenbuconazole and reduce the risk of fungicide resistance in Panama.
The efficacy of fenbuconazole to reduce the severity of foliar symptoms of greasy spot was evaluated on grapefruit (experiment 1) and sweet orange (experiment 2). In 2011, three sprays with fenbuconazole were applied from May to July resulting in lower disease incidence and severity than the non-treated controls. The reduction of greasy spot severity was illustrated by the 95% confidence intervals of the odds ratios in experiment 1 (30.75–39.47) and experiment 2 (13.21–16.85), not overlapping the null value of 1 in either case. Our results are in line with those obtained in Costa Rica, where two sprays with copper compounds applied in June and August coinciding with the first leaf flush of ’Valencia’ sweet orange significantly reduced the incidence and severity of greasy spot and subsequent defoliation [1]. Similar results were reported by Timmer et al. [2] in experiments carried out in Florida on ’Marsh White’ and ’Ruby Red’ grapefruits with two copper applications in June and August during the spring flush. Mondal and Timmer [21] indicated that one or two fenbuconazole applications before the development of epiphytic mycelium in July completely controlled greasy spot in the spring flush. In our study, the first fenbuconazole spray was applied at the beginning of shoot emergence in May, coinciding with the onset of the infection period of Z. citri-griseum in Panama [43].
When a single spray of fenbuconazole was applied in 2012 and 2013 in experiment 1 and 2012 in experiment 2, disease incidence doubled that of 2011 when three sprays were applied. The 95% confidence intervals of the odds ratios for the experiment 1 in 2012 (5.50–6.55) and 2013 (5.47–6.70) were lower than those obtained in 2011, but did not overlap the null value of 1 in either case. Similar results were obtained in experiment 2, with a 95% confidence interval for the odds ratio in 2012 (2.85–3.16) lower than in 2011. The more effective disease control achieved in 2011 was likely due to the two additional sprays applied during the infection period, which probably inhibited the epiphytic growth of the pathogen for a longer period of time.
Although with lower efficacy, disease severity was significantly reduced with a single spray of fenbuconazole compared with the non-treated control. Our results are in line with those by Timmer et al. [2], who reported effective control of greasy spot with a single application of copper applied in June in three experiments carried out in Florida on grapefruit. Similarly, other experiments on grapefruit in Florida also reported reductions in greasy spot severity with a single spray of fenbuconazole applied in June or July [18,19,20]. Actually, a single spray with petroleum oil applied in mixture with copper from mid-May to June is recommended for greasy spot control in processing sweet oranges in Florida [44]. For processing grapefruits, two sprays are recommended instead [44]. QoI and DMI fungicides, including fenbuconazole, are also recommended for greasy spot control with or without petroleum oil [45]. In the case of fenbuconazole, it provides effective control of the disease on both leaves and fruit [44]. In our case, no rind blotch symptoms on fruit were observed in the field trials, nor in our previous surveys [4,31].
Despite the significant reduction of greasy spot severity on leaves in the trees treated with fenbuconazole, particularly in 2011 when three sprays were applied, no significant differences in yield were found in any of the experiments. Timmer et al. [46] reported similar results in Texas, where several fungicide spray programs were evaluated for greasy spot control on grapefruit during 4 consecutive years. Despite greasy spot severity on leaves and rind blotch incidence on fruit were significantly reduced, yields (kg tree 1 ) were not significantly improved. Likewise, Showler et al. [11] reported in Texas that sprays with aqueous organic mixtures applied for three consecutive years reduced disease incidence in grapefruit, but differences in yield (No. fruit tree 1 ) were only detected the first year. In our case, experiments for greasy spot control should probably have covered a longer period of time, allowing the treated trees to completely recover their leaf area and thus have an impact on yields. Furthermore, the higher control efficacy observed when three fenbuconazole sprays were applied instead of one indicates that intensive spray program would be probably needed under the rainfed conditions of Panama. In fact, in Florida two applications are needed when severe defoliation due to greasy spot occurred in the previous year [44]. In those cases, the first spray should be applied from mid-May to June and the second soon after the major summer flush has expanded [44]. In addition to the disease itself, it is important to consider the concurrence of other limiting agronomic factors. Rainfed conditions and typical crop management practices in Panama may result in nutritional deficiencies and seasonal water stress (January to March), which could seriously limit citrus yields and thus masking the effects of disease control.

Author Contributions

Conceptualization, V.A.-C. and A.V.; formal analysis, V.A.-C. and A.V.; funding acquisition, V.A.-C. and A.V.; methodology, V.A.-C. and A.V.; supervision, A.V.; writing—review and editing: V.A.-C. and A.V. All authors have read and agreed to the published version of the manuscript.

Funding

This research was funded by the Secretaría Nacional de Ciencia, Tecnología e Innovación (SENACYT; grant 2017-4-ITE16-R2-009) of Panama and ’Programa de Formación de los INIA Iberoamerica’ and INIA RTA2010-00105-00-00-FEDER.

Conflicts of Interest

The authors declare no conflict of interest.

References

  1. Hidalgo, H.; Sutton, T.B.; Arauz, F. Epidemiology and control of citrus greasy spot on Valencia orange in the humid tropics of Costa Rica. Plant Dis. 1997, 81, 1015–1022. [Google Scholar] [CrossRef]
  2. Timmer, L.W.; Gottwald, T.R. Greasy Spot and Similar Diseases. In Compendium of Citrus Diseases; Timmer, L.W., Garnsey, S.M., Graham, J.H., Eds.; APS Press: St. Paul, MN, USA, 2000; pp. 25–28. [Google Scholar]
  3. Mondal, S.N.; Timmer, L.W. Greasy spot, a serious endemic problem for citrus production in the Caribbean Basin. Plant Dis. 2006, 90, 532–538. [Google Scholar] [CrossRef]
  4. Aguilera-Cogley, V.; Vicent, A. Etiology and distribution of foliar fungal diseases of citrus in Panama. Trop. Plant Pathol. 2019, 44, 519–532. [Google Scholar] [CrossRef]
  5. Diaz, J.A.; Brown, O.; Herrera, L. Influence of greasy spot (Mycosphaerella citri Whiteside) on Valencia orange yields. Cent. Agric. 1985, 12, 127–137. [Google Scholar]
  6. Timmer, L.W. Diseases of Fruit and Foliage. In Citrus Health Management; Timmer, L.W., Duncan, L.W., Eds.; APS Press: St. Paul, MN, USA, 1999; pp. 107–115. [Google Scholar]
  7. Timmer, L.W.; Mondal, S.N.; Peres, N.A.; Bhatia, A. Fungal Diseases of Fruit and Foliage of Citrus Trees. In Diseases of Fruits and Vegetables Volume I; Naqvi, S.M.H., Ed.; Springer: Dordrecht, The Netherlands, 2004; pp. 191–227. [Google Scholar]
  8. Laranjeira, F.F.; Silva, S.X.; Murray-Watson, R.E.; Soares, A.C.; Santos-Filho, H.P.; Cunniffe, N.J. Spatiotemporal dynamics and modelling support the case for area-wide management of citrus greasy spot in a Brazilian smallholder farming region. Plant Pathol. 2020, 69, 467–483. [Google Scholar] [CrossRef]
  9. Mondal, S.N.; Timmer, L.W. Effect of urea, CaCO3, and dolomite on pseudothecial development and ascospore production of Mycosphaerella citri. Plant Dis. 2003, 87, 478–483. [Google Scholar] [CrossRef] [PubMed] [Green Version]
  10. Timmer, L.W.; Zitko, S.E. Evaluation of nutritional products and fungicides for control of citrus greasy spot. Proc. Fla. State Hortic. Soc. 1995, 108, 83–87. [Google Scholar]
  11. Showler, A.T. Suppression of greasy spot disease caused by Mycosphaerella citri Whiteside on grapefruit trees in an organic orchard using an aqueous organic mixture of composted cornmeal, humic acid, molasses, and fish oil versus vegetable oil. Crop Prot. 2017, 99, 137–143. [Google Scholar] [CrossRef]
  12. Timmer, L.W.; Roberts, P.D.; Darhower, H.M.; Bushong, P.M.; Stover, E.W.; Peever, T.L.; Ibanez, A.M. Epidemiology and control of citrus greasy spot in different citrus-growing areas in Florida. Plant Dis. 2000, 84, 1294–1298. [Google Scholar] [CrossRef] [PubMed] [Green Version]
  13. Mueller, D.S.; Wise, K.A.; Dufault, N.S.; Chilvers, M.I. Fungicides for Field Crops; APS Press: St.Paul, MN, USA, 2013. [Google Scholar]
  14. Oliver, R.P.; Hewitt, H.G. Fungicides in Crop Protection, 2nd ed.; CABI Publishing: Wallingford, UK, 2014. [Google Scholar]
  15. Fungicide Resistance Action Committee (FRAC). FRAC Code List 2020: Fungal Control Agents Sorted by Cross Resistance Pattern and Mode of Action (Including FRAC Code Numbering). Available online: https://www.frac.info/docs/default-source/publications/frac-code-list/frac-code-list-2020-finalb16c2b2c512362eb9a1eff00004acf5d.pdf?sfvrsn~=~54f499a_2 (accessed on 1 June 2020).
  16. Ziogas, B.N.; Malandrakis, A.A. Sterol Biosynthesis Inhibitors: C14 Demethylation (DMIs). In Fungicide Resistance in Plant Pathogens: Principles and a Guide to Practical Management; Hideo, I., Derek, W.H., Eds.; Springer: Tokyo, Japan, 2015; pp. 199–216. [Google Scholar]
  17. Paranjape, K.; Gowariker, V.; Krishnamurthy, V.; Gowariker, S. The Pesticide Encyclopedia; CABI Publishing: Wallingford, UK, 2014. [Google Scholar]
  18. Bhatia, A.; Tesoriero, A.J.; Timmer, L.W. Evaluation of fungicides for control of greasy spot on grapefruit, 2000–2001. Fungic. Nematic. Test 2002, 57, M02. [Google Scholar]
  19. Johnston, T.; Timmer, L.W. Evaluation of products for control of citrus greasy spot on Marsh grapefruit, 2002–03. Fungic. Nematic. Test 2004, 59, V029. [Google Scholar]
  20. Johnston, T.; Timmer, L.W. Evaluation of products for control of citrus greasy spot on Redblush grapefruit, 2002–03. Fungic. Nematic. Test 2004, 59, V030. [Google Scholar]
  21. Mondal, S.N.; Timmer, L.W. Relationship of epiphytic growth of Mycosphaerella citri to greasy spot development on citrus and to disease control with fenbuconazole. Plant Dis. 2003, 87, 186–192. [Google Scholar] [CrossRef]
  22. Mondal, S.N.; Timmer, L.W. Relationship of the severity of citrus greasy spot, caused by Mycosphaerella citri, to ascospore dose, epiphytic growth, leaf age, and fungicide timing. Plant Dis. 2006, 90, 220–224. [Google Scholar] [CrossRef] [PubMed] [Green Version]
  23. Mondal, S.N.; Timmer, L.W. Ascospore deposition and epiphytic growth in relation to fungicide timing for control of greasy spot rind blotch caused by Mycosphaerella citri. Plant Dis. 2005, 89, 739–743. [Google Scholar] [CrossRef] [PubMed]
  24. Russell, P.E. Sensitivity Baselines in Fungicide Resistance Research and Management; Crop Life International: Brussels, Belgium, 2002. [Google Scholar]
  25. Mondal, S.N.; Bhatia, A.; Shilts, T.; Timmer, L.W. Baseline sensitivities of fungal pathogens of fruit and foliage of citrus to azoxystrobin, pyraclostrobin, and fenbuconazole. Plant Dis. 2005, 89, 1186–1194. [Google Scholar] [CrossRef]
  26. Reynolds, K.L.; Brenneman, T.B.; Bertrand, P.F. Sensitivity of Cladosporium caryigenum to propiconazole and fenbuconazole. Plant Dis. 1997, 81, 163–166. [Google Scholar] [CrossRef] [Green Version]
  27. McManus, P.; Best, V.; Voland, R.; Leininger, B. Sensitivity of Monilinia oxycocci to fenbuconazole and propiconazole in vitro and control of cranberry cottonball in the field. Plant Dis. 1999, 83, 445–450. [Google Scholar] [CrossRef]
  28. Whiteside, J.O. Etiology and epidemiology of citrus greasy spot. Phytopathology 1970, 60, 1409–1414. [Google Scholar] [CrossRef]
  29. Dhingra, O.D.; Sinclair, J.B. Basic Plant Pathology Methods; CRC Press: Boca Raton, FL, USA, 1995. [Google Scholar]
  30. Quaedvlieg, W.; Binder, M.; Groenewald, J.Z.; Summerell, B.A.; Carnegie, A.J.; Burgess, T.I.; Crous, P.W. Introducing the consolidated species concept to resolve species in the Teratosphaeriaceae. Persoonia 2014, 33, 1–40. [Google Scholar] [CrossRef] [Green Version]
  31. Aguilera-Cogley, V.A.; Berbegal, M.; Catala, S.; Brentu, F.C.; Armengol, J.; Vicent, A. Characterization of Mycosphaerellaceae species associated with citrus greasy spot in Panama and Spain. PLoS ONE 2017, 12, e0189585. [Google Scholar] [CrossRef] [PubMed] [Green Version]
  32. Commo, F.; Bot, B.M. Package ’Nplr’: N-Parameter Logistic Regressions. R Package Version 0.1-7. 2016. Available online: https://cran.r-project.org/web/packages/nplr/nplr.pdf (accessed on 1 June 2020).
  33. R Core Team. R: A Language and Environment for Statistical Computing; R Foundation for Statistical Computing: Vienna, Austria, 2018. [Google Scholar]
  34. Agustí, M.; Zaragoza, S.; Bleiholder, H.; Buhr, L.; Hack, H. Adaptation de l’échelle BBCH à la description des stades phénologiques des agrumes du genre Citrus. Fruits 1997, 52, 287–295. [Google Scholar]
  35. Venables, W.N.; Ripley, B.D. Modern Applied Statistics with S-plus, 4th ed.; Springer: New York, NY, USA, 2002. [Google Scholar]
  36. Bilder, C.R.; Loughin, T.M. Analysis of Categorical Data with R; CRC Press: Boca Raton, FL, USA, 2015. [Google Scholar]
  37. Tutz, G. Regression for Categorical Data; Cambridge University Press: Cambridge, UK, 2011; Volume 34. [Google Scholar]
  38. Yee, T.W. The VGAM package for categorical data analysis. J. Stat. Softw. 2010, 32, 1–34. [Google Scholar] [CrossRef]
  39. R Core Team and Worldwide Contributors. The R stats package. R Package Version 4.1.0 2002. Available online: https://stat.ethz.ch/R-manual/R-devel/library/stats/html/00Index.html (accessed on 1 June 2020).
  40. Rosenzweig, N.; Hanson, L.E.; Mambetova, S.; Jiang, Q.; Guza, C.; Stewart, J.; Trueman, C.L.; Somohano, P. Temporal population monitoring of fungicide sensitivity in Cercospora beticola from sugarbeet (Beta vulgaris) in the Upper Great Lakes. Can. J. Plant Pathol. 2020, 1–11. [Google Scholar] [CrossRef]
  41. Corio-Costet, M.F. Monitoring Resistance in Obligate Pathogens by Bioassays Relating to Field Use: Grapevine Powdery and Downy Mildews. In Fungicide Resistance in Plant Pathogens: Principles and a Guide to Practical Management; Hideo, I., Derek, W.H., Eds.; Springer: Tokyo, Japan, 2015; pp. 251–279. [Google Scholar]
  42. Franke, M.; Brenneman, T.; Stevenson, K.; Padgett, G. Sensitivity of isolates of Sclerotium rolfsii from peanut in Georgia to selected fungicides. Plant Dis. 1998, 82, 578–583. [Google Scholar] [CrossRef] [Green Version]
  43. Aguilera-Cogley, V. Enfermedades Fúngicas de los Cítricos en Panamá. Estudio Particular de la Mancha Grasienta causada por Mycosphaerellaceae. Ph.D. Thesis, Universitat Politècnica de València, Valencia, Spain, 2016. [Google Scholar]
  44. Dewdney, M. Greasy Spot. In 2019–20 Florida Citrus Production Guide; Diepenbrock, L., Dewdney, M., Vashisth, T., Eds.; IFAS Extension, University of Florida: Gainesville, FL, USA, 2019; pp. 185–187. [Google Scholar]
  45. Dewdney, M.; Johnson, E. Planning for Foliar Disease Management in 2020; EDIS: Visalia, CA, USA, 2019. [Google Scholar]
  46. Timmer, L.W.; Reeve, R.J.; Davis, R.M. Epidemiology and control of citrus greasy spot on grapefruit in Texas. Phytopathology 1980, 70, 863–867. [Google Scholar] [CrossRef]
Figure 1. Box-whisker plot and frequency distribution of fenbuconazole sensitivity of Zasmidium citri-griseum isolates from Panama (n = 34) expressed as the effective concentration needed to reduce mycelial growth by 50% (EC 50 ).
Agronomy 10 01577 g001
Figure 2. Box-whisker plots of percentages of leaves in the categories of greasy spot severity observed in trees treated with fenbuconazole and the non-treated control in experiment 1 on ’Star Ruby’ grapefruit at Tambo, Panama, from 2011 to 2013 (0 = no lesions; 1 = 1–10 leaf spots; 2 = 11–20 leaf spots; 3 = more than 20 leaf spots). Three sprays of fenbuconazole were applied in 2011 and one spray in 2012 and 2013.
Agronomy 10 01577 g002
Figure 3. Box-whisker plots of the percentages of leaves in the categories of greasy spot severity observed in trees treated with fenbuconazole and the non-treated control in experiment 2 on ’Valencia’ sweet orange at Miraflores, Panama, in 2011 and 2012 (0 = no lesions; 1 = 1–10 leaf spots; 2 = 11–20 leaf spots; 3 = more than 20 leaf spots). Three sprays of fenbuconazole were applied in 2011 and one spray in 2012.
Agronomy 10 01577 g003
Figure 4. Box-whisker plots of yield of trees treated with fenbuconazole and the non-treated control in experiment 1 on ’Star Ruby’ grapefruit at Tambo, Panama, from 2011 to 2013.
Agronomy 10 01577 g004
Figure 5. Box-whisker plots of yield of trees treated with fenbuconazole and the non-treated control in experiment 2 on ’Valencia’ sweet orange at Miraflores, Panama, in 2011 and 2012.
Agronomy 10 01577 g005
Table 1. Isolates of Zasmidium citri-griseum included in the sensitivity study for fenbuconazole with their corresponding values of the effective concentration needed to reduce mycelial growth by 50% (EC 50 ).
IsolateYear of IsolationProvinceLocalityPlant SpeciesAffected TissueEC 50 μ g mL 1
2NTV12010VeraguasLa DormilonaCitrus sinensisCanopy leaf1.28
4NTV12010VeraguasSantiagoC. sinensisCanopy leaf0.55
6NCV42010VeraguasBajo de la HondaC. sinensisCanopy leaf1.82
9NCV12010VeraguasEl EspinoC. sinensisCanopy leaf3.40
9NCV42010VeraguasEl EspinoC. sinensisCanopy leaf3.27
10NCV62010VeraguasEl EspinoC. sinensisCanopy leaf1.12
15NCV12010VeraguasAlto PiedraC. sinensisCanopy leaf0.41
12NCC92010CocléChuruquitaC. sinensisCanopy leaf7.40
17NCC32010CocléMira FloresC. sinensisCanopy leaf6.02
17NCC52010CocléMira FloresC. sinensisCanopy leaf4.68
19NCC32010CocléEl GuabalC. sinensisCanopy leaf4.44
26LCC52011CocléSanta ClaraC. latifoliaCanopy leaf0.96
27LCC22011CocléSanta ClaraC. latifoliaCanopy leaf1.96
31TCC42011CocléPlatanalC. paradisiCanopy leaf2.33
33TCC22011CocléPlatanalC. paradisiCanopy leaf0.09
34NCC42011CocléToabréC. sinensisCanopy leaf4.87
37LCC22011CocléTamboC. latifoliaCanopy leaf1.05
37LCC32011CocléTamboC. latifoliaCanopy leaf1.78
38NCC22011CocléTamboC. sinensisCanopy leaf4.26
43NCCh22011ChiriquíRoviraC. sinensisCanopy leaf2.08
45NCCh22011ChiriquíBanco de RoviraC. sinensisCanopy leaf2.98
48NCCh12011ChiriquíPotrerilloC. sinensisCanopy leaf7.62
Myc-142011CocléChuruquitaC. sinensisLeaf litter2.97
Myc-212011CocléTamboC. sinensisLeaf litter1.10
Myc-232011CocléChuruquitaC. sinensisLeaf litter6.20
Myc-262011CocléChuruquitaC. sinensisLeaf litter1.51
Myc-362011CocléToabréC. paradisiLeaf litter0.84
Myc-372011CocléToabréC. paradisiLeaf litter1.16
61LCC42012CocléTamboC. latifoliaCanopy leaf0.33
62LCC42012CocléTamboC. latifoliaCanopy leaf5.18
65NCC32012CocléCaimitoC. sinensisCanopy leaf3.03
68NCC22012CocléToabréC. sinensisCanopy leaf2.01
69NCC22012CocléToabréC. sinensisCanopy leaf0.70
69NCC32012CocléToabréC. sinensisCanopy leaf1.12
Table 2. Results obtained with the proportional odds logistic regression of greasy spot severity categories in experiment 1 on ‘Start Ruby’ grapefruit at Tambo, Panama from 2011 to 2013.
Source of VariationEstimateStandard Errort Valuep-Value
2011
Treatment factor a −3.550.06−55.79<0.0001
Cut points b
0|1−3.260.06−55.03<0.0001
1|2−2.100.05−41.75<0.0001
2|3−1.470.05−33.07<0.0001
2012
Treatment factor−1.790.05−40.26<0.0001
Cut points
0|1−4.650.07−67.73<0.0001
1|2−2.070.04−53.16<0.0001
2|3−1.100.03−32.06<0.0001
2013
Treatment factor−1.800.05−34.62<0.0001
Cut points
0|1−5.300.10−51.20<0.0001
1|2−2.200.05−47.90<0.0001
2|3−1.070.04−27.42<0.0001
a The non-treated control was used as the reference level. b Thresholds defining the disease severity intervals.
Table 3. Results obtained with the proportional odds logistic regression of greasy spot severity categories in experiment 2 on ‘Valencia’ sweet orange at Miraflores, Panama in 2011 and 2012.
Source of VariationEstimateStandard Errort Valuep-Value
2011
Treatment factor a −2.700.06−43.55<0.0001
Cut points b
0|1−2.720.06−48.17<0.0001
1|2−1.330.04−30.18<0.0001
2|3−0.650.04−16.11<0.0001
2012
Treatment factor−1.050.05−20.28<0.0001
Cut points
0|1−3.670.07−51.44<0.0001
1|2−1.500.04−35.42<0.0001
2|3−0.690.0417.94<0.0001
a The non-treated control was used as the reference level. b Thresholds defining the disease severity intervals.
Table 4. Probabilities and odds ratios obtained with the proportional odds logistic regression of greasy spot severity categories in experiment 1 on ‘Start Ruby’ grapefruit at Tambo and experiment 2 on ‘Valencia’ sweet orange at Miraflores, Panama from 2011 to 2013.
Probabilities a
ExperimentsEvaluation YearTreatmentsSev. 0Sev. 1Sev. 2Sev. 3Odds Ratio
Experiment 12011Fenbuconazole0.570.240.080.1134.81 (30.75–39.47) b
Non-treated0.040.070.080.81
2012Fenbuconazole0.050.380.240.335.99 (5.50–6.55)
Non-treated0.010.100.140.75
2013Fenbuconazole0.030.370.270.336.05 (5.47–6.70)
Non-treated0.000.090.160.74
Experiment 22011Fenbuconazole0.500.300.090.1114.88 (13.21–16.85)
Non-treated0.060.150.130.66
2012Fenbuconazole0.070.320.200.412.86 (2.85–3.16)
Non-treated0.020.160.150.67
a 0 = no lesions observed; 1 = 1–10 leaf spots; 2 = 11–20 leaf spots; 3 = more than 20 leaf spots. b In brackets 95% confidence interval.
Publisher’s Note: MDPI stays neutral with regard to jurisdictional claims in published maps and institutional affiliations.

