Article

Study to Determine Levels of Cadmium in Cocoa Crops Applied to Inland Areas of Peru: “The Case of the Campo Verde-Honoria Tournavista Corridor”

by
Jimmy Aurelio Rosales-Huamani
1,*,†,
Jorge Luis Breña-Ore
1,†,
Svitlana Sespedes-Varkarsel
1,
Luis Huamanchumo de la Cuba
1,†,
Luis Centeno-Rojas
1,†,
Alonso Otiniano-Zavala
1,
Joseps Andrade-Choque
1,
Santiago Valverde-Espinoza
1 and
Jose Luis Castillo-Sequera
2,†
1
Multidisciplinary Sensing, Universal Accessibility and Machine Learning Group, National University of Engineering, Lima 1533, Peru
2
Department of Computer Science, Higher Polytechnic School, University of Alcala, 28871 Alcalá de Henares, Spain
*
Author to whom correspondence should be addressed.
These authors contributed equally to this work.
Agronomy 2020, 10(10), 1576; https://doi.org/10.3390/agronomy10101576
Submission received: 8 September 2020 / Revised: 29 September 2020 / Accepted: 10 October 2020 / Published: 15 October 2020
(This article belongs to the Special Issue Heavy Metal Pollution and Its Effects on Agriculture)

Abstract

:
The presence of cadmium (Cd) in cocoa crops is currently a serious problem for farmers and producers in various regions of South America. Because its exports of cocoa and derivatives to European markets are threatened by possible signs of contamination in cocoa beans for export. Territories with a low organic component predated and exploited by illegal logging, burning and the intensity of unsustainable land use is common in large Amazonian areas in countries of the region. These factors were incorporated in statistical analysis in order to relate them to the contents of Cd in soil, leaves and beans in the study areas located in Peru. Such as the Campo Verde-Honoria-Tournavista corridor (Ucayali Region and Huanuco Region). Cadmium concentrations were determined using an atomic absorption spectrophotometer. As a consequence of this study, we determined and concluded that the observed difference in distribution of Cd contents by sectors can be explained by previous land use and age of cocoa crop. Indeed, the average content of Cd in soil in all cocoa growing areas is higher than the standard established by the Peruvian Ministry of the Environment (MINAM). However, when the measurements obtained in previously predated and exploited sectors are not considered, the Hotelling’s T 2 simultaneous 90% confidence interval contains the value of the Peruvian standard 1.4 mg/kg. Therefore, with this information we prepare a geochemical Cd map in soils for the study area, which will help cocoa producers to identify areas that exceed the allowed Cd values. In this way, we can carry out in the future a mitigation plan for areas with Cd problems, which allows to reduce their content with major challenges to sustainable agriculture and rural development.

1. Introduction

Currently there is great concern throughout the cocoa commercial chain worldwide (producers, exporters, importers and consumers). There is due to the presence of Cd in cocoa beans and direct transmission to its derivatives for human consumption. Cadmium is part of the list of heavy metals that can accumulate in food and that reach people through their consumption, appearing in food naturally or due to contamination.
Heavy metals are a group of high-density chemical elements that are generally toxic to humans. These elements have their origin in natural causes and are a consequence of anthropogenic activities such as: industrial waste, mining, smelting, rock fertilizers and automobile gas emissions [1,2,3]. The most frequently reported heavy metals with potential hazards in soils are Cd, Cr, Pb, Zn and Cu [4].
Since Cd is found naturally in the earth’s crust in the form of minerals, it can be absorbed by plants and can accumulate in agricultural crops. Therefore, they enter the human food chain creating a potential health risk [5,6]. In the case of Cd, it is a heavy metal that has a varied toxicity to various human organs, and is classified as a human carcinogen by the International Agency for Research on Cancer of the World Health Organization [7], therefore the study of this metal is necessary. In turn, the International Agency for Research on Cancer (IARC) has classified it in category I [8]. Also, high exposure to this element can mainly damage the kidney and bones [9].
However, there are several factors that determine the heavy metal uptake by plants, among which are the characteristics of the soil that play an important role in reducing or increasing the toxicity of heavy metals in the soil [10]. Cultivated plants represent an important pathway for the movement of potentially toxic heavy metals from the soil to humans due to their consumption. Among the main characteristics that are related to the mobility and availability of heavy metals in the soil are pH, organic matter, clay content, oxides, carbonates and the redox potential [11,12,13]. Cadmium, compared to the other metals such as lead, is quite mobile in soils and is easily absorbed by plants [14]. Recent studies in different cocoa-producing regions indicate that these could present high levels of heavy metals, which can cause problems in the consumption and export of this product [15,16,17,18].
As a result, studies were carried out to identify the sources of Cd in the soils of cocoa plantations, trying to identify factors governing Cd uptake by cocoa [19]. Although the source of the origin of the contamination with Cd is diverse, the transfer from the soil of this metal to the different parts of the plant is quite complex. However, there are remediation techniques (phytoremediation and bioremediation) that have obtained good results regarding the cleaning of polluting soils [20,21]. Independently in other studies, concentrations of Cd and Pb were also found in cocoa derivatives such as: milk chocolate, cocoa powder and cocoa bean products that were purchased in retail stores [22]. In the case of Cd, its distribution in the plant is unknown, but it can be concentrated in the roots, leaves or in the beans [23]. From this, the capture of cadmium by cocoa, has attracted the attention of cocoa producers, because the European Union decided to establish tolerable values for the export of cocoa products. Threatening the sustainability of cocoa production in its producers [24,25].
In Peru, cocoa is currently an important item for exports that generates employment for many producer families and its entire value chain. However, cocoa exports to European markets are threatened by indications of contamination with heavy metals in cocoa destined for export, due to higher levels found compared to the values established by the European community. Therefore, Cd contamination in food has become a concern in many countries. Consequently, cocoa production in heavily contaminated soils should be avoided. Furthermore, the cocoa products from South America [26], in particular, often exceed Cd limits, but the factors influencing the absorption of Cd are not yet well studied.
In the specific case of cocoa, this peruvian agro-export product has high consumption worldwide in all social strata. On the other hand, various studies [15,18,26,27,28] have confirmed the presence of traces of Cd, potentially toxic, which has forced the Peruvian State to enacted Ministerial Resolution, No. 0449-2018-MINAGRI [29]: Rapid impact agenda linked to maximum levels of cadmium in specific products such as cocoa and chocolate. This document claims that cocoa is a crop that is characterized by defending the ecology of the area, not only because it is a perennial crop, but is also grown in association with providing shade (as an agroforestry system constituting a measure of adaptation and mitigation to climate change); It is also an important source of employment generation that demands inputs, goods and services.
The cocoa bean is a product of great commercial relevance for Peru, it is the fifth most important product at the national level, both by area and by number of producers. In 2017, cocoa exports and its preparations in Peru exceeded 235 million dollars, which represent around 4% of total agricultural exports [29].
Then in [30], they proposed a list of factors that regulate the processes of bioaccumulation of Cd by plants, adapted to our country. This is shown in Table 1.
Despite there being several relevant publications available on As, Cd, Pb and Hg in cocoa beans and cocoa-based foods, there are still gaps that encourage research on these issues [31].
In this work, considering that there is no information about Cd in the area located in the Campo Verde-Honoria-Tournavista corridor, which is located between the Ucayali and Huanuco regions of Peru, we need to carry out the analysis of the soil, leaves and cocoa beans in this corridor, to determine Cd values. In order to carry out this analysis, we collect the samples from the study area and then these were sent to the laboratory of the Faculty of Geological Mining and Metallurgical located at the National University of Engineering (FIGMM-UNI) in the city of Lima, for chemical analysis. An atomic absorption spectrophotometer was used to obtain the concentrations of this metal in soil, leaves and beans to later perform a descriptive, comparative and exploratory data analysis. Finally, the geochemical map was prepared that shows the distribution of Cd on a local scale, based on the analysis performed for Cd from the samples that were collected from the study area.
We believe that the study provided by this work can be applicable to any region or country that wishes to analyze Cd levels in their crops to reduce their content with major challenges to sustainable agriculture and rural development.

2. Materials and Methods

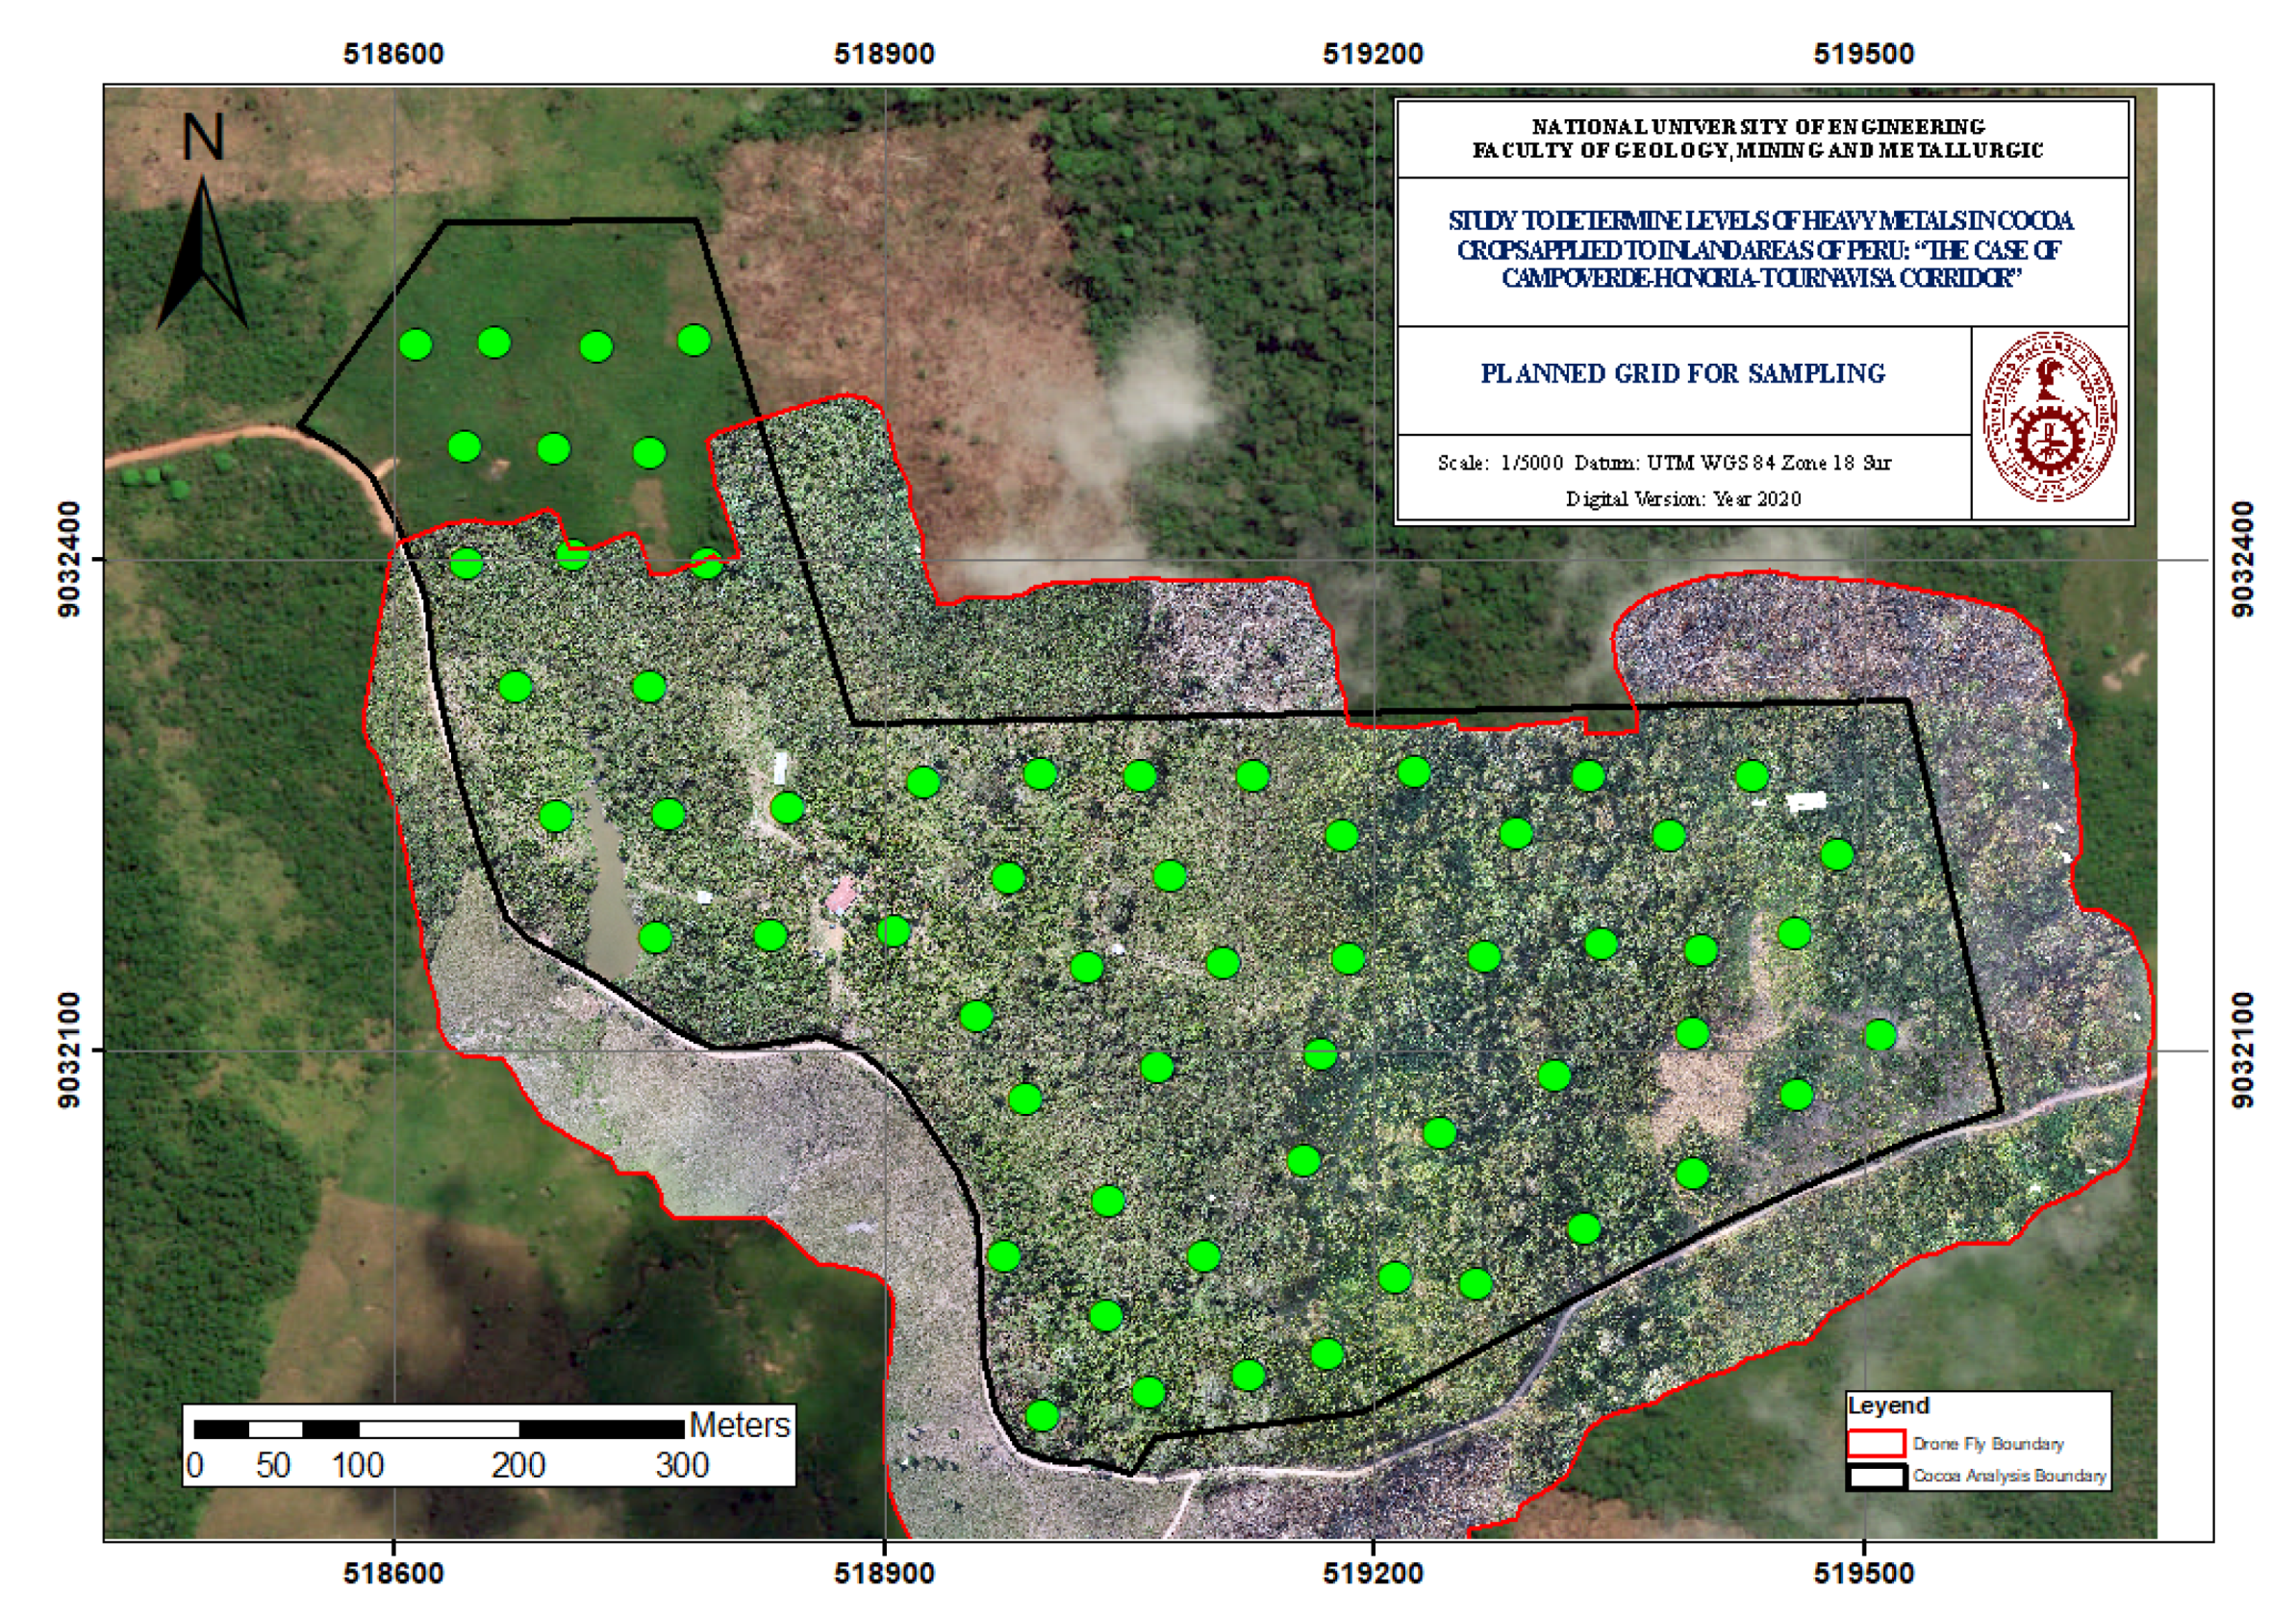
2.1. Study Area Location

The work area is located in Honoria district, approximately 63.3 km away from Pucallpa district, leaving the city on a paved road that connects to the Central Highway for 45 min, you reach the district of Campo Verde along the track 27 km from Pucallpa, in which there is a detour of the trail to Honoria district. The tour of the trail takes approximately 1 hour and 45 min, reaching the Fundo Cristina.

2.2. Study Area

The study was carried out in cocoa plantations located in The Honoria Corridor of 12 hectares installed, but currently, 8 are in production. This delimitation was made with the aid of the PHANTOM 4 PRO drone. Figure 1 shows the limits of the area where all our work will be carried out.
The work area is made up of 6 zones, divided according to the age of the cocoa plant, in that area there are the following varieties of cocoa: CCN51 (cocoa clone) and Creole-aromatic (ICS1, ICS6, ICS95, ICS39, TSH565, Huallaga 59 and Catongo). In addition, maize exploitation areas were identified, prior to the cocoa plantations.

2.3. Collection and Processing of Soils and Cocoa Fruits

2.3.1. Soil and Cocoa Fruit Sampling

For soil sampling, a grid was made with a separation of 50 m east and 50 m north, the grid plane is shown in Figure 1, where a sample for analysis is collected for each point generated. The soil samples used for our study were collected at depths of 30 cm, as indicated in the soil sampling guide, for agricultural soil [32]. In our work, 72 samples were collected equally distributed between soils, beans and leaves of approximately 1 kg of each. The samples were conditioned in Ziploc bags and sent to FIGMM-UNI analysis laboratory and were: air-dried, ground, sieved and stored at room temperature. To achieve this, approximately 50 cm deep test pits were made on average for each point of the mesh that has been designed for the work area, this is to get an easy sample taken, we have to leave a space major to required (30 cm) to not contaminate the sample with the instrument used or some waste or superficial rubbish (branches, stones, trash, among others) and then take the sample from the soil wall (fresh sample) and free of added contaminants during the sample taken, generally, when exist this waste, it is suggested to remove the first centimeters of surface outcrop in a circular area of 15 cm radius [33].
From the test pit, a portion of soil is separated from a wall of the same test pit, considering that the sample should be a portion of soil that has not been in contact with the tool that was used to extract this sample. In addition, electrical conductivity and pH in soil were measured using the norm NOM-021-RECNAT-2000 [34], the sample must be passed through a 2 mm sieve then in a 2:1 solution with distilled water, these physico-chemical parameters were measured using a Thermo Scientific Orion Star A320 series multiparameter.
To collect the fruit, a machete was used to cut the union of this with plant with great care, in order not to contaminate the sample. Then, the fruit was taken with sterile polyethylene gloves to store it in Ziploc bags, assign its respective coding and finally, be sent to the FIGMM analysis laboratory at UNI located in Lima-Peru.

2.3.2. Sample Processing

The main operations to be carried out with the soil and cocoa fruit samples were: milling, quartering and sieving. In these operations, we have used various electronic equipment that minimize contamination of cocoa with other components.
With the soil samples arrived at the laboratory, the samples were first dried, which was carried out in a drying oven at a temperature of 105 C. After the sample is dried, the grinding operation was carried out, and a Cole-Parmer brand jar mill was used, which contains burundum material as the grinding medium, ideal for wet or dry grinding. This equipment provided us with a homogeneous grinding, which allowed us to bring the sample to a desired grain size of 75 microns. In the case of cocoa fruits, the operations are quite similar, first the bean was separated manually and to reduce the size for chemical treatment, a grinding was used similar to the soils, using a IKA brand small mill, model A11 b. Then, sieving and quartering were carried out with the portable 1-column electric sieve. This equipment allowed us to bring the fruits up to a desired granulometry of 212 microns.

2.3.3. Chemical Analysis of Samples

Prior to the chemical analysis of the samples obtained, the samples were digested with acids and then solutions were prepared from the soil, bean and cocoa leaves samples, to achieve this, independently, the following was carried out:
  • Digestion of soil samples. Heavy metal content was determined by the Environmental Protection Agency [35].
  • Digestion of samples of cocoa beans and leaves. Heavy metal content was determined using the method mentioned by Isaac and Johnson [36].

2.3.4. Atomic Absorption Analysis

The analysis method for the identification of heavy metals used was flame Atomic Absorption Spectrophotometer (AAS), brand GBC Scientific Equipment, model XplorAA. Regarding the calibration and optimization of the burner height and the gas flow with each element, the standards recommended by the manufacturer were used, such as the 3.5 mg/L copper standard. Subsequently, the calibration curves for each of the three heavy metals were evaluated, observing linearity in the responses and high coefficients of determination 99%. Then, the measurement of the heavy metals contained in the samples was carried out.
Regarding the precision and reliability criteria, the repeatability was evaluated, by means of dual replications of each one of the samples and every 10 measurements were introduced: blank samples, standards and samples enriched with standards. Observing reproducibility, repeatability and reliability in the data obtained.

3. Results and Discussion

Results of these concentrations of metals in soils such as Cd, Pb, and Zn are shown in Table 2. These data were complemented with the hydrogen potential (pH) and electrical conductivity (CE) measurement. With these obtained results, the statistical treatment of the data is carried out.
With the measurements taken at the Fundo Cristina, the geochemical map of Cd soils for the study area was generated using the interpolation method called kriging, for this the ArcGIS software [37] was used, this map is shown in Figure 2. The data obtained confirmed that in the case of soils, the average Cd concentration of 1.63 mg/kg is above the Environmental Quality Standards (ECA) for the soil established by MINAM, the value of which is 1.4 mg/kg [38]. The map shows the distribution of the element Cd based on its concentration in the area.
To carry out the statistical analysis, the R software [39] was used. The work zone was divided into five sectors (zone 6 does not contain crops) based on an administrative criteria of field management that includes homogeneous geographical characteristics, accessibility and type of crops. Maize exploitation zones were identified prior to cocoa plantations, sandy or clayey zones, as well as CCN51 and Creole-aromatic cultivation zones as observed in Figure 3. It is important to highlight that zone E1 is a predated and exploited zone with soils with a low organic component where there is only pasture. This type of territories predated by illegal logging, burning and the intensity of unsustainable land use is common in large Amazonian areas in countries of the region. These factors will be incorporated in statistical analysis in order to relate them to the contents of heavy metals in soils, leaves and beans.
Table 3 shows the statistical summary on content of heavy metals (Cd, Pb and Zn) according to the variety of cocoa in areas with cocoa crops. The acidity (pH) and electrical conductivity (CE) levels of these same soils are also included.
The data confirm that distribution of Cd in plant tissues and in plantation soils shows the following trend, both at the level of the entire productive unit and at the level of variety:
C beans   <   C soils   <   C leaves
These results confirm the findings of [20,25,30], they conclude that average Cd concentration varies in different parts of the plant. In [34], mentioned that between 70 % and 80 % of the Cd absorbed by the cocoa plantations is retained by roots and the rest moves to other parts of plant tissues, being bioaccumulated, depending on the location, on stems, leaves and lower proportion in shell and beans of cocoa.
Regarding the Cd content in cocoa beans, the data confirm that the mean Cd concentration is 0.96 mg/kg. These values are above the international standards of the European Union, which as of 1 January 2019, regulated that the cocoa powder content has a maximum concentration of 0.6 mg/kg [40].
Research by [41,42], confirms this hypothesis that plant tissues bioaccumulate higher concentrations than storage tissues, such as cocoa shells and cocoa beans, which it allows to infer that presence of physiological barriers prevents the Cd bioaccumulation process in cocoa shells and in cocoa beans.
It is observed that highest levels are registered in beans of Creole-aromatic varieties, which is directly related to highest levels of Cd concentration in soil. On the contrary, although Cd levels are lower in CCN51, the variability with respect to the average is higher in it. Therefore, these results will be complemented with an analysis of distribution of data.
Figure 4 shows distribution of contents of Cd in soil, in areas with cocoa crops of productive unit (a), according to sectors (b) and previous exploitation of field in maize crops (c).
The empirical distribution of measurements of Cd in soil in cocoa cultivated area, corresponding to Fundo Cristina (FC), shows a symmetric distribution but with extreme values, which can explain the increase in average content of Cd in varieties Creole-aromatic. It should be noted that more than 50% of values are below the maximum allowed of 1.4 mg/kg established in sampling guidelines for determination of Cd levels in soils, leaves, beans and products derived from cocoa [38,40,43]. As a result, it is observed that average value is less than median value (Figure 4a).
By blocking the Cd measurements according to sectors (Figure 4b), it is observed that the distribution of Cd in soil in these cocoa growing areas is different. The great difference between sectors E1 and E2 is notable. The first one shows a high average Cd content that exceeds the 1.4 mg/kg allowable and a slightly asymmetric distribution that affects the average value, placing it above the median. On the contrary, in the second case, although the average content of cadmium is very acceptable, the dispersion is high, observing an extreme value close to 3 mg/kg. Sectors E3, E4 and E5 show very homogeneous data distributions and centered within permissible limits.
It is possible that the observed difference in distribution of Cd contents by sectors can be explained by previous land use and age of cocoa crop in the aforementioned sectors. To obtain evidence, we use graph (Figure 4c) that shows the distribution of contents of Cd according to previous exploitation of the land. The graph presents three cases: first, land that has been planted with maize for 10 years since 1998 (MAIZE_10); second, land that since 2001 maize was sown for 7 years (MAIZE_7) and those that were pasture for 10 years (PASTURE_10) before 2008. In this regard, it is observed that the content of Cd is higher in land since about 1998, which were pastures land. These territories were poor in organic matter, because they were previously exploited.
These lands correspond to sector E1. A similar result is observed in lands that had maize planting since 1998 and 2001 that correspond to sector E3, E4 and E5. Although the average is low, there are extreme values which correspond to the high values interpolated in geochemical map.
Indeed, as shown in Table 4, the average content of Cd in soil in all cocoa growing areas is higher than the (ECA) for the soil established by MINAM [38]. However, when the measurements obtained in E1 are not considered, the simultaneous 90% confidence interval contains the value of the ECA 1.4 mg/kg. A similar result is observed in recovered areas with cocoa crops, where the simultaneous confidence intervals also contain the Peruvian standard [38].
It should be noted that these lands that were previously cultivated with maize, have already been recovered due to fertilizer (island guano) applied to cocoa crops that have existed for 8 years, which has not happened yet with the pasture that is still in that process.
In Figure 5, the hierarchical correlation matrix between the 11 variables analyzed is shown, considering data from the entire productive unit (Figure 5a), blocking variety CCN51 (Figure 5b) and Creole-aromatic (Figure 5c). A priori, it was determined that the correlation matrix should be constructed on the basis of three hierarchical groupings because three heavy metals were analyzed.
When analyzing the data corresponding to the entire productive unit (Figure 5a), it is verified that the three measurements of Cd (soils, leaves and beans) are significantly correlated in the same group, although these contribute less to variability than Zn and Pb respectively. Furthermore, of the three possible combinations (two to two) it is observed that the lowest is Cd soil with Cd bean. At the other extreme, we have Cd with Zn, where in all cases, they are negatively correlated. Especially, Cd soil with Zn bean where correlation is extreme negative.
Unlike what was observed in the correlation at the entire farm (Figure 5a), the correlation structure in the variety CCN51 shows that the contribution of Pb in the total variation of the data is greater than Zn. In both cases, the variability observed in the Cd contents is the one that least contributes to the total variability of the data. The correlations within groups are positive, which indicates the positive correlation in each one of the heavy metals analyzed in relation to the soil, bean and leaves.
However, the same does not happen in case of aromatic and creole varieties, as shown in Figure 5c. Unlike Figure 5a, Cd is added to the Pb contribution observed in Figure 5b. In this case, amounts of Cd are the ones that explain the highest proportion of total variability and maintain positive correlation within groups. Additionally, the negative correlation of grain Zn with the content of Cd in soil, bean and leaves is highlighted in Creole and aromatic variety. Grain lead now correlates positively and significantly with Cd contents, which in the general case did not. It is important to mention that CCN51 variety is found in clay soils unlike the Creole and aromatic varieties where soils are not only clayey but also sandy. In the latter case, land has been pasture, which indicates extreme exploitation of land.
Figure 6 shows a representation of observations and variables analyzed by a Biplot, of main components, at 51.7% of total inertia [44]. Variable targeting and position of sample observations were validated by a SQ Biplot for diagnosis [45,46]. Horizontal axis is mainly represented by Cd variables in soil, leaves and bean, therefore it will represent Cd dimension. Vertical axis that is represented by electrical conductivity (CE_aprox) and the pH (pH_aprox) will be the CE_pH axis. Regarding observations, it is verified that they are contained in a Gaussian interval of 90% with the exception of record 4, which is completely defined by the CE_pH axis.
In Figure 6, it is possible to distinguish definition of two extreme groupings along the horizontal axis, which would be indicating that the cadmium dimension is an important discrimination factor. At the extreme left are observations collected in sector E1, which represents the highest values in soil Cd and were pasture areas, currently, with Creole-aromatic crops in the process of recovery. In the extreme right, formed by observations of sectors E2 and E3, with lower levels in Cd, formed by Creole-aromatic crops and CCN51 where maize was cultivated for more than 7 years, but currently they are recovered territories.
Regarding the CE_pH dimension, it can be seen that the observations corresponding to sector E5, whose trees are 10 years old, are well represented on this axis. The pH values are above the average of 6.49 and 26.11 uS/cm in electrical conductivity (seen in Table 2). The observations of the other sectors are distributed in the vicinity of the mean value of the CE_pH axis with a slight bias towards values below the average. This bias is more evident in the observations taken in sectors E2 and E3 where there are Creole-aromatic varieties and CCN51. This dispersion of the data around the mean pH and CE values indicates a predisposition of the soil to respond positively in the medium term to any remediation measure aimed at reducing the uptake of Cd in cocoa crops.

4. Conclusions

The data collected allowed obtaining statistical information on the contents of Cd, Pb, and Zn in soil, leaves and bean, in addition to CE and pH in the study area. Factors such as previous exploitation of soil, age and variety of cocoa trees have also been included. Although the research is descriptive, it was necessary to design data collection according to the updated progress of the research. The study has confirmed the relationship and correlation established between factors that regulate the processes of Cd bioaccumulation by plants. However, do not confirm that variety or age of tree clarify about Cd uptake.
Although it is evident that over-exploited soils until their exhaustion tend to establish undesirable Cd absorption conditions, and, the fertilization of the soil with island guano for a period of not less than 5 years seems to reverse the phenomenon. Hence, statistical information confirms that the oldest sector is not defined in Cd dimension, on the contrary, it strengthens the conditions of CE and pH of soil for the balance of nutrients in the soil.
The data obtained in this study confirmed that in the case of beans, the average Cd concentration is 0.96 mg/kg, this value is above of the international standards of the European Union whose maximum concentration is 0.6 mg/kg. In the case of soils, the average Cd concentration of 1.63 mg/kg, is above the ECA whose value is 1.4 mg/kg, therefore, it is necessary to adopt measures to mitigate the aforementioned values, in order to comply with the requirements. In this work, the previous knowledge of the aspects of field management, as well as the current knowledge of the cocoa crops in the “Fundo Cristina”, was essential to guide the research, and was useful to take actions that allow compliance with the requirements imposed.
Therefore, we can conclude that it is essential to carry out future research aimed at proposing measures that make it possible to remedy the current situation in the study area, such as conducting studies to approach Cd mobility and avoid the uptake of Cd in the cacao tree.

Author Contributions

Conceptualization, L.H.d.l.C.; methodology, J.A.R.-H.; software, J.A.-C.; formal analysis, J.L.B.-O.; resources, S.V.-E.; data curation, L.C.-R.; writing—original draft preparation, J.A.R.-H.; writing—review and editing, J.L.C.-S.; visualization, A.O.-Z.; supervision, S.S.-V.; funding acquisition, J.A.R.-H. All authors have read and agreed to the published version of the manuscript.

Funding

The study was funded by the Vice-Rector for Research of the National University of Engineering.

Conflicts of Interest

The authors declare no conflict of interest.

Abbreviations

The following abbreviations are used in this manuscript:
MDPIMultidisciplinary Digital Publishing Institute
DOAJDirectory of open access journals
TLAThree letter acronym
LDlinear dichroism

References

  1. Aikpokpodion Paul, E. Assessment of heavy metals pollution in fungicide treated Cocoa plantations in Ondo state, Nigeria. J. Appl. Biosci. 2010, 33, 2037–2046. [Google Scholar]
  2. Senesil, G.S.; Baldassarre, G.; Senesi, N.; Radina, B. Trace element inputs into soils by anthropogenic activities and implications for human health. Chemosphere 1999, 39, 343–377. [Google Scholar] [CrossRef]
  3. Ross, S.M. Sources and forms of potentially toxic metals in soil-plant systems. In Toxic Metals in Soil-Plant Systems; Wiley: Chichester, UK, 1994; pp. 3–26. [Google Scholar]
  4. Alloway, J. Soil pollution and land contamination. In Pollution: Causes, Effects and Control; Harrison, R.M., Ed.; The Royal Society of Chemistry: Cambridge, UK, 1995; p. 318. [Google Scholar]
  5. Méndez, J.P.; Ramírez, C.A.G.; Gutiérrez, A.D.R.; García, F.P. Contaminación y fitotoxicidad en plantas por metales pesados provenientes de suelos y agua. Trop. Subtrop. Agroecosyst. 2009, 10, 29–44. [Google Scholar]
  6. Takrama, J.; Afrifa, A.A.; Ofori-Frimpong, K.; Jonfia-Essien, W.A.; Agyemang, P.; Galyuon, I. Cadmium contamination of cocoa beans and cocoa growing agricultural soils of Ghana: There is no cause for public alarm. Peak J. Public Health Manag. 2015, 3, 56–61. [Google Scholar]
  7. Cadmium in the Human Environment: Toxicity and Carcinogenicity. Available online: https://publications.iarc.fr/Book-And-Report-Series/Iarc-Scientific-Publications/Cadmium-In-The-Human-Environment-Toxicity-And-Carcinogenicity-1992 (accessed on 3 February 2020).
  8. Agents. Available online: https://monographs.iarc.fr/agents-classified-by-the-iarc/ (accessed on 3 February 2020).
  9. Alves Peixoto, R.R.; Oliveira, A.; Cadore, S. Risk assessment of cadmium and chromium from chocolate powder. Food Addit. Contam. Part B 2018, 11, 256–263. [Google Scholar] [CrossRef] [PubMed]
  10. Puga, S.; Sosa, M.; Lebgue, T.; Quintana, C.; Campos, A. Heavy metals pollution in soils damaged by mining industry. Ecol. Apl. 2006, 5, 149–155. [Google Scholar] [CrossRef] [Green Version]
  11. Alloway, B.J. Heavy Metals in Soils: Trace Metals and Metalloids in Soils and Their Bioavailability; Springer: Berlin, Germany, 2012; Volume 22. [Google Scholar]
  12. Violante, A.; Cozzolino, V.; Perelomov, L.; Caporale, A.; Pigna, M. Mobility and bioavailability of heavy metals and metalloids in soil environments. J. Soil Sci. Plant Nutr. 2010, 10, 268–292. [Google Scholar] [CrossRef] [Green Version]
  13. Lago Vila, M. Biodisponibilidad de Metales Pesados en Suelos Contaminados. Ph.D. Thesis, Bioloxía Vexetal e Ciencias do Solo, Universidad de Vigo, Vigo, Spain, 2019. [Google Scholar]
  14. McLaughlin, M.J.; Singh, B.R. Cadmium in soils and plants. In Cadmium in Soils and Plants; Springer: Berlin, Germany, 1999; pp. 1–9. [Google Scholar]
  15. Arévalo-Gardini, E.; Obando-Cerpa, M.E.; Zúñiga-Cernades, L.B.; Arévalo-Hernández, C.O.; Baligar, V.; He, Z. Metales pesados en suelos de plantaciones de cacao (Theobroma cacao L.) en tres regiones del Perú. Ecol. Appl. 2016, 15, 81–89. [Google Scholar] [CrossRef]
  16. Amankwaah, D.; Nnuro, W.; Awudza, J.; Afful, S. Determination of heavy metals in cocoa beans from some major cocoa growing regions in Ghana. Food Sci. Technol. 2015, 16, 225. [Google Scholar]
  17. Chavez, E.; He, Z.; Stoffella, P.; Mylavarapu, R.; Li, Y.; Moyano, B.; Baligar, V. Concentration of cadmium in cacao beans and its relationship with soil cadmium in southern Ecuador. Sci. Total Environ. 2015, 533, 205–214. [Google Scholar] [CrossRef]
  18. HuamanI-Yupanqui, H.A.; Ángel Huauya-Rojas, M.; Mansilla-Minaya, L.G.; Florida-Rofner, N.; Neira-Trujillo, G.M. Presencia de metales pesados en cultivo de cacao (Theobroma cacao L.) orgánico. Acta Agron. 2012, 61, 339–344. [Google Scholar]
  19. Gramlich, A.; Tandy, S.; Gauggel, C.; López, M.; Perla, D.; Gonzalez, V.; Schulin, R. Soil cadmium uptake by cocoa in Honduras. Sci. Total Environ. 2018, 612, 370–378. [Google Scholar] [CrossRef]
  20. Llatance, W.O.; Saavedra, C.J.G.; Castillo, W.G.; Mondragón, E.P. Bioacumulación de cadmio en el cacao (Theobroma cacao) en la Comunidad Nativa de Pakun, Perú. Rev. For. Perú 2018, 33, 63–75. [Google Scholar] [CrossRef]
  21. Casteblanco, J.A. Técnicas de remediación de metales pesados con potencial aplicación en el cultivo de cacao. LA GRANJA. Revista de Ciencias de la Vida 2018, 27, 21–35. [Google Scholar] [CrossRef] [Green Version]
  22. Abt, E.; Fong Sam, J.; Gray, P.; Robin, L.P. Cadmium and lead in cocoa powder and chocolate products in the US Market. Food Addit. Contam. Part B 2018, 11, 92–102. [Google Scholar] [CrossRef]
  23. Rascio, N.; Navari-Izzo, F. Heavy metal hyperaccumulating plants: How and why do they do it? And what makes them so interesting? Plant Sci. 2011, 180, 169–181. [Google Scholar] [CrossRef]
  24. Argüello, D.; Chavez, E.; Lauryssen, F.; Vanderschueren, R.; Smolders, E.; Montalvo, D. Soil properties and agronomic factors affecting cadmium concentrations in cacao beans: A nationwide survey in Ecuador. Sci. Total Environ. 2019, 649, 120–127. [Google Scholar] [CrossRef]
  25. Gramlich, A.; Tandy, S.; Andres, C.; Paniagua, J.C.; Armengot, L.; Schneider, M.; Schulin, R. Cadmium uptake by cocoa trees in agroforestry and monoculture systems under conventional and organic management. Sci. Total Environ. 2017, 580, 677–686. [Google Scholar] [CrossRef]
  26. Zug, K.L.M.; Yupanqui, H.A.H.; Meyberg, F.; Cierjacks, J.S.; Cierjacks, A. Cadmium accumulation in Peruvian cacao (Theobroma cacao L.) and opportunities for mitigation. Water Air Soil Pollut. 2019, 230, 72. [Google Scholar] [CrossRef]
  27. Arévalo-Gardini, E.; Arévalo-Hernández, C.O.; Baligar, V.C.; He, Z.L. Heavy metal accumulation in leaves and beans of cacao (Theobroma cacao L.) in major cacao growing regions in Peru. Sci. Total Environ. 2017, 605, 792–800. [Google Scholar] [CrossRef]
  28. Sánchez Rodríguez, M. Evaluación del Contenido de Metales Pesados (cd y pb) en Diferentes Edades y Etapas Fenológicas del Cultivo de Cacao en dos Zonas del Alto, Huallaga. 2017. Available online: http://repositorio.unas.edu.pe/handle/UNAS/1299 (accessed on 3 February 2020).
  29. Resolucion Ministerial 449. 2018. Available online: http://minagri.gob.pe/portal/download/pdf/normas-legales/resolucionesministeriales/2018/noviembre/rm449-2018-minagri.pdf (accessed on 3 February 2020).
  30. Guia de Manejo Fitosanitario y la Inocuidad en el Cacaotal. 2017. Available online: http://repositorio.iica.int/bitstream/handle/11324/6456/BVE18029639e.pdf;jsessionid=167C0B852C59B94ACBF924E1EB010489?sequence=1 (accessed on 3 February 2020).
  31. Anyimah-Ackah, E.; Ofosu, I.W.; Lutterodt, H.E.; Darko, G. Exposures and risks of arsenic, cadmium, lead, and mercury in cocoa beans and cocoa-based foods: A systematic review. Food Qual. Saf. 2019, 3, 1–8. [Google Scholar] [CrossRef]
  32. Sabroso, M.; Pastor, A. Guía sobre suelos Contaminados; CEPYME Aragon y Gobierno de Aragon: Zaragoza, Spain, 2004; Available online: https://www.academia.edu/29109561/Gu%C3%ADa_sobre_suelos_contaminados (accessed on 3 February 2020).
  33. MINAM. Available online: http://www.minam.gob.pe/calidadambiental/wp-content/uploads/sites/22/2013/10/GUIA-PARA-EL-MUESTREO-DE-SUELOS-final.pdf (accessed on 3 February 2020).
  34. Nigam, R.; Srivastava, S.; Prakash, S.; Srivastava, M. Cadmium mobilisation and plant availability— The impact of organic acids commonly exuded from roots. Plant Soil 2001, 230, 107–113. [Google Scholar] [CrossRef]
  35. United States Environmental Protection Agency. Method 3050B. Acid Digestion of Sediments, Sludges, and Soils; Revision 2; U.S. EPA: Washington, DC, USA, 1996; Volume 2, pp. 1–12.
  36. Isaac, R.A.; Johnson, W.C. Collaborative study of wet and dry ashing techniques for the elemental analysis of plant tissue by atomic absorption spectrophotometry. J. Assoc. Off. Anal. Chem. 1975, 58, 436–440. [Google Scholar] [CrossRef]
  37. ArcGIS Pro, Software. Available online: https://www.esri.com/es-es/arcgis/products/arcgis-pro/overview (accessed on 3 February 2020).
  38. Decreto Supremo 002-2013 MINAM. Available online: https://fonamperu.org.pe/un-fondo-ambiental-para-el-peru/download/decreto-supremo-n-002-2013-minam/ (accessed on 3 February 2020).
  39. R Software. Available online: https://www.r-project.org/ (accessed on 3 February 2020).
  40. Reglamento Union Europea 488. 2014. Available online: https://eur-lex.europa.eu/legal-content/ES/TXT/PDF/?uri=CELEX:32014R0488&from=SL/ (accessed on 3 February 2020).
  41. Cieśliński, G.; Van Rees, K.; Huang, P.; Kozak, L.; Rostad, H.; Knott, D. Cadmium uptake and bioaccumulation in selected cultivars of durum wheat and flax as affected by soil type. Plant Soil 1996, 182, 115–124. [Google Scholar] [CrossRef]
  42. McGrath, S.; Zhao, F.; Dunham, S.; Crosland, A.; Coleman, K. Long-term changes in the extractability and bioavailability of zinc and cadmium after sludge application. J. Environ. Qual. 2000, 29, 875–883. [Google Scholar] [CrossRef]
  43. Resolucion Ministerial 0451. 2018. Available online: http://minagri.gob.pe/portal/resoluciones-ministeriales/rm-2018/22560-resolucion-ministerial-n-0451-2018-minagri-2 (accessed on 3 February 2020).
  44. Lê, S.; Josse, J.; Husson, F. FactoMineR: An R package for multivariate analysis. J. Stat. Softw. 2008, 25, 1–18. [Google Scholar] [CrossRef] [Green Version]
  45. Gabriel, K.R.; Odoroff, C.L. Biplots in biomedical research. Stat. Med. 1990, 9, 469–485. [Google Scholar] [CrossRef]
  46. Gower, J.C.; Lubbe, S.G.; Le Roux, N.J. Understanding Biplots; John Wiley & Sons: Hoboken, NJ, USA, 2011. [Google Scholar]
Figure 1. Delimitation of work area.
Agronomy 10 01576 g001
Figure 2. Cadmium Geochemical Map in soils.
Agronomy 10 01576 g002
Figure 3. Age of plants and Intensity of land use.
Agronomy 10 01576 g003
Figure 4. Cadmium content in soil: (a) cocoa crops; (b) sectors; (c) prior exploitation of field.
Agronomy 10 01576 g004
Figure 5. Correlation of heavy metals in soil, bean and leaves (a) The entire farm; (b) CCN51; (c) Creole-aromatic variety.
Agronomy 10 01576 g005
Figure 6. Biplot for Principal Component Analysis for heavy metals relating to sample units by sectors and quality of representation of variables with principal components.
Agronomy 10 01576 g006
Table 1. Factors related to cadmium absorption processes [30].
FactorsEffect of Absorption of Cadmium by Plants
Edaphic Factors
pHThe absorption process increases at a lower pH, that is, it is greater in acidic soils.
Soil SalinityCadmium absorption increases with soil salinity.
Cadmium ConcentrationAbsorption increases with increasing cadmium concentration.
MicronutrientsThe absorption process is variable according to the nature and quantity of micronutrients.
MacronutrientsThe absorption process is variable according to the nature and quantity of macronutrients.
TemperatureThe absorption increases with increasing temperature.
Crop Factors
Arable SpeciesThe absorption process of heavy metals decreases according to the following trend:
Vegetables> beans> cereals> fruits.
Plant TissueLeaf> bean> edible fruits and roots.
Sheet AgeOld leaves> young leaves.
Table 2. Average concentration in soils of: Cd, Pb, Zn, pH and electrical conductivity.
X east Y north Cd soil (mg/kg)Pb soil (mg/kg)Zn soil (mg/kg)pH approx CE approx (uS/cm)
518,642.009,032,291.001.755.4170.557.0639.94
518,644.009,032,343.001.605.0399.406.5510.30
518,690.009,032,334.001.907.2477.126.285.00
518,701.009,032,232.001.705.8197.108.00126.69
518,706.009,032,284.001.255.9174.706.708.00
518,986.009,032,159.001.755.6258.156.408.70
519,048.009,031,924.001.506.5782.956.5315.00
519,059.009,031,914.001.405.2668.305.795.00
519,080.009,031,887.001.405.0170.955.414.50
519,082.009,031,958.001.357.0258.706.3918.01
519,170.009,031,951.002.056.3730.156.469.00
519,178.009,032,126.001.507.1838.907.9252.25
519,188.009,032,064.001.104.8111.806.9530.00
519,188.009,032,092.001.856.3730.057.5040.28
519,199.009,031,868.001.355.0946.756.139.00
519,208.009,031,894.001.905.4148.406.2010.40
519,213.009,031,961.001.554.7491.156.2614.00
519,221.009,031,902.001.105.2158.706.1712.00
519,222.009,031,911.001.355.8961.706.1813.00
519,242.009,031,886.001.255.6454.236.0711.50
519,395.009,032,025.002.255.9427.806.0626.90
519,469.009,032,091.001.707.2338.606.5143.14
519,511.009,032,048.002.556.5164.356.3647.00
519,556.009,032,093.002.117.0247.355.9866.94
Table 3. Summary statistics on heavy metal content in beans, soils and leaves according to cocoa variety (mg/kg).
Summary StatisticsCd beans Pb beans Zn beans Cd soils Pb soils Zn soils Cd leaves Pb leaves Zn leaves pH approx CE approx
(uS/cm)
CCN51
Mean0.861.7379.031.595.6276.732.272.09112.116.6128.70
Standard deviation0.360.8310.470.260.7617.200.650.4324.360.6341.01
Coefficient of variability42%48%13%16%14%22%29%21%22%10%143%
CREOLE-AROMATIC
Mean1.072.1069.721.836.4938.632.082.45102.256.6837.06
Standard deviation0.330.6512.280.460.7716.290.820.5640.100.6517.93
Coefficient of variability31%31%18%25%12%42%39%23%39%10%48%
TOTAL
Mean0.961.7274.411.635.9358.662.102.15104.496.4926.11
Standard deviation0.340.7411.390.370.8122.630.690.5432.190.6227.66
Coefficient of variability35%43%15%22%14%39%33%25%31%9%106%
Table 4. Average content of Cd in soil according to total productive unit and intensity of land use (mg/kg).
Sample MeanCd SoilsSample SizeVarianceSCl 1
LowerUpper
Total
(E1, E2, E3, E4, E5)
1.63240.1351.441.83
Total without E11.53200.0761.351.71
Intensity of Land Use
Maize 7 years1.5580.1131.092.01
Maize 10 years1.5980.0651.231.94
Pasture 10 years2.8141.792--
1 Hotelling’s simultaneous confidence intervals; significance level 10%, p = 3 (Cd soil, bean and leaves).
Publisher’s Note: MDPI stays neutral with regard to jurisdictional claims in published maps and institutional affiliations.

