Article

Parameter Selection for the Evaluation of Compost Quality

1
Laboratorio de Valorización de Residuos Compostables, Universidad Nacional Experimental del Táchira UNET, San Cristóbal 5001, Venezuela
2
Departamento de Agronomía, Escuela Superior de Ingeniería, Universidad de Almería, 04120 Almería, Spain
*
Author to whom correspondence should be addressed.
Agronomy 2020, 10(10), 1567; https://doi.org/10.3390/agronomy10101567
Submission received: 29 July 2020 / Revised: 3 October 2020 / Accepted: 6 October 2020 / Published: 14 October 2020

Abstract

:
This work studies variables measured from the first phase of composting through the acquisition of the final product, with the goal of identifying those that are more strongly related to quality and are most useful for developing an index. The necessity to establish quality control procedures thus exists for the classification of raw materials in the same way as for the finished products. To accomplish this, three mixtures were prepared, with the goal of achieving a C/N ratio of 30 and a moisture content of 60%. The primary component of each mixture was: fruit processing waste (C1), sewage sludge from the food industry (C2), and the manufacturing waste of fried foods (C3). Temperatures were measured over 107 days, with the corresponding data fit to a logistical model where T °C ~ α / ((1 + exp (− (Time − β) / − γ))) + δ, with interaction compost * time being statistically significant (p < 0.001). This allowed for the temperatures, in keeping with health concerns, to be confirmed. Likewise, a linear regression analysis demonstrated the decomposition of organic matter at 0.82%/week. Statistically, the parameters, measured during the process, with the least variability were selected, which differed in the average contrasts: germination index (cucumber), electrical conductivity, and average moisture. A principal component analysis (PCA) and Spearman’s correlation analysis revealed the best Germination Index (GI) values for C1, due to lower electrical conductivity (EC) and bulk density (Bd) along with higher organic matter content (TOM). For its part, C2 induced a higher Relative emergence (RE) of the cucumber thanks to its higher content of total nitrogen (TN) and lower contribution of Cu, Zn and K. C3 showed a higher presence of salts, less favorable physical characteristics (>Bd and <TPS, total pore space) and higher content of Zn and Cu. Composting carried out with appropriate mixtures can offer high-quality products for use as fertiliser, in soil restoration, and as an alternative substrate to peat and virgin mountain soil.

1. Introduction

Ending poverty globally in all its forms, thereby guaranteeing sustainable consumption and production patterns, is one of the 17 Sustainable Development Goals put forth by the United Nations. In Latin America, between 30 and 65% of domestic waste, 85% of agricultural waste and a high percentage of that linked to agribusiness is not recycled [1]. This requires quantification and characterisation, as well as the use of techniques, like composting, that convert these wastes into agricultural and landscape resources for use as fertiliser or substrates for seedling production [2]. The significant variability of potentially compostable material is a concern, as are the differences resulting from locally available processes and technologies [3]. While one or two parameters alone cannot be used to extrapolate compost quality, measuring a large number of parameters is costly and impractical [4]. Therefore, it is necessary to design some kind of tool that could overcome this difficulty.
In Venezuela, the composting industry is practically non-existent, as are the corresponding product quality requirements. Institutional work since 2012 has led to several agreements relating to analytical methods, but the variables that must be prioritised during analysis and the means of using them to define a quality index must still be determined [5]. Chemometric techniques provide the tools for making these determinations and constructing the databases needed for safe use.
Compost is defined as organic material that has been stabilised and transformed into a product that is similar to the humic substances in soil. It must also be free of pathogens and weed seeds, not attract insects or other disease vectors, be easy to handle and store, and promote soil fertility and crop production. It must also be safe for users and the environment, which is why requirements focus on the presence of pathogens and heavy metals in compost [6]. Therefore, by their very nature, complying with these requirements would only partly guarantee that the product is a quality compost that fulfils the needed functions.
Quality is multifactorial and is influenced by the characteristics of the starting materials, the proportions in which they are mixed, and the manner in which they are processed. It is necessary to determine the carbon: nitrogen (C/N) ratio, the moisture content (M%), and the bulk density (Bd) of the starting materials in order to calculate the appropriate proportions in which they should be mixed. Mixtures should consist of two or more materials that yield a C/N ratio of 30 and a M% of 60%. Appropriate mixtures provide a favourable environment for the growth of aerobic microbiota; this process, mediated by the constantly changing chemical nature of the substrate, generates the temperatures needed for sanitation and humification. The primary indicator of microbial activity within the substrate mixture is an increase in temperature [7]. Temperature controlled to 54–55 °C during the thermophilic phase (above 40 °C) is a key factor in order to guarantee a safe product for the user through pathogen inactivation, as well as achieving the maximum decomposition of organic material and optimal biological activity [8,9]. Although Liang et al. [10] indicate the minimum humidity content of 50% as the dominant factor influencing microbial activity within the mixture, the appropriate microbial action corresponds to an increase in temperature. For their part, Tognetti et al. [11] indicate that compost such as vermicompost was higher quality and produced better agricultural results after a thermophilic phase (55–60 °C, 15 and 30 days), while the rate of organic material decomposition with a humification ratio of E4/E6 (AH/AF > 1.9) was improved when the temperature reached 60 °C rather than when it was <55 °C [12].
In this dynamic, an entire range of parameters of variable importance is expressed that affects the quality of the final product. Assessing the maturity and stability of the compost alone is insufficient [3]. To resolve this problem, chemometric methods and the application of statistical mathematical techniques allows for the identification, quantification, and determination of the weighted value of the chemical substances in compost [13]. From eight compost treatments, 32 experimental unit samples were taken and submitted for principal component analysis (PCA) and linear discriminant analysis (LDA). Both the standard compost and vermicompost presented a high degree of variation across some important parameters. It was possible to approximate a cause and effect interpretation of the variation in the resulting data. Correlation between shredded particle size, technology applied (standard compost/vermicompost) and raw material composition ratio was estimated. In order to resolve this matter, a wide range of chemometric analyses of the data were applied. It was possible to classify a number of groups heterogenous in analyzed organic amendments: A, B1, B2, B3 and C, each one characterised by its qualities [3], with the objective of more clearly understanding the effects on the quality of the finished product of the different treatments applied during the process of composting. The necessity to establish quality control procedures thus exists for the classification of raw materials in the same way as for the finished products.
Chemometric methods and techniques, multivariant statistical analysis (hierarchical conglomerate analysis; HCA) and factor analysis. HCA physiochemical parameters were applied to a group of 15 composts with distinct composition, managing the separate organic composite material in highly differentiated groups. The techniques allowed the identification of the principal variables associated with the compost comprising agroindustrial residues, which accounted for 72.3% of the variability [4]. The application of statistical mathematical techniques allows for the identification, quantification, and determination of the weighted value of the chemical substances in compost [14]. The selection of the parameters with the greatest weights enables the creation of classes or qualities [5] primarily centred on the biological effect of the study material on the indicated species.
Plant assays are often used to test the quality of compost products. Cucumber is a good maturity indicator owing to a high salt tolerance and intolerance to the volatile fatty acids of an immature compost. Moreover, its seeds are of large size, facilitating the detection of the cotyledons [15]. In contrast, garden cress (Lepidium sativum) is sensitive to volatile organic compounds as well as salts, its rapid development at 27 °C making it the species that is habitually utilized [16]. However, as is the case with radish, it has been demonstrated that cress does not differentiate between mature and immature compost [17,18]. Tomato, chickpea and soya are, in addition, included in phytotoxicity trials but have produced contrasting results. The cases are difficult to attribute to a singular threshold growth index (GI) to indicate maturity, which is universally applicable across the range of composts since the seed varieties each respond in a distinct way to the same compost [2,19].
The purpose of this work is to evaluate the physical, chemical, and biological parameters before, during, and at the end of the composting process, in order to obtain information that is useful in constructing a quality index for the classification of future samples.

2. Materials and Methods

This study was carried out in the state of Táchira in Venezuela, specifically in the municipality of Jáuregui. The global coordinates are 8°7′54.7″ N–71°58′46.2″ W. According to Holdridge, the area is characterised as a Lower Montane forest, with average ambient temperatures between 12 and 16 °C [20].

2.1. Characterisation of the Raw Materials

The following residue was generated in Jáuregui: extraction of waste pulp and residual sewage sludge generated in the production of fried foods, waste from the production of panela (specifically filter sugar cane, FSC), chicken manure from local poultry pens, and rice husks and sawdust. These were characterised in terms of their total nitrogen content (TN) via a micro-Kjeldahl apparatus [21], and carbon content via incineration at 550 °C [22]. C/N ratio, Bulk density (Bd) (t m−3) and M% [23].

2.2. Pile Composition

The research was carried out in a covered shed with good ventilation. Three types of piles, fruit processing waste C1, sewage sludge C2 and the manufacturing waste of fried foods C3, were created using the available wastes, each in triplicate. The dimensions of the piles were as follows: 1.5 m height × 2.5 m width × 3 m length. The raw materials were mixed in line with the values in Table 1, such that the theoretical objective of a C/N ratio of 30 and a M% of 60% were achieved; the spreadsheet published by Richards [24] was used to support this process.
The piles were equipped with tubes 7.62 cm in diameter, with perforations 2 cm in diameter. The tubes were placed longitudinally at a height of 1/3 of the pile; this provided the forced aeration necessary for two weeks at the beginning of the process. The weekly quantification of the M% allowed for the ongoing adjustment with water inputs of this variable to close to 60%.

2.3. Sampling and Variable Analysis

The composting process was monitored over 18 weeks. The sampling consisted of randomly selecting 16 points across the body of each pile for extracting subsamples 1 L each; these were mixed and reduced to a total volume of 16–18 L per repetition. The described samples were packed in hermetically sealed plastic bags and immediately brought to the laboratory for their analysis [25].
Finally, biological tests were performed to evaluate phytotoxicity. The samples were taken randomly in the three piles of each treatment (C1, C2 and C3) at the end of the process. The biological tests with the indicator species (cucumber, radish, tomato) were carried out following the methodology of Zucconi [26] for the in vitro test and TMECC [15] for the horticultural tray test. For the in vitro test, two indicator species were included: cucumber and radish that were treated with aqueous extracts of compost samples taken in the compost piles at random 108 days after the composting process, transporting them immediately to the laboratory. For the preparation of the extracts, two parts of distilled water were mixed with one part of compost (on a dry basis) in a 150 mL beaker. It was mixed with and allowed to soak for 3 h. The extract was then released by compression and filtered through Whatman No. 40 filter paper. Ten seeds were placed in each Petri dish with filter paper on the bottom, five dishes per replica of treatment and type of seed. Then enough extract was dispensed to saturate the filter paper; in this case, three mL was needed.
The Germination Index (GI) was calculated as shown in Equation (1) by multiplying the germinated seed number (G) and length of roots (L) and expressed as a percentage (GI%) with respect to the control as follows:
GI (%) = (Lr × %Gs) / (Lc × %Gc) × 100
where: Lr = length of roots (mm) in seeds treated with compost extract sample; Gs = number of seeds treated with compost extract sample that germinated; Lc = length of roots (mm) in seeds treated with water (control); Gc = number of seeds treated with water (control) that germinated.
For the tray test, compost (C1, C2 or C3, 50%) was mixed with peat (50%, v/v). The mixtures were homogeneously moistened and after 4 h the excess water was drained. Each treatment was carried out in triplicate. Controls consisted of compost (100%) or peat (100%). Ten seeds were placed in each substrate. The trays were kept in the greenhouse for 10 days. Seedlings with expanded cotyledons and fully expanded hypocotyl were counted. RE% (Relative emergence) was calculated by:
RE% = (ES/EC) × 100
where: ES = number of emerged seedlings with exposed cotyledons in the sample; EC = number of emerged seedlings with exposed cotyledons in the control.

2.4. Data Processing and Analysis

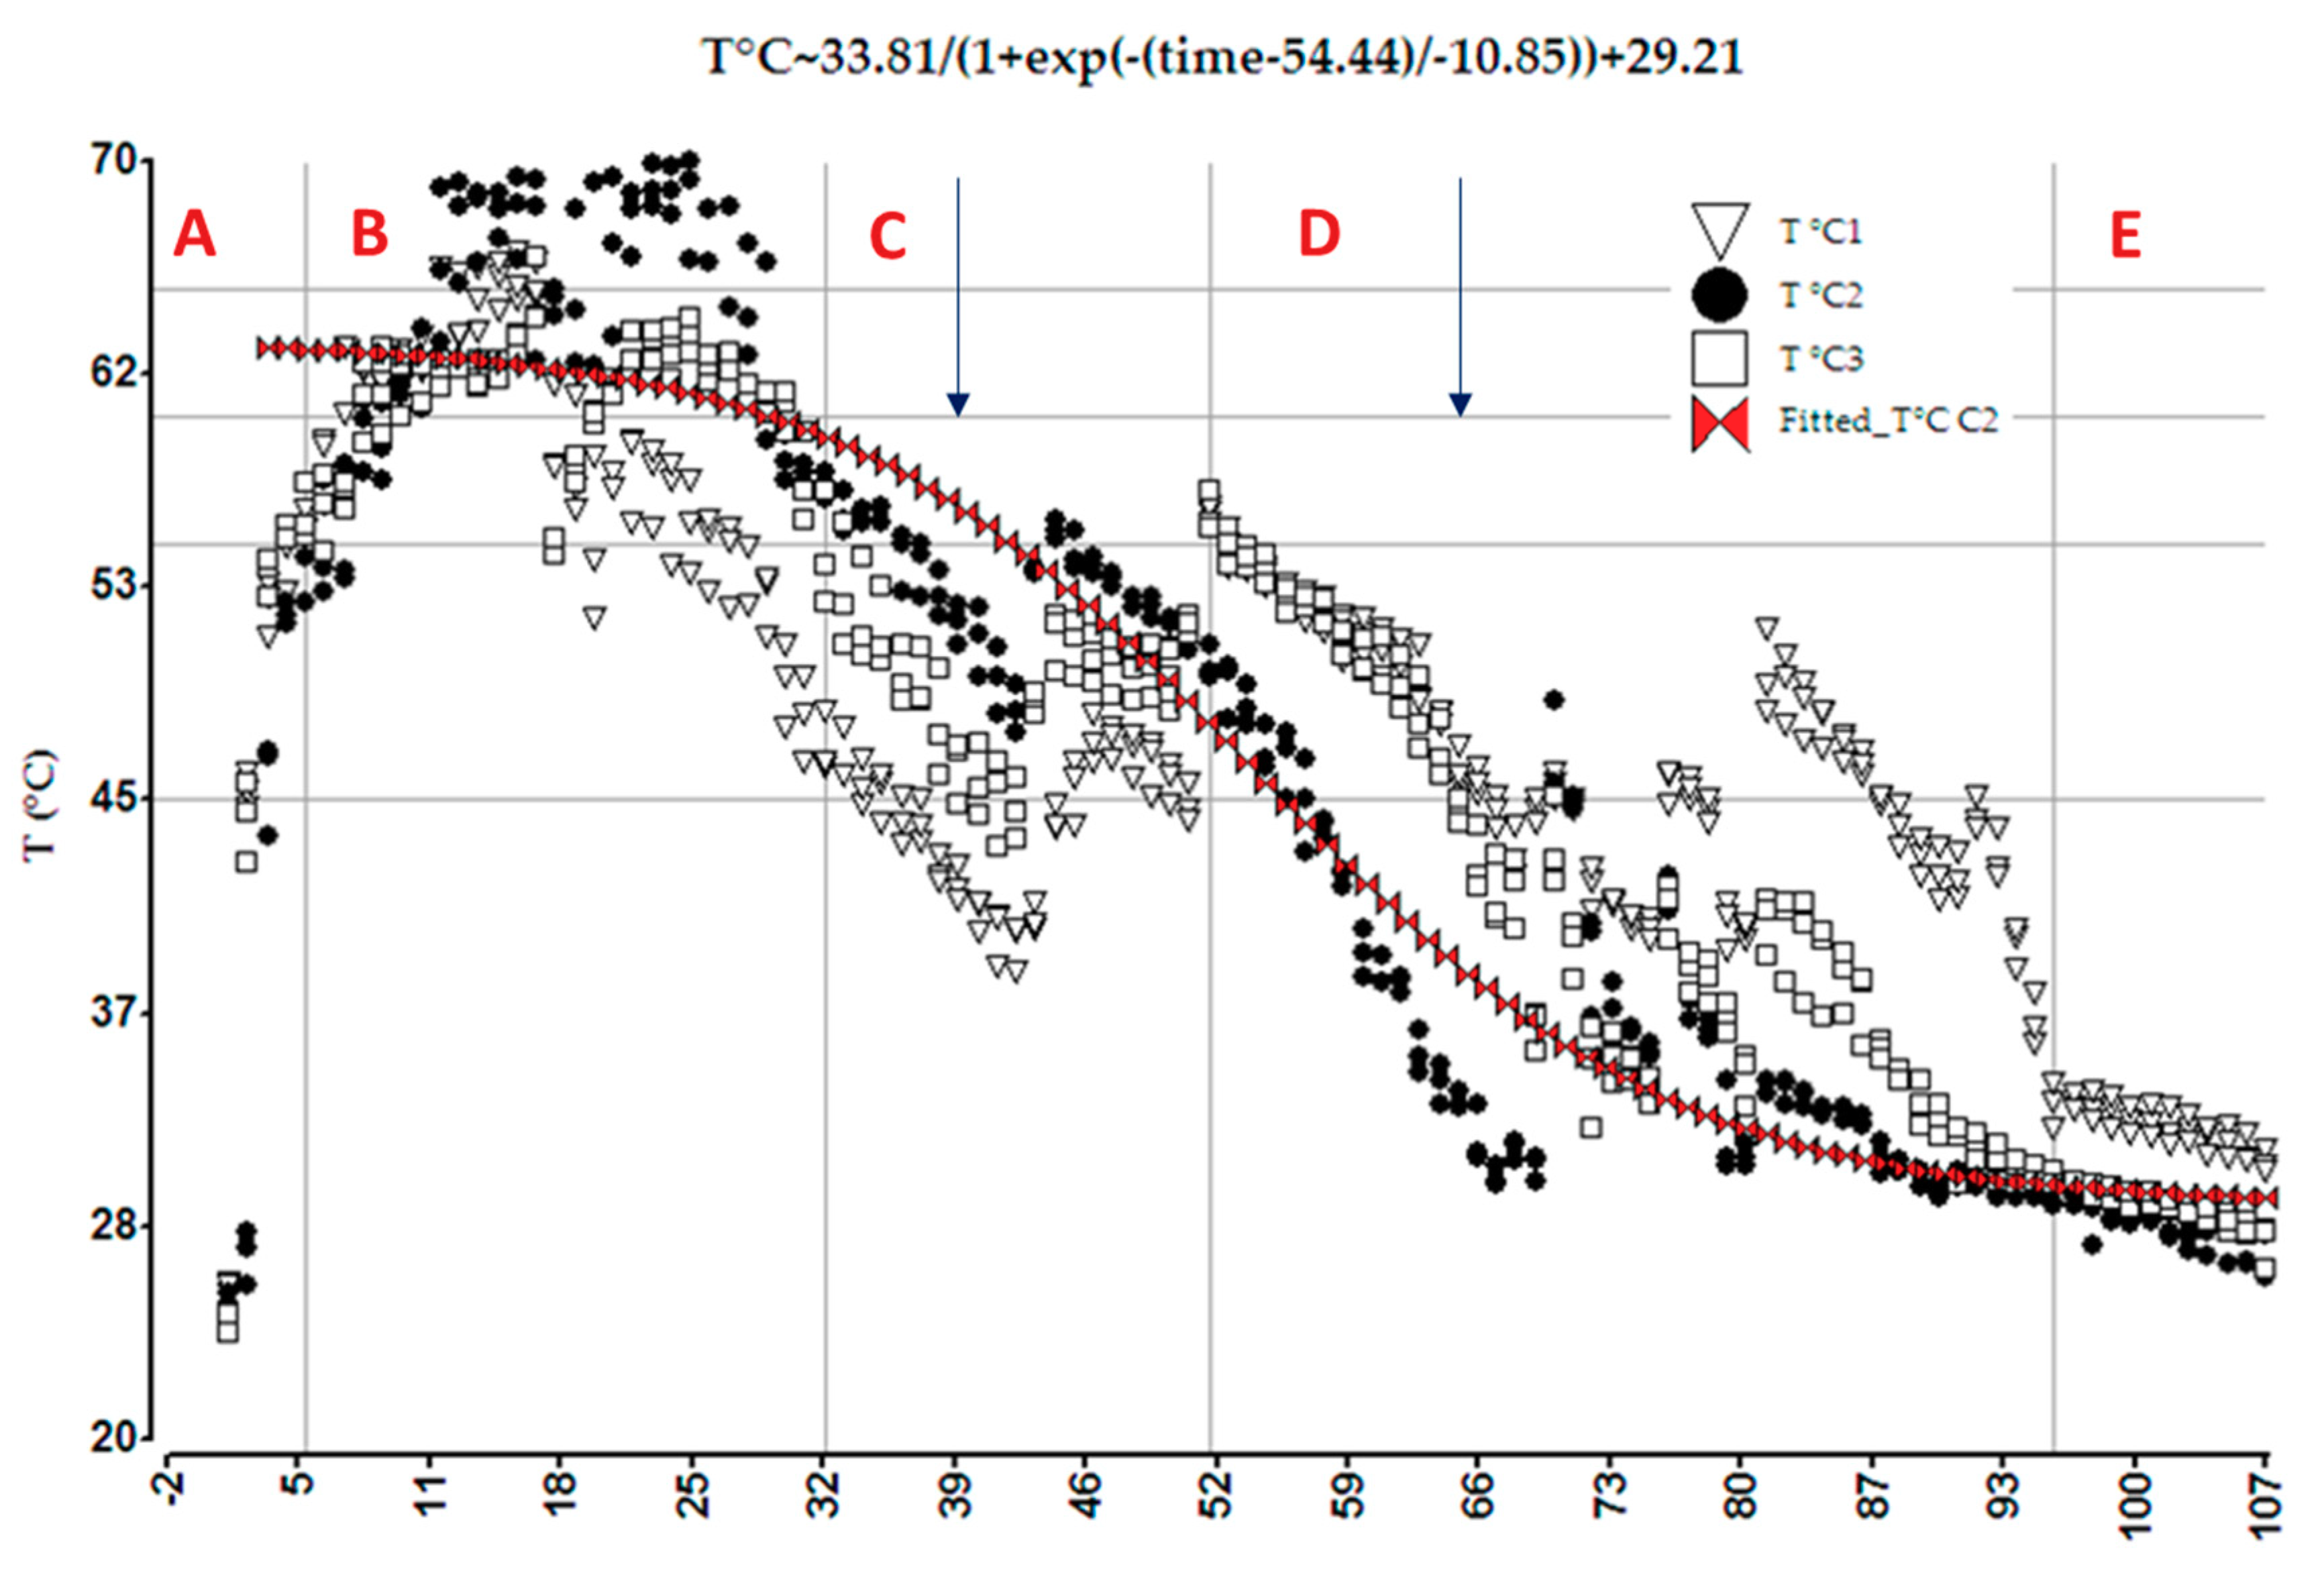
The experimental design had a factor with a level; type of mixture (C1, C2, C3). The statistical analysis consisted of the application of generalized linear mixed models, taking into account the temperature values of the mixtures (C1, C2, and C3), as taken over 107 days. Likewise, it included an analysis of the temperature-time interaction via a fixed effect analysis, as well as a nonlinear regression analysis (Figure 1) for detecting differences between mixtures over the course of compost processing.
Temperature measurement was performed daily. The following values were measured weekly for 18 weeks: pH, electrical conductivity (EC; dS m−1), M%, and organic matter (TOM; %) [13]. Initial and final values of the following were measured: Bd (t m−3), TW-HC (total water-holding capacity (TW-HC; %), total pore space (TPS; %), particle density (Pd; t m−3) [21], resistant organic matter (ROM; %) [22], and TN (%), Ca, K, Mg (%), Fe, Cu, Mn, and Zn (mg kg−1) content, which were determined using atomic absorption spectrophotometry after acid digestion [27].
An analysis of variance (ANOVA) was performed to determine to what extent the responses to treatment were different from the published reference values (Table 2), that is, data corresponding to physical, chemical and biological parameters that met the assumptions of normality and homoscedasticity. In addition, the TOM decomposition rate was found by linear regression analysis applied to weekly measured TOM values. The mean values for each of the variables measured at the beginning and end of the process were analyzed using General Linear Models (GLM) of mixed effects. This was followed by ANOVA to detect differences between the parameters at the end of the process. Finally, a principal component analysis (PCA), accompanied by a linear discriminant analysis. Statistical analyses were performed using the INFOSTAT statistical package, version 2012, National University of Córdoba, Argentina [13].

3. Results

3.1. Analysis of Parameters during the Process

3.1.1. Evolution of Temperature

Global statistics for temperature values over the 107 days measured, treating the compost variables (variation of T in time for C1, C2, and C3) and time as fixed effects, demonstrated significant differences (p < 0.001), as did the following interaction: Compost * Time. The Bayesian statistics output of the program were: n= 963; AIC (Akaike information criterion) = 2998.9; BIC (Bayesian information criterion) = 4440.9; logLik = −1176.45; σ = 1.15; R2 = 0.99. Along with the sequential hypothesis and fixed effects test values, these indicate a fit of the model and that temperature averages for C2 and C3 are equal with respect to C1, which the model treats as zero [19]. Afterward, linear regression analysis was performed for C2 (Figure 1), which revealed the following logistic fit:
T °C ~ α / ((1 + exp (− (Time − β) / − γ))) + δ
where: α = 33.81, β = 54.44, γ = −10.85, and δ = 29.21, all significant (p < 0.0001); AIC = 1844.52, BIC = 1863.28, logLik = 917.26, σ = 4.48.
The significant differences (p < 0.0001) in the temperature values depend on the type of material. However, given the complexity of this process, they also depend directly on M% (this value, which was initially 60%, and particle size were controlled by the necessary flow of oxygen). The temperature in the mixtures started with an initial mesophilic phase, quickly reaching 40 °C. The thermophilic phase (>45 °C) began on day 6 and lasted until day 26 with temperatures over 55 °C (Figure 1). Likewise, temperatures over 65 °C were registered for C1 (3 days) and C2 (12 days); this was not observed for C3, which is likely reflected in the behavior of other variables, primarily the biological variables.
Maximum temperatures exceeded 55 °C for at least 15 days (21, 30, and 28 days for C1, C2, and C3, respectively), 60 °C for 1 week (11, 20, and 21 days for C1, C2, and C3, respectively), and 65 °C for at least 3 days during the process (3, 12, and 0 days for C1, C2, and C3, respectively). This guaranteed that plant and human pathogens were eliminated and that weed seeds, primarily in C1 and C2, were neutralised [14]. Afterward, from days 30 to 52, there was a constant decrease in temperature, finally reaching room temperature after day 96 (cooling phase).

3.1.2. Decomposition of TOM and Evolution of pH Values

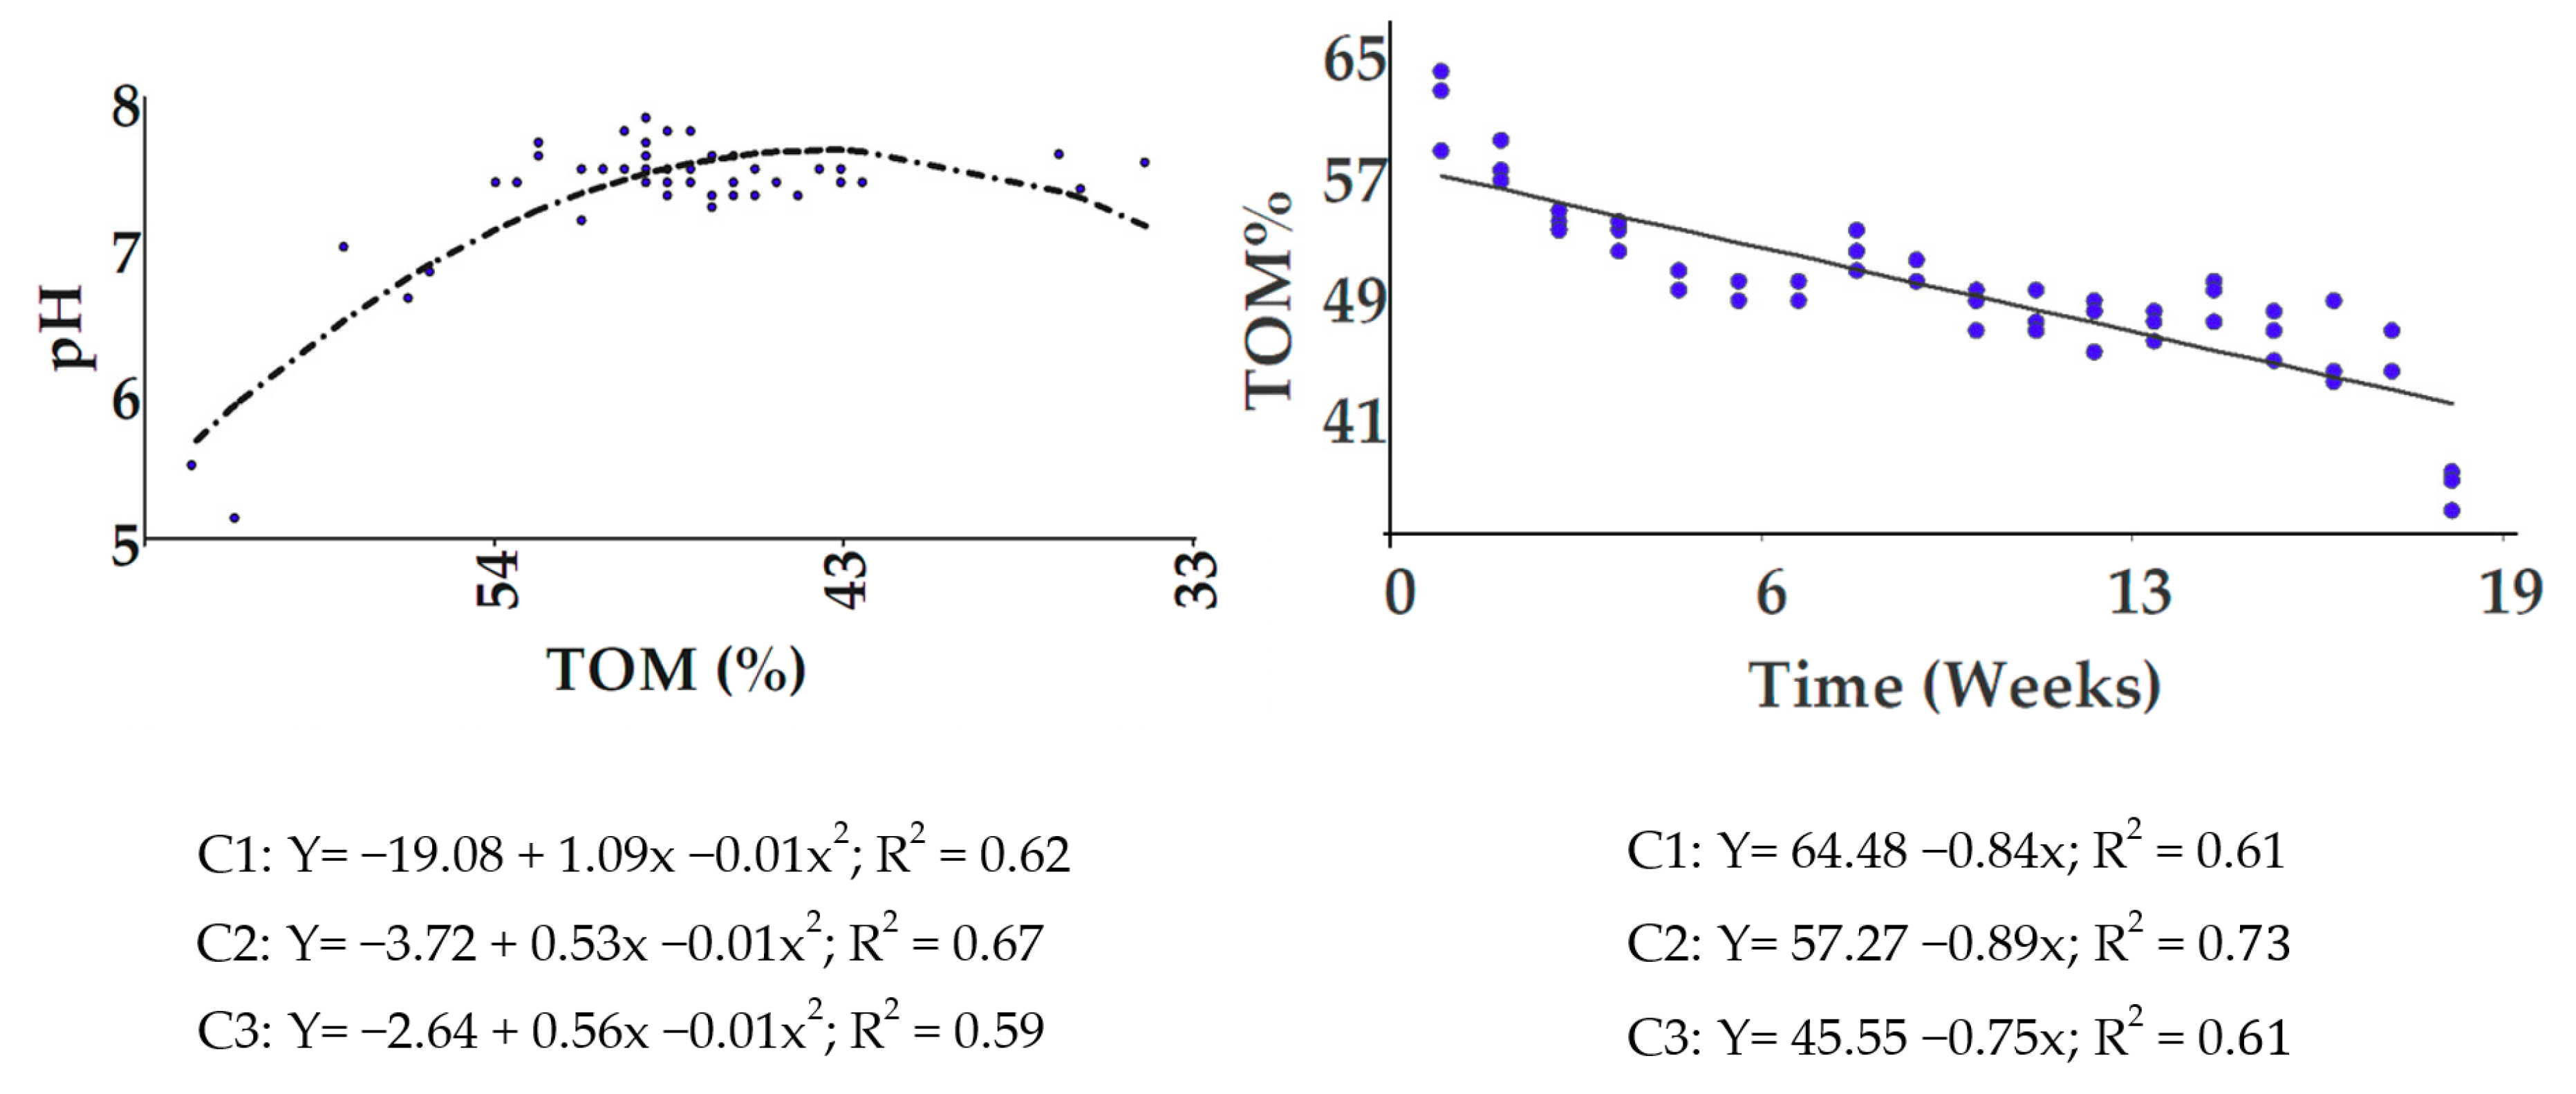
The evolution of temperature combined with an M% of about 60%, was favourable to the sustained decomposition of TOM over the 18 weeks in which the process was studied. The Pearson correlation coefficients for TOM as variable 1, with respect to the T and M% measured weekly, and time as variable 2 gave corresponding values as follows: T = 0.61; M% = −0.53; pH = −0.59; Dry Bd = 0.77; Time = −0.86 (all p < 0.0001). Other authors [1,31] have described a similar pattern to what is described here, finally arriving at values close to 20%, considered acceptable in the literature [32,33] (Figure 2). Predicted values for the accumulation of TOM% in compost over 18 weeks showed a linear fit, as follows:
TOM% = α × exp (β × week)
where: α = 57. 84 and β = −0.02 (p < 0.0001); AIC = 89.81; BIC = 92.49; R2 = 0.75.
As indicated in Figure 2, the general model can be interpreted [34] to indicate that every week, TOM% decreases by 0.82%. This is similar to what was reported when a predictive model of the decomposition rate of TOM was applied during temperature-dependent composting [35].
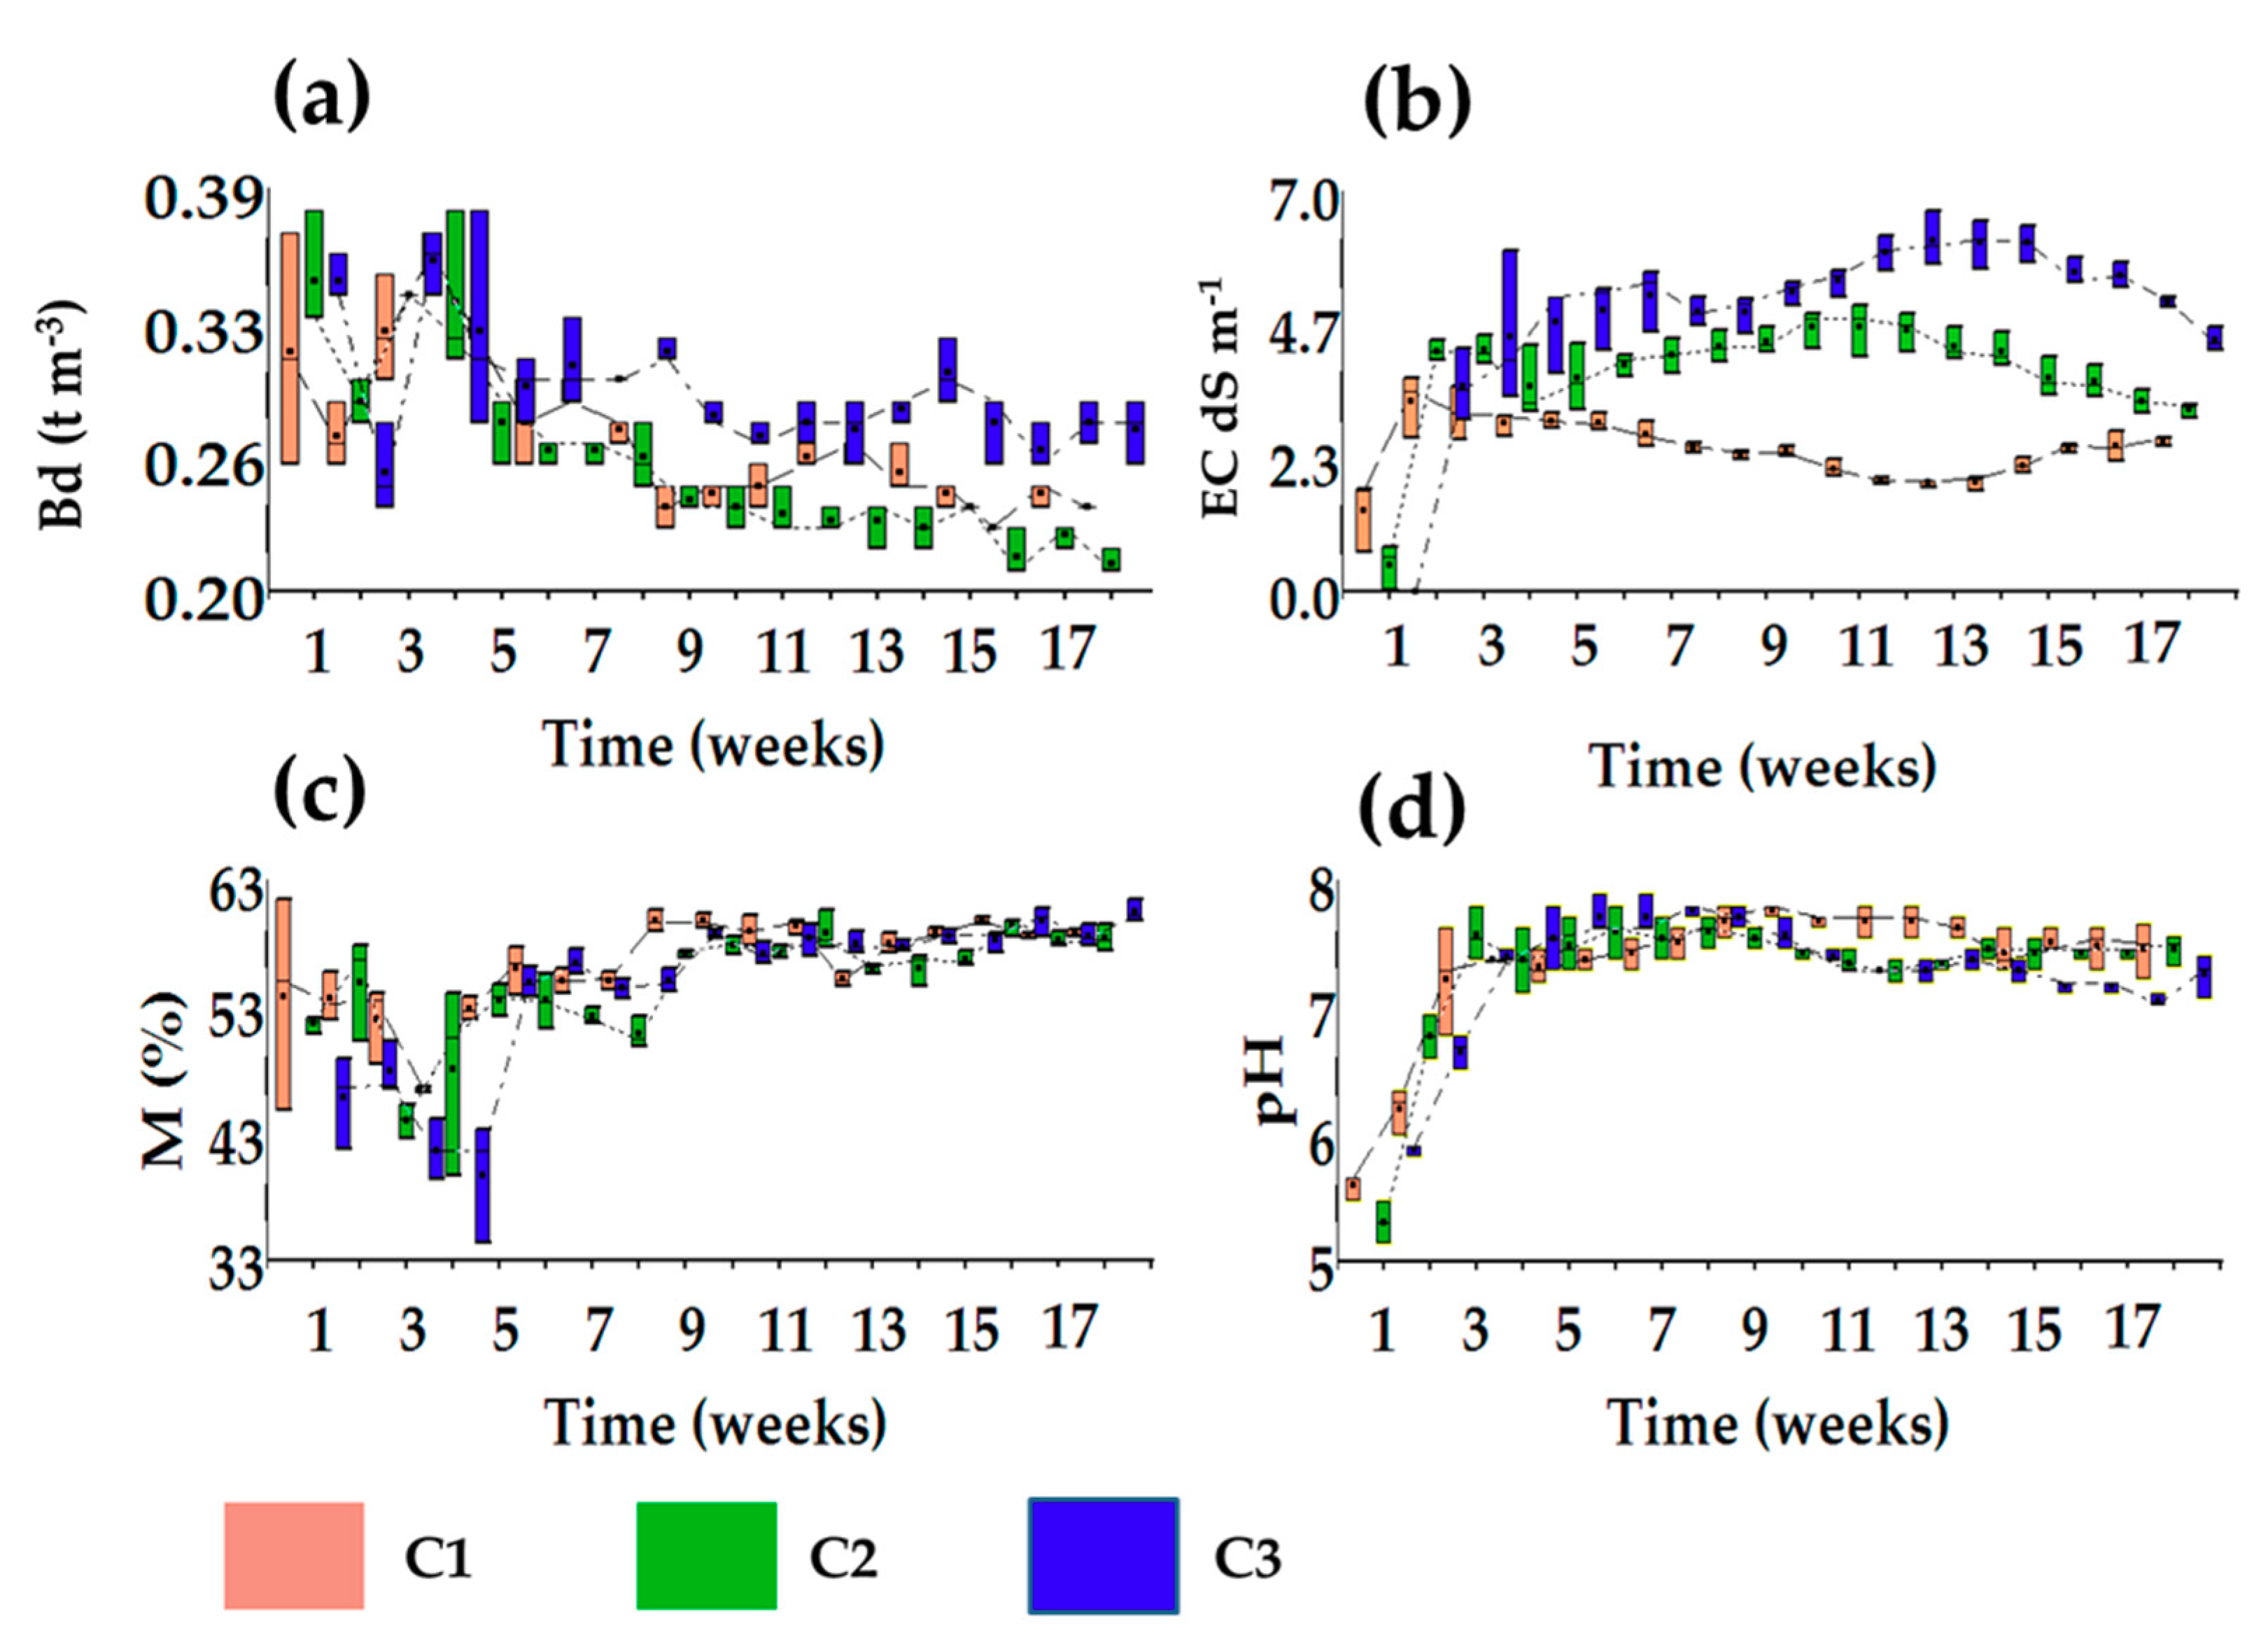
pH shown a lineal increase in the three mixes during the first three weeks (p < 0.001), indicating the release of organic acids [36]. This process accelerated rapidly until slowly reversing and approaching an alkaline pH (Table 2), due probably to the generation of ammonia resulting from the breakdown of proteins [37]. Running a linear regression analysis of pH against TOM as a regressor variable revealed that the changes in TOM content were significantly related to changes in pH with a cuadratic fit. As can be seen (Figure 3), while decomposition of organic matter occurs throughout the 18 weeks evaluated, the pH first increases in a linear tendency and after week 10 it seems to stabilize around a slightly alkaline value. Later, it will become neutral and stable thanks to the buffering effect the compounds synthesized from aromatic alcohols and acid phenols from the degradation of lignin [38]. The acceptable pH values for compost range from 6.5 to 8.5; the values in this study were, ultimately, slightly alkaline (C1 = 7.87, C2 = 7.88, and C3 = 7.73), demonstrating increases of 42.31%, 51.53%, and 31.68%, respectively.

3.1.3. Evolution in Moisture Content

Decomposition of TOM correlated positively and significantly with M%. In the first 5 weeks, M% fluctuated in response to the dramatic increase in temperature (Figure 3). As mentioned, monitoring of M% indicated a decrease and served to inform the necessary adjustments for C3, which oscillated between 40% and 55%. Accordingly, M% in the three treatments remained relatively constant between 50% and 60% (Figure 3a). An important characteristic to highlight was the absence of leachates in the piles, which indicates that the mixtures are close to the proposed objective in relation to humidity, which shows lower values according to the temperature peaks during the thermophilic phase.

3.1.4. Evolution of Bulk Density

The bulk density (Bd) is a variable of great importance during and after the composting process. Our results show similar values in the three mixtures, close to 0.34 and constantly decreasing to 0.24, 0.21 and 0.28 (Figure 3c).

3.1.5. Evolution of Electrical Conductivity Values

The ECs of the mixtures were statistically equal initially (C1 = 2.65 dS m−1, C2 = 3.19 dS m−1, and C3 = 4.41 dS m−1); however, by the end of the process, C2 was the only mixture to show a statistically significant change, a decrease, as per Student’s t-test (p < 0.05) (Figure 3d, Table 2).

3.2. Characteristics of the Final Products

The final values obtained for the mixtures were analysed to determine if they complied with the assumptions of normality and homoscedasticity by using the Shapiro-Wilk and Levene’s tests, respectively (data not shown).
The generated statistical information was then subjected to parametric ANOVA or Kruskal–Wallis. This was used to determine safe ranges for using the evaluated variables as possible indicators of compost quality. Using the W statistic (p < 0.05) (data not shown), it was observed that the variables SG (Stability Grade), TN, RE50 rad, RE100 cuc, Bd, Fe, Zn, and Mn did not exhibit a normal distribution.

3.2.1. Resistant Organic and Stability Grade

Maturity and stability are terms that must be differentiated from each other. The first refers to the absence of phytotoxic compounds, while the latter relates the state of decomposition or biodegradability that can be feasibly measured via the acid hydrolysis method [28] in this study. The use of compost, from the point of view of soil conservation, is meant to improve TOM content (avoiding erosion and increasing water retention); this is accomplished only if the applied TOM has a low rate of mineralisation. A stable compost is difficult to degrade and releases nutrients slowly. The presence of N reduces the risk of eutrophication [39], which is relevant given the risk associated with applying high amount of low stability TOM.
The accumulation of products resistant to hydrolysis was evident in calculating ROM based on the process described by Soliva and López [32], (SG = (ROM/TOM) × 100), where TOM = total organic matter (Table 2). Over the course of this work, SG more than doubled for each of the samples: C1: 23.42 ± 1.18 to 54.09 ± 2.81; C2: 22.75 ± 1.14 to 66.55 ± 0.79; and C3: 26.46 ± 0.22 to 54.97 ± 0.54. In all cases, the 50% benchmark was exceeded (Table 2). Acosta et al. [39], and López et al. [31], obtained similar values (SG of 58%) using a mixture of municipal waste sludge, goat manure, and waste from Aloe vera processing. Similarly, a co-composting plant for organic waste gave SG values of 48–65%.
Total nitrogen increased satisfactorily for the three treatments, with final values ranging from 1% to 3% [26], which was desirable with respect to the quality as fertilizer of the compost. Meanwhile, the theoretical initial values for the C/N ratio of all the mixtures were 30 (Table 1); chemical analysis adjusted to the initial humidity revealed that the real values were 36.45 ± 1.2, 38.42 ± 3.02, 36.45 ± 1.2, 38.42 ± 3.02, and 59.03 ± 10.11, respectively. Values higher than 30 restrict microbial growth due to limited nitrogen, with the immobilisation of NH4+ in NO3. Values lower than 25 mean that the excess nitrogen can be lost as NH3 [13,14,37].
Our goal here was to demonstrate the importance of preparing mixtures with a C/N ratio of 30 and an M% of 60% in obtaining high-quality compost. As such, the components were mixed to achieve the aforementioned theoretical values. However, the real values were different. This difference was contrasted with the IG for cucumber as a biological indicator, as explained later on.
At least one of the mixtures differed with respect to C/N ratio (as well as for other variables), necessitating that pairs be tested against each other. Next, confidence interval values were shown to identify within the range of expected results. Other variables, specifically EC, TOM, M%, IG cuc, and Cu, were found to be statistically different, meaning that they could express contrasting behavior with respect to other variables.
Continuing with the non-parametric analysis for the variables for which it was necessary, other variables that differed statistically between the mixtures were detected, specifically TN and Fe content, which are important due to their nutritional significance. However, they were omitted in later analyses in order to search for greater assertiveness in constructing the quality index.

3.2.2. Biological Response

GI and RE% are the most important of all the measurable values, as these express the general quality of the compost with respect to its biological value. The results indicate the profound importance of an equilibrated mix in achieving the desired results in the expected time. Germination tests indicate the phytotoxicity of the compost and a GI over 50% indicates that the compost is non phytotoxic [13]. C1 and C2 indicated no phytotoxicity, while C3 exhibited low phytotoxicity values and radicle length. The phytotoxicity of C3 may indicate the presence of heavy metals; alternately, it may be due to the high concentration of salts, as indicated by EC values (Table 2).

3.3. Identification of Critical Process Parameters

Composting consists of transformations that yield a mature and stable material. Compost quality refers to an estimation of the maturity and stability of the compost. However, given that quality is multifactorial, multivariate analysis is needed. Even then, there are various possibilities, including cluster analysis, PCA, and LDA, among others. Measured variables were selected based on their values agreeing with assumptions of normality, homoscedasticity, and independence of errors. They also needed to fall within the range framed by the confidence interval [15].
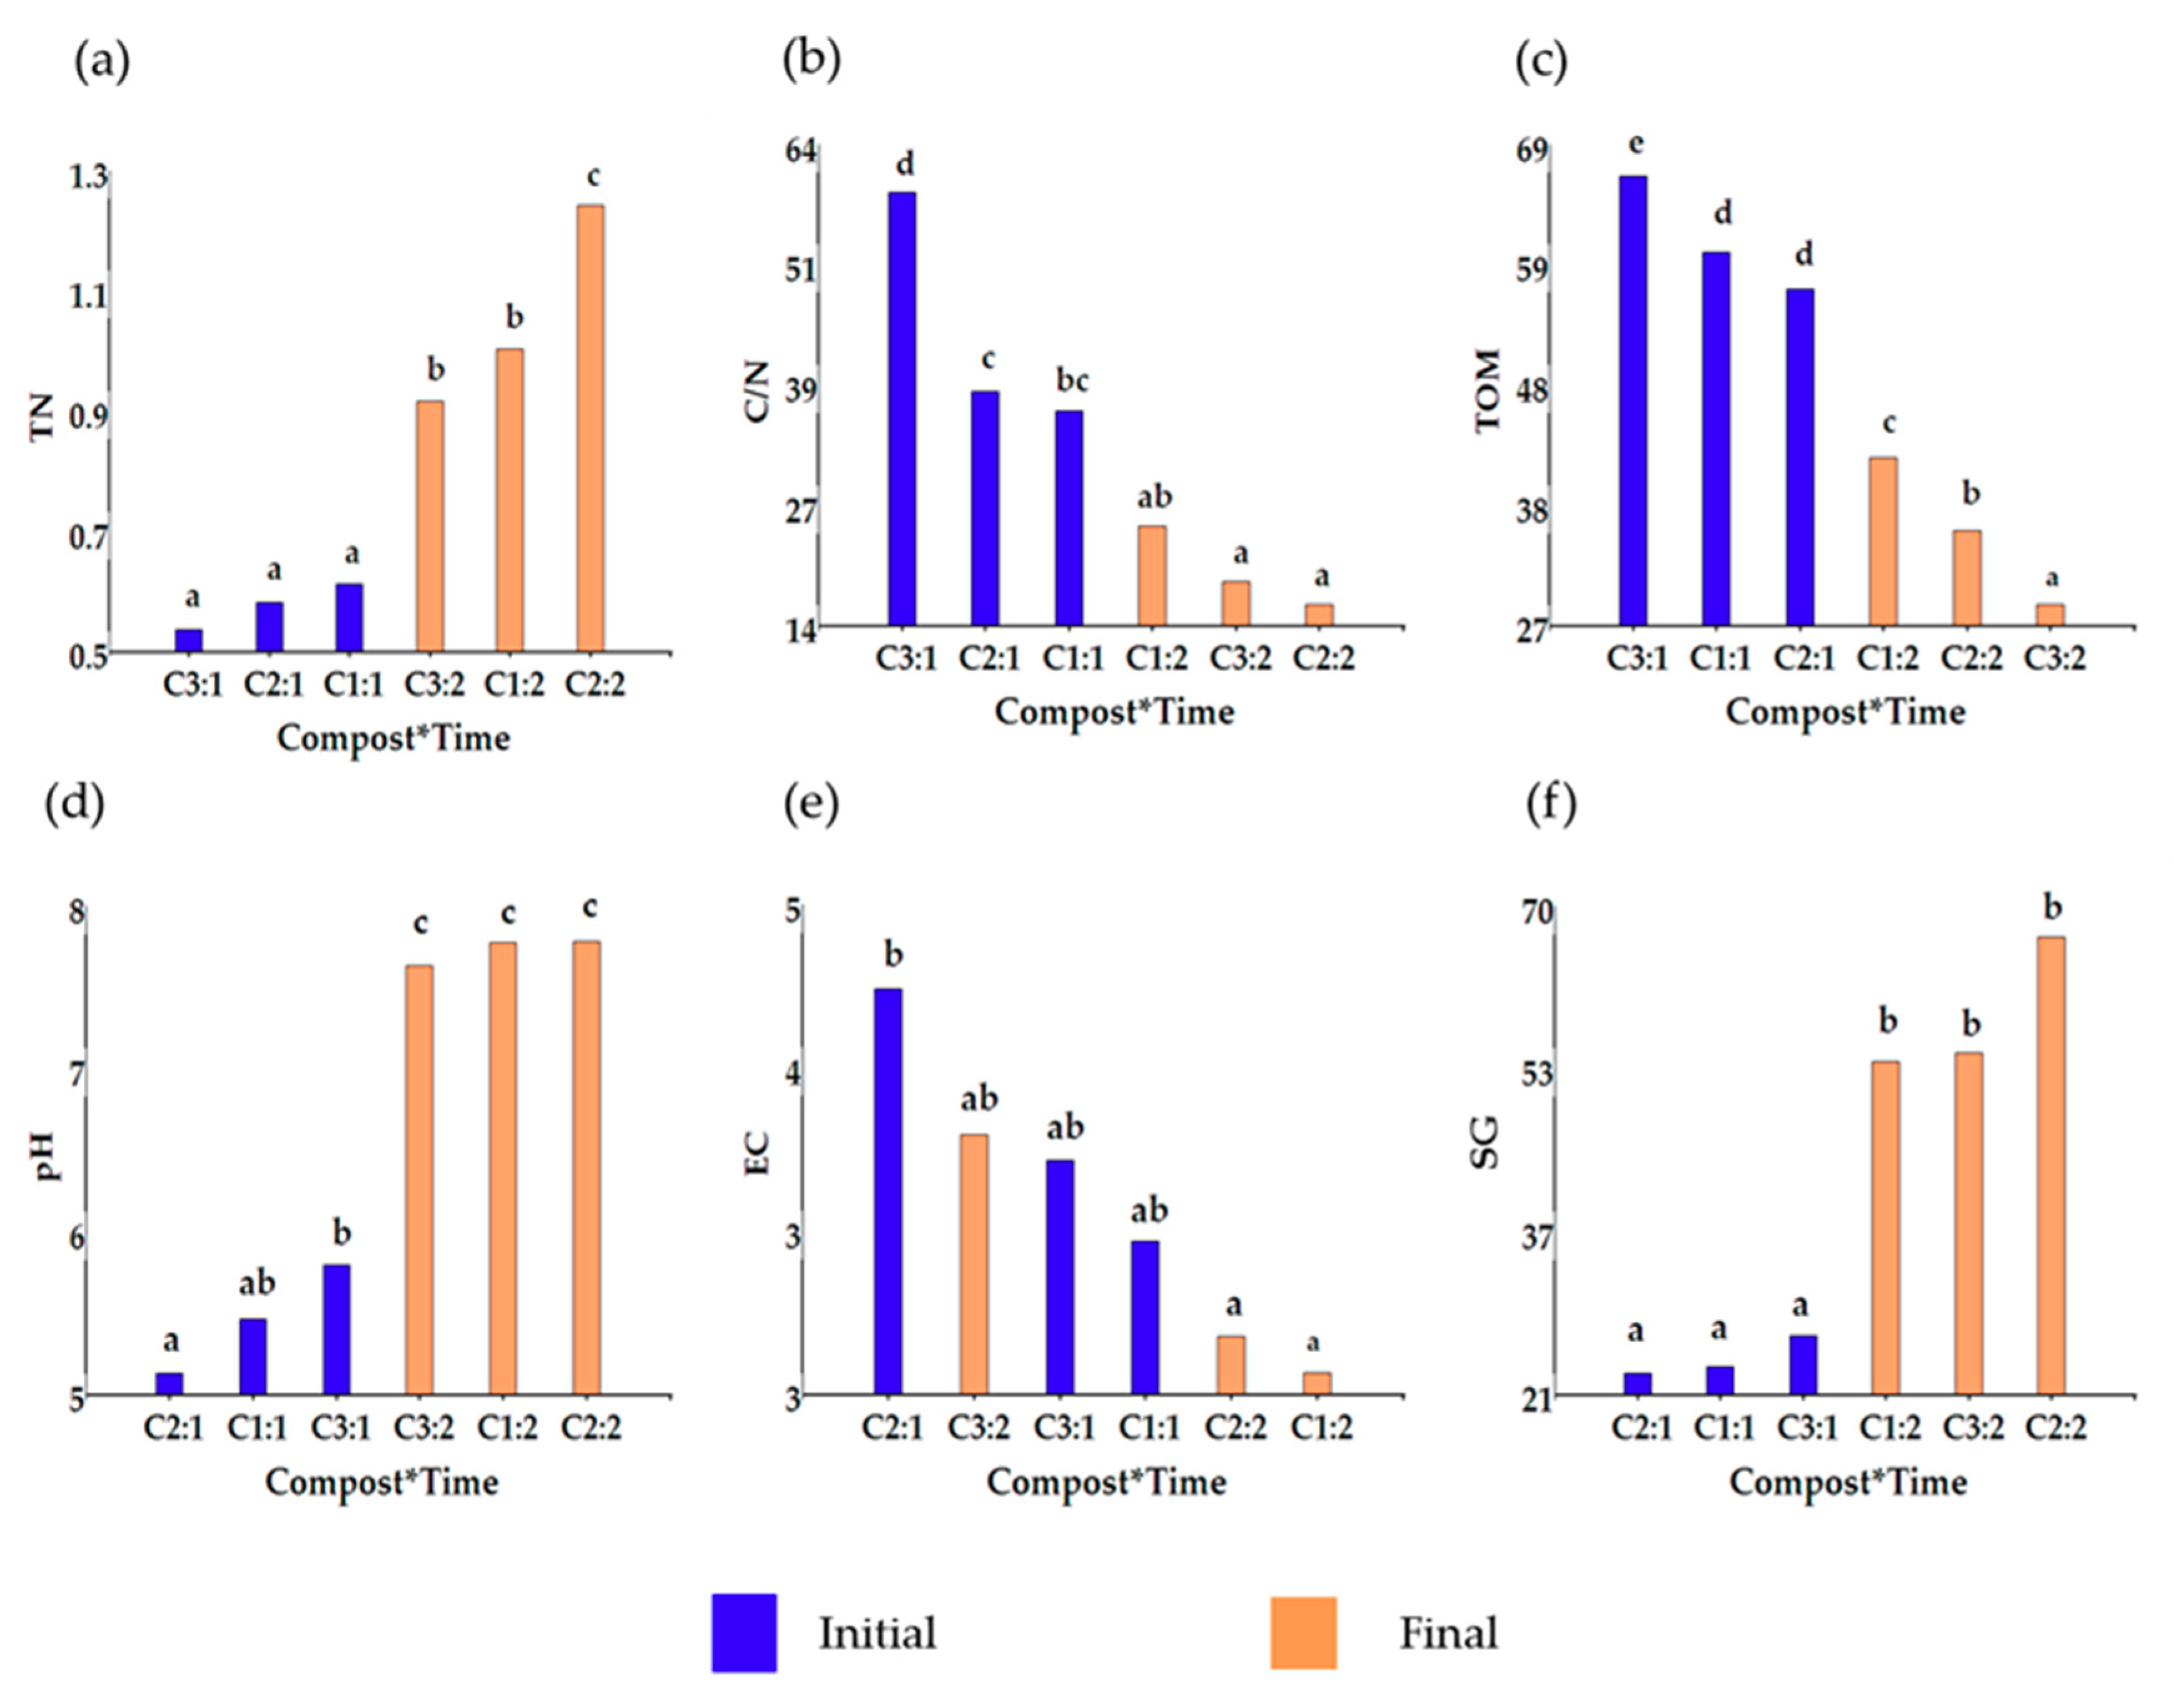
A 29 case (row) data set was constructed from representative of samples proceeding from different composting processes which better distinguish the groups of quality after the progressive filtration of the 27 variables originally measured by ANOVA and PCA. Through that matrix, three useful standards were established to classify the samples of this study in a simple manner: C1, C2 and C3 to standard a and standard b. Thus, future samples could be classified according to these criteria. Cluster analysis was applied, but it was not possible to separate the mixtures by quality. As can be seen from Table 2, the composted mixtures respond differentially to the treatment and express either an increase or a decrease in values. This is very important because a final product without phytoxicity and with the highest possible fertilizer value is desired. With that criterion, critic variables were selected to draw a possible quality index. Critic indicators were searched doing a new ANOVA selecting interaction between compost type and time (initial and final) (Figure 4). Those variables were selected with differences in statistical significance both with respect to time and blend composted (C1, C2 and C3).

3.3.1. Principal Component Analysis

PCA operates via a matrix of variances and covariances of data, preserving the corresponding Euclidean distances. However, unreal differences can be derived from the distances when the scale or unit of measurement of any variable is extremely high. To overcome this issue, Balzarini et al. [40] recommended using the correlation matrix or, alternately, standardised data. Data standardisation consists of subtracting the mean of the variable from each observed value and subsequently dividing the result by the corresponding standard deviation. The analysis revealed the two first axes as the most important. From the third onwards, the increases were small in terms of detected variance (data not shown).
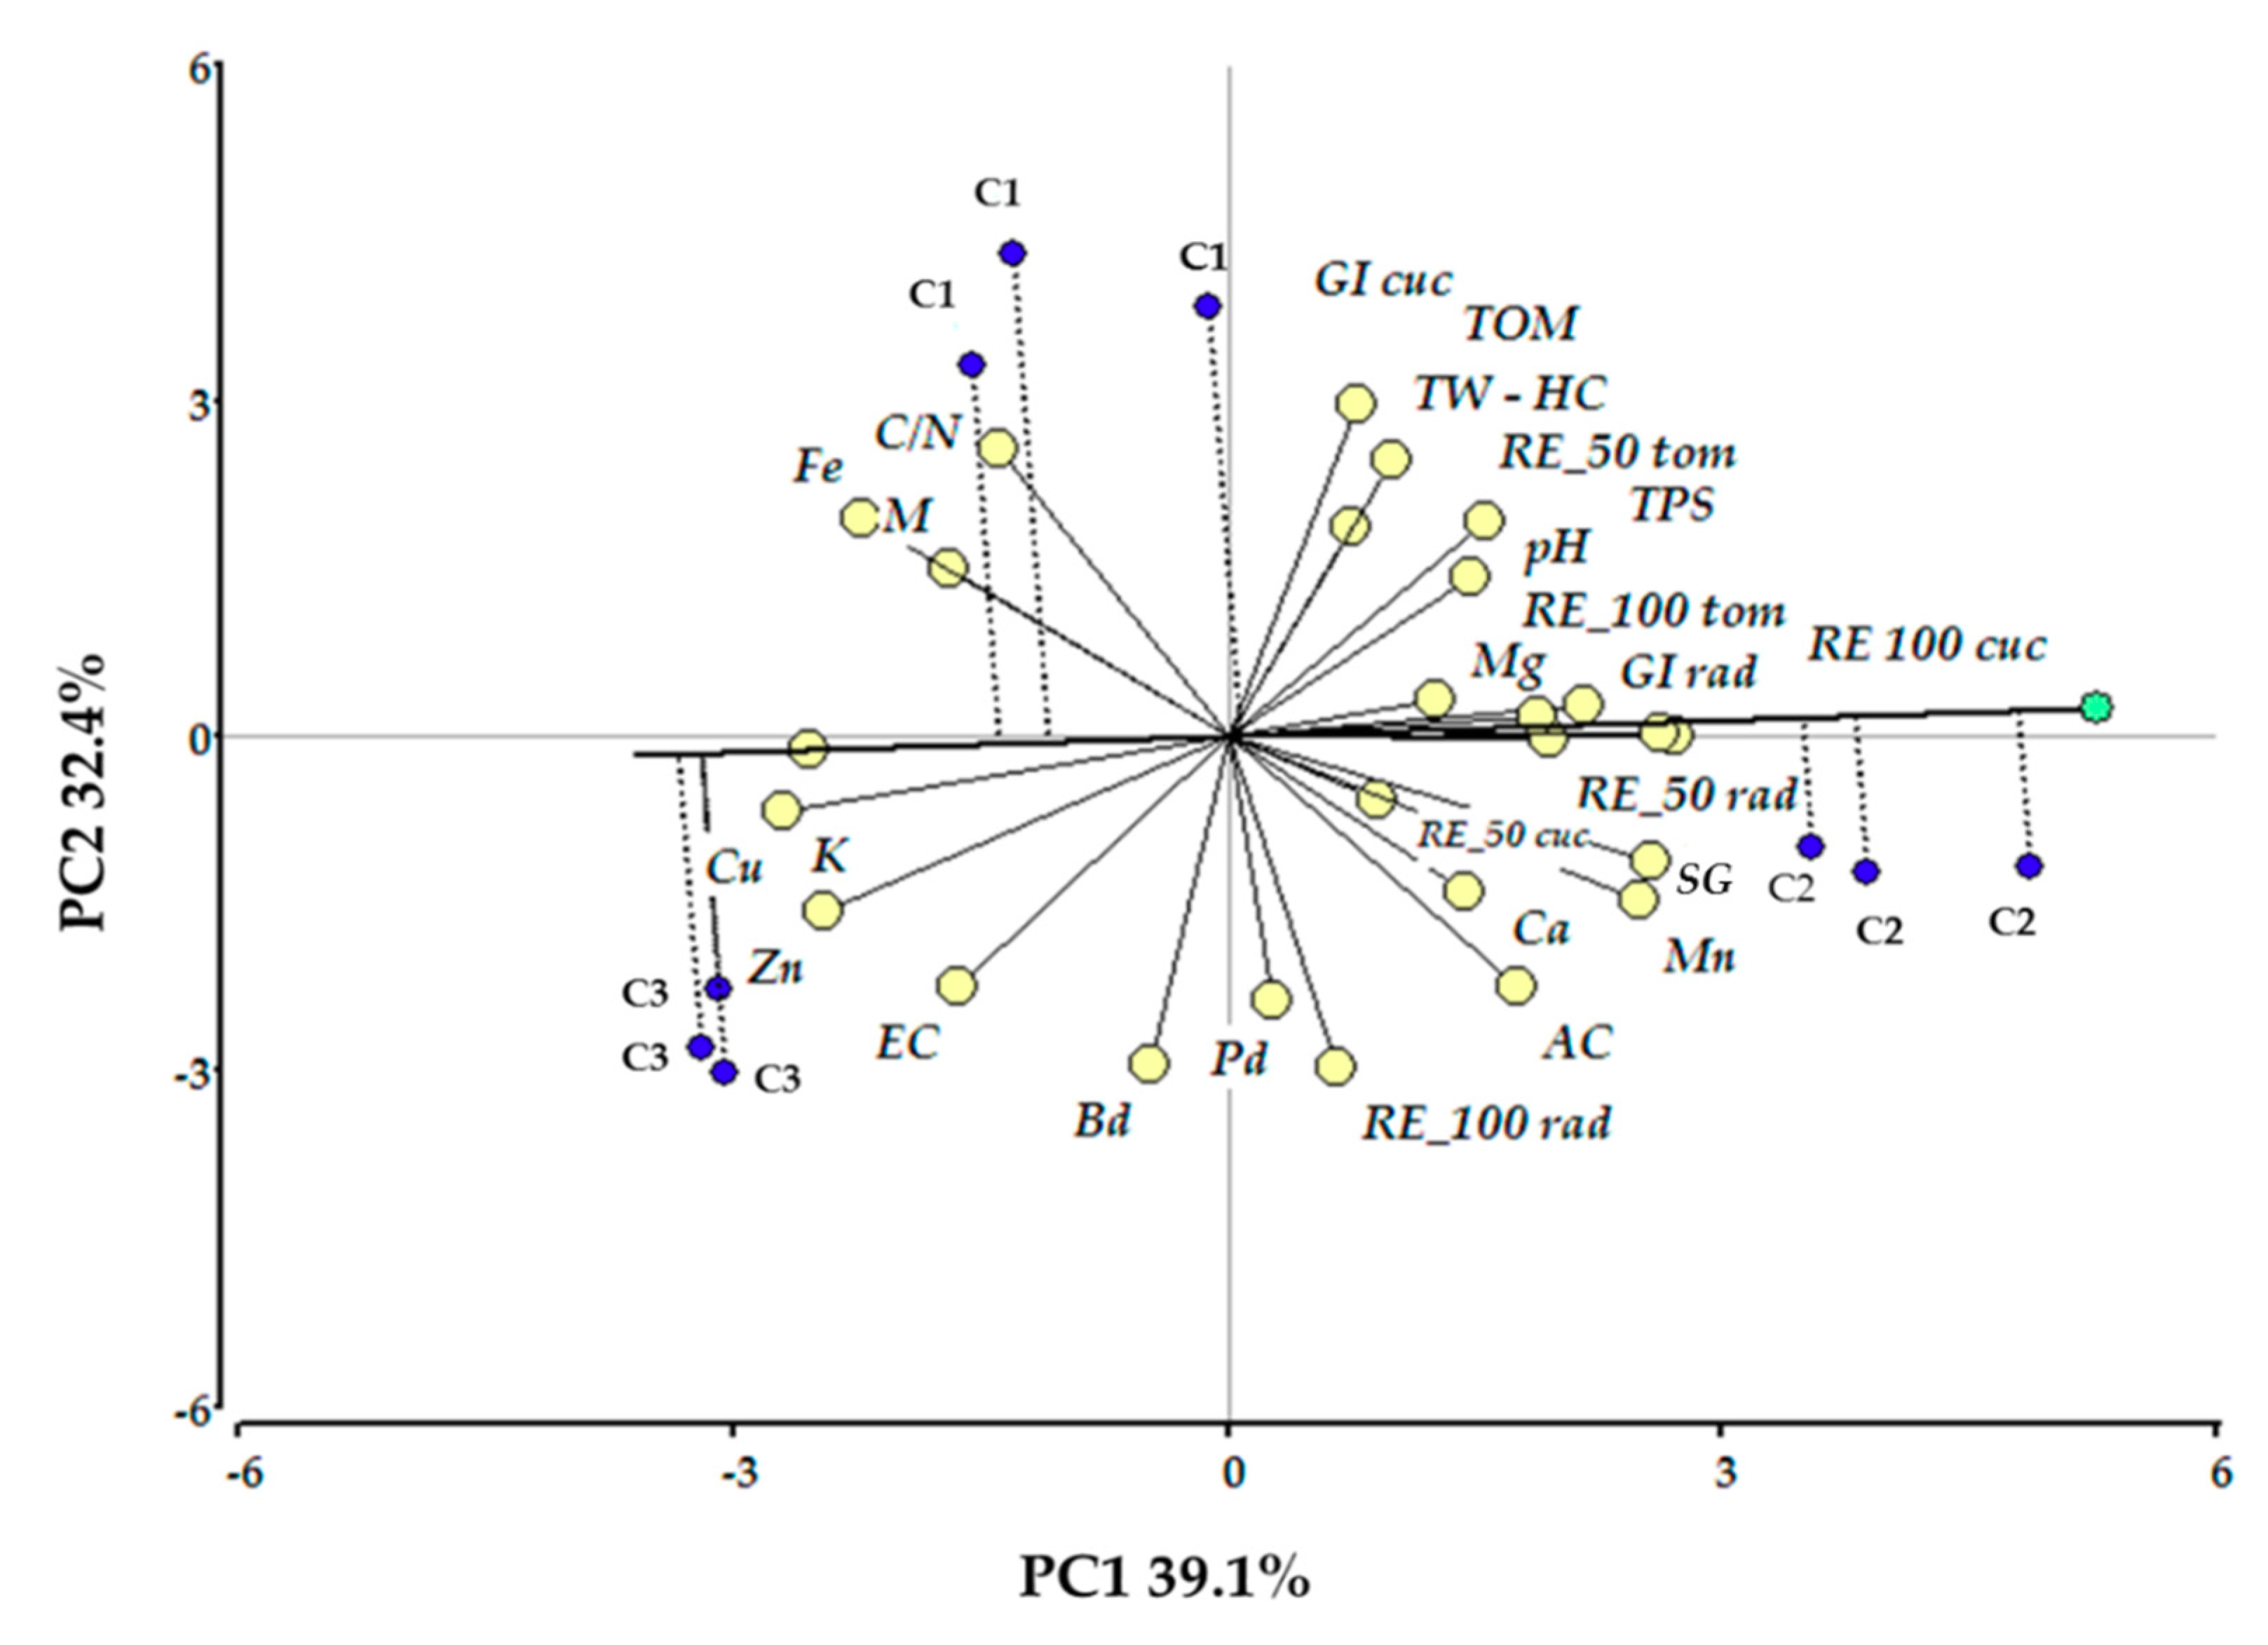
The PCA correlation reveals high correlation between some variables and the two selected components (Table 3). The variability seems to reliably represent the relationships between the compost mixtures and the variables TN, TOM, RE100rad, Bd, C/N, RE100cuc, EG, Mn, GIrad, Fe, Zn, Cu, K EC, M% and EC.
PCA was applied to identify tendencies between the analysed variables and their relationship with the expression of biological indicators, in order to define a small set of variables to separate the groups according to their quality. This is especially important in our environment, given the limited availability of supplies and time. The components are orthogonal—that is to say, they are not correlated, which means that each one can be analysed independently from the other. According to the resulting biplot, generated via the correlation matrix, of the two components, CP1 and CP2, accounting for 72.4% of variability, CP1 is the most important, with TN, RE100cuc, EG, Mn, RE100rad, Cu, Zn, Fe and K representing 39.1% of the total variability. For its part, CP2 is responsible for 32.4%, with GIcuc, TOM, RE100rad Bd, C/N and EC ranking as the most notable.
As with CP1, the highest and lowest values are observed when a point projected from the variables or the cases on the component axes is closest to or furthest from zero. The biplot shows both the cases and the variables in the same space (Figure 5). When cases are projected perpendicularly on PC1, three contrasting situations are shown: C1 and C3, located on the negative side of the PC1 component. At the same time, C1 is on the positive side of the component PC2 with low EC. In contrast, C3 in the negative quadrant of both components with high values of Zn, Cu, K, Bd in addition to the highest EC and the lowest values for RE100cuc, GIcuc, GIrad and TW-HC.
When applying the analysis and selecting those with correlations greater than 0.70 / −0.70, the result was that PC1 (39.1%) concentrated the variables: biological RE 100 cuc and GI rad associated positively with TN, EG, Mn, and negatively with concentration of Fe, Cu, K and Zn. In PC2 (32.4%), two biological variables also stand out: RE100rad and GI cuc positively associated with TW-HC, TOM, C/N, and negatively with CD, BD and AC. As can be seen, groups of variables are outlined. When comparing these results with the work of Siles-Castellano et al. [41] and Bustamante et al. [4], in which the compost of agroindustrial residues is also analyzed, it is observed that the biological response (GI) of utmost importance for the achievement of a quality compost, was negatively correlated with EC and heavy metals. Notable also in the case of physical variables.

3.3.2. Evaluation of the Biological Response to Measured Parameters of the Composted Mixtures

To identify the most influential biological response of the evaluated composted mixtures (C1, C2 and C3), Spearman’s rank correlation was applied to the variables measured for in vitro and tray tests at the end of the process (week 18). The results are shown in Table 4. The absolute values show the hierarchy for the in vitro test: TOM > Bd > EC > TPS; and for the tray test: cucumber Zn > Cu > TN > K, radish Bd > Mn = TOM > AC and tomato EC.

4. Discussion

4.1. Evolution of Temperature and Moisture

The temperature of the heaps evolved in an appropriate manner in each phase, without generating leachates or disagreeable odors. This is conducive to appropriate microbial activity and is in equilibrium with the moisture, aeration, and composition of the mixture [14,40,42]. The evolution of temperature indicates intense degradation activity caused by the microbiota in the mixtures. Easily altered compounds, such as fatty starches and sugars, are the main substrates, especially during the second and third phase. The described dynamic is explained by the Arrhenius equation, which provides the maximum, minimum, and optimal compost temperature for microbial growth [35,43]. The moisture content remains constant close to 60% but showed a mismatch at the beginning of the process in C3 (Figure 3). The average moisture was 40% until the sixth week. In this particular case, the C/N ratio was 93% in C3, with respect to value 30. Values of C1 and C2 were 21.5% and 28%, respectively. Therefore, for models that predict temperature during composting, the state variables of greatest interest are temperature, moisture content, and oxygen concentration. The possible differences in decomposition rate are due to both multiple material degradability coefficients and the wait time that is needed for proliferation of the microbial populations involved. In our study, the temperature in the piles was adapted to sanitation, except for the case of C3, which had no days of temperatures about 65 °C.

4.2. Characteristics of the Final Products

The evolution of the parameters during the composting process of the three mixtures C1, C2 and C3, adjusted in a ratio of C/N near 30% and humidity at 60% revealed an evolution in accordance with that described by various authors [8,24,36,44]. The pH, which was acid; 5.53, 5.2 and 5.87, to neutral; 7.87, 7.88 and 7.73 for C1, C2 and C3, is indicative of good aeration and humidity [7]. Of the three mixtures evaluated, C1 and C2 show higher values, with a principally biological effect. C1, whose primary constituent material was fruit residues, contained the least quantity of chicken manure (12% w/w as opposed to 22% in C2 and C3), and exhibited better biological behaviour in terms of maturity. A higher Cu and Zn content was associated with the negative effect, inhibiting root elongation in cucumber as well as wheat and rice [45].
The proportion of chicken manure used to equilibrate the C/N ratio at the outset contributed an equal statistical content to the three mixtures (Figure 4). However, although increases also were evident at the end of the process (p < 0.05), C2 showed a greater value than those of C1 and C3.
This higher value of TN in C2 was positively correlated (value = 0.87, Table 4) with the RE100 of cucumber, radish and tomato. That, linked to a lower EC and higher EG (Figure 4), indicates that it behaves well as a substrate for cucumber and radish. On the other hand, C3 was immature and incapable of being used as a substrate. In the three mixtures, the EC exceeded the value 1.5 dS m-1, indicated as limit value for use of compost as a substrate [42]. Interpreting the correlations of Table 4, it can be seen that higher EC at the end of the process together with the higher Cu, Zn [41,46], lower Bd and TPS (Table 2) contributed to its inferior profile.
A substrate consisting of 50% peat and 50% compost demonstrated slightly higher performance than a 100% peat substrate. However, pure compost (C2 and C3) was unfavourable for the use as substrate, likely due to its low total porosity. Results were improved upon mixing with peat, which resulted in improved aeration and reduced possible phytotoxicity. Therefore, if some of the physical and chemical properties of a material are not optimal, it is still possible to use it as a substrate when mixed with another material, which has complementary characteristics. These results affirm that the substrate consisting of 50% peat and 50% compost is the most recommended for seedling growth; the values variables associated with quality are similar to that of 100%, but the inclusion of compost reduces costs.

4.3. Compost Quality Proposal

Compost quality is measured as the sum of desirable attributes that are definitively expressed in the indicator species, which, in our study, are the cucumber and radish. Constituent variables for the proposed quality were selected using (i) statistical weight in explaining variability (eigenvector value); (ii) correlations with other variables (positive or negative); and (iii) ease and simplicity of measurement [3]. They were filtered (substracting the least representative elements) and corroborated using Spearman’s (rank) correlation.
It is evident from the interpretation of the Spearman’s rank correlation results that the GI provided by C1 was manifested by lower EC and Bd together with a higher TOM. For its part, C2 induced a greater cucumber RE thanks to its higher TN content but lower Cu, Zn and K content.
Lastly, in C3, a higher presence of salts, poorer physical characteristics (>Bd and <TPS) and higher content of Zn and Cu, are combined.
The critical variables already identified due to their effect on biological response can be taken into account for future studies in the search for a Quality Index.

5. Conclusions

To study the importance of adjusting a ratio of C/N = 30 and humidity approaching 60% during the composting process, the consignment parameters of three mixtures were composted for 107 days. The adjustment was of great importance in the evaluation of the dynamic and resulting products. The adjustment to the C/N and humidity ratio recommended to initiate the composting process is reflected in the temperature evolution and the speed of degradation of the organic material optimal for the sanitation and stabilization of the final product in the evaluated time period (107 days). Physical, chemical and biological parameters of the mixtures evaluated demonstrate there will already be useful substrate products for agriculture generated in the cases of C1 and C2 or as an edaphic amendment in C3 substrate. Beyond individual comparisons between the resulting values, the multivariant tool applied completed its task of offering quality classes useful for the classification of compostable material in a context of limited resources.

Author Contributions

H.P. and H.M. conceived, designed the experiments, and analysed the data; F.D. and M.S. revised the manuscript. All authors have read and agreed to the published version of the manuscript.

Funding

This research received no external funding.

Conflicts of Interest

The authors declare no conflict of interest.

References

  1. Sztern, D.; Pravia, M. Manual Para la Elaboracion de Compost Bases Conceptuales y Procedimientos; Organizacion Panamericana de la Salud: Washington, DC, USA, 1999; p. 69. [Google Scholar]
  2. Peña, H.P.; Arias, K.; Santos, M.; Ramírez, B.; Sulbarán, J. Evaluación de la calidad química, física y biológica de tres compost producidos a partir de residuos agroindustriales. Rev. Cient. UNET 2018, 32, 11. [Google Scholar]
  3. Campitelli, P.; Ceppi, S. Chemical, physical and biological compost and vermicompost characterization: A chemometric study. Chemom. Intell. Lab. 2008, 90, 64–71. [Google Scholar] [CrossRef]
  4. Bustamante, M.; Suárez-Estrella, F.; Torrecillas, C.; Paredes, C.; Moral, R.; Moreno, J. Use of chemometrics in the chemical and microbiological characterization of composts from agroindustrial wastes. Bioresour. Technol. 2010, 101, 4068–4074. [Google Scholar] [CrossRef] [PubMed]
  5. Cabeza, M.; Ormeño, M.; Muñoz, L. Generación de propuesta para la estandarización y normalización de la producción y utilización de enmiendas y abonos orgánicos en Venezuela. In Taller de Abonos Orgánicos y Enmiendas; CIDIAT: Mérida, Venezuela, 2012. [Google Scholar]
  6. Haug, R. The Practical Handbook of Compost Engineering, 1st ed.; CRC Press: Boca Raton, FL, USA, 1993; ISBN 978-0-203-73623-4. [Google Scholar]
  7. Bueno, P.; Diaz, M.; Cabrera, F. Factores que afectan el proceso de compostaje. In Compostaje; Casco, J.M., Herrero, R.M., Eds.; Mundi-Prensa: Madrid, Spain, 2008; p. 570. [Google Scholar]
  8. Day, M.; Shaw, K. Biological, chemical and physical processes of composting. In Compost Utilization in Horticultural Cropping Systems; Informa UK Limited: London, UK, 2001; p. 414. [Google Scholar]
  9. Miyatake, F.; Iwabuchi, K. Effect of compost temperature on oxygen uptake rate, specific growth rate and enzymatic activity of microorganisms in dairy cattle manure. Bioresour. Technol. 2006, 97, 961–965. [Google Scholar] [CrossRef]
  10. Liang, C.; Das, K.C.; McClendon, R.W. The influence of temperature and moisture contents regimes on the aerobic microbial activity of a biosolids composting blend. Bioresour. Technol. 2003, 86, 131–137. [Google Scholar] [CrossRef]
  11. Tognetti, C.; Laos, F.; Mazzarino, M.J.; Hernandez, M.T. Composting vs. vermicomposting: A comparison of end product quality. Compos. Sci. Util. 2005, 13, 6–13. [Google Scholar] [CrossRef]
  12. Desalegn, G.; Binner, E.; Lechner, P. Humification and Degradability Evaluation During Composting of Horse Manure and Biowaste. Compos. Sci. Util. 2008, 16, 90–98. [Google Scholar] [CrossRef]
  13. Tognetti, C.; Mazzarino, M.J.; Laos, F. Improving the quality of municipal organic waste compost. Bioresour. Technol. 2007, 98, 1067–1076. [Google Scholar] [CrossRef]
  14. Campitelli, P. Calidad de Compost y Vermicompuestos para su Uso como Enmiendas Orgánicas en Suelos Agrícolas. Ph.D. Thesis, Universidad Nacional de Córdoba, Córdoba, Argentina, 2010. [Google Scholar]
  15. Thompson, W.H. Biological assays. In Test Methods for the Examination of Composting and Compost; Thompson, W.H., Ed.; U.S. Composting Council: Raleigh, NC, USA, 2001; pp. 1177–1183. [Google Scholar]
  16. Zucconi, F.; Pera, A.; Forte, M. Evaluating toxicity of immature compost. BioCycle 1981, 22, 54–57. [Google Scholar]
  17. Emino, E.R.; Warman, P.R. Biological assay for compost quality. Compos. Sci. Util. 2004, 12, 342–348. [Google Scholar] [CrossRef]
  18. Iglesias, E.; Barral, M.; Marhuenda-Egea, F. Indicadores de la estabilidad y madurez del compost. In Compostaje; Casco, J.M., Herrero, R.M., Eds.; Mundi-Prensa: Madrid, Spain, 2008; pp. 244–283. [Google Scholar]
  19. Jagadabhi, P.S.; Wani, S.P.; Kaushal, M.; Patil, M.; Vemula, A.K.; Rathore, A. Physico-chemical, microbial and phytotoxicity evaluation of composts from sorghum, finger millet and soybean straws. Int. J. Recycl. Org. Waste Agric. 2019, 8, 279–293. [Google Scholar] [CrossRef] [Green Version]
  20. MARNR Ministerio del ambiente y los recursos renovables. Atlas Del Estado Táchira Zona 6; San Cristóbal Cartografía Nacional: Caracas, Venezuela, 1986. [Google Scholar]
  21. TMECC. Nitrogen. Method 04.02. In Test. Methods for the Examination of Composting and Compost; Thompson, W., Ed.; The Composting Council Research and Education Foundation: Bethesda, MD, USA, 2002; p. 04.02-01. [Google Scholar]
  22. Sadzawka, A.; Carrasco, M.A.; Grez, R.; Mora, M.M. Métodos de Análisis de Compost; Instituto de Investigaciones Agropecuarias: Santiago, Chile, 2005; ISBN 0717-4810. [Google Scholar]
  23. Pire, R.; Pereira, A. Propiedades físicas de componentes de sustratos de uso común en la horticultura del estado lara, venezuela. Propuesta metodológica. Bioagro 2003, 15, 55–64. [Google Scholar]
  24. Richards, T. Compost Mixture Calculation Spreadsheets; Cornell Composting Science & Engineering: Ithaca, NY, USA, 2014; Available online: http://compost.css.cornell.edu/download.html (accessed on 6 October 2020).
  25. TMECCa. Field sampling of compost materials. In Test Methods for the Examination of Composting and Compost; Thompson, W., Ed.; The Composting Council Research and Education Foundation and Agriculture: Bethesda, MD, USA, 2002; p. 26. [Google Scholar]
  26. Zucconi, F.; Monaco, A.; Forte, M.; De Bertoldi, M. Phytotoxins during the stabilizatión of organic matter. In Composting of Agricultural and Other Wastes; Gasser, J., Ed.; Elsevier Applied Science Publishers: Essex, London, UK, 1984; p. 336. ISBN 0-85334-357-8. [Google Scholar]
  27. McKean, S. Manual de Análisis de Suelos y Tejido Vegetal. Una Guia Teórica y Práctica de Metodologias; Centro Internacional de Agricultura Tropical: Cali, Colombia, 1993. [Google Scholar]
  28. Sadzawka, R.A. Requisitos Analíticos del Compost y de las Materias Primas para Compostaje Según la Norma Chilena NCh 2880; Instituto de Investigaciones Agropecuarias: Santiago, Chile, 2004; p. 27. [Google Scholar]
  29. He, Z.; Yang, X.; Kahn, B.; Stoffella, P.; Calvert, D. Plant Nutrition Benefits of Phosphorus, Potassium, Calcium, Magnesium, and Micronutrients from Compost Utilization. In Compost Utilization in Horticultural Cropping Systems; Stofella, P.J., Khan, B.A., Eds.; CRC Press: Boca Raton, FL, USA, 2001; p. 431. ISBN 1-56670-460-X. [Google Scholar]
  30. Abad, M.; Noguera, P.; Burés, S. National inventory of organic wastes for use as growing media for ornamental potted plant production: Case study in Spain. Bioresour. Technol. 2001, 77, 197–200. [Google Scholar] [CrossRef]
  31. López, M.; Huerta-Pujol, O.; Martínez-Farré, F.X. Resources, Conservation and Recycling Approaching compost stability from Klason lignin modified method: Chemical stability degree for OM and N quality assessment. Resour. Conserv. Recy. 2010, 55, 171–181. [Google Scholar] [CrossRef]
  32. Soliva, M.; López, M. Calidad del Compost: Influencia del Tipo de Material Tratado y de las Condiciones del Proces; Escuela Superior de Agricultura: Barcelona, Spain, 2004; Available online: https://ruralcat.gencat.cat/documents/20181/81510/Altres3_Calidad+del+compost_+influencia+del+tipo+de+material+tratado+y+delas+condiciones+del+procesopdf/80b5b931-0521-426b-a733-6be0ac2d3a68 (accessed on 6 October 2020).
  33. Bundesgütegemeinschaft Kompost. Merkblatt zum RAL-Prüfzeugnis Kompost RAL-GZ 251. 2010, pp. 8–11. Available online: https://www.kompost.de/fileadmin/docs/guetesicherung/Merkblatt_Kompost.pdf (accessed on 6 October 2020).
  34. Rienzo, J.A.D. Análisis de Regresión; Facultad de Ciencias Agropecuarias: Córdoba, Argentina, 2011; Available online: http://sites.google.com/site/dirienzojulio (accessed on 6 October 2020).
  35. Nielsen, H.; Berthelsen, L. A Model for Temperature Dependency of Thermophilic Composting Process Rate. Compost Sci. Util. 2013, 10, 249–257. [Google Scholar] [CrossRef]
  36. Moreno, J.; Mormeneo, B. Microbiología y Bioquímica del proceso de compostaje. In Compostaje; Casco, J.M., Herrero, R.M., Eds.; Mundi-Prensa: Madrid, Spain, 2008; pp. 111–140. [Google Scholar]
  37. Sánchez, M.A.; Roig, A.; Paredes, C.; Bernal, M. Nitrogen transformation during organic waste composting by the Rutgers system and its efects on pH, EC and maturity of the composting mixtures. Bioresour. Technol. 2001, 78, 301–308. [Google Scholar] [CrossRef]
  38. Lewis, N.G.; Yamamoto, E. Lignin: Occurrence, biogenesis and biodegradation. Annu. Rev. Plant. Physiol. Plant. Mol. Biol. 1990, 41, 455–496. [Google Scholar] [CrossRef]
  39. Acosta, Y.; Zauahre, M.E.; Rodríguez, L. Indicadores de calidad bioquímica y estabilidad de la materia orgánica durante el proceso de compostaje de residuos orgánicos. Univ. Zulia Venez. 2012, 12, 10. [Google Scholar]
  40. Balzarini, M.; Bruno, C.; Córdoba, M.; Teich, I. Herramientas en el Análisis Estadístico Multivariado; Escuela Virtual Internacional CAVILA, Facultad de Ciencias Agropecuarias, Universidad Nacional de Córdoba: Córdoba, Argentina, 2015; Available online: https://www.researchgate.net/publication/286931204 (accessed on 6 October 2020).
  41. Siles-Castellano, A.B.; López, M.J.; López-González, J.A.; Suárez-Estrella, F.; Jurado, M.M.; Estrella-González, M.J.; Moreno, J. Comparative analysis of phytotoxicity and compost quality in industrial composting facilities processing different organic wastes. J. Clean. Prod. 2020, 252, 119820. [Google Scholar] [CrossRef]
  42. Masaguer, A.; Benito, M. Evaluación de la calidad del compost. In Compostaje; Casco, J.M., Herrero, R.M., Eds.; Mundi-Prensa: Madrid, Spain, 2008; pp. 285–304. [Google Scholar]
  43. Defrieri, R.L.; Jimenez, M.P.; Effron, D.; Palma, M. Utilización de parámetros químicos y microbiológicos como criterios de madurez durante el proceso de compostaje. AgriScientia 2005, 22. [Google Scholar] [CrossRef]
  44. Gao, Y.; Yu, H.; Liu, P.; Ma, C.; Li, Q.; Jiang, W. Ending composting during the thermophilic phase improves cultivation substrate properties and increasing winter cucumber yield. Waste Manag. 2018, 79, 260–272. [Google Scholar] [CrossRef] [PubMed]
  45. Pal, R.; Bhattacharyya, P. Effect of municipal solid waste compost on seed germination of rice, wheat and cucumber. Arch. Agron. Soil Sci. 2003, 49, 407–414. [Google Scholar] [CrossRef]
  46. Miao-miao, H.E.; Guang-ming, T.; Xing-qiang, L.; Yi-tong, Y.U. Effects of two sludge application on fractionation and phytotoxicity of zinc and copper in soil. J. Environ. Sci. 2007, 19, 1482–1490. [Google Scholar]
Publisher’s Note: MDPI stays neutral with regard to jurisdictional claims in published maps and institutional affiliations.
Figure 1. Measurement of daily temperature in piles C1, C2, and C3 (each point is the average measurement of the three repetitions). The arrows indicate when the piles were turned. A: mesophilic phase, up to day 11, with homogenous temperatures between the 3 mixtures (p < 0.0001); B: thermophilic phase, corresponding to days 12–29, with temperatures over 45 °C, and with decreasing temperatures as follows: C1 > C3 > C2 (p < 0.0001); C: second mesophilic phase, with decreasing temperatures as follows: C2 > C3 > C1; D: mesophilic or cooling phase, with speed of cooling as follows: C2 > C3 > C1 (p < 0.0001); E: stabilization phase, with temperatures close to room temperature C2 and C3 > C1 (p < 0.0001).
Agronomy 10 01567 g001
Figure 2. Predicted values for TOM% in C2 over 18 weeks showed a linear fit of TOM% = α × exp (β × week), where: α = 57. 84 and β = −0.02 (p < 0.0001); AIC = 89.81.45; BIC = 92.49; σ = 2.83. Note: TOM = total organic matter.
Agronomy 10 01567 g002
Figure 3. Box graphic of parameters’ evolution in compost: C1, C2 and C3 throughout 18 weeks. M%: moisture (a); pH (b); Bd: t·m−3 (c) and EC: dS m−1 (d).
Agronomy 10 01567 g003
Figure 4. Initial and final values of TN (a), C/N (b), TOM (c), pH (d), EC (e) and SG (f). Values are the average of three replications. Different letters indicate significant differences according to the one-way ANOVA test (p < 0.05). TN: total nitrogen; C/N: carbon nitrogen ratio; TOM: total organic matter; EC: electrical conductivity; SG: stability grade.
Agronomy 10 01567 g004
Figure 5. Principal component analysis (PCA) of C1, C2 and C3 corresponding to the 18 weeks.
Agronomy 10 01567 g005
Table 1. Characteristics and proportion of materials used to achieve desirable attributes in the compostable mixture.
Material
CharacteristicFruit WasteSludgeDebrisRice HullsSawdustDairy ManureFSC
Bd (kg m−3)0.80.90.80.10.10.30.4
M (%)80.377.075.12.054.15.052.3
TOC (%)55.248.357.246.556.432.612.2
TN (%)1.91.80.90.40.73.70.5
TreatmentAmount (kg) Total
(kg)
C/N *M *
(%)
C12600 40040400340036.551.8
C2 2500 800 1001000440038.457.0
C3 2900 6001501000465059.053.8
Bd: Bulk density; M: Moisture; C/N: carbon/nitrogen ratio; TN: total nitrogen; TOC: total organic carbon; Sludge: potato-processing sludge; Debris: potato-corn processing debris; FSC: filter cake sugar cane. * M and C/N corrected values after laboratory analysis performed at the end of the first week.
Table 2. Initial and final means of the analysis of variables measured in the mixtures: C1, C2 and C3 obtain of ANOVA and Bonferroni tests.
Initial Final
VariableReference
Values
C1C2C3C1C2C3
SG% *>5023.42 a22.75 a26.46 a54.09 a66.55 a54.91 a
TN% *>0.50.58 b0.55 ab0.5 a1.00 ab1.26 b0.91 a
C/N [28]<2536.45 a38.42 a59.03 b24.48 b16.40 a18.7 a
pH [28]5–8.55.53 ab5.2 a5.87 b7.87 a7.88 a7.73 a
EC dSm−1 [28]≤3a ≤ 8b3.32 a4.22 a3.61 a2.86 a2.99 a3.70 b
TOM % [28]>2060.04 b56.82 a66.74 c42.0 c35.56 b29.11 a
M (%) [28]50–6051.75 a46.04 a53.84 a56.09 b52.79 a54.9 ab
GI rad% [16]>50 49.40 a60.60 a41.43 a
GI cuc% * [16]>50 90.23 a65.20 ab40.27 b
RE 100 rad% [16]>50 75.90 a103.50 a67.87 a
RE 50 cuc [16]>50 112.5 a128.50 a115.40 a
RE 100 cuc [16]>50 75.03 a135.70 b46.20 a
RE 50 tom [16]>50 78.60 a85.70 a72.43 a
RE 100 tom [16]>50 78.60 a64.30 a37.93 a
TPS% v/v [29]≥8554.91 b43.73 a48.01 a47.95 a46.31 a38.46 a
AC% v/v [29]20–3029.68 b23.09 a18.51 a12.27 a15.85 b14.29 b
TW-HC% v/v [29]55–7025.23 b20.64 a29.5 b35.68 a30.46 ab24.17 a
Bd * t m−3 [29]0.2–0.40.31 a0.35 a0.35 a0.24 a0.21 a0.28 a
Pd t m−3 [29]1.4–2.00.76 b0.57 a0.78 b0.55 a0.7 a0.73 a
Ca % [29]>11.2139.94 a43.82 a41.59 a51.34 a56.52 b52.23 a
Mg % [29]>1.461.62 a1.81 a1.51 a2.03 a2.67 b2.70 b
K% [29]>5.065.90 ab5.2 a6.23 b8.08 a7.55 a11.16 b
Fe * mg kg−1 [30]<930013100 b6000 a10400 ab17900 b11200 a13500 ab
Mn * mg kg−1 [30]431–600127.33 a224.83 a147.00 ab226.83 a273.17 ab303.83 b
Cu mg kg−1 [30]<10041.00 b30.33 a50.67 c62.00 b48.50 a68.83 c
Zn * mg kg−1 [30]<20076.17 ab52.00 a151.00 b160.17 a170.67 ab247.83 b
* SG, TN, Zn, Fe, Mn, Bd with Kruskal wallis test. Averages marked with different letters differ from each other at p < 0.05. Each average is the average of three repetitions. SG: stability grade; TN: total nitrogen; RE: Relative emergency; cuc: cucumber; rad: radish; tom: tomato; C/N: carbon nitrogen ratio; TOM: total organic matter; EC: electrical conductivity; AC: air capacity; TW-HC: total water-holding capacity; TPS: total pore space; GI: germination index; Bd: Bulk density; Pd: particle density.
Table 3. Correlations with the original variables of the PCA components.
VariablesPrincipal Component 1Principal Component 2
TN0.95−0.002
RE 100 cuc0.920.01
SG0.89−0.35
Mn0.87−0.47
GI rad0.750.08
Fe−0.770.61
Zn−0.85−0.5
K−0.89−0.04
Cu−0.94−0.21
TW-HC0.350.78
GI cuc0.280.94
TOM0.270.94
RE_100 rad0.23−0.94
Bd−0.16−0.93
AC0.61−0.71
C/N−0.480.81
EC−0.57−0.71
TN: total nitrogen; RE: relative emergency; cuc: cucumber; rad: radish; SG: stability grade; GI: germination index; TW-HC: total water-holding capacity; TOM: total organic matter; TPS: total pore space. Bd: bulk density; AC: air capacity; C/N; carbon nitrogen ratio; EC: electrical conductivity.
Table 4. Spearman’s correlation analysis between biological variables and physical–chemical parameters of the finished process (n = 9).
Variable (1)Variable (2)Spearmanp-Value
GI cucTPS0.750.0339
GI cucBd−0.880.0017
GI cucTOM0.900.0109
GI cucEC−0.780.0122
RE 100 cucTN0.870.0025
RE 100 cucK−0.740.0214
RE 100 cucCu−0.930.0003
RE 100 cucZn−0.950.0001
RE_50 radK−0.690.0399
RE_100 radAC0.810.0081
RE_100 radBd0.860.0028
RE_100 radTOM−0.840.0049
RE_100 radC/N−0.780.0138
RE_100 radMn0.840.0046
GI: germination index. RE: relative emergency; cuc: cucumber; rad: radish.