Article

Fertigation Management and Growth-Promoting Treatments Affect Tomato Transplant Production and Plant Growth after Transplant

by
Alessandra Moncada
,
Filippo Vetrano
*,
Alessandro Esposito
and
Alessandro Miceli
*
Dipartimento Scienze Agrarie, Alimentari e Forestali, Università di Palermo, Viale delle Scienze 4, 90128 Palermo, Italy
*
Authors to whom correspondence should be addressed.
Agronomy 2020, 10(10), 1504; https://doi.org/10.3390/agronomy10101504
Submission received: 18 August 2020 / Revised: 27 September 2020 / Accepted: 28 September 2020 / Published: 3 October 2020
(This article belongs to the Special Issue Nitrogen Fertilization in Vegetable Crops)

Abstract

:
Plant biostimulants are of interest as they can stimulate plant growth and increase resource utilization. There is still no information on the use of plant growth-promoters under variable nutritional conditions in the nursery and the effects on tomato seedling growth and plant performance after transplant. This study aimed to evaluate the suitability of gibberellic acid (GA3) or bacterial biostimulant treatments to enhance the growth and quality of greenhouse-grown tomato (Solanum lycopersicum ‘Marmande’) seedlings, fertigated with increasing nutrient rates and to assess the efficacy of these treatments on the early growth of tomato plants. During autumn 2019, tomato seedlings were inoculated with 1.5 g L−1 of TNC BactorrS13 (a commercial biostimulant containing 1.3 × 10⁸ CFU g−1 of Bacillus spp.) or sprayed with 10−5 M GA3 and fertigated with a nutrient solution containing 0, 1, 2 and 4 g L−1 of NPK fertilizer (20-20-20) when they reached the 11th BBCH growth stage for tomato. Subsequently, the seedlings were evaluated in greenhouse cultivation for 60 days until at least the 61st BBCH growth stage (January 2020). The growth of the tomato seedlings increased curvilinearly in relation to the fertigation rates. The GA3-treated seedlings showed similar or even higher growth parameters than the control seedlings fed with 4 g L−1 of fertilizer but with half of the nutrients. The inoculation of the substrate with Bacillus spp. had negative effects in the absence of fertigation but determined a greater growth at the highest fertigation rate. The bacterial inoculum of seedlings had longer-term effects than the GA3 treatment during the plant growth, but these effects were noticeable mainly when the bacterial biostimulant was associated with the highest fertigation rate.

1. Introduction

Container-grown vegetables are an important agricultural commodity and the seedling nursery production is a sector in constant evolution mainly thanks to the introduction of new technologies, techniques, and cultivars. The primary objective of transplant producers is to obtain high-quality seedlings in a short time. Moreover, the growth and productivity of vegetable crops are closely linked to the cultivation techniques adopted in the nursery during the early stages of seedling growth [1,2,3,4,5]. Vegetable transplant production is intensive, usually involving daily applications of water and high concentrations of fertilizers (especially nitrogen) [6]. This affects economic, but also environmental aspects: the potential for nitrogen pollution from water runoff and leaching losses in nurseries is great because of the combined effects of the limited volume of the substrate in the containers and the need for frequent watering and fertilizing. Moreover, incorrect fertilization management can negatively influence seedling growth resulting in weaker transplants that underperform in the field [7]. These issues can be managed and partially solved by applying drainage systems (for the capture and reuse of runoff), by liquid feeding through drip irrigation or sub-irrigation systems (for reducing leaching), or by supplying encapsulated, controlled-release fertilizers [6]. On the other hand, it is possible to adopt other strategies that aim at improving the water and nutrient use efficiency of the seedlings to reduce the consumption of these resources in the production system, thus limiting environmental problems and increasing nursery industry sustainability. These goals might be reached by using growth-promoting microorganisms and plant growth regulators [8,9,10,11,12]. Plant growth regulators (PGRs), such as auxins, gibberellins, or cytokinins, could have beneficial effects on the growth, development, yield, and quality of vegetable crops [8]. Natural and synthetic PGRs are used in vegetable crops to modify plants by controlling plant developmental processes and increasing tolerance to abiotic stress [11,13,14]. Among these, gibberellins (GAs) are essential endogenous growth regulators found in plants and fungi and produced by plant growth-promoting rhizobacteria, which control plant development by regulating several physiological mechanisms [15]. The plant growth-promoting effects of gibberellins have been used in several crops and could offer advantages in improving vegetable transplant production by stimulating seed germination, root elongation, leaf expansion, biomass accumulation, and influencing overall plant growth [16,17,18,19,20]. The synthetic gibberellins like gibberellic acid (GA3) are cost-effective and easy to use, even if their effects can vary greatly depending on the growth regulator requirement, relative concentrations, and plant responses at different growth stages [9,10,21]. Nevertheless, the increasing environmental and ecological awareness has led to the search for sustainable and efficient cultivation systems with the limited use of synthetic products such as plant growth regulators and other chemicals [18]. In this regard, the use of plant biostimulants has been increasing in recent years [22,23]. Biostimulants can promote plant growth, improve the uptake of nutrients, and increase tolerance to abiotic stresses [24,25]. They are substances of natural origin or microorganisms which improve the condition of crops without causing adverse side effects [26]. Microorganisms include several strains of beneficial bacteria naturally occurring in the soil that colonize the rhizosphere and may grow in, on or around plant roots. They are also called plant growth-promoting rhizobacteria (PGPR) and are well known to synthesize plant growth regulators such as indole acetic acid, gibberellins, and cytokinins which promote plant growth at various stages [26,27]. The growth-promoting mechanisms also include the release of volatile organic compounds, the increase in nutrient availability, and the enhancement of tolerance to biotic and abiotic stresses [28,29]. Lots of studies have demonstrated that inoculation with Bacillus strains may promote seedling germination, growth, health, yield and nutrient uptake [30,31]. Some authors have also focused on their applications in transplant production [30,32,33], but there is still no information on the use of plant growth-promoters under variable nutritional conditions in the nursery and the effects on seedling growth and plant performance after transplant in the field.
Thus, the aim of this study was to evaluate the suitability of gibberellic acid (GA3) or bacterial biostimulant treatments to enhance the growth and quality of tomato seedlings fertigated with increasing nutrient rates and to assess the efficacy of these treatments on the establishment success and early growth and flowering stages of tomato plants.

2. Materials and Methods

The effects of fertilization levels and bacterial inoculum or gibberellic acid (GA3) treatments on transplant production were firstly evaluated in a nursery trial, then in a soilless cultivation trial. Both trials were carried out in a greenhouse situated at the Department of Agricultural, Food, and Forest Sciences (SAAF—University of Palermo, Italy) (38°6′28″ N 13°21′3″ E; altitude 49 m above sea level).

2.1. Plant Materials and Transplant Production

The nursery trial was carried out during autumn 2019 in a greenhouse equipped with fixed benches. Seeds of Solanum lycopersicum ‘Marmande’ (Vilmorin, La Ménitré, France) were sown into 24 polystyrene trays (104 cells each) filled with a commercial substrate (SER CA-V7 Special semine, Vigorplant Italia srl, Fombio, Italy, containing 800 g m−3 of a mineral fertilizer NPK 12-11-18) and into 12 similar trays filled with the same substrate inoculated with 1.5 g L−1 of TNC BactorrS13 (the nutrient company, Rochdale, UK), a commercial bacterial biostimulant with plant growth-promoting bacteria (1.3 × 10⁸ CFU g−1 of Bacillus amyloliquefaciens, B. brevis, B.circulans, B. coagulans, B. firmus, B. halodenitrificans, B. laterosporus, B. licheniformis, B. megaterium, B. mycoides, B. pasteurii, B. subtilis, Paenibacillus polymyxa) and soluble humates, natural plant growth regulators, amino acids, vitamins and trace elements derived from Ascophylum nodosum. After sowing (14 October 2019), the trays were moved onto the benches in the greenhouse at a temperature ranging from 20 °C to 28 °C and the substrate was maintained at field capacity by watering every day until seed germination. Plantlet emergence occurred 6 days after sowing. Two days after emergence, the plantlets were thinned to one per cell. When the plantlets had fully expanded cotyledons and the first true leaf (11th BBCH growth stage for tomato [34]) (8 days after emergence), 12 trays filled with uninoculated substrate were treated by spraying plantlets with 10−5 M GA3 (Gibrelex, Biolchim, Bologna, Italy). The gibberellic acid concentration was chosen according to previous experiments based on the effects of GA3 levels on tomato plants [14,35,36,37,38].
Fertilizing treatments started 8 days after emergence (11 th BBCH growth stage [34]) and were done with an ebb and flow sub-fertigation system. Seedlings were fertigated once a week with four levels of nutrients in the nutrient solution: 0, 1, 2 and 4 g L−1 of a water-soluble NPK fertilizer (20-20-20). Moreover, the seedlings were also sub-irrigated according to their necessity until they were ready for transplant (twice a week on average, including fertigation). The trays were weighed one by one before each sub-irrigation and after the drainage of the exceeding water to calculate the amount of water consumed during the transplant production. From these data, the water use efficiency (WUE) and nitrogen use efficiency (NUE) were calculated as: WUE (g DW L−1 H2O) = plant dry weight (g)/H2O (L); NUE (g DW g−1 N) = plant dry weight (g)/supplied N (g) (supplied N = initial N content of the substrate + N supplied with sub fertigation) [39].
Leaf stomatal conductance was measured (21 days from sowing) using a diffusion porometer (AP4, Delta-T Devices Ltd., Cambridge, England) on two recently expanded unshaded leaves of 20 tomato seedlings for each replicate.
When the seedlings were sufficiently developed for planting (12–15th BBCH growth stage [34]) (28 days from sowing), four replicated samples of 30 seedlings randomly selected from each treatment were destructively analyzed to evaluate the following parameters: seedling height, stem diameter, leaf number, leaf color, and leaf area. Leaf color was measured soon after sampling on the upper part of 2 leaves, randomly selected for each seedling with a colorimeter (CR-400, Minolta corporation, Ltd., Osaka, Japan) that recorded components L* (lightness), a* (positive values for reddish colors and negative values for greenish colors) and b* (positive values for yellowish colors and negative values for bluish colors). These values were used to estimate Hue angle (h°) and Chroma (C*) as h° = 180° + arctan(b*/a*) [40] and C* = (a*2 + b*2)1/2. Then, the seedlings were separated into leaves, stem, and roots, weighed, and dried to a constant weight at 85 °C to determine the fresh and dry biomass and the shoot/root ratio for both fresh and dry weight. Before drying, the leaves were scanned at 350 dpi (Epson Perfection 4180 Photo, Seiko Epson Corp., Suwa, Japan) to obtain digital images that were analyzed with the ImageJ 1.52a software (National Institutes Health, Bethesda, MD, USA) to measure the leaf area. The specific leaf area (SLA cm2 g−1 DW) was estimated as the leaf area/leaf dry weight.

2.2. Transplanting and Tomato Plant Growth

The experiment was conducted under the same greenhouse of the nursery trial. Plastic pots (13.5 cm × 13.5 cm × 16 cm) were filled with 2.5 L of soil amended with peat moss (33% by volume). The soil was collected from the top 30 cm of a nearby field. Soil properties before mixing with peat moss were 17% sand, 45% silt, and 38% clay; 1.2% organic matter, pH 7.97 (soil:water, 1:1), electrical conductivity (ECe) 1.24 dS m−1, 112.14 N, 0.26 P, 23.1 K, in mmol kg−1 soil.
Thirty days after sowing (15 November 2020), fifteen seedlings for each combination of seedling treatments and fertigation rates were transplanted into pots (one seedling per pot) that were arranged randomly on fixed benches into the greenhouse (6.25 plants m−2) and were spatially rearranged after each irrigation. The plants were grown for 60 days after transplant (until all the plants had at least one open flower in the first flower truss; at least the 61st BBCH growth stage [34]). They were vertically supported and pruned to a single stem by removing all axillary shoots.
The plants were regularly fertigated (twice a week) with a nutrient solution with 2 g L−1 of a water-soluble NPK fertilizer (20-20-20). Each pot was weighed before fertigation and after drainage of the exceeding nutrient solution to calculate the amount of water consumed by the plants during the growth. From these data, the WUE and NUE were calculated as described above for the seedlings.
During the growth, the plant height and leaf number were recorded; the height and the number of nodes of the first flower truss were recorded for each plant when at least one flower was open (first flowering date). One week before the destructive analysis of the plants, the stomatal conductance was measured with a diffusion porometer (AP4, Delta-T Devices Ltd., Cambridge, UK) on two recently expanded unshaded leaves of each plant and leaf color was measured on the upper part of 4 leaves, randomly selected for each plant, as described for the seedlings.
After 60 days from the transplant (15 January 2020), all plants were destructively sampled. The aerial part of the plant was divided into stem, leaf, and trusses, while the roots were carefully removed from the pots and gently washed with running tap water to remove the substrate with minimal damage. All plant parts were immediately weighed and then dried to a constant weight at 85 °C to determine the fresh and dry biomass. Before drying, the leaf area of each plant was determined as described above for the seedlings.

2.3. Statistical Analysis

The experimental design consisted of four replicates for each combination of seedling treatments and fertigation rates, randomly assigned in four blocks. A two-way ANOVA was carried out to evaluate the effect of seedling treatments and fertigation rates on tomato seedlings (30 seedlings for each replicate) and plants (5 plants for each replicate). The least significant differences (LSD) test at p ≤ 5% was used to compare the mean values and to identify the significant differences among treatments and the significant interactions between factors. A regression analysis was performed to fit a linear or second-order polynomial equation to the data of the plant parameters examined. ANOVA was used to test the statistical significance of the terms in the regression equations for each response.

3. Results

3.1. Tomato Transplant Production

During the nursery experiment, outside the greenhouse, the average temperature ranged between 17.8 ± 0.4 °C (night) and 23.3 ± 0.6 °C (day), and the average net solar radiation at noon was 466 W·m−2. The day length during the cultivation period (from sunrise to sunset) ranged between 8 and 9 h. The mean air temperature inside the greenhouse was 24.2 ± 0.5 °C. The temperature ranged between 16.2 ± 0.3 °C (night) and 32.6 ± 0.6 °C (day); the relative humidity ranged between 68.8% and 98.2% (84.9% on average). The highest light intensity inside the greenhouse was 40,559 lux on average, ranging from 56989 to 4171 lux as a function of the cloudiness.
Tomato plantlets emerged 6 days after sowing with no differences between the inoculated and non-inoculated substrates. Seedlings were all ready for transplant (3–5 true leaves) after 28 d from sowing.
Plant height varied according to fertilization levels but with some differences due to plant treatments (Table 1, Figure 1). When the plants were not fertigated (0 g L−1), those inoculated with the bacterial biostimulant resulted significantly smaller (5.2 cm) than the others (7.5 cm on average).
The increase in fertilizer concentration determined an increase in the plant height of control plants up to 19.3 cm on average for 2 and 4 g L−1. The inoculated seedlings were significantly smaller with 2 g L−1 of fertilizer (17.9 cm) but resulted higher with the highest fertilizer level (20.8 cm). The seedlings that were sprayed with GA3 reached the highest height with 2 g L−1 of fertilizer (21.7 cm) and were comparable to the inoculated seedling with 4 g L−1 of fertilizer (20.3 cm).
The stem diameter was affected only by the fertigation doses; it increased as the fertilizer concentration increased from 2.0 mm (0 g L−1) to 2.6 mm (4 g L−1) (Table 1).
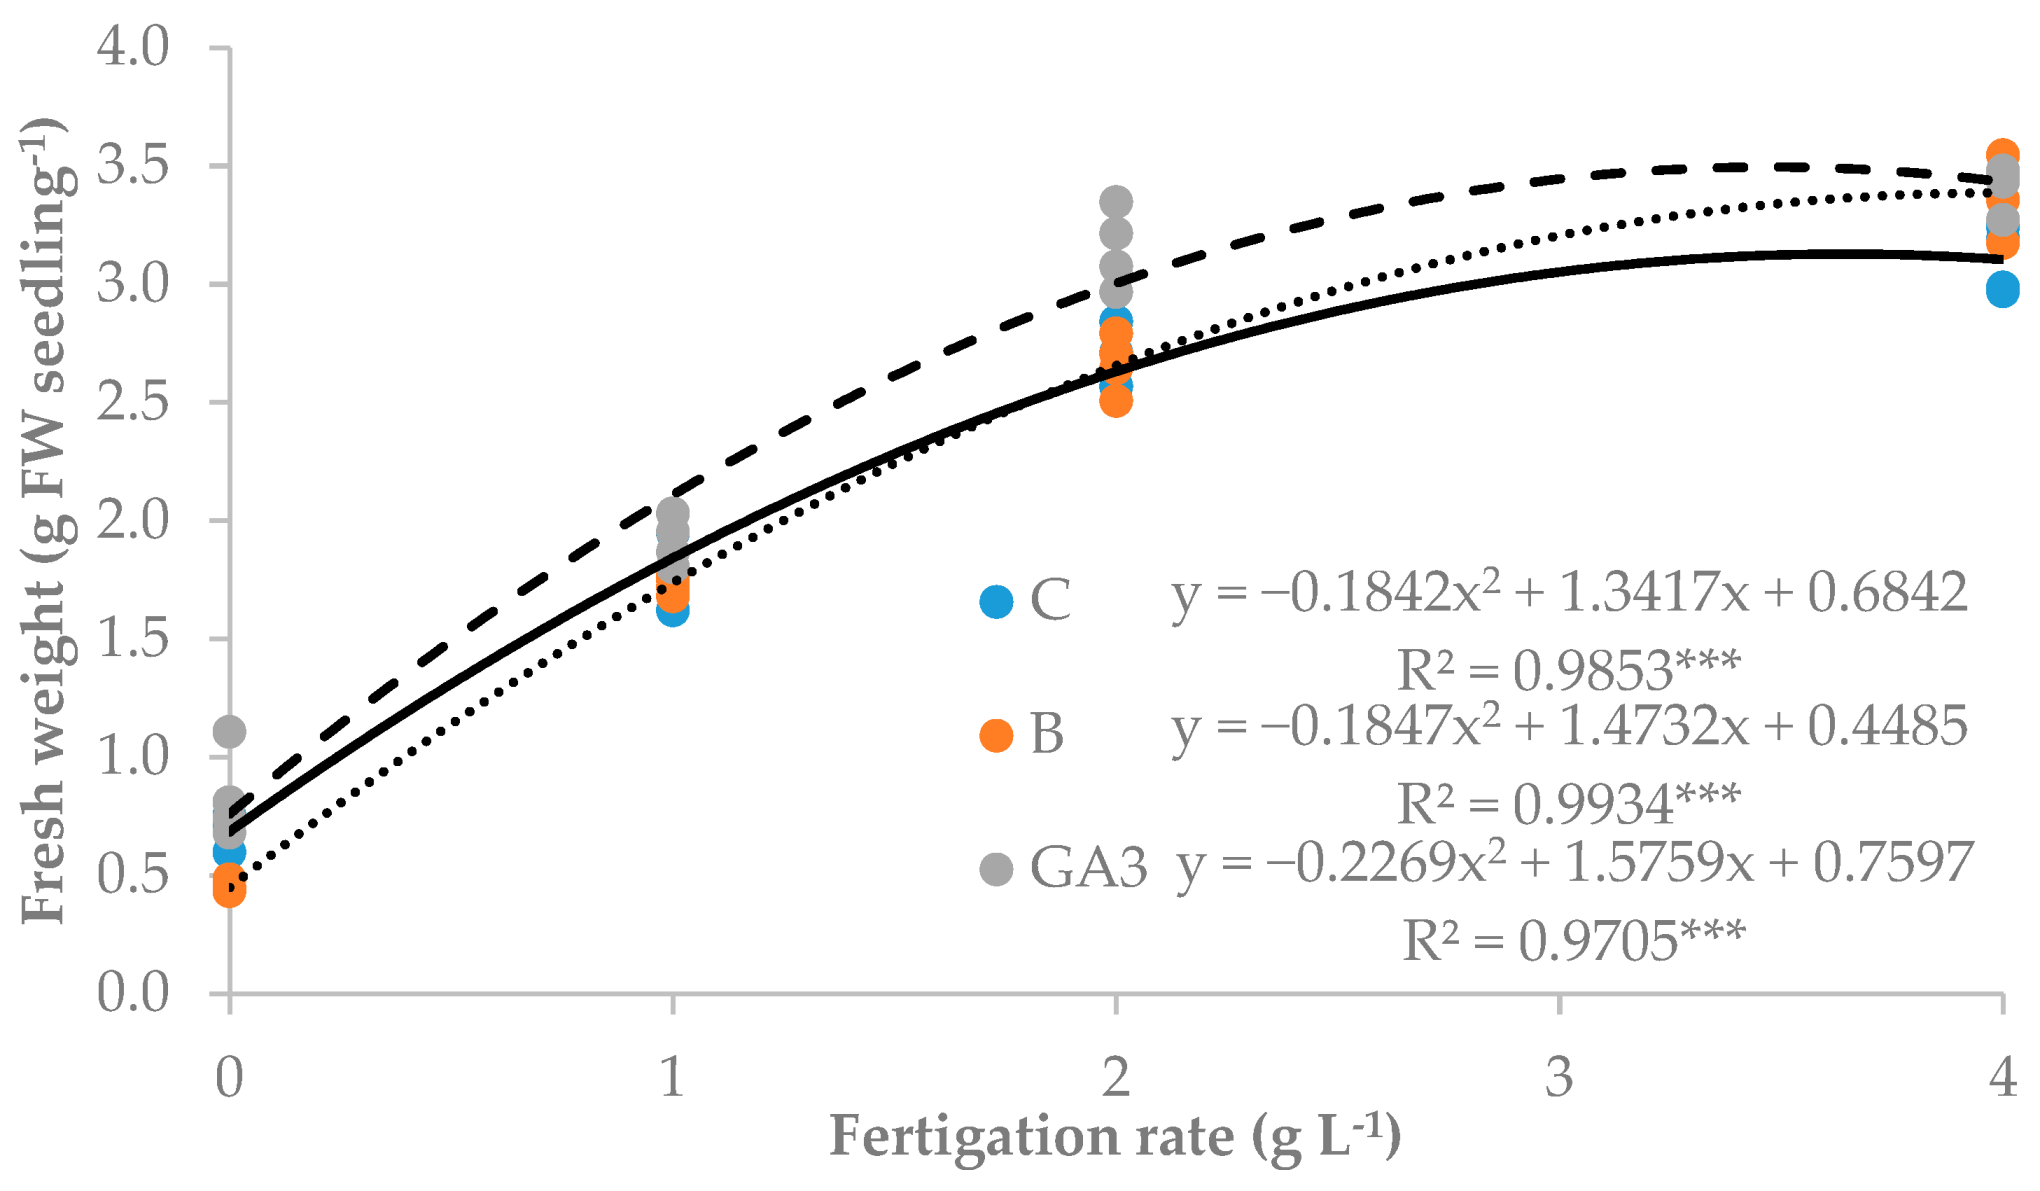
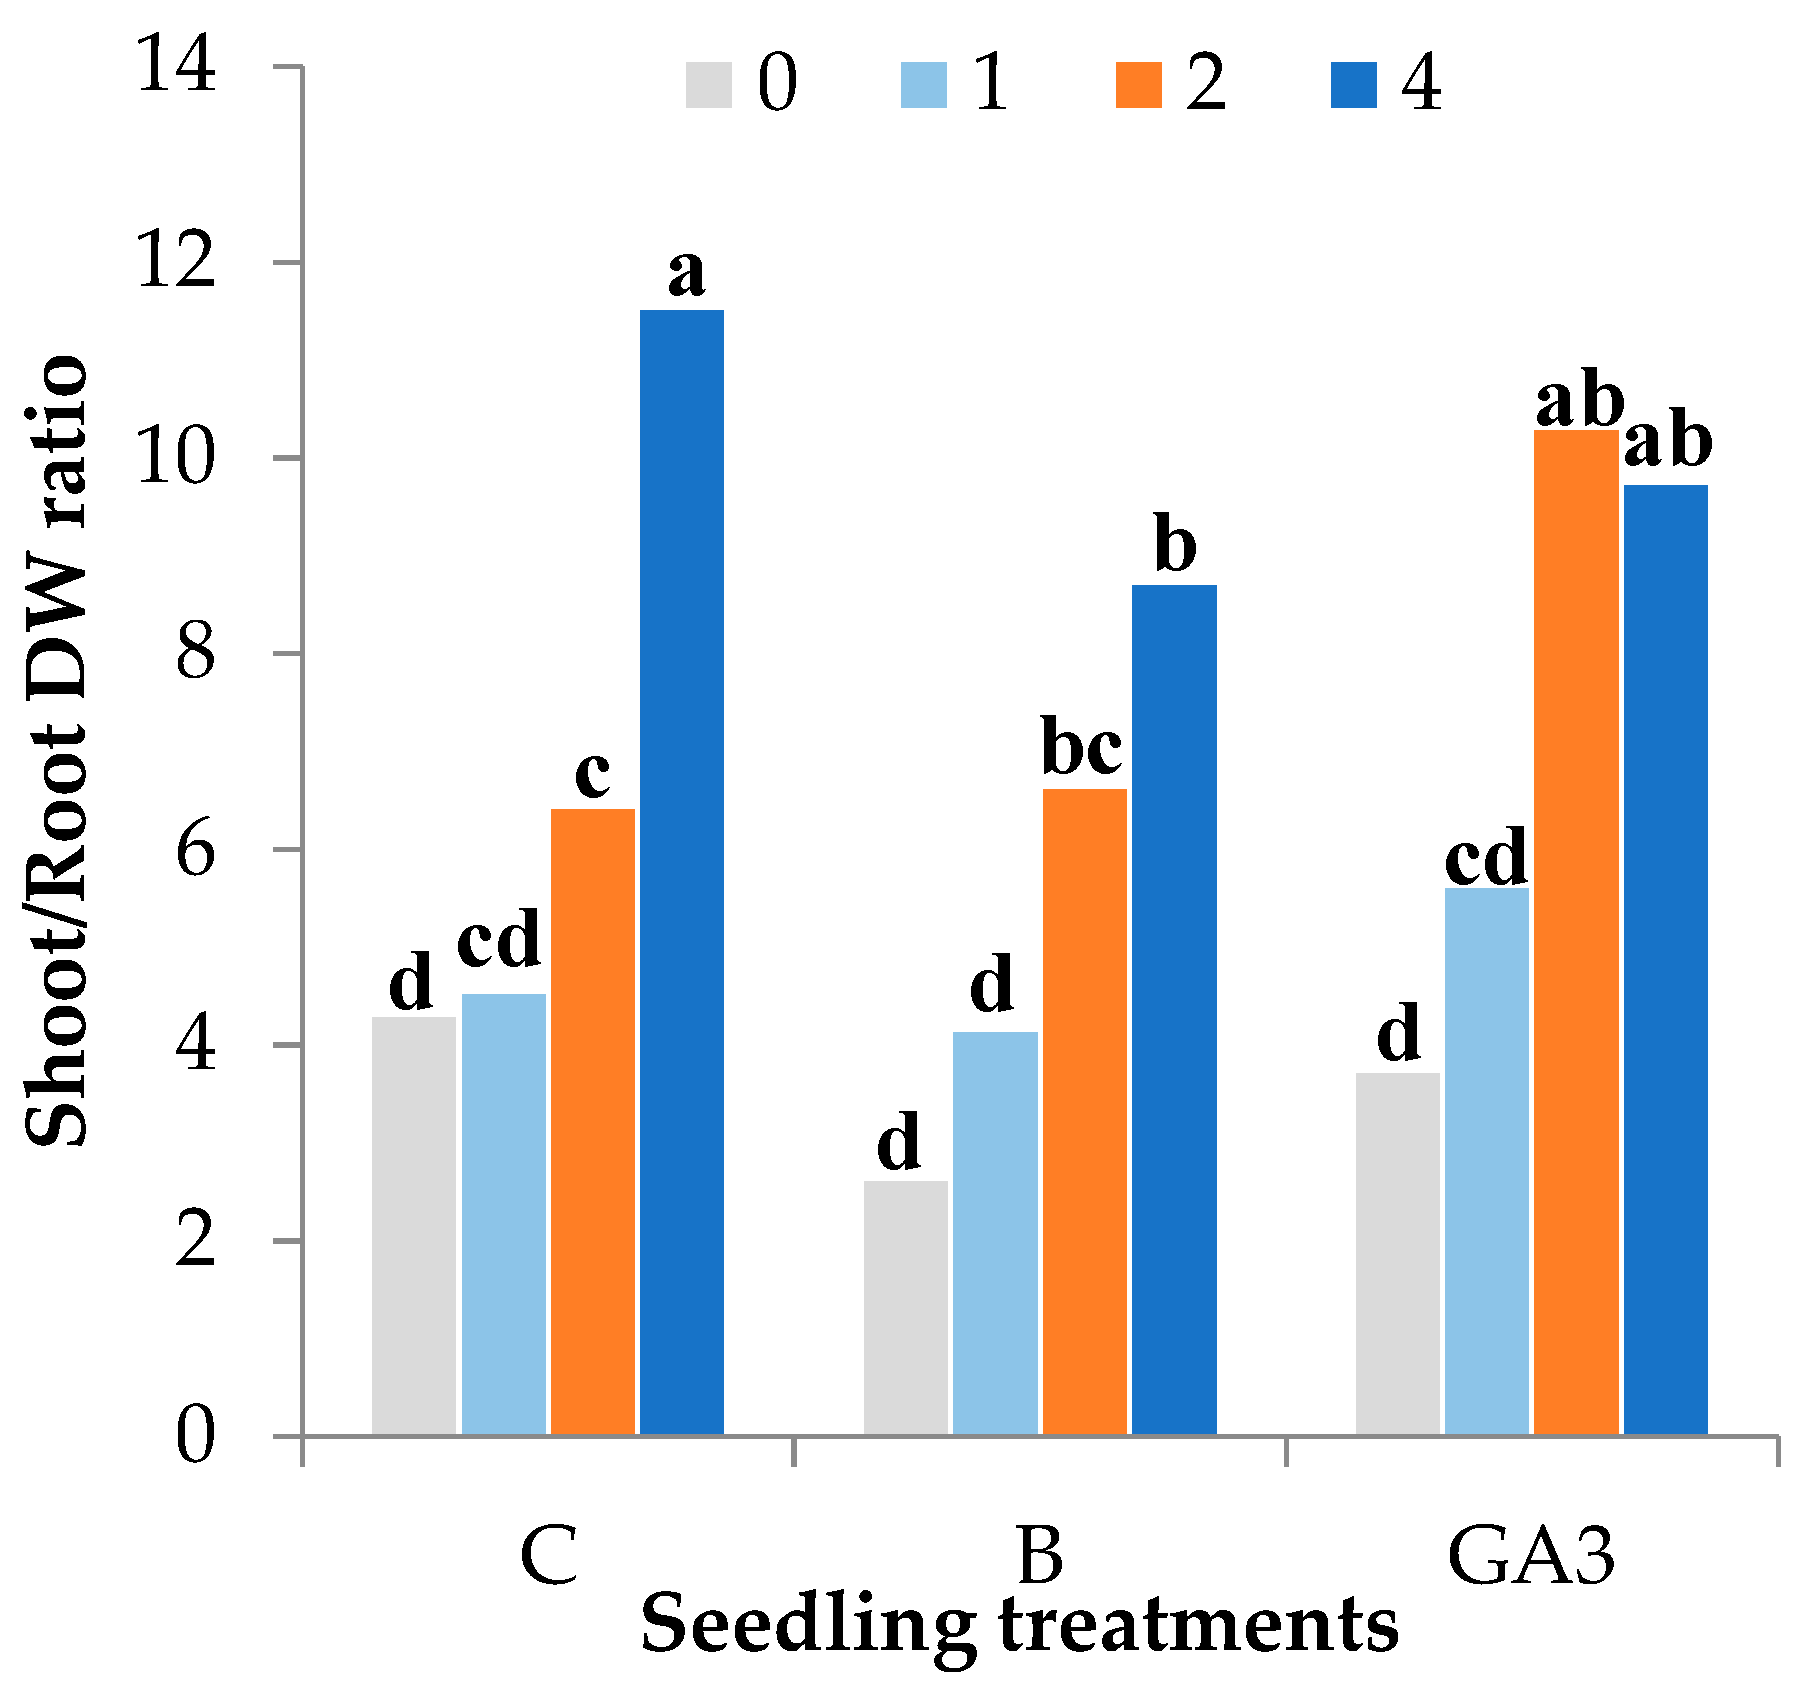
Seedlings fresh weight (FW) was affected by the interaction between the seedling treatments and the fertilizer level; it showed a quadratic trend in all seedling treatments (Figure 2) varying from 0.7 to 3.1 g FW seedling−1 in the control seedling (Table 1). The inoculation with the bacterial biostimulant significantly reduced the fresh weight of the non-fertigated seedlings (0.5 g FW seedling−1) but determined a greater fresh biomass accumulation when the seedlings were fertigated with 4 g L−1 (3.4 g FW seedling−1). The GA3-treated seedlings fertigated with 2 g L−1 of fertilizer had a similar fresh weight to the control seedlings fertigated with the highest fertilizer level (3.2 g FW seedling−1) and further increased their fresh biomass at this fertigation level (3.4 g seedling−1). The treatments also determined the changes in the biomass partitioning, especially in the case of GA3-treated seedlings fertigated with 2 g L−1 which increased the shoot/root ratio to a value similar to those recorded at 4 g L−1 in all the seedling treatments (Figure 3). The main differences in biomass partitioning were recorded at 0 g L−1, which determined a significant increase in root percentage in the inoculated seedlings, whereas those treated with GA3 increased the percentage of leaves and reduced the percentage of stem and roots (Table 1).
The total dry biomass of the seedlings showed quadratic trends like those found for fresh biomass Table 1, Figure 4). The bacterial biostimulant negatively affected the dry matter accumulation with no fertigation (−36.1% than the control). The increase in fertilizer concentration determined an increase in the dry weight (DW) of the seedlings, especially in those treated with GA3, which recorded the highest dry weight (201.5 mg DW seedling−1) at 2 and 4 g L−1. The shoot/root ratio of the dry biomass of the control seedlings ranged from 4.3 to 11.5 as increasing fertigation level and showed a significant difference only for the inoculated seedlings fertigated with 4 g L−1 (8.7) (Figure 5). The dry biomass partitioning among roots, stem, and leaves showed a positive effect of the bacterial biostimulant on root growth at the expense of leaves when the seedlings were only watered (0 g L−1); in this nutritional condition, GA3 stimulated a greater distribution of dry matter in leaves at the expense of the stem (Table 1).
Dry matter percentage was affected only by the fertigation doses with a decreasing trend from 0 g L−1 to 2 g L−1 (12.4% and 5.9%, respectively), with no further decrease with the highest fertilizer level (Table 1).
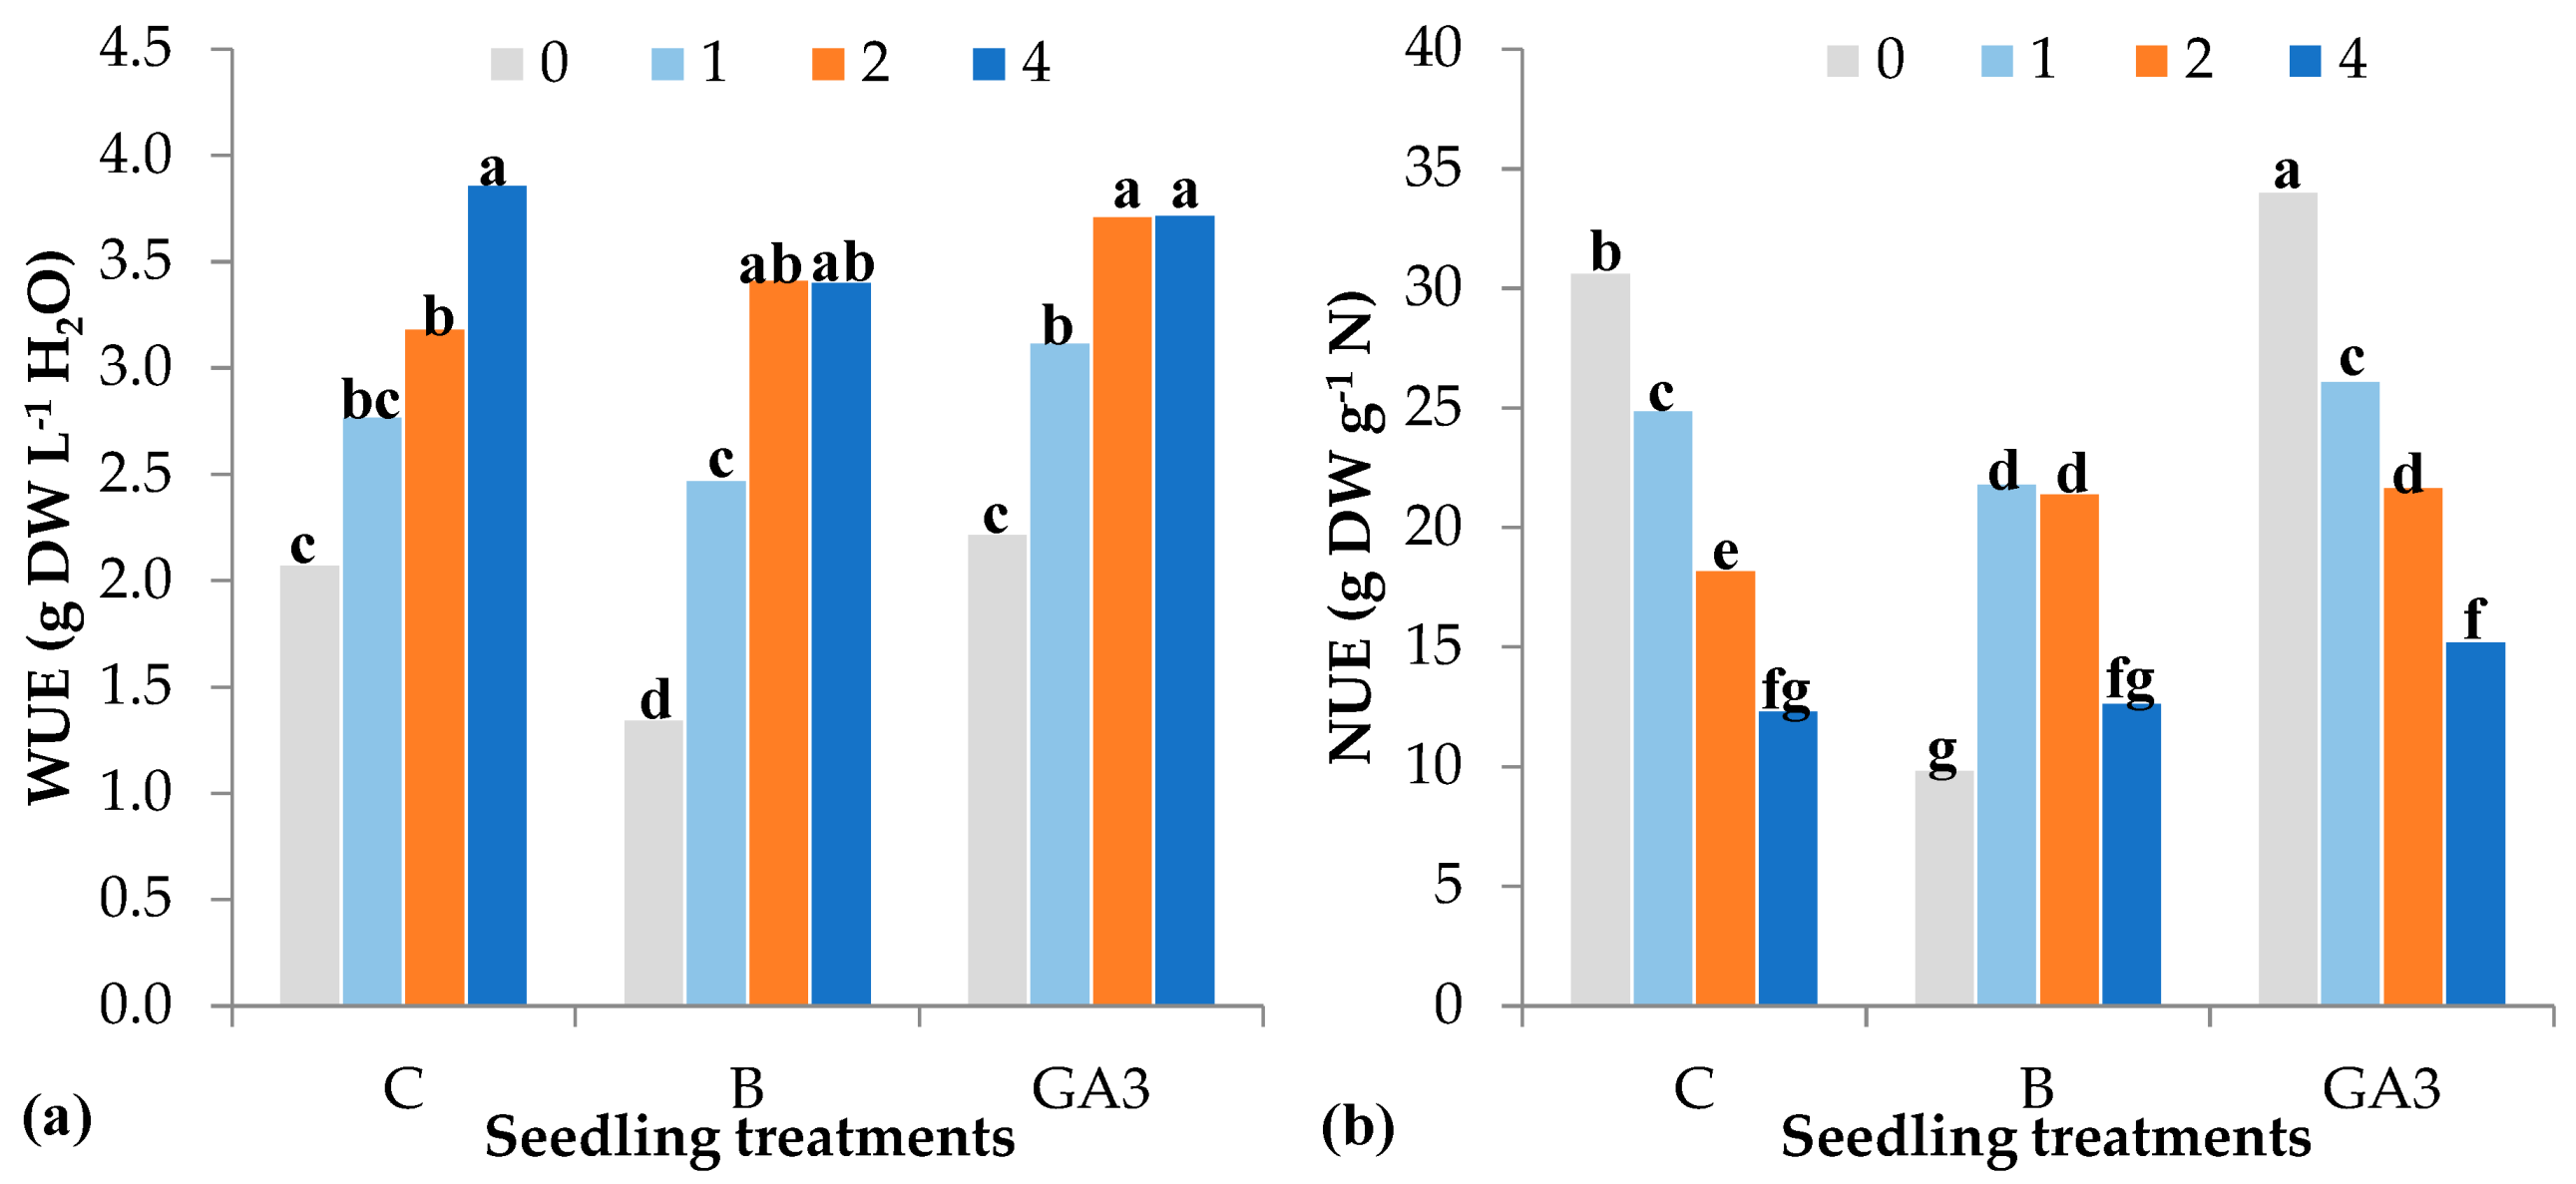
The water use efficiency (WUE) recorded small variations as a function of the seedling treatments. A significantly lower WUE (1.4 g DW L−1 H2O) was calculated for the seedlings inoculated with the bacterial biostimulant. GA3-treated seedlings reached the highest WUE levels with 2 and 4 g L−1 of fertilizer, whereas the control seedlings needed 4 g L−1 to reach the highest WUE (Figure 6a).
The nitrogen use efficiency (NUE) dropped as increasing fertigation doses in the control (from 30.7 to 12.4 g DW g−1 N) and GA3-treated seedlings (from 34.1 to 15.3 g DW g−1 N). Inoculated seedlings showed a low NUE with 0 and 4 g L−1 of fertilizer (11.3 g DW g−1 N on average) and a higher NUE with 1 and 2 g L−1 (21.7 g DW g−1 N on average) (Figure 6b).
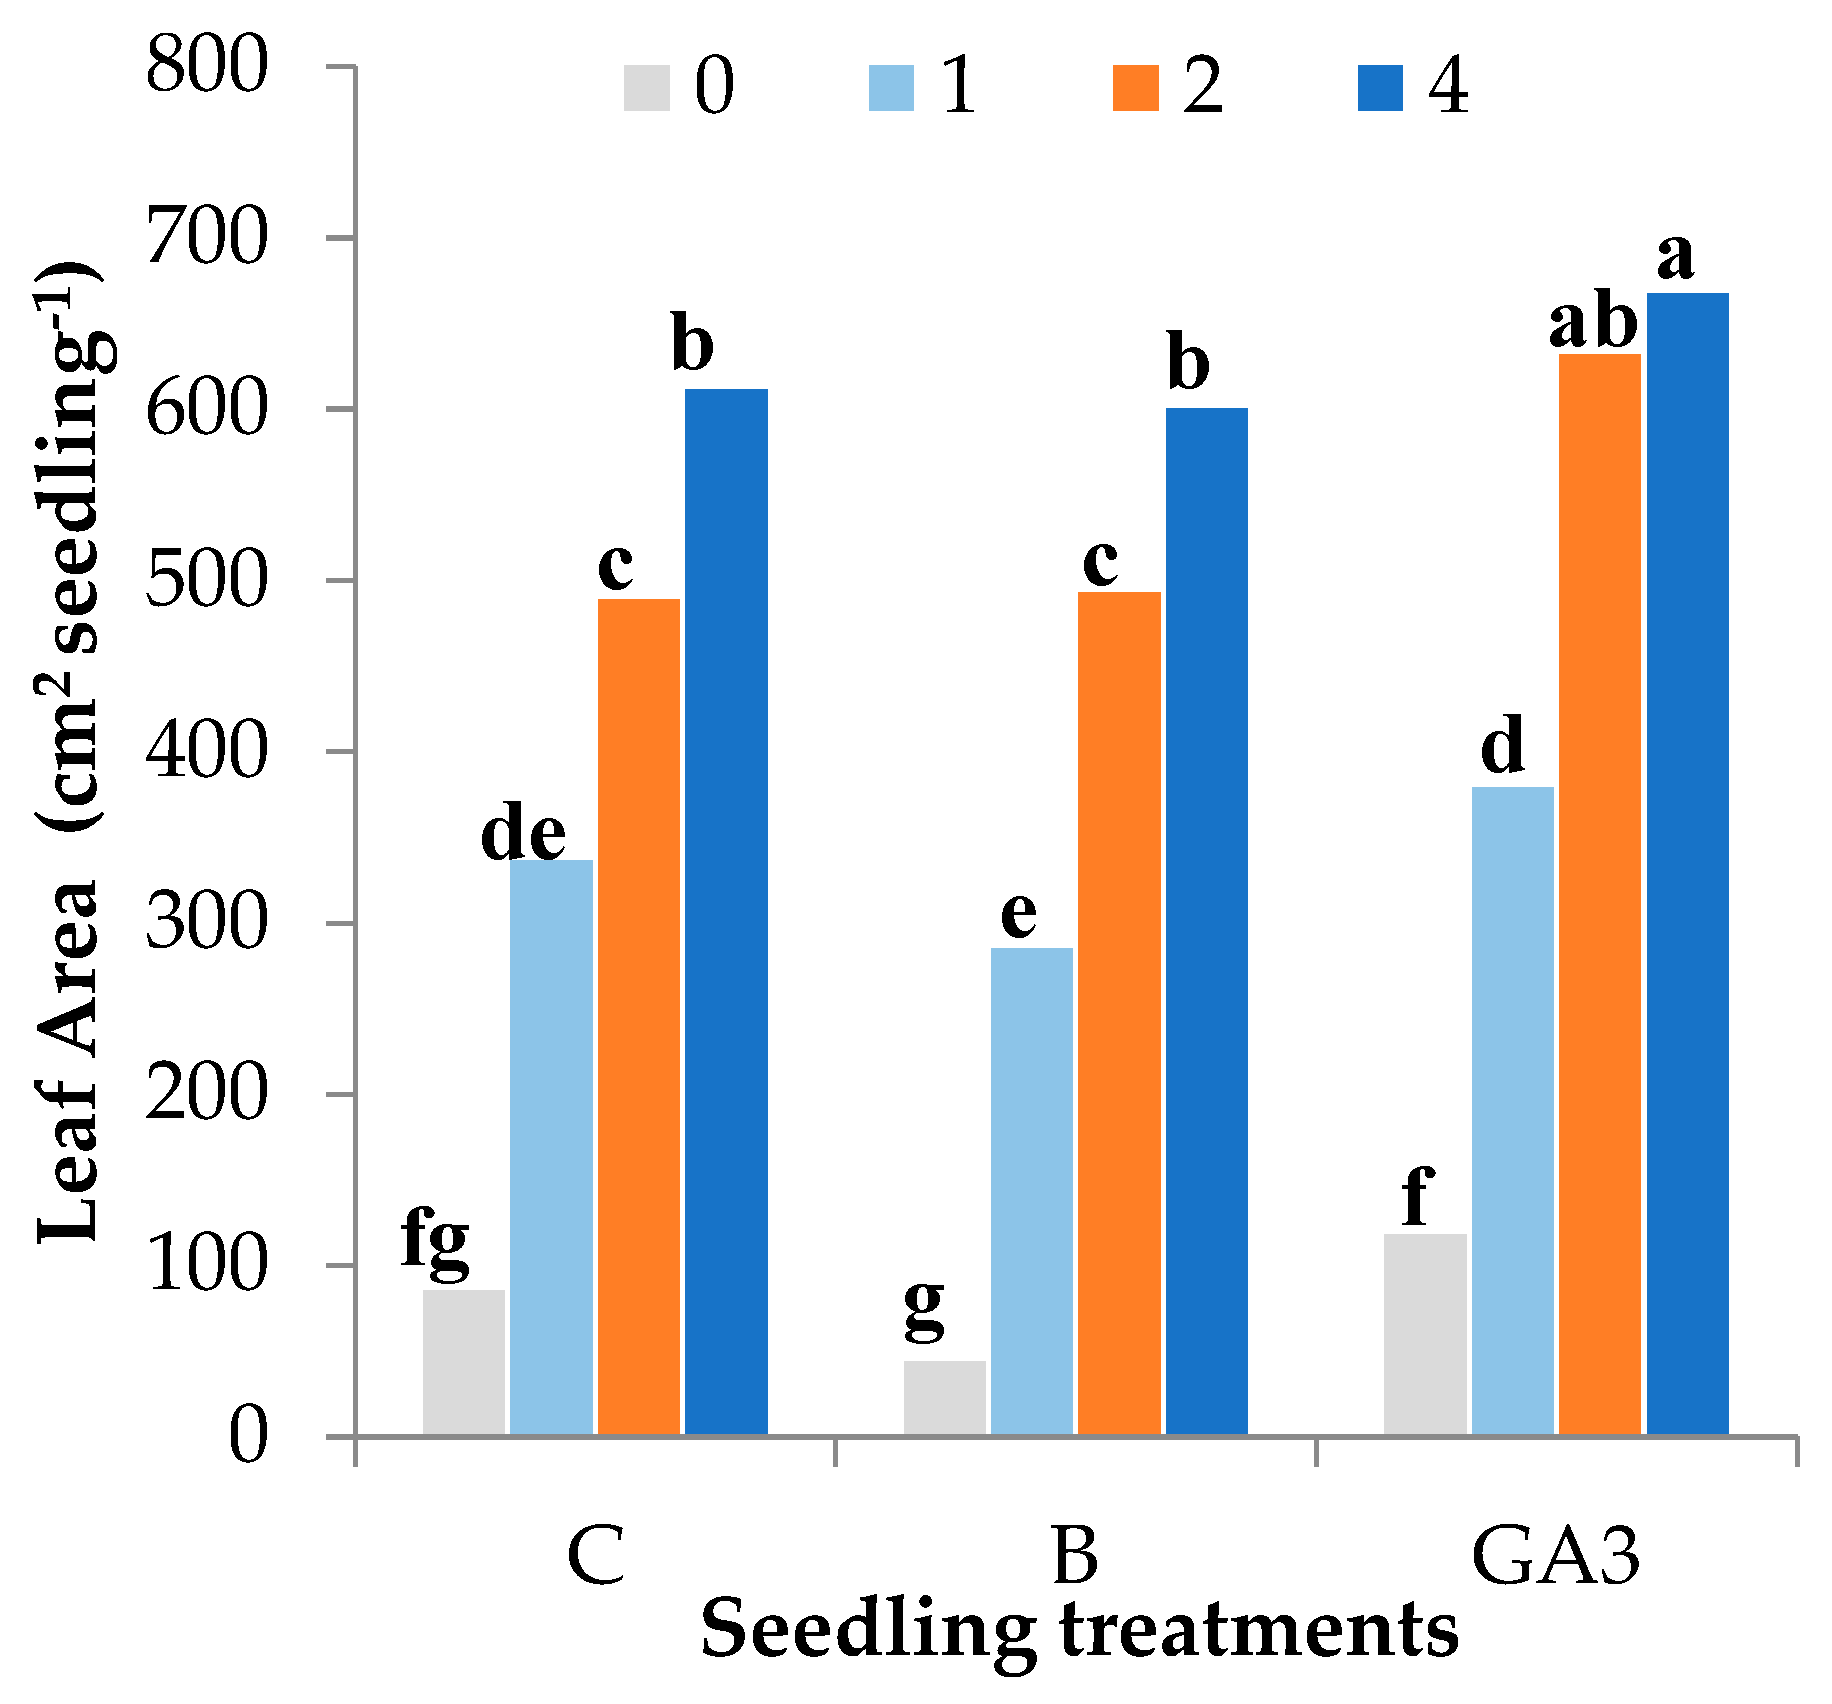
The highest leaf number of the tomato seedlings was recorded in those treated with GA3 (4.6 leaves seedling−1), which had 15% more leaves than the control and inoculated seedlings (4.0 leaves seedling−1 on average) (Table 2). Seedling leafiness significantly increased by increasing the concentration of fertilizer from 0 to 2 g L−1 (from 2.2 to 5.1 leaves seedling−1), without further increase when the highest fertigation level was supplied. A similar effect of the treatments and the fertigation doses was found for the average leaf area (Table 2), whereas the total leaf area of the seedlings was affected in different ways by the fertilizer levels according to the treatments. The lowest doses of fertilizer (0 and 1 g L−1) did not determine the significant differences in the total leaf area between control seedlings (8.7 and 33.9 cm2 seedling−1, respectively) and inoculated or GA3-treated seedlings, even if the latter had a significantly greater leaf area than those inoculated with the bacterial biostimulant. Raising to 2 g L−1 the fertilizer concentration, the seedlings sprayed with GA3 had a total leaf area (63.4 cm2 seedling−1) higher than the others (49.3 cm2 seedling−1 on average) and not statistically different from the values of leaf area recorded for the control and inoculated seedlings with the highest fertilizer concentration (60.8 cm2 seedling−1 on average). At this fertilizer level, GA3-treated seedlings further increased their total leaf area up to 66.9 cm2 seedling−1 (Table 2, Figure 7).
The specific leaf area (SLA) is an index of leaf morphology (thickness) and dry biomass distribution in the leaves (Table 2). This parameter showed a slight but not significant increase in the treated seedlings against the control seedlings. The effect of fertilizer concentration on SLA was more evident and followed a quadratic trend (R2 = 0.9256 ***) raising from 301.1 cm2 g−1 DW (0 g L−1) up to 681.0 cm2 g−1 DW (2 g L−1).
Control seedlings recorded the lowest stomatal conductance when not fertigated (260.1 mmol m2 s−1) and the highest with 1 g L−1 of fertilizer (714.3 mmol m2 s−1); further increases in fertilizer concentration made the stomatal conductance drop down to 456.1 mmol m2 s−1. The seedlings inoculated with the bacterial biostimulant showed an increasing trend of stomatal conductance from 286.2 mmol m2 s−1 to 787.8 mmol m2 s−1 with 0 and 4 g L−1 of fertilizer respectively, whereas the GA3-treated seedlings recorded low values of stomatal conductance irrespective of fertilizer level (368.3 mmol m2 s−1 on average) (Table 2).
Leaf color can be considered an index of physiological and nutritional plant status. The experimental factors influenced leaf color characteristics in a complex way (Table 2). The supply of the highest fertilizer doses (2 and 4 g L−1) determined a reduction of color lightness (L*) to comparable values for all the treated and untreated seedlings. The treatments applied to the seedling differently affected L* with the lowest fertilizer levels (0 and 1 g L−1); L* was lower in the inoculated seedlings and higher in the GA3-treated seedlings than the control seedlings at 0 g L−1, whereas, with 1 g L−1, it was significantly lower compared to the control only in GA3-treated seedlings. The leaf color vividness (Chroma) of non-fertigated seedlings was lower in those inoculated with the bacterial biostimulant and decreased by increasing the fertilizer concentration but less strongly in the inoculated and in the GA3-treated seedlings supplied with 2 g L−1 of fertilizer. Moreover, the green component of color was less intense in the treated seedlings compared to the control seedlings as suggested by the reduction of the hue angle, whereas the leaves become greener as the fertilizer dose supplied to the seedlings increases.

3.2. Tomato Plants Soilless Cultivation

At the end of the nursery experiment, the seedlings were transplanted into pots and placed inside the same greenhouse to evaluate the effects of the experimental factors on the initial growth of the tomato plants in soilless cultivation (60 days since transplant). During this period, the temperature inside the greenhouse ranged between the minimum value of 4.7 °C and the maximum value of 36.2 °C. The average lower temperature was 11.0 ± 0.4 °C, whereas the average maximum temperature was 23.3 ± 0.6 °C. Relative humidity ranged between 45.5% and 99.9% (81.5% on average). The day length during the cultivation period (from sunrise to sunset) ranged between 8 and 9 h. The highest light intensity inside the greenhouse was 35,631 lux on average, ranging from 44,664 to 4251 lux as a function of the cloudiness.
All the seedlings overcame the transplant shock in a few days. The growth of tomato plants was significantly affected by the experimental factors applied to seedlings during nursery production. The plants that were not fertigated during nursery growth showed the lowest height throughout the soilless cultivation period, whereas those fertigated with 2 or 4 g L−1 of fertilizer were the tallest. Intermediate heights were recorded for the plants fertigated in the nursery with 1 g L−1 of fertilizer, however, among these, those treated with GA3 showed a higher growth rate than the others so that at the end of the trial, they became closer to the height of the plants fertigated in the nursery with the highest doses of fertilizers (Figure 8).
The height of the plants at the end of the trial were shown to be positively influenced by the nursery fertigation. The lowest plants were those not fertigated during nursery production (61.4 cm on average); the height significantly increased up to the 2 g L−1 treatment (86.9 cm on average) with no significant further increase for the 4 g L−1 treatment (85.3 cm on average) (Table 3).
Plant stem diameter recorded small variations that were only due to the fertigation level in nursery production (Table 3).
The treatments applied to the seedlings had a low impact on the plant fresh biomass accumulation, except for the fresh biomass of the stem and the trusses, whereas a marked effect on plant fresh biomass was determined by the fertigation rates supplied to the seedlings (Table 3, Figure 9). The plants that were not fertigated during nursery production had a total fresh weight of 171.1 g FW plant−1. The total fresh biomass accumulated by plants increased up to 254.2 g FW plant−1, on average, in those fertigated with 2 or 4 g L−1 in the nursery. The main part of the biomass was represented by the leaves that weighed 102.5 g FW plant−1 in non-fertigated seedlings and increased up to 144.0 g FW plant−1 on average in those fertigated in the nursery (Table 3, Figure 9).
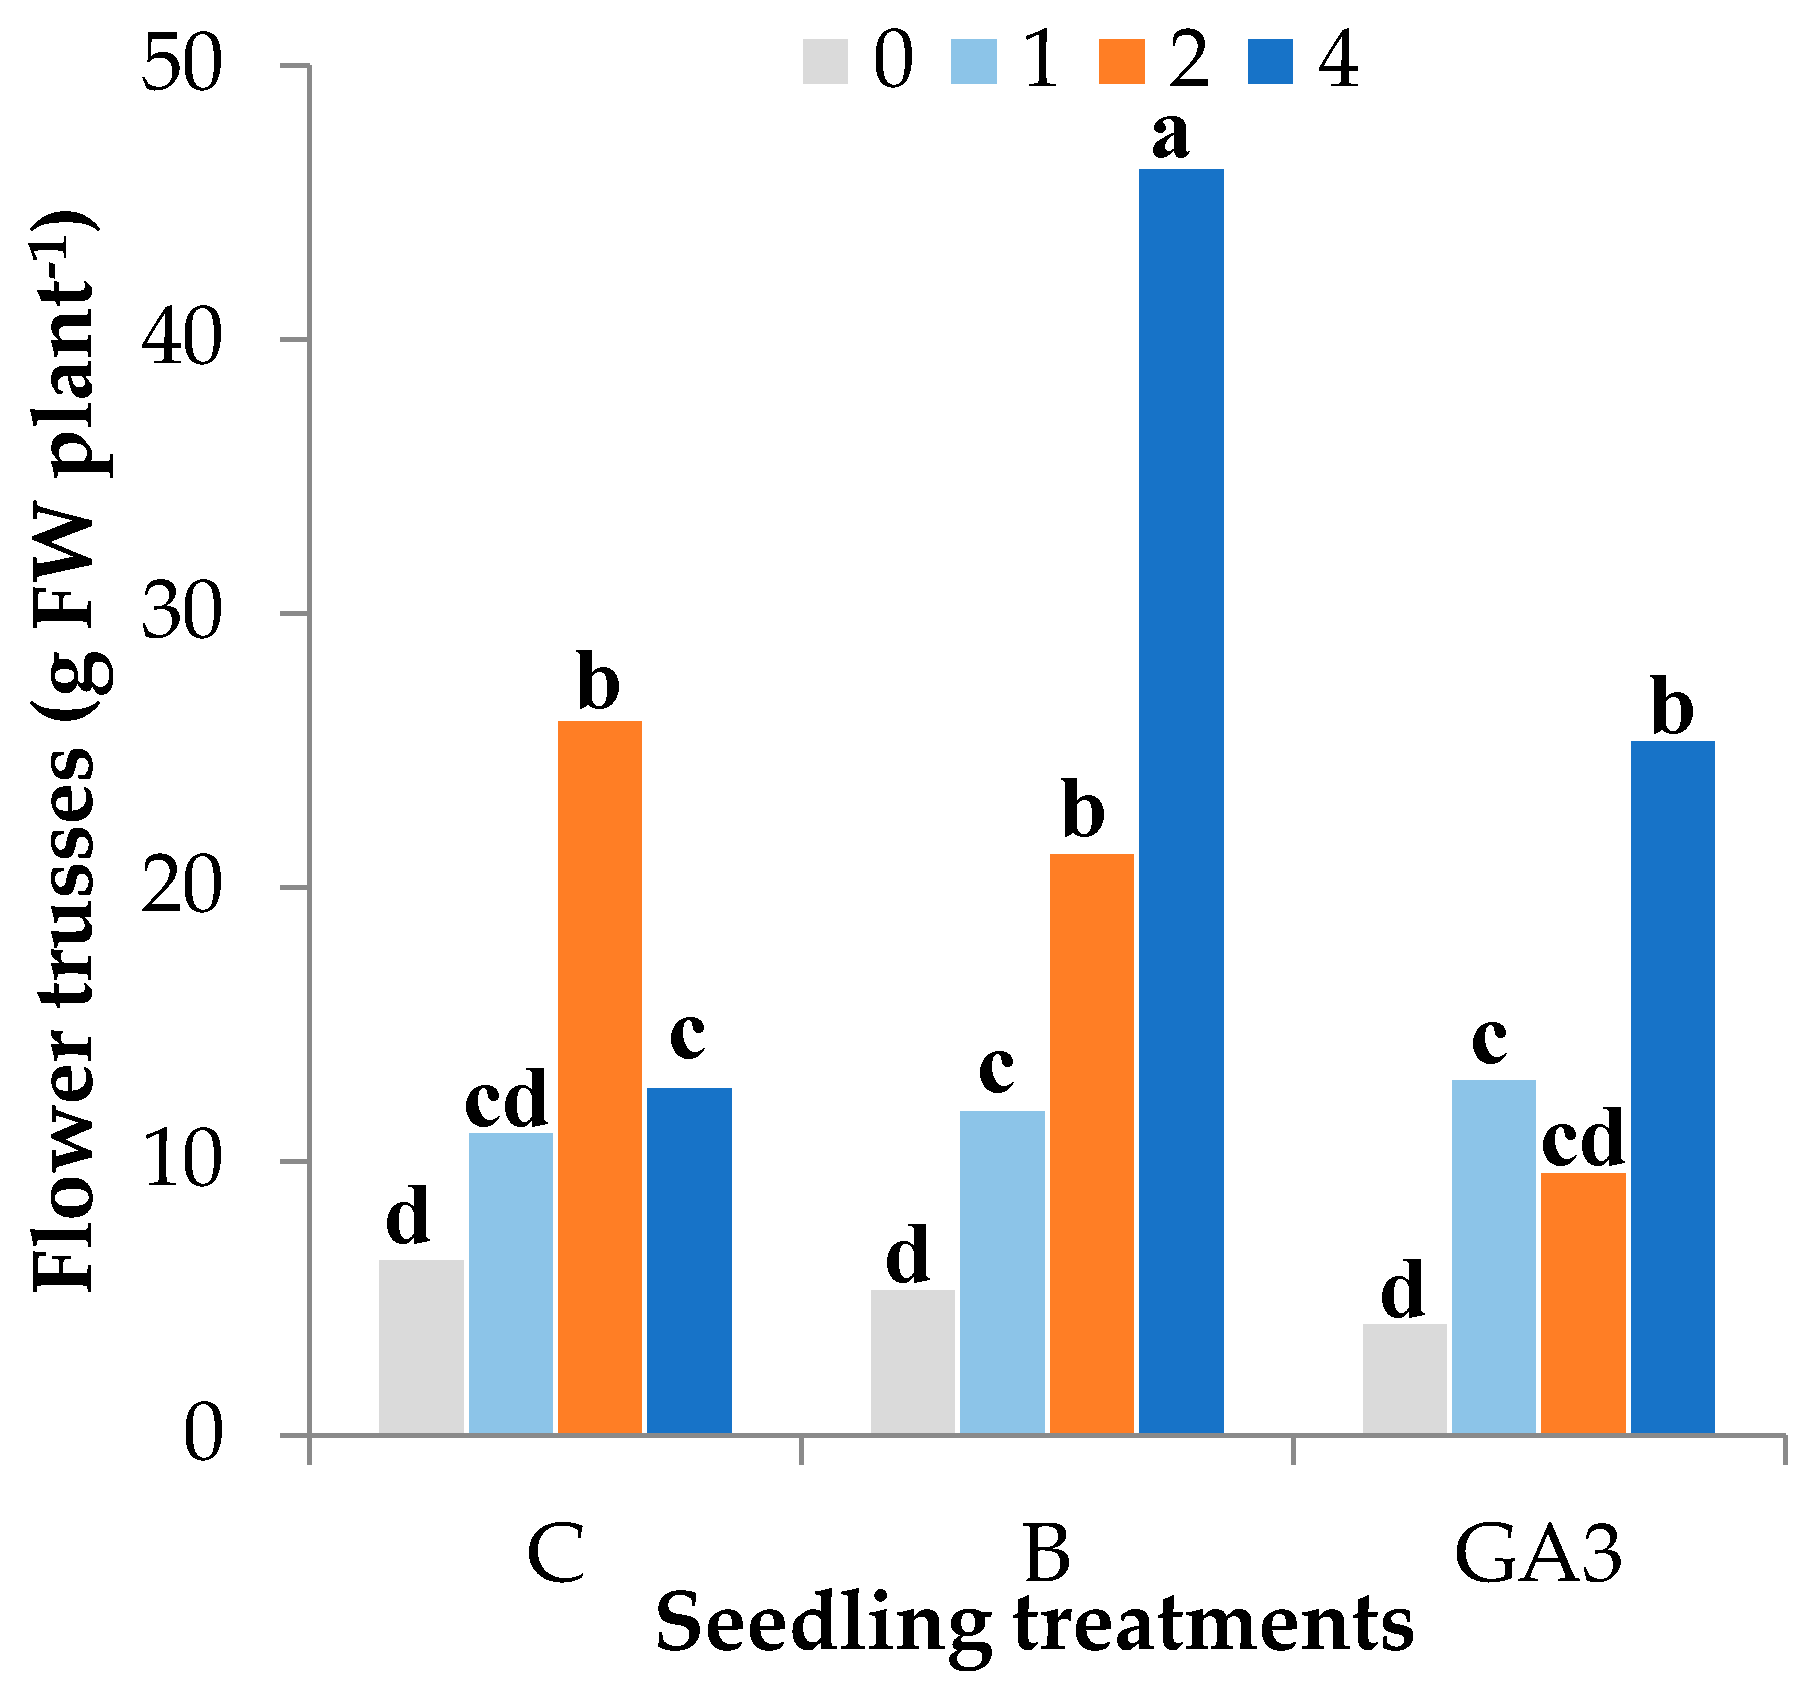
The fresh biomass of the flower trusses included racemes, flowers, and small fruits at different development stages. This portion of the biomass showed differences in its fresh weight that were determined by the interaction between the experimental factors applied to the nursery trial. The lowest weight of the trusses was found when plants were not fertigated during nursery growth (5.3 g FW plant−1 on average for all seedling treatments). Control plants increased their trusses fresh weight up to 26.2 g FW plant−1 if fertigated in the nursery with 2 g L−1 and dropped down to 12.8 g FW plant−1 with 4 g L−1. The GA3-treated seedlings needed 4 g L−1 to accumulate a high amount of biomass in the trusses (25.4 g FW plant−1), whereas the seedlings inoculated with the bacterial biostimulant had a comparable truss weight if fertigated with 2 g L−1 (21.3 g FW plant−1) and increased it by 117% if fertigated with 4 g L−1 (46.3 g FW plant−1) (Table 3, Figure 10).
The accumulation of the dry biomass of tomato plants showed a trend comparable to fresh biomass (Table 3, Figure 11). The total plant dry weight (DW) was significantly lower in the tomato plants that were not fertigated during nursery growth (18.2 g DW plant−1). Significant increases in plant dry weight were determined by fertigating seedlings with 1 g L−1 (27.2 g DW plant−1) and 2 g L−1 (29.2 g DW plant−1). No further significant increase was determined by the highest fertigation level (29.5 g DW plant−1).
As regards the dry weight of the trusses, this was higher in the control plants fertigated in the nursery with 2 g L−1 (3.7 g DW plant−1), whereas the treated seedlings showed their higher truss dry biomass accumulation when fertigated with 4 g L−1 of fertilizer, especially those inoculated with the bacterial biostimulant, which recorded the highest truss dry weight (4.8 g DW plant−1) (Table 3). The percentage of dry matter in tomato plants resulted significantly higher in those fertigated during nursery growth (11.6% on average) than non-fertigated ones (10.6%) (Table 3).
The measure of the water and nutrients supplied to the tomato plants during greenhouse cultivation was used to calculate the water use efficiency (WUE) and nitrogen use efficiency (NUE), which were affected only by the concentration of nutrients supplied during the seedling growth (Figure 12a,b). The WUE was 3.1 g DW L−1 H2O on average without nursery fertigation and significantly increased with 1 g L−1 (+7.1%) and 2 or 4 g L−1 (+56.1%) up to 4.91 g DW L−1 H2O on average. A similar trend was found for NUE which recorded the lowest value in the plants not fertigated in the nursery (12.3 g DW g−1 N) and the highest value in the plants fertigated during nursery growth with 2 or 4 g L−1 (20.0 g DW g−1 N on average).
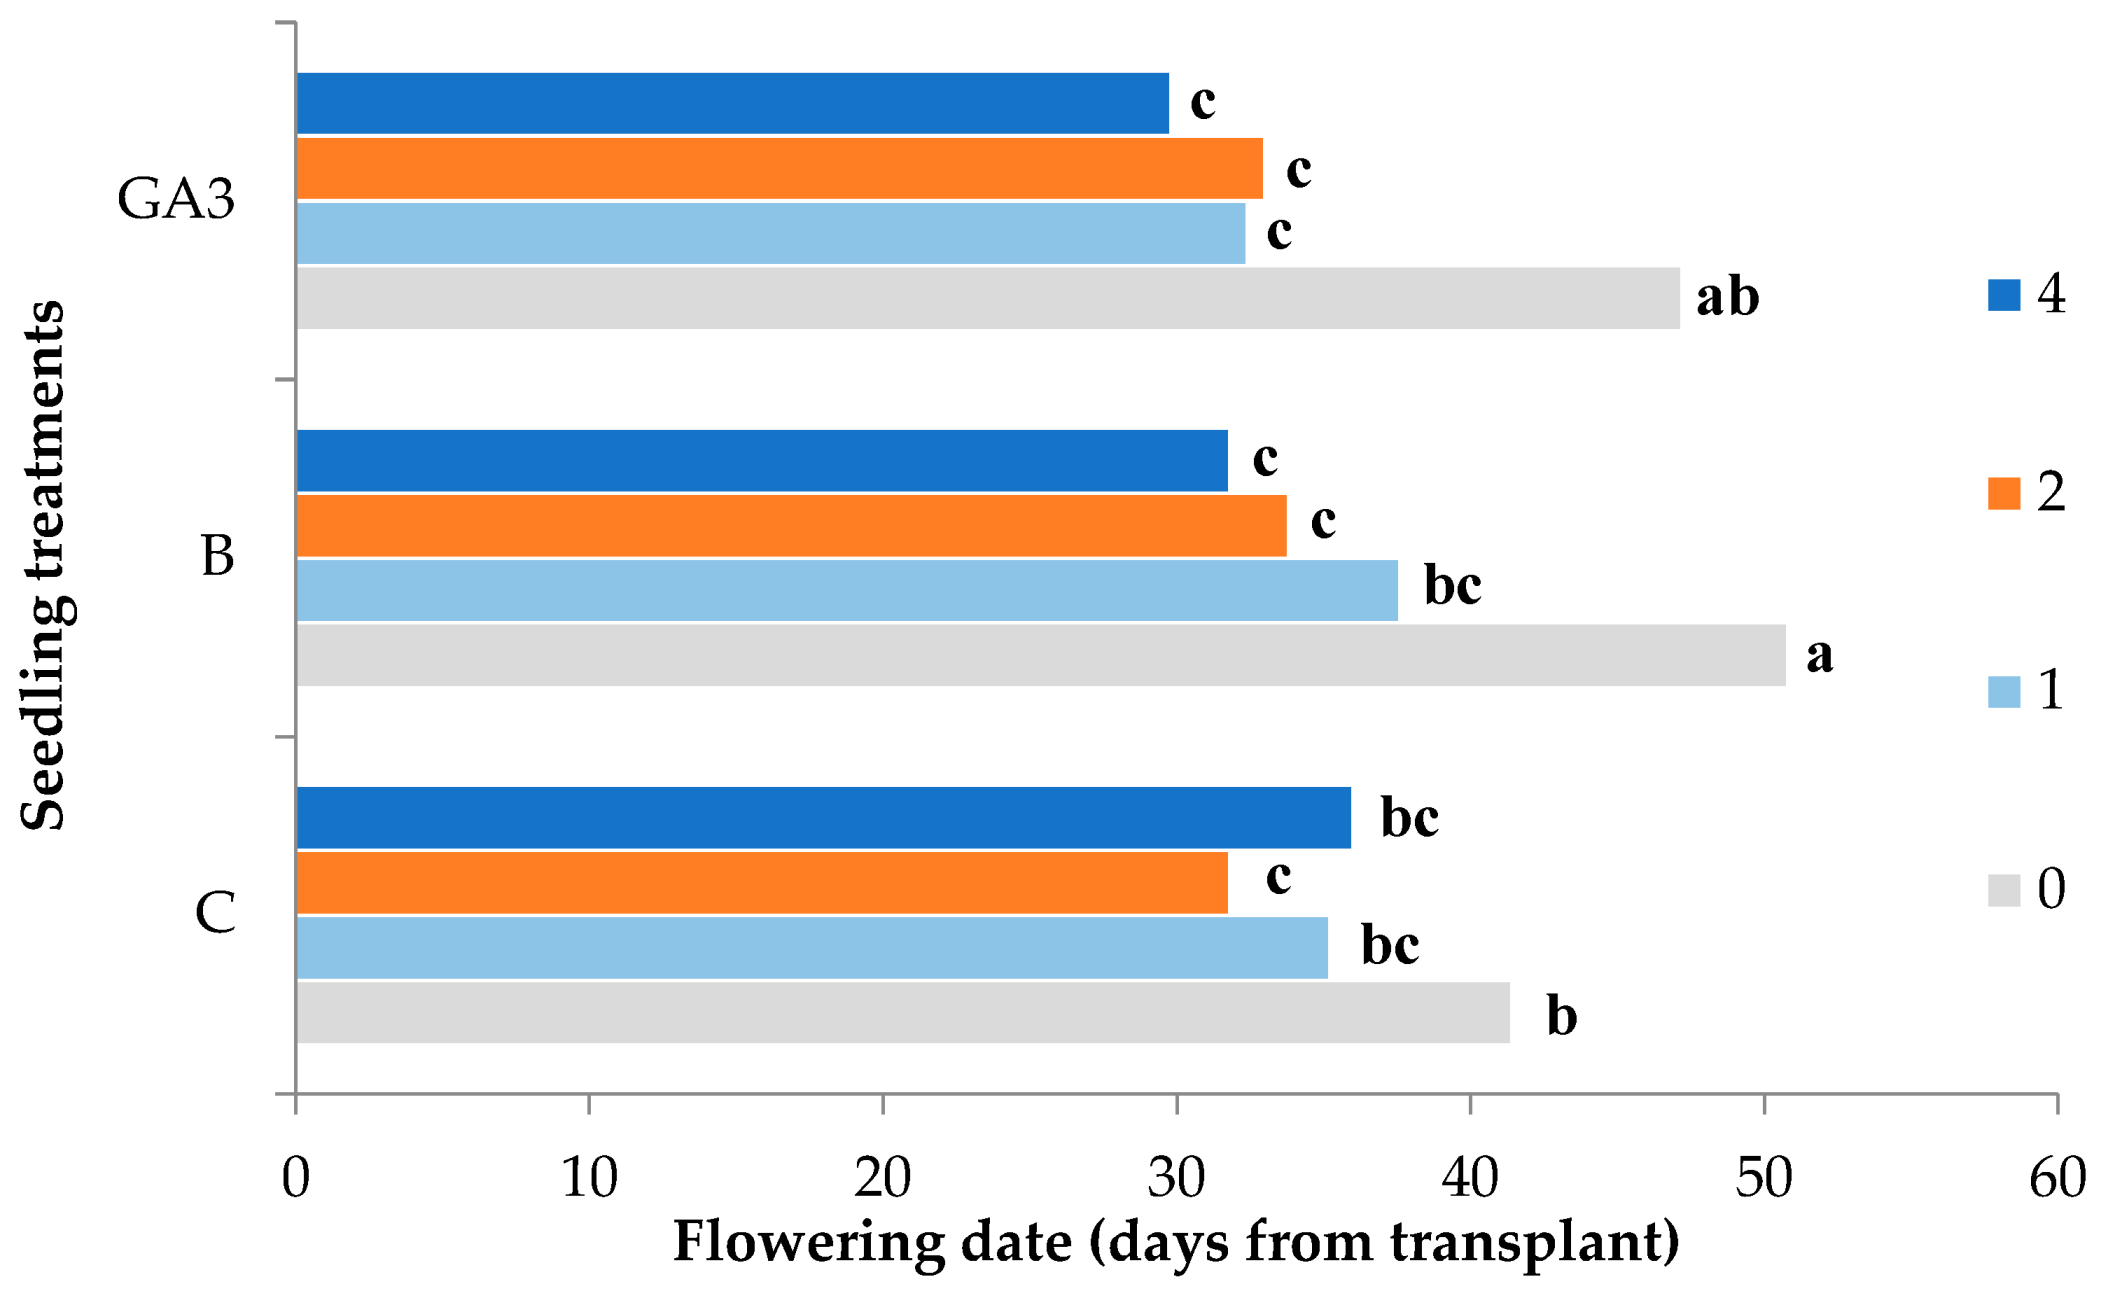
The height of the first flower truss was higher in the plants inoculated in the nursery with the bacterial biostimulant (39.8 cm) than those treated with GA3 (36.8 cm) and significantly increased in the plants fertigated with 2 or 4 d L−1 (42.5 cm on average; +28% compared to the control) (Table 4). These differences were mainly due to an increase in internode length, as the number of nodes below the first flower truss was not influenced by the experimental factors. As reported for flower truss biomass, even the flowering physiology of greenhouse-grown tomato plants was differently affected by the nursery fertigation levels according to the treatment applied to the seedlings. Non-fertigated control seedlings started flowering (at least one flower open) 41.4 days after transplant, whereas a significantly earlier flowering date was recorded with 2 g L−1 of fertilizer during the seedling growth (31.8 d after transplant) (Table 4, Figure 13). The inoculation of the seedling substrate with the bacterial biostimulant significantly delayed the flowering date (+9.4 d compared to the control) of the non-fertigated seedlings; these treatments determined an early flowering date if combined with 2 or 4 g L−1 fertigation (32.8 d after transplant, on average). All the fertigated seedlings that were treated with GA3 had an early flowering date as they flowered 31.7 d after transplant on average.
As reported above, the leaves of the tomato plants were the greater part of fresh biomass and were heavier in the nursery-fertigated plants. The same effect was recorded for the number of leaves per plant that increased from 16.7 leaves plant−1 to 19.4 leaves plant−1 on average in the plants that were fertigated in the nursery (Table 5). The experimental factor affected the average leaf area but to a greater extent in control plants, which showed a significant expansion of the leaf area as the concentration of nutrients applied by fertigation increased (Table 5). The total leaf area per plant was 3164.7 cm2 plant−1 on average in the control plants and dropped significantly only in the plants inoculated with the bacterial biostimulant (−10.4%) (Table 5). The increase in nutrient supply during the seedlings’ growth determined an increase in plant leaf area that followed a quadratic trend (R2 = 0.952***) ranging from 2426.7 cm2 plant−1 (0 g L−1) to 3993.0 cm2 plant−1 (4 g L−1) (Table 5). The specific leaf area (SLA) was almost constant as the nursery fertigation in the untreated plants varied as well as in those inoculated with the bacterial biostimulant. The plants treated with GA3 during seedling growth showed a significant decrease in SLA in all the fertigated treatments (Table 5).
No effect of the experimental factor was recorded on the stomatal conductance of tomato plants during the greenhouse growth (Table 5).
The color of the leaves was darker in the plants inoculated with the bacterial biostimulant and became significantly darker when increasing the fertigation concentration from 0 to 4 g L−1 (Table 5). The increase in fertigation level negatively affected the saturation of the untreated or GA3-treated plants, whereas the plants inoculated with bacteria showed a low saturation level at every fertigation rate (Table 5). The hue angle recorded a small but significant reduction in the nursery-treated plants. On the contrary, the raise of fertigation concentration supplied to the seedlings determined a significant increase from a lighter green to a more intense green (Table 5).

4. Discussion

Many factors may affect seedling quality, such as water and nutrient availability, substrate characteristics and volume, and the thermal and light conditions inside the nursery greenhouse [1,2,3,4,41,42]. Nutrient availability, nitrogen above all, can influence seedling growth, accelerate shoot growth at the expense of root growth, and reduce the percentage of shoot dry matter [41]. These parameters could be positively or negatively related to seedling establishment in the field and should be enhanced by carefully optimizing the nutrient supply, thus also achieving a reduction in the environmental pollution and leaching risks. In our work, we investigated the possibility to improve seedling quality and their establishment after the transplant in the field by combining different levels of nutrient supply with the application of a bacterial biostimulant or gibberellic acid. These experimental factors interacted and showed the chance to modify the seedling response to nutrient supply.
The growth of the tomato seedlings increased curvilinearly in relation to the fertigation rates. This trend confirmed that the increase in nutrient availability can be worth only up to a certain threshold, over which tomato or other vegetable seedlings cannot efficiently use nitrogen, and the excess of nutrients could even be harmful to seedling strength and quality [2,41,43,44]. Seedling development is a key characteristic of transplants. An excess of water and fertilizer application may determine taller but weaker and softer plants that are more susceptible to diseases, insects, and transplant shock [42]. Nevertheless, seedling development and the amount of biomass it accumulates are related to plant vigor and earliness [4]. The goal of transplant production is to produce short stocky seedlings with thick and strong stems with a deep green color [45]. Therefore, seedling height should not be too high to allow greater greenhouse space efficiency and to improve the ease in shipment and mechanical transplanting [46]. Nevertheless, the well-developed transplants with a higher leaf number can reduce the time from transplant to flowering in greenhouse-grown tomato, thus reducing the greenhouse unproductive stage.
The use of bacterial biostimulant or gibberellic acid modified the response of seedling growth to nutrient availability.
The inoculation of the substrate with Bacillus spp. increased the range between the lowest and the highest value found in the control seedlings as inoculated seedlings showed lower height, stem diameter, and biomass accumulation in the absence of fertigation, but had a greater growth at the highest fertigation rate. It is well known that many Bacillus species can exert a plant growth-promoting effect [32,47,48], nevertheless, the growth and metabolic activity of rhizobacteria are narrowed by nutrient availability that can also influence the number of bacteria in the rhizosphere [49,50]. In some soil conditions, most of the mineral N can be immobilized into the soil microbial biomass within few hours after supplementation [51], especially when a lack of organic C materials from active plant roots represent a limiting factor for rhizosphere microflora [52] as in the case of the sowing substrate. Thus, the nutrient competition between seedlings and the high bacteria population of the inoculated substrate probably limited plant growth and biomass accumulation [53,54]. On the contrary, the fertigation reduced this competition and increased root growth allowing the seedlings with the highest nutrient availability to benefit from the Bacillus growth-promoting activity [48].
The exogenous supplementation of gibberellic acid to tomato seedlings enhanced seedling growth at the two highest fertigation rates. The GA3-treated seedlings showed similar or even higher growth parameters (plant height, fresh and dry biomass accumulation, leaf number and leaf area) compared to the control seedlings fed with 4 g L−1 of fertilizer but with half of the nutrients. Spraying exogenous gibberellic acid at a very low concentration has been used to improve the morpho-physiological and yield characteristics of many vegetable crops [8,18,37,38]. Gibberellins can play an important role in plant growth and development and regulate plant height and organ size through the promotion of both cell elongation and cell division [55,56]. They also promote the biomass production [17,57] of vegetative parts by fostering DNA, RNA, and protein synthesis [58,59,60], ribose, and polyribosome multiplication [61] and improving enzyme activity [62] and membrane permeability [63]. The latter may have a role in the improvement of the uptake and use of mineral nutrients [64,65,66,67] and the transport of photosynthates [68,69], hence explaining the higher efficiency of GA3-treated seedlings against control seedlings. The accumulation of the assimilates in the leaves, but most of all their transport in the stems, was another effect that characterized the GA3-treated seedlings fed with the higher fertigation rates and that determined a higher shoot/root ratio with 2 g L−1 of fertilizer. Exogenous GA3 may markedly change the morphological traits of plants and promote biomass allocation to leaves and stem, increasing the shoot/root ratio [9,15]. Moreover, Sugiura et al. [70] found that GA3-mediated biomass accumulation in leaves and stem occurs only in seedlings grown under high nitrogen availability, as found in our work. The biomass partitioning can strongly affect tomato transplant quality as it has been shown that the increase in stem dry weight is an indicator of seedling vigor and promotes plant earliness [43].
Even if biomass production and translocation varied among seedling treatments with an increasing fertigation rate, the percentage of shoot dry matter decreased only as a function of increased fertigation rate, with the lowest percentages obtained at the two highest level of fertigation. This effect of N availability was already reported for celery, lettuce, broccoli, pepper and tomato [41,71]. The percentage of the shoot dry matter of tomato transplant higher than 10% results in improved cold resistance and seedling quality [72]. Moreover, an overfertilized transplant with increased succulence is more susceptible to be broken during transplanting [73].
The increase in fertigation rate raised the N available for transplants and increased the physiological age of the seedlings as evidenced by the leaf number. This positive relationship was found also by other authors that noticed an increase in seedling growth rate and a higher leaf area with higher N availability [4,74,75,76]. We also found a positive effect of fertigation rate on seedling leaf area, but this effect was more evident in GA3-treated seedlings. Gibberellic acid increased both the leaf number and the average leaf area resulting in a higher total leaf area compared to the control at 2 g L−1 of fertilizer. GA3 can influence nitrogen metabolism and nitrogen redistribution in plants, thus increasing nitrogen use efficiency (NUE) by improving N utilization in leaves and stems; the supply of exogenous GA3 may influence the transport of assimilates towards shoot apex and young leaves, helping in the utilization of nitrogen and thus resulting in the increased leaf number and physiological age [77]. In our work, we found the highest increase in NUE in GA3-treated seedlings (+19.1% and +23.2%, respectively, with 2 and 4 g L−1 of fertilizer), whereas the inoculated seedlings had the worst NUE at the lowest fertigation rates (0 and 1 g L−1) and did not differ from GA3-treated seedlings at the highest fertigation rates (2 and 4 g L−1), confirming that part of the nitrogen supplied was immobilized by bacteria determining the nutritional stress to tomato seedlings.
The increase in nutrient availability allowed seedlings to use the irrigation water more efficiently in the seedlings treated with GA3 or inoculated with the bacterial biostimulant and fertigated with 2 g L−1 of fertilizer. This goal was probably reached in different ways. GA3-treated plants may have reduced water consumption by reducing water transpiration thanks to the lower stomatal conductance. A decrease in the stomatal resistance and an increase in WUE in tomato plants due to the application of GA3 was reported also by Maggio et al. [35]. The bacterial inoculum had a different effect on stomatal conductance as this parameter increased by increasing the fertigation rate. Bacillus spp. can induce an increase in transpiration along with an increase in photosynthetic rate [78,79,80], thus increasing dry matter accumulation and WUE. Moreover, the increased photosynthetic activity caused by plant growth-promoting rhizobacteria can be a consequence of stimuli effect on chlorophyll formation [78]. This effect could be indirectly confirmed by color modifications recorded in seedling leaves, as those inoculated with the bacterial biostimulant showed a more intense green color than the others. An increase in chlorophyll formation could also be ascribed to the increase in nitrogen supply that increased the hue angle of the leaf color resulting in a darker green. The changes in leaf color were determined by changes in the pigment content (chlorophylls and carotenoids) that are highly related to the color components measured with a colorimeter [81,82,83]. They can be symptoms of nutrient deficiencies or excesses and are an indicator of the plant’s nutritional or stress status [11,84] as found in our work, by increasing nutrient supply to the control and GA3-treated seedlings.
Transplant characteristics are of paramount importance for seedling quality and their recovery after transplant. Moreover, the growing conditions that vegetable seedlings undergo during their first weeks of growth may affect the future yield of vegetable crops [41,43,85]. In our work, we confirmed that the nutritional condition during nursery growth has an important role in the recovery of young tomato plants after transplant and in their early growth and flowering, but we also noticed that seedling treatments can significantly interact with nutrient availability during nursery growth modifying tomato plant response after transplant. Plant growth and biomass accumulation were related to seedling biomass, but the growth rate after transplant and biomass partitioning were also affected by seedling treatments. Thus, the biomass accumulation in vegetable seedling can be an index of plant performance in the field [4,41] and can guide in choosing the optimal fertigation rate for vegetable transplants. The search for higher seedling age and development to obtain plants that grow faster and have an earlier flowering and production should also consider the field conditions where seedlings are transplanted. High nutrient levels in the nursery can increase seedling growth and influence plant growth and productivity, but in this condition, seedlings may be characterized by low structural strength and lack hardening [43]. These characteristics are related to good seedling establishment after transplant and field survival in sub-optimal environmental conditions. Thus, the growth environment should be considered for the fertigation management of tomato seedlings; higher nursery fertigation rate can increase plant growth and early flowering that could be favorable under controlled greenhouse conditions, whereas a lower nursery fertigation rate can increase the hardiness of tomato seedlings and ensure their ability to withstand the physical stress of handling and long-distance shipping, as well as their survival in adverse field environments [43,45].
The highest fertigation rates had a greater effect on tomato growth rate during early tomato growth, but at the end of the experiment, all the nursery-fertigated plants recorded no differences in the growth of vegetative parts (roots, stem, and leaves). The GA3 treatment or bacterial inoculation at the nursery stage showed long-term effects on tomato plants during soilless greenhouse cultivation but these effects were greater for the bacterial biostimulant. Even if they did not affect leaf biomass, some modification of leaf characteristics was recorded. GA3 determined a reduction of leaf thickness (lower SLA) that corresponded to a decrease in green color intensity. Moreover, the GA3 delayed plant flowering when the seedlings were not fertigated and reached the highest biomass accumulation in the inflorescences only with the highest fertigation rate compared to the control plants, which reached the highest inflorescence biomass with 2 g L−1. The effect of GA3 treatments on tomato plants during field growth has been investigated several times, recording a positive effect on the growth, biomass accumulation, yield, and yield attributes [37,86,87,88]. The positive effects of exogenous GA3 application on plant growth and yield under different growth conditions are well known and involve, among others, the modification of source/sink relationships [9,10,11,89] as reported above for tomato seedlings under different fertigation rates. These growth-promoting effects were not evident after the transplant of tomato seedlings, and plant modification due to GA3 treatments was limited to minor parameters. The studies on the application of exogenous gibberellic acid have shown that GA3-treated plants record an increase in bioactive gibberellins (GA1 and GA4) and a modification of internal hormone balance [86,90,91]. In our study, foliar GA3 spray positively affected seedling growth while the effect on plant growth was poor. This could suggest that the modifications of plant physiology and hormonal balance are not long term and depend on the physiological age of the plants sprayed with GA3.
The bacterial inoculum of seedlings had longer-term effects than GA3 treatment, but these effects were noticeable mainly when the bacterial biostimulant was associated with the highest fertigation rate. This could suggest that the bacterial biostimulant colonized the seedling rhizosphere that could be the vector for soil inoculation after transplant [48]. The highest tomato plants at the end of the experiment were obtained from seedlings inoculated with Bacillus spp. and fertigated with 4 g L−1. These plants showed also an early flowering but most of all, they had a higher biomass accumulation in the trusses due to an increase in fruit setting as compared to the highest control (+77.0%) and GA3-treated values (+82.0%). These effects may be linked with the nitrogen fixation, phosphorus solubilization, and siderophore production of some plant growth-promoting bacteria and their production of phytohormones such as auxins and gibberellins, which can be involved in fruit setting [92]. Moreover, growth-promoting bacteria can induce a higher chlorophyll and carotenoid content in the leaves, which have been reported as some of the mechanisms behind the plant growth promotion of Bacillus strains [92]. Likewise, our results showed that bacterial inoculum induced the modification of leaf color that can be linked to increased pigment content. These mechanisms can improve the nutritional status of tomato plants and stimulate fruit setting trough phytohormone translocation from the rhizosphere to the flowers [92]. This effect could be particularly relevant for the growth of tomatoes in cold greenhouses during winter, where low temperatures can limit flowering and fruit set. Bacillus spp. have been shown to exert their plant growth-promoting effect in good nutritional conditions, whereas under nutrient stress conditions in autumn they may have an adverse effect on yield due to nutritional imbalances in the system, as found in our work during nursery growth [93].

5. Conclusions

The optimal fertigation rate for producing good quality tomato transplants ranged between 2 and 4 g L−1 of a 20-20-20 NPK water-soluble fertilizer, but fertigation management should consider the field conditions where the seedlings are transplanted, choosing between well-developed but weaker seedlings that grow faster and have an earlier flowering, or compact, short stocky seedlings more suitable for shipment, mechanical transplanting and good field survival. Gibberellic acid treatment had a growth-promoting effect on the seedlings that showed a fast and good growth with half of the nutrients needed by control seedlings. The inoculation of the seedling substrate with the bacterial biostimulant containing Bacillus spp. had a negative effect on the seedling growth in limited nutrient availability, whereas it showed a growth-promoting effect under high nutrient conditions. The nutritional condition during nursery growth had an important role in the recovery of young tomato plants after transplant and in their early growth and flowering. All fertigation rates had a positive effect on tomato plant growth in soilless cultivation, but the highest rate improved the flowering earliness, especially in GA3-treated seedlings and inoculated seedlings. The bacterial inoculum of seedlings had longer-term effects than GA3 treatment but needed the highest fertigation rate during nursery growth to exert its positive effect on tomato plant growth and fruit setting.

Author Contributions

Conceptualization, A.M. (Alessandra Moncada), F.V. and A.M. (Alessandro Miceli); data curation, A.M. (Alessandra Moncada), A.E. and A.M. (Alessandro Miceli); formal analysis, A.M. (Alessandro Miceli); investigation, A.M. (Alessandra Moncada), F.V., A.E. and A.M. (Alessandro Miceli); methodology, A.M. (Alessandra Moncada), F.V. and A.M. (Alessandro Miceli); resources, F.V. and A.M. (Alessandro Miceli); supervision, F.V. and A.M. (Alessandro Miceli); validation, A.M. (Alessandra Moncada), F.V. and A.M. (Alessandro Miceli); visualization, A.M. (Alessandro Miceli); writing—original draft, A.M. (Alessandra Moncada), F.V. and A.M. (Alessandro Miceli); writing—review and editing, F.V. and A.M. (Alessandro Miceli) All authors have read and agreed to the published version of the manuscript.

Funding

This research received no external funding.

Conflicts of Interest

The authors declare no conflict of interest.

References

  1. Herrera, F.; Castillo, J.E.; Chica, A.F.; López Bellido, L. Use of municipal solid waste compost (MSWC) as a growing medium in the nursery production of tomato plants. Bioresour. Technol. 2008, 99, 287–296. [Google Scholar] [CrossRef] [PubMed]
  2. Russo, V.M. Biological amendment, fertilizer rate, and irrigation frequency for organic Bll pepper transplant production. HortScience 2006, 41, 1402–1407. [Google Scholar] [CrossRef]
  3. McCall, D. Effect of supplementary light on tomato transplant growth, and the after-effects on yield. Sci. Hortic. 1992, 51, 65–70. [Google Scholar] [CrossRef]
  4. Masson, J.; Tremblay, N.; Gosselin, A. Effects of nitrogen fertilization and HPS supplementary lighting on vegetable transplant production. II. Yield. J. Am. Soc. Hortic. Sci. 1991, 116, 599–602. [Google Scholar] [CrossRef] [Green Version]
  5. Nicola, S.; Cantliffe, D.J. Increasing cell size and reducing medium compression enhance lettuce transplant quality and field production. HortScience 1996, 31, 184–189. [Google Scholar] [CrossRef] [Green Version]
  6. Chen, J.; Huang, Y.; Caldwell, R.D. Best management practices for minimizing nitrate leaching from container-grown nurseries. Sci. World J. 2001, 1, 96–102. [Google Scholar] [CrossRef] [Green Version]
  7. Vetrano, F.; Iapichino, G.; Poma, M.A.; Fascella, S.; Incalcaterra, G. Use of organic fertilizers for lettuce plug plant production. Acta Hortic. 2009, 607–612. [Google Scholar] [CrossRef]
  8. Lee, I.-J. Practical application of plant growth regulator on horticultural crops. J. Hortic. Sci. 2003, 10, 211–217. [Google Scholar]
  9. Miceli, A.; Moncada, A.; Sabatino, L.; Vetrano, F. Effect of Gibberellic Acid on Growth, Yield, and Quality of Leaf Lettuce and Rocket Grown in a Floating System. Agronomy 2019, 9, 382. [Google Scholar] [CrossRef] [Green Version]
  10. Miceli, A.; Vetrano, F.; Sabatino, L.; D’Anna, F.; Moncada, A. Influence of preharvest gibberellic acid treatments on postharvest quality of minimally processed leaf lettuce and rocket. Horticulturae 2019, 5, 63. [Google Scholar] [CrossRef] [Green Version]
  11. Vetrano, F.; Moncada, A.; Miceli, A. Use of Gibberellic Acid to Increase the Salt Tolerance of Leaf Lettuce and Rocket Grown in a Floating System. Agronomy 2020, 10, 505. [Google Scholar] [CrossRef] [Green Version]
  12. Ahemad, M.; Kibret, M. Mechanisms and applications of plant growth promoting rhizobacteria: Current perspective. J. King Saud Univ. Sci. 2014, 26, 1–20. [Google Scholar] [CrossRef] [Green Version]
  13. Basra, A. Plant. Growth Regulators in Agriculture and Horticulture: Their Role and Commercial Uses; CRC Press: Boca Raton, FL, USA, 2000; ISBN 1560228911. [Google Scholar]
  14. Choudhury, S.; Islam, N.; Ali, M. Growth and Yield of Summer Tomato as Influenced by Plant Growth Regulators. Int. J. Agric. Sustain. 2013, 5, 25–28. [Google Scholar] [CrossRef]
  15. Hedden, P.; Thomas, S.G. Gibberellin biosynthesis and its regulation. Biochem. J. 2012, 444, 11–25. [Google Scholar] [CrossRef] [Green Version]
  16. Brock, T.G. Combined effects of hormones and light during growth promotion in primary leaves of Phaseolus vulgaris. Can. J. Bot. 1993, 71, 501–505. [Google Scholar] [CrossRef]
  17. Emongor, V.E. Effect of benzyladenine and gibberellins on growth, yield and yield components of common bean (Phaseolus vulgaris). UNISWA. Res. J. Agric. Sci. Technol. 2002, 6, 65–72. [Google Scholar] [CrossRef]
  18. Khan, N.A. Comparative effect of modes of gibberellic acid application on photosynthetic biomass distribution and productivity of rapeseed-mustard. Physiol. Mol. Biol. Plants 2003, 9, 141–145. [Google Scholar]
  19. Richards, D.E.; King, K.E.; Ait-ali, T.; Harberd, N.P. How gibberellin regulates plant growth and development: A molecular genetic analysis of gibberellin signaling. Annu. Rev. Plant. Physiol. Plant Mol. Biol. 2001, 52, 67–88. [Google Scholar] [CrossRef] [Green Version]
  20. Balaguera-López, H.E.; Cárdenas-Hernández, J.F.; Álvarez-Herrera, J.G. Effect of gibberellic acid (GA3) on seed germination and growth of tomato (Solanum lycopersicum L.). Acta Hortic. 2009, 141–148. [Google Scholar] [CrossRef]
  21. Cleland, R.E. Introduction: Nature, occurrence and functioning of plant hormones. In Biochemistry and Molecular Biology of Plant Hormones; Hooykaas, P.J.J., Hall, M.A., Libbenga, K.R., Eds.; Elsevier: Amsterdam, The Netherlands, 1999; Volume 33, pp. 3–22. [Google Scholar]
  22. Drobek, M.; Frąc, M.; Cybulska, J. Plant biostimulants: Importance of the quality and yield of horticultural crops and the improvement of plant tolerance to abiotic stress—A review. Agronomy 2019, 9, 335. [Google Scholar] [CrossRef] [Green Version]
  23. Bulgari, R.; Cocetta, G.; Trivellini, A.; Vernieri, P.; Ferrante, A. Biostimulants and crop responses: A review. Biol. Agric. Hortic. 2015, 31, 1–17. [Google Scholar] [CrossRef]
  24. European Union. Regulation No 1107/2009 of the European Parliament and of the Council of 21 October 2009 concerning the placing of plant protection products on the market and repealing Council Directives 79/117/EEC and 91/414/EEC. Off. J. Eur. Union 2009, 309, 1–50. [Google Scholar]
  25. European Union. No 1069/2009, Regulation (EC) No 1069/2009 of the European Parliament and of the Council of 21 October 2009 laying down health rules as regards animal by-products and derived products not intended for human consumption and repealing Regulation (EC) No 177. Off. J. Eur. Union 2009, 300, 1–33. [Google Scholar]
  26. du Jardin, P. Plant biostimulants: Definition, concept, main categories and regulation. Sci. Hortic. 2015, 196, 3–14. [Google Scholar] [CrossRef] [Green Version]
  27. García de Salamone, I.E.; Hynes, R.K.; Nelson, L.M. Cytokinin production by plant growth promoting rhizobacteria and selected mutants. Can. J. Microbiol. 2001, 47, 404–411. [Google Scholar] [CrossRef]
  28. Ruzzi, M.; Aroca, R. Plant growth-promoting rhizobacteria act as biostimulants in horticulture. Sci. Hortic. 2015, 196, 124–134. [Google Scholar] [CrossRef]
  29. Parvaiz, A.; Satyawati, S. Salt stress and phyto-biochemical responses of plants—A review. Plant Soil Environ. 2008, 54, 89–99. [Google Scholar] [CrossRef]
  30. Widnyana, I.K.; Javandira, C. Activities Pseudomonas spp. and Bacillus sp. to Stimulate Germination and Seedling Growth of Tomato Plants. Agric. Agric. Sci. Procedia 2016, 9, 419–423. [Google Scholar] [CrossRef] [Green Version]
  31. Oancea, F.; Răut, I.; Zamfiropol-Cristea, V. Influence of soil treatment with microbial plant biostimulant on tomato yield and quality. J. Int. Sci. Publ. Agric. Food 2017, 5, 156–165. [Google Scholar]
  32. Joo, G.-J.; Kim, Y.-M.; Lee, I.-J.; Song, K.-S.; Rhee, I.-K. Growth promotion of red pepper plug seedlings and the production of gibberellins by Bacillus cereus, Bacillus macroides and Bacillus pumilus. Biotechnol. Lett. 2004, 26, 487–491. [Google Scholar] [CrossRef]
  33. Gholami, A.; Shahsavani, S.; Nezarat, S. The Effect of plant growth promoting rhizobacteria (PGPR) on germination, seedling growth and yield of maize. Int. Sch. Sci. Res. Innov. 2009, 3, 9–14. [Google Scholar]
  34. Feller, C.; Bleiholder, H.; Buhr, L.; Hack, H.; Hess, M.; Klose, R.; Meier, U.; Stauss, R.; van den Boom, T.; Weber, E. Phanologische Entwicklungsstadien von Gemusepflanzen II. Fruchtgemuse und Hulsenfruchte. Nachr. Des Dtsch. Pflanzenschutzd. 1995, 47, 217–232. [Google Scholar]
  35. Maggio, A.; Barbieri, G.; Raimondi, G.; de Pascale, S. Contrasting Effects of GA 3 Treatments on Tomato Plants Exposed to Increasing Salinity. J. Plant Growth Regul. 2010, 29, 63–72. [Google Scholar] [CrossRef]
  36. Kazemi, M. Effect of gibberellic acid and potassium nitrate spray on vegetative growth and reproductive characteristics of tomato. J. Biol. Environ. Sci. 2014, 8, 1–9. [Google Scholar]
  37. Khan, M.M.A.; Gautam, C.; Mohammad, F.; Siddiqui, M.H.; Naeem, M.; Khan, M.N. Effect of gibberellic acid spray on performance of tomato. Turk. J. Biol. 2006, 30, 11–16. [Google Scholar]
  38. Gelmesa, D.; Abebie, B.; Desalegn, L. Effects of gibberellic acid and 2, 4-dichlorophenoxyacetic acid spray on fruit yield and quality of tomato (Lycopersicon esculentum Mill.). J. Plant Breed. Crop Sci. 2010, 2, 316–324. [Google Scholar]
  39. Fageria, N.K.; Baligar, V.C.; Li, Y.C. The role of nutrient efficient plants in improving crop yields in the twenty first century. J. Plant Nutr. 2008, 31, 1121–1157. [Google Scholar] [CrossRef]
  40. McGuire, R.G. Reporting of objective color measurements. HortScience 1992, 27, 1254–1255. [Google Scholar] [CrossRef] [Green Version]
  41. Masson, J.; Tremblay, N.; Gosselin, A. Nitrogen fertilization and HPS supplementary lighting influence vegetable transplant production. I. Transplant growth. J. Am. Soc. Hortic. Sci. 1991, 116, 594–598. [Google Scholar] [CrossRef] [Green Version]
  42. Schrader, W.L. Using Transplants in Vegetable Production; UCANR Publications: Davis, CA, USA, 2000; ISBN 1601071930. [Google Scholar]
  43. Liptay, A.; Nicholls, S. Nitrogen Supply during Greenhouse Transplant Production Affects Subsequent Tomato Root Growth in the Field. J. Am. Soc. Hortic. Sci. 1993, 118, 339–342. [Google Scholar] [CrossRef] [Green Version]
  44. Kloepper, J.W.; Reddy, M.S.; Rodriguez-Kabana, R.; Kenney, D.S.; Kokalis-Burelle, N.; Martinez-Ochoa, N.; Vavrina, C.S. Application for rhizobacteria in transplant production and yield enhancement. Acta Hortic. 2004, 631, 217–229. [Google Scholar] [CrossRef]
  45. Latimer, J.G. Mechanical conditioning to control height. Horttechnology 1998, 8, 529–534. [Google Scholar] [CrossRef] [Green Version]
  46. Dufault, R.J. Vegetable transplant nutrition. Horttechnology 1998, 8, 515–523. [Google Scholar] [CrossRef] [Green Version]
  47. Shao, J.; Xu, Z.; Zhang, N.; Shen, Q.; Zhang, R. Contribution of indole-3-acetic acid in the plant growth promotion by the rhizospheric strain Bacillus amyloliquefaciens SQR9. Biol. Fertil. Soils 2015, 51, 321–330. [Google Scholar] [CrossRef]
  48. Vetrano, F.; Miceli, C.; Angileri, V.; Frangipane, B.; Moncada, A.; Miceli, A. Effect of Bacterial Inoculum and Fertigation Management on Nursery and Field Production of Lettuce Plants. Agronomy 2020, 10, 1477. [Google Scholar] [CrossRef]
  49. Ekin, Z.; Faruk, O.; Erman, M.; Erdal, Ö. The effect of Bacillus sp. OSU-142 inoculation at various levels of nitrogen fertilization on growth, tuber distribution and yield of potato (Solanum tuberosum L.). Afr. J. Biotechnol. 2009, 8, 4418–4424. [Google Scholar]
  50. Welbaum, G.E.; Sturz, A.V.; Dong, Z.; Nowak, J. Managing soil microorganisms to improve productivity of agro-ecosystems. CRC Crit. Rev. Plant Sci. 2004, 23, 175–193. [Google Scholar] [CrossRef]
  51. Jingguo, W.; Bakken, L.R. Competition for nitrogen during mineralization of plant residues in soil: Microbial response to C and N availability. Soil Biol. Biochem. 1997, 29, 163–170. [Google Scholar] [CrossRef] [Green Version]
  52. Rovira, A.D.; Davey, C.B. Biology of the rhizosphere. In The Plant Root and its Environment; Carson, E., Ed.; University of Virginia Press: Charlottesville, VA, USA, 1974; ISBN 978-0813904115. [Google Scholar]
  53. Oliveira, A.L.M.; Urquiaga, S.; Döbereiner, J.; Baldani, J.I. The effect of inoculating endophytic N2-fixing bacteria on micropropagated sugarcane plants. Plant Soil 2002, 242, 205–215. [Google Scholar] [CrossRef]
  54. Moncada, A.; Miceli, A.; Vetrano, F. Use of plant growth-promoting rhizobacteria (PGPR) and organic fertilization for soilless cultivation of basil. Sci. Hortic. 2021, 275, 109733. [Google Scholar] [CrossRef]
  55. Achard, P.; Gusti, A.; Cheminant, S.; Alioua, M.; Dhondt, S.; Coppens, F.; Beemster, G.T.S.; Genschik, P. Gibberellin Signaling Controls Cell Proliferation Rate in Arabidopsis. Curr. Biol. 2009, 19, 1188–1193. [Google Scholar] [CrossRef] [PubMed]
  56. Ubeda-Tomás, S.; Federici, F.; Casimiro, I.; Beemster, G.T.S.; Bhalerao, R.; Swarup, R.; Doerner, P.; Haseloff, J.; Bennett, M.J. Gibberellin Signaling in the Endodermis Controls Arabidopsis Root Meristem Size. Curr. Biol. 2009, 19, 1194–1199. [Google Scholar] [CrossRef] [PubMed] [Green Version]
  57. Gupta, V.N.; Datta, S.K. Influence of gibberellic acid (GA3) on growth and flowering in chrysanthemum (Chrysanthemummorifolium, Ramat) cv. Jayanti. Indian J. Plant Physiol. 2001, 6, 420–422. [Google Scholar]
  58. Huttly, A.K.; Phillips, A.L. Gibberellin-regulated plant genes. Physiol. Plant. 1995, 95, 310–317. [Google Scholar] [CrossRef]
  59. van Huizen, R.; Ozga, J.A.; Reinecke, D.M. Influence of auxin and gibberellin on in vivo protein synthesis during early pea fruit growth. Plant. Physiol. 1996, 112, 53–59. [Google Scholar] [CrossRef] [Green Version]
  60. Cohn, N.S.; Zhang, L.; Mitchell, J.P.; Vierheller, C.-Z.J. Gibberellin-stimulated changes in abundance of two mRNAs in the developing shoot of dwarf peas (Pisum sativum L.). Int. J. Plant Sci. 1994, 155, 498–505. [Google Scholar] [CrossRef]
  61. Shiri, Y.; Solouki, M.; Ebrahimie, E.; Emamjomeh, A.; Zahiri, J. Gibberellin causes wide transcriptional modifications in the early stage of grape cluster development. Genomics 2020, 112, 820–830. [Google Scholar] [CrossRef]
  62. Siddiqui, M.H.; Khan, M.N.; Mohammad, F.; Khan, M.M.A. Role of nitrogen and gibberellin (GA3) in the regulation of enzyme activities and in osmoprotectant accumulation in Brassica juncea L. under salt stress. J. Agron. Crop. Sci. 2008, 194, 214–224. [Google Scholar] [CrossRef]
  63. De Freitas, S.T.; Jiang, C.-Z.; Mitcham, E.J. Mechanisms involved in calcium deficiency development in tomato fruit in response to gibberellins. J. Plant Growth Regul. 2012, 31, 221–234. [Google Scholar] [CrossRef]
  64. Khan, N.A.; Ansari, H.R. Effect of gibberellic acid spray during ontogeny of mustard on growth, nutrient uptake and yield characteristics. J. Agron. Crop. Sci. 1998, 181, 61–63. [Google Scholar] [CrossRef]
  65. Al-Wakeel, S.A.M.; Dadoura, S.S.; Hamed, A.A. Interactive effects of water stress and gibberellic acid on mineral composition of fenugreek plant. Egypt. J. Rhysiological Sci. 1994, 18, 269–272. [Google Scholar]
  66. Ansari, H. Effect of Some Phytohormones and NPK on Growth and Metabolism of Mustard. Ph.D. Thesis, Aligarh Muslim University, Aligarh, India, 1996. [Google Scholar]
  67. Cramer, M.D.; Nagel, O.W.; Lips, S.H.; Lambers, H. Reduction, assimilation and transport of N in normal and gibberellin-deficient tomato plants. Physiol. Plant. 1995, 95, 347–354. [Google Scholar] [CrossRef]
  68. Estruch, J.J.; Peretó, J.G.; Vercher, Y.; Beltrán, J.P. Sucrose loading in isolated veins of Pisum sativum: Regulation by abscisic acid, gibberellic acid, and cell turgor. Plant. Physiol. 1989, 91, 259–265. [Google Scholar] [CrossRef] [PubMed] [Green Version]
  69. Xu, Z.; Wang, Q.-M.; Guo, Y.-P.; Guo, D.-P.; Shah, G.A.; Liu, H.-L.; Mao, A. Stem-swelling and photosynthate partitioning in stem mustard are regulated by photoperiod and plant hormones. Environ. Exp. Bot. 2008, 62, 160–167. [Google Scholar] [CrossRef]
  70. Sugiura, D.; Sawakami, K.; Kojima, M.; Sakakibara, H.; Terashima, I.; Tateno, M. Roles of gibberellins and cytokinins in regulation of morphological and physiological traits in Polygonum cuspidatum responding to light and nitrogen availabilities. Funct. Plant Biol. 2015, 42, 397–409. [Google Scholar] [CrossRef] [PubMed] [Green Version]
  71. Tremblay, N.; Senecal, M. Nitrogen and potassium in nutrient solution influence seedling growth of four vegetable species. HortScience 1988, 23, 1018–1020. [Google Scholar]
  72. Tesi, R.; Tallarico, R. L’indurimento delle piantine di pomodoro in vivaio e loro resistenza al freddo. Colt. Prolette 1984, 11, 49–54. [Google Scholar]
  73. Kratky, B.A.; Mishima, H.Y. Foliar Fertilization during Transplant Production. J. Am. Soc. Hortic. Sci 1981, 106, 3–7. [Google Scholar]
  74. Vavrina, C.S.; Hochmuth, G.J.; Cornell, J.A.; Olson, S.M. Nitrogen fertilization of Florida-grown tomato transplants: Seasonal variation in greenhouse and field performance. HortScience 1998, 33, 251–254. [Google Scholar] [CrossRef] [Green Version]
  75. Melton, R.R.; Dufault, R.J. Nitrogen, phosphorus, and potassium fertility regimes affect tomato transplant growth. HortScience 1991, 26, 141–142. [Google Scholar] [CrossRef] [Green Version]
  76. Nicola, S.; Basoccu, L. Nitrogen and n,p,k relation affect tomato seedling growth, yield and earliness. Acta Hortic. 1994, 95–102. [Google Scholar] [CrossRef]
  77. Khan, N.A.; Mir, R.; Khan, M.; Javid, S. Effects of gibberellic acid spray on nitrogen yield efficiency of mustard grown with different nitrogen levels. Plant Growth Regul. 2002, 38, 243–247. [Google Scholar] [CrossRef]
  78. Stefan, M.; Munteanu, N.; Stoleru, V.; Mihasan, M. Effects of inoculation with plant growth promoting rhizobacteria on photosynthesis, antioxidant status and yield of runner bean. Rom. Biotechnol. Lett. 2013, 18, 8132–8143. [Google Scholar]
  79. Stefan, M.; Munteanu, N.; Stoleru, V.; Mihasan, M.; Hritcu, L. Seed inoculation with plant growth promoting rhizobacteria enhances photosynthesis and yield of runner bean (Phaseolus coccineus L.). Sci. Hortic. 2013, 151, 22–29. [Google Scholar] [CrossRef]
  80. Han, H.S.; Lee, K.D. Plant growth promoting rhizobacteria effect on antioxidant status, photosynthesis, mineral uptake and growth of lettuce under soil salinity. Res. J. Agric. Biol. Sci. 2005, 1, 210–215. [Google Scholar]
  81. Miceli, A.; Miceli, C. Effect of nitrogen fertilization on the quality of swiss chard at harvest and during storage as minimally processed produce. J. Food Qual. 2014, 37, 125–134. [Google Scholar] [CrossRef]
  82. Ihl, M.; Shene, C.; Scheuermann, E.; Bifani, V. Correlation for pigment content through colour determination using tristimulus values in a green leafy vegetable, swiss chard. J. Sci. Food Agric. 1994, 66, 527–531. [Google Scholar] [CrossRef]
  83. Madeira, A.C.; Ferreira, A.; de Varennes, A.; Vieira, M.I. SPAD Meter Versus Tristimulus Colorimeter to Estimate Chlorophyll Content and Leaf Color in Sweet Pepper. Commun. Soil Sci. Plant Anal. 2003, 34, 2461–2470. [Google Scholar] [CrossRef]
  84. Moncada, A.; Miceli, A.; Sabatino, L.; Iapichino, G.; D’Anna, F.; Vetrano, F. Effect of Molybdenum Rate on Yield and Quality of Lettuce, Escarole, and Curly Endive Grown in a Floating System. Agronomy 2018, 8, 171. [Google Scholar] [CrossRef] [Green Version]
  85. Ciardi, J.A.; Vavrina, C.S.; Orzolek, M.D. Evaluation of tomato transplant production methods for improving establishment rates. HortScience 1998, 33, 229–232. [Google Scholar]
  86. Khalloufi, M.; Martínez-Andújar, C.; Lachaâl, M.; Karray-Bouraoui, N.; Pérez-Alfocea, F.; Albacete, A. The interaction between foliar GA3 application and arbuscular mycorrhizal fungi inoculation improves growth in salinized tomato (Solanum lycopersicum L.) plants by modifying the hormonal balance. J. Plant Physiol. 2017, 214, 134–144. [Google Scholar] [CrossRef] [PubMed]
  87. Saha, P.; Das, N.; Deb, P.; Suresh, C.P. Effect of NAA and GA3 on yield and quality of tomato (Lycopersicon esculentum Mill.). Environ. Ecol. 2009, 27, 1048–1050. [Google Scholar]
  88. Prasad, R.N.; Singh, S.K.; Yadava, R.B.; Chaurasia, S.N.S. Effect of GA3 and NAA on growth and yield of tomato. Veg. Sci. 2013, 40, 195–197. [Google Scholar]
  89. Iqbal, N.; Nazar, R.; Khan, M.I.R.; Masood, A.; Khan, N.A. Role of gibberellins in regulation of source–sink relations under optimal and limiting environmental conditions. Curr. Sci. 2011, 100, 998–1007. [Google Scholar]
  90. Hamayun, M.; Khan, S.A.; Khan, A.L.; Shin, J.-H.; Ahmad, B.; Shin, D.-H.; Lee, I.-J. Exogenous gibberellic acid reprograms soybean to higher growth and salt stress tolerance. J. Agric. Food Chem. 2010, 58, 7226–7232. [Google Scholar] [CrossRef]
  91. Gonai, T.; Kawahara, S.; Tougou, M.; Satoh, S.; Hashiba, T.; Hirai, N.; Kawaide, H.; Kamiya, Y.; Yoshioka, T. Abscisic acid in the thermoinhibition of lettuce seed germination and enhancement of its catabolism by gibberellin. J. Exp. Bot. 2004, 55, 111–118. [Google Scholar] [CrossRef]
  92. Akram, W.; Anjum, T.; Ali, B. Co-cultivation of tomato with two Bacillus strains: Effects on growth and yield. J. Anim. Plant Sci. 2015, 25, 1644–1651. [Google Scholar]
  93. Gul, A.; Kidoglu, F.; Tüzel, Y.; Tüzel, I.H. Effects of nutrition and “Bacillus amyloliquefaciens” on tomato (“Solanum lycopersicum L.”) growing in perlite. Span. J. Agric. Res. 2008, 6, 422–429. [Google Scholar] [CrossRef]
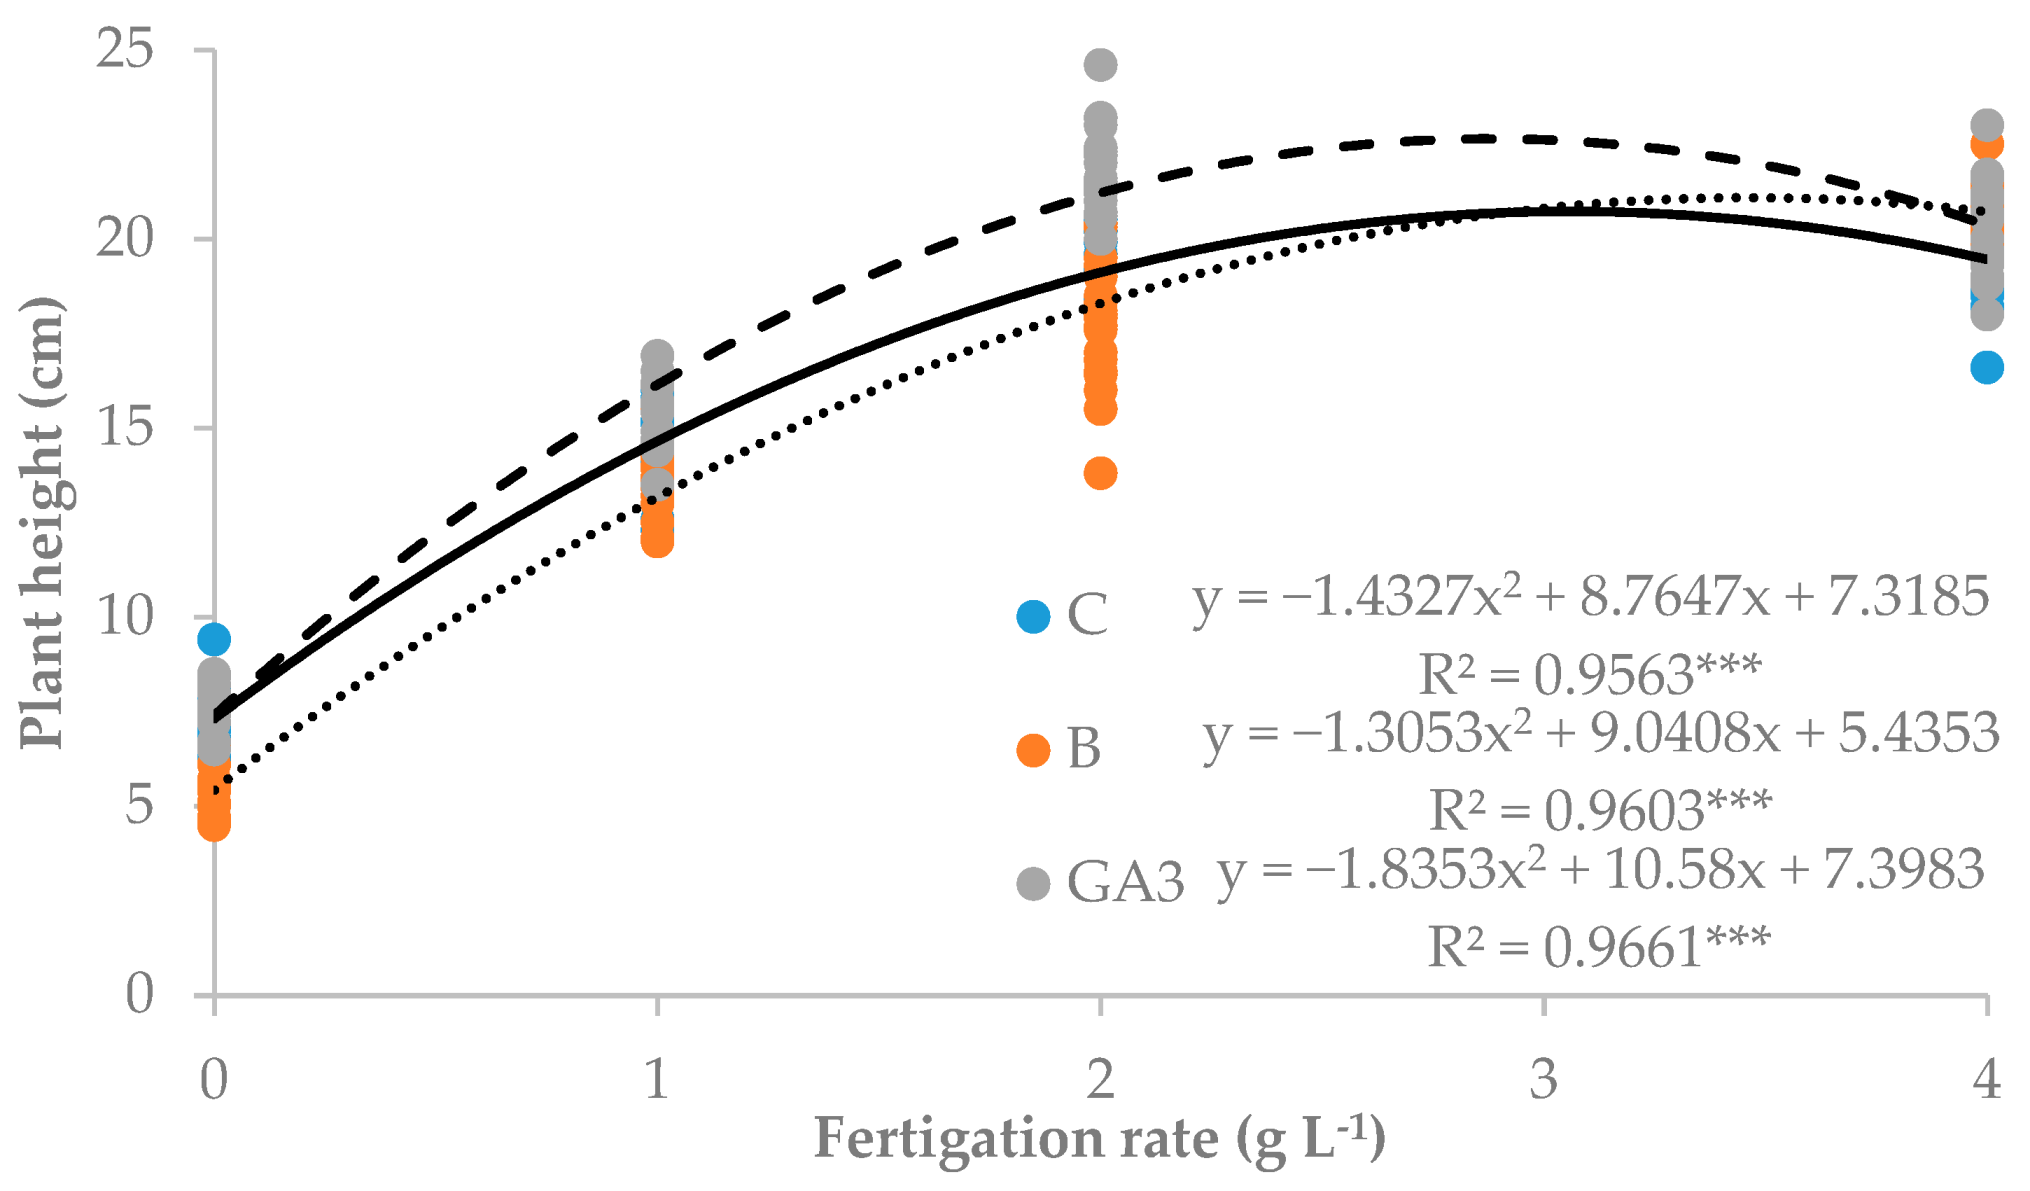
Figure 1. Quadratic predictions of the relationship between the fertigation rates (g L−1 of NPK 20-20-20) and the seedling height values of untreated (C, continuous line), bacterial inoculated (B, dotted line), and gibberellic acid (GA3)-treated (GA3, dashed line) Solanum lycopersicum ‘Marmande’ seedlings (*** significant at p < 0.001).
Agronomy 10 01504 g001
Figure 2. Quadratic predictions of the relationship between the fertigation rates (g L−1 of NPK 20-20-20) and the seedling fresh weight values of untreated (C, continuous line), bacterial inoculated (B, dotted line), and GA3-treated (GA3, dashed line) Solanum lycopersicum ‘Marmande’ seedlings (*** significant at p < 0.001).
Agronomy 10 01504 g002
Figure 3. Effect of the seedling treatments (C, untreated control, B, bacterial biostimulant, GA3, gibberellic acid spray 10−5 M) and the fertigation rates (0, 1, 2 and 4 g L−1 of NPK 20-20-20) on the shoot/root fresh weight ratio of Solanum lycopersicum ‘Marmande’ seedlings (bars with different letters are significantly different at p < 0.05 according to the LSD test).
Agronomy 10 01504 g003
Figure 4. Quadratic predictions of the relationship between the fertigation rates (g L−1 of NPK 20-20-20) and the seedling dry weight values of untreated (C, continuous line), bacterial inoculated (B, dotted line), and GA3-treated (GA3, dashed line) Solanum lycopersicum ‘Marmande’ seedlings (*** significant at p < 0.001).
Agronomy 10 01504 g004
Figure 5. Effect of the seedling treatments (C, untreated control, B, bacterial biostimulant, GA3, gibberellic acid spray 10−5 M) and the nursery fertigation rates (0, 1, 2 and 4 g L−1 of NPK 20-20-20) on the shoot/root fresh weight ratio of Solanum lycopersicum ‘Marmande’ seedlings (bars with different letters are significantly different at p < 0.05 according to the LSD test).
Agronomy 10 01504 g005
Figure 6. Effect of the seedling treatments (C, untreated control, B, bacterial biostimulant, GA3, gibberellic acid spray 10−5 M) and the nursery fertigation rates (0, 1, 2 and 4 g L−1 of NPK 20-20-20) on (a) the water use efficiency (WUE) and (b) the nitrogen use efficiency (NUE) of Solanum lycopersicum ‘Marmande’ seedlings (bars with different letters are significantly different at p < 0.05 according to the LSD test).
Agronomy 10 01504 g006
Figure 7. Effect of the seedling treatments (C, untreated control, B, bacterial biostimulant, GA3, gibberellic acid spray 10−5 M) and the nursery fertigation rates (0, 1, 2 and 4 g L−1 of NPK 20-20-20) on the leaf area of Solanum lycopersicum ‘Marmande’ seedlings (bars with different letters are significantly different at p < 0.05 according to the LSD test).
Agronomy 10 01504 g007
Figure 8. Effect of the seedling treatments (C, untreated control, B, bacterial biostimulant, GA3, gibberellic acid spray 10−5 M) and the nursery fertigation rates (0, 1, 2, and 4 g L−1 of NPK 20-20-20) on Solanum lycopersicum ‘Marmande’ plant growth.
Agronomy 10 01504 g008
Figure 9. Effect of the nursery fertigation rates (g L−1 of NPK 20-20-20) on the total, root, stem, leaves, and trusses fresh biomass of Solanum lycopersicum ‘Marmande’ plants grown in soilless cultivation (bars of the same color with different letters are significantly different at p < 0.05 according to the LSD test).
Agronomy 10 01504 g009
Figure 10. Effect of the seedling treatments (C, untreated control, B, bacterial biostimulant, GA3, gibberellic acid spray 10−5 M) and the nursery fertigation rates (0, 1, 2 and 4 g L−1 of NPK 20-20-20) on the fresh weight of Solanum lycopersicum ‘Marmande’ flower trusses (racemes, flowers, and small fruits) (bars with different letters are significantly different at p < 0.05 according to the LSD test).
Agronomy 10 01504 g010
Figure 11. Effect of the nursery fertigation rates (g L−1 of NPK 20-20-20) on the total, root, stem, leaves, and trusses dry biomass of Solanum lycopersicum ‘Marmande’ plants grown in soilless cultivation (bars of the same color with different letters are significantly different at p < 0.05 according to the LSD test).
Agronomy 10 01504 g011
Figure 12. Effect of the seedling treatments (C, untreated control, B, bacterial biostimulant, GA3, gibberellic acid spray 10−5 M) and the nursery fertigation rates (g L−1 of NPK 20-20-20) on (a) the water use efficiency (WUE) and (b) the nitrogen use efficiency (NUE) of Solanum lycopersicum ‘Marmande’ plants grown in soilless cultivation (bars with different letters are significantly different at p < 0.05 according to the LSD test).
Agronomy 10 01504 g012
Figure 13. Effect of the seedling treatments (C, untreated control, B, bacterial biostimulant, GA3, gibberellic acid spray 10−5 M) and the nursery fertigation rates (0, 1, 2 and 4 g L−1 of NPK 20-20-20) on the flowering date of Solanum lycopersicum ‘Marmande’ plants (bars with different letters are significantly different at p < 0.05 according to the LSD test).
Agronomy 10 01504 g013
Table 1. Effects of the seedling treatments (C, untreated control, B, bacterial biostimulant, GA3, gibberellic acid spray 10−5 M) and the nursery fertigation rates (g L−1 of NPK 20-20-20) on the morphological parameters of Solanum lycopersicum ‘Marmande’ seedlings.
Source of VarianceSeedling Height (cm)Stem Diameter (mm)Seedling Fresh Weight (g FW)Seedling Dry Weight (mg DW)Dry Matter (%)
TotalRootsStemLeavesTotalRootsStemLeaves
Treatment
Cz 15.12.32.070.241.120.70b137.319.057.361.07.8
B14.42.32.060.251.110.69b126.819.052.355.87.5
GA316.32.32.330.241.240.85a160.019.566.074.57.8
NPK (g L−1)
06.72.0d0.660.180.300.18d75.716.7c31.328.012.4a
114.62.1c1.810.280.900.64c128.722.3a50.755.76.9b
219.62.4b2.830.261.561.01b171.720.0ab71.780.05.9c
420.22.6a3.300.251.881.17a189.317.7bc80.391.35.7c
Treatment × NPK
C07.3g2.00.70e0.19bc0.35e0.1783.0d15.037.0ef30.0de12.9
114.7ef2.21.79d0.29a0.89d0.61130.0c21.051.0de55.0c7.0
219.1c2.42.67c0.25ab1.51c0.92153.0bc21.063.0dc69.0bc5.4
419.5c2.73.10b0.22b1.76b1.12183.0ab19.078.0b90.0ab5.9
B05.2h1.80.45f0.15c0.21f0.0953.0e16.022.0g17.0e12.8
113.7f2.11.73d0.29a0.86d0.59110.0cd24.044.0e45.0cd6.2
217.9d2.52.66c0.28a1.44c0.94163.0b21.068.0c74.0b5.9
420.8b2.63.39a0.28ab1.95a1.16181.0ab15.075.0bc87.0ab5.2
GA307.7g2.10.83e0.20bc0.35e0.2891.0d19.035.0f37.0d11.6
115.4e2.11.91d0.25ab0.95d0.71146.0bc22.057.0d67.0bc7.4
221.7a2.43.15b0.25ab1.75b1.16199.0a18.084.0ab97.0a6.3
420.3bc2.63.41a0.26ab1.92a1.23204.0a19.088.0a97.0a6.0
Significance x
Treatment***ns***ns*********ns******ns
NPK********************************
Treatment × NPK***ns*******ns**ns****ns
z Each value is the mean of 4 replicated samples of 30 seedlings each. For each factor, values in a column followed by the same letter are not significantly different, according to the least significant differences (LSD) test. x Significance: ns = not significant; * significant at p < 0.05; ** significant at p < 0.01; *** significant at p < 0.001.
Table 2. Effects of the seedling treatments (C, untreated control, B, bacterial biostimulant, GA3, gibberellic acid spray 10−5 M) and the nursery fertigation rates (g L−1 of NPK 20-20-20) on the leaf characteristics of Solanum lycopersicum ‘Marmande’ seedlings.
Source of VarianceNumber of LeavesLeaf Area (cm2 Seedling−1)Leaf Area
(cm2 Leaf−1)
SLA y
(cm2 g DW−1)
Stomatal Conductance (mmol m2 s−1)L*ChromaHue°
Treatment
Cz 4.0b38.37.3b485.6507.647.934.3136.8b
B4.0b35.77.8ab573.1569.348.233.6139.1a
GA34.6a45.19.1a560.4368.349.235.6136.7b
NPK (g L−1)
02.2c8.43.7c301.1c275.952.639.5136.2d
14.3b33.67.1b552.0b592.049.936.5137.1c
25.1a54.010.5a681.0a506.247.232.6137.9b
45.2a62.810.9a624.6ab552.844.029.4138.9a
Treatment × NPK
C02.18.7fg4.2297.4260.1c52.2b40.4a134.7c
14.233.9de6.2433.3714.3a48.7d36.3b135.9c
24.949.1c10.0718.1600.0ab47.0e31.1d137.8b
45.061.4b9.0493.6456.1b43.5f29.4de138.8ab
B02.04.6g2.3278.3286.2c51.1c36.1b139.0ab
14.028.7e7.2648.7595.9ab50.0cd36.2b139.9a
24.949.5c10.2673.3607.1ab47.9de33.4c138.8ab
45.260.2b11.6692.0787.8a43.7f28.7e138.8ab
GA302.612.0f4.6327.5281.4c54.6a42.0a135.0c
14.838.1d8.0574.1465.8b51.0c37.1b135.5c
25.663.4ab11.4651.7311.6c46.6e33.2c137.1bc
45.566.9a12.3688.2414.6bc44.6f30.1de139.2ab
Significance x
Treatment*******ns***********
NPK************************
Treatment × NPKns*nsns**********
z Each value is the mean of 4 replicated samples of 30 seedlings each. For each factor, values in a column followed by the same letter are not significantly different, according to the LSD test. x Significance: ns = not significant; * significant at p < 0.05; ** significant at p < 0.01; *** significant at p < 0.001; y Specific leaf area.
Table 3. Effects of the seedling treatments (C, untreated control, B, bacterial biostimulant, GA3, gibberellic acid spray 10−5 M) and the nursery fertigation rates (g L−1 of NPK 20-20-20) on the morphological parameters of Solanum lycopersicum ‘Marmande’ plants grown in soilless cultivation.
Source of VariancePlant Height (cm)Stem Diameter (mm)Plant Fresh Weight (g FW)Plant Dry Weight (g DW)Dry Matter (%)
TotalRootsStemLeavesTrussesTotalRootsStemLeavesTrusses
Treatment
Cz 77.69.7229.120.060.1134.914.126.12.07.714.61.911.3
B76.19.7230.418.858.5131.821.226.32.07.514.52.311.4
GA378.89.7225.918.560.0134.213.125.61.87.714.61.511.3
NPK (g L−1)
061.49.3b171.1c14.1b49.2b102.5b5.3c18.2c1.4b5.3c10.8b0.6c10.6b
176.39.9a234.2b20.7a61.0a140.4a12.0bc27.2b2.2a8.0b15.6a1.5bc11.6a
286.99.6ab250.4a21.1a65.5a144.8a19.0ab29.2a2.1a8.7a15.9a2.4ab11.6a
485.310.0a258.0a20.5a62.5a146.9a28.2a29.5a2.1a8.5a15.9a3.0a11.4a
Treatment × NPK
C065.4c8.89179.918.553.0102.06.5d19.01.75.810.70.8cd10.6
173.4bc10.2236.120.560.3144.111.1cd26.82.37.715.31.5c11.3
284.8ab9.71250.720.261.4143.026.2b30.02.18.415.93.7ab12.0
486.8ab9.92249.620.765.8150.412.8c28.72.18.816.41.5c11.5
B056.0d9.23162.411.844.2101.05.4d18.21.34.911.40.6d11.2
175.0b9.80235.220.861.1141.311.9c27.72.28.015.91.6c11.8
289.4a9.62255.222.268.8142.921.3b28.92.28.915.42.3bc11.3
483.8ab10.2268.820.460.1142.046.3a30.32.18.215.24.8a11.3
GA3062.8dc9.70170.912.050.3104.44.2d17.31.35.110.40.5d10.1
180.4b9.87231.420.861.7135.813.1c27.22.08.215.41.5c11.7
286.6ab9.50245.520.966.4148.49.7cd28.52.08.716.51.3c11.6
485.2ab9.91255.720.361.6148.325.4b29.62.08.716.22.7b11.6
Significance x
Treatmentnsnsnsnsnsnsnsnsnsnsnsnsns
NPK*************************************
Treatment × NPK*nsnsnsnsns*nsnsnsns*ns
z Each value is the mean of 4 replicated samples of 5 plants each. For each factor, values in a column followed by the same letter are not significantly different, according to the LSD test. x Significance: ns = not significant; * significant at p < 0.05; ** significant at p < 0.01; *** significant at p < 0.001.
Table 4. Effects of the seedling treatments (C, untreated control, B, bacterial biostimulant, GA3, gibberellic acid spray 10−5 M) and the nursery fertigation rates (g L−1 of NPK 20-20-20) on the flowering of Solanum lycopersicum ‘Marmande’ plants grown in soilless cultivation.
Source of VarianceFlowering Date (d from Transplant)Height of First Flower Truss (cm)Nodes of First Flower Truss (n.)Internode Length (cm)
Treatment
Cz 36.138.4ab9.74.4
B38.539.8a10.24.4
GA335.636.8b9.74.2
NPK (g L-1)
046.533.2b10.13.7c
135.135.2b9.54.2b
232.941.3a9.64.8a
432.543.6a10.24.8a
Treatment × NPK
C041.4b32.09.43.8
135.2cd33.79.44.0
231.8de40.69.25.0
436.0cd47.210.84.9
B050.8a37.411.63.6
137.6c35.99.44.3
233.8d43.210.04.8
431.8de42.89.65.0
GA3047.2a30.29.43.6
132.4de36.09.64.2
233.0de40.29.64.7
429.8e40.910.24.5
Significance x
Treatment**nsns
NPK******ns***
Treatment × NPK**nsnsns
z Each value is the mean of 4 replicated samples of 5 plants each. For each factor, values in a column followed by the same letter are not significantly different, according to the LSD test. x Significance: ns = not significant; * significant at p < 0.05; ** significant at p < 0.01; *** significant at p < 0.001.
Table 5. Effects of the seedling treatments (C, untreated control, B, bacterial biostimulant, GA3, gibberellic acid spray 10−5 M) and the nursery fertigation rates (g L−1 of NPK 20-20-20) on the leaf characteristics of Solanum lycopersicum ‘Marmande’ plants grown in soilless cultivation.
Source of VarianceNumber of LeavesLeaf Area (cm2 Plant−1)Leaf Area (cm2 Leaf−1)SLA y
(cm2 g DW−1)
Stomatal Conductance (mmol m2 s−1)L*ChromaHue°
Treatment
Cz 18.73164.7a171.3223.0a319.538.0a24.3125.6a
B18.52834.7b149.9197.8b379.237.3b21.1124.8b
GA319.13103.8a161.2206.7b406.238.3a24.2124.4b
NPK (g L−1)
016.7b2426.7c145.5228.3a417.838.3a25.2121.2d
119.2a3105.2b160.9197.0b380.038.1ab23.7124.0c
219.6a3212.6ab164.5203.0b308.037.7ab22.6126.4b
419.5a3393.0a172.4208.4b367.437.4b21.2128.3a
Treatment × NPK
C016.62408.3144.4c241.5a396.238.627.2a122.2
119.83234.7167.3b221.1ab245.237.925.4ab124.6
219.23305.3174.3b204.9b258.637.823.0bc127.1
419.23710.3199.0a224.5ab377.837.721.6bc128.7
B017.02247.7134.9c200.9b467.437.521.5bc121.2
118.02894.7155.1bc184.3b395.437.320.1c123.9
219.63151.7157.4bc214.3ab251.637.121.4bc125.8
419.23044.7152.3bc191.9b402.437.321.5bc128.5
GA3016.42624.0157.2bc242.6a389.838.827.0a120.4
119.83186.3160.3bc185.5b499.338.925.7ab123.4
220.03180.7161.7bc189.9b413.838.123.5b126.2
420.23424.0165.7bc208.8b322.037.220.63bc127.6
Significance x
Treatmentns********ns*********
NPK************ns*******
Treatment × NPKnsns****nsns***ns
z Each value is the mean of 4 replicated samples of 5 plants each. For each factor, values in a column followed by the same letter are not significantly different, according to the LSD test. x Significance: ns = not significant; * significant at p < 0.05; ** significant at p < 0.01; *** significant at p < 0.001; y Specific leaf area.