Article

Rate of Nitrogen Rather Than Timing of Application Influence Yield and NUE of Canola in South Australian Mediterranean Environments

1
School of Agriculture Food and Wine, The University of Adelaide, Waite Campus, Adelaide, SA 5064, Australia
2
Department of International Cooperation, Research Institute of Organic Agriculture (FiBL), Ackerstrasse 113, CH-5070 Frick, Switzerland
*
Author to whom correspondence should be addressed.
Agronomy 2020, 10(10), 1505; https://doi.org/10.3390/agronomy10101505
Submission received: 18 August 2020 / Revised: 20 September 2020 / Accepted: 25 September 2020 / Published: 3 October 2020

Abstract

:
Canola has a high nitrogen requirement and optimal nitrogen (N) management in environments with variable rainfall is a challenge. This study investigated the impact of timing of N as a single or split application at different growth stages on seed yield, N uptake and water-use efficiency in canola. Nitrogen rates of 100 and 200 kg ha−1 were applied after sowing when two leaves were unfolded or equally split between the rosette, green bud and first flower stages. The experiments were conducted at two sites with contrasting rainfall and a supplementary irrigation treatment at the low rainfall site, generating a third environment. Nitrogen application increased seed yield by up to 20% at a high rainfall site and by up to 77% at a medium rainfall site, but the timing of N did not significantly affect the yield response to N. Seed yield was closely associated with total dry matter production and seed m−2. N-use efficiency was influenced more by N recovery and uptake efficiency, rather than physiological efficiency, which highlights the importance of soil moisture availability and the ability of the crop to exploit soil water and N reserves. The results suggest that better use of subsoil moisture by overcoming some of the subsoil constraints may be an avenue for further improvements in yield and nitrogen-use efficiency (NUE) of canola in this environment.

1. Introduction

The introduction of hybrid cultivars with high early vigor, better weed control and increased use of nitrogen (N) fertilizers has improved canola (Brassica napus L.) production in Australia [1]. Annual production reached 3.9 Mt in 2017–2018 from approximately 1.8 Mt in 2008–2009 [2]. However, there is still a large gap between actual and attainable yields [1,3,4,5]. Initially, in farming systems of southern Australian canola was grown after legume-based pastures to use high-mineral nitrogen (N) in the soil and to break the cereal root disease cycle. However, with the intensification of the cropping system and increased popularity of canola, canola is grown most often in continuous cropping systems where it is often grown after cereals in soils with low N status and where high rates of N are required to achieve high yields. Expansion of canola into new areas and changes to crop rotations and tillage practices has meant that the nutrition of canola has been reexamined in recent times [6], with a strong focus on N management. In the Mediterranean environment of South Australia, water and N availability are the most critical factors for sustaining crop productivity [5,7,8,9], but often water-use efficiency (WUE) and nitrogen-use efficiency (NUE) are low.
Nitrogen is the nutrient most limiting to canola yield [6]. Campbell et al. [10] stated that N yield (N uptake) is a function of plant-available water as water is a major driver of yield in rainfed systems. Moreover, water deficits at critical growth stages can limit N uptake and utilization in plants [11] and can reduce crop responses to N fertilizers [12]. The critical phase of growth for yield in canola is just after the start of flowering [13] when seed number is largely determined. Management practices that reduce the risk of N and water stress during this period will be important for achieving high yields.
Nitrogen is an expensive and difficult-to-manage input in environments where the availability of moisture is a major limitation to yield. Recovery of N in crops is generally less than 50% [14], which cannot be justified from environmental and economic perspectives [15]. Canola has a high nitrogen requirement and optimal nitrogen (N) management in environments with variable rainfall is a challenge. Norton for example, estimated that canola requires 80 kg N ha−1 for each ton of grain yield [6]. Therefore, for yields of 2–3 t ha−1, which are commonly achieved in the medium rainfall zones of southern and western Australia [16], 160–240 kg N ha−1 needs to be supplied from soil N reserves and fertilizer. These values are similar to the total N required for canola (220–245 kg N ha−1) estimated from simulation modeling for the medium and high rainfall zones [17]. Applying all the N at the start of the season has inherent risks because the difficulty in predicting yield and hence the N requirement of crops and also because of canola establishment and seedling growth are sensitive to high rates of N fertilizer at sowing [18,19,20]. Even in growing seasons with above-average rainfall, applying all the N fertilizer at the seedling stage could result in poor N efficiency by mismatching N supply with crop N demand.
Delaying or splitting applications of N is a reasonable strategy for managing risk. However, responses to timing of N have been variable: some studies have shown yield improvements with split N applications compared with a single application of N [21,22], whereas other studies found no improvement in yield with split N application than a single application [21,23,24]. On average there may be little difference in yield between N applied at sowing or with a split application although the analysis of Norton [6] and other recent work suggest that the post-application moisture availability has a large influence on the variation in responses [25]. However, the interaction between N management and moisture availability has been little studied. It is often suggested that growers should manage fertilizer N in response to water availability and crop demand in these environments [7,9,26], but often N rate and timing are selected based on logistics of N application rather than based on an understanding of crop demand of N at different phenological growth stages.
Applying N at different growth stages may have different influences on yield by its differential effect on seed number m−2 (sink size) and seed weight and the degree of compensation between the two. Canola is an indeterminate crop and seed set and seed growth overlap, which complicates the source–sink relationship compared to determinate crops like wheat. Seed yield in canola can be affected by both sink and source limitations depending on the growth stage [27] which can be influenced by the timing of N. Some studies based on the plant N status at different growth stages showed the importance of N at the rosette to green-bud growth stages of canola [25,28,29] which would largely influence seed number. In contrast, Dreccer et al. [30] argued that yield of oilseed rape was source-limited during the pod filling stages, and this limitation could be tackled by a targeted application of N at the pod filling stage. Based upon a simulation study, Habekotté [31] suggested improving the source and sink capacity simultaneously to raise the potential yield of winter canola. In a recent study, it was reported that increasing the sink capacity with improved pre-flowering biomass production can improve the seed yield of canola and mustard [25].
It is widely accepted that the management of fertilizer inputs is one of the most important tools for the improvement of yield, NUE and WUE in rainfed environments [32,33,34], but there have been few analyses of the interaction between moisture and N management in canola. In the trials reported here, the effect of moisture was examined in two ways: irrigation was used to manipulate the water supply at one site and the response to N management was compared at two sites with different rainfall. Consequently, we hypothesize that post-sowing split applications of N at key growth stages can improve the yield, NUE and WUE of canola over its single application under different water regimes.

2. Materials and Methods

2.1. Site Description

Two sites with different annual rainfall were selected to investigate the effect of N management on yield, N and water-use efficiency of canola. Field studies were undertaken at a medium rainfall site at the Roseworthy Farm of the University of Adelaide (latitude −34.53° S; longitude 138.72° E) and at a high rainfall site in the Mid North of South Australia near Tarlee (latitude −34.15° S; longitude 138.73° E) during the 2013 growing season. The long term annual average rainfall (defined as April to October [35]) of 329 mm and at Tarlee these were 527 mm and 374 mm, respectively, (Figure 1). In 2013, growing season rainfall was 226 mm and 423 mm at Roseworthy and Tarlee, respectively. Annual and growing season mean maximum and minimum temperature of both sites were similar in 2013. The main soil type at Roseworthy is a Luvisol (chromosol) [36,37] and the soil at Tarlee is a medium clay over medium-heavy clay Vertisol (Vertosol). The EC increased significantly in subsoil at Roseworthy and indicated salinity may be a potential limitation. Soil at both sites was highly alkaline below 50 cm.
To estimate soil moisture and mineral-N to a depth of 100 cm, soil cores were taken two days before sowing at both sites by using a 4 cm-diameter hydraulic core. Soil samples were taken at five depths from across the sites at sowing, bulked, air dried in oven at 40 °C and sieved (<2 mm) for analysis by CSBP soil and plant analysis laboratory. The mass of soil in each depth increment was estimated from the bulk density at each depth and this was used to calculate the mass of mineral N [38]. The total amount of the mineral-N (ammonium + nitrate) in 0–100 cm layer was 125 kg ha−1 and 50 kg ha−1 at Roseworthy and Tarlee, respectively. The starting soil moisture was 198 mm at Roseworthy and 124 mm at Tarlee. Detailed soil characteristics of the experimental sites are given in Table 1.

2.2. Experimental Design

A medium-maturity hybrid Clearfield canola (cultivar Hyola 575CL) was sown on 17 May 2013 at Roseworthy and 4 May 2013 at Tarlee under five different N application strategies: a control with no N and two N rates (100 and 200 kg N ha−1 applied as granular urea) by two timings of either-either all the N applied when 2 leaves were unfolded (common practice) or equally split among the rosette stage (GS30; BBCH canola scale [39]), green bud appearance (GS51) and first flower (GS60). An N rate of 200 kg N ha−1 was selected to supply the N requirement for the potential yield of canola at both sites [5], based on an N requirement of 80 kg N ha−1 per ton of grain yield [6], while an N rate of 100 kg N ha−1 was selected based on a previous study from the same environment where it was found that 85% of the maximum seasonal yield can be achieved by the application of 100 kg N ha−1 at rosette stage (GS31) [25]. The N was split among the three growth stages to try to provide a non-limiting supply of N that targeted key growth stages [25]. Nitrogen was top-dressed by hand as close as possible to the desired growth stage either when the soil was wet or if rainfall was forecast within 24 h after fertilizer application. Nitrogen treatments were replicated six times at both sites. The experimental design was a factorial of 2 N rates × 2 timings plus nil control at Tarlee with 6 replicates and a split-plot design with irrigation as the main plot and the N treatments (factorial plus nil control) as subplots with three replicates at Roseworthy. The irrigated plots at Roseworthy were watered once at the rosette stage (GS31) using drip irrigation. The soil profile was wet to the drained upper limit (DUL) to 100 cm depth, which was equivalent to 60 mm of irrigation.

2.3. Crop Management

The trials were sown with a cone seeder with knifepoint tines and press wheels at a depth of 15 mm. Plots were 10 m-long comprising six rows with 250 mm inter-row width. Basal fertilizers applied at sowing were 10 kg N ha−1 and 11 kg P ha−1 as diammonium phosphate (DAP) and 14 kg S ha−1 as a pre-plant gypsum application. Seeding rates were adjusted based on a germination test and a plant population of 32 and 28 plants m−2 was established at Roseworthy and Tarlee, respectively. Weeds were controlled by a pre-sowing application of glyphosate (2.8 L ha−1) and by hand weeding in the crop when required. To avoid any early damage by insects chloropyrifos (Lorsban 700 mL/ha) was sprayed two days after sowing. Slugs and mouse damage were managed by applying snail bait (5 kg ha−1) and bromadiolone (MOUSEOFF at 2–4 kg/ha) when necessary. Overall, weed and disease incidence was minimal at both sites. These crop management practices are the same as earlier explained in Riar et al. [5,25].

2.4. Measurements and Sampling

Similar measurements and sampling techniques were used as explained by Riar et al. [5,25]. At maturity, plants from 0.25 m2 were taken from each plot to estimate pod numbers per plant, seeds per pod and harvest index (HI). The number of pods and seeds were measured on a subsample of a quarter of the inflorescence weight using the mass of four plants and then converted to pod m–2 and seeds m–2 according to the plant density estimated in each plot. Harvest index was estimated as the ratio of seed weight to total shoot weight of the subsample. To measure seed yield, plots were mechanically harvested after manually trimming the plot borders. Total dry matter at maturity was calculated from the plot seed yield and HI of the subsample. Seeds per pod was estimated by counting seeds from a sample of 25 pods from five different positions from the plant inflorescence, including main raceme and sub branches. Mean seed weight was estimated from the weight of 1000 seeds.
Soil moisture content was measured pre-sowing and at maturity by using a 4 cm-diameter hydraulic core. To estimate soil moisture at sowing, samples at 0–100 cm-depth of soil profile was taken at both sites, whereas at maturity 0–120 cm- and 0–180 cm-depth samples were taken at Roseworthy and Tarlee, respectively. Cores were subdivided into 20 cm-depth layers to assess the differences in water extraction at various depths. The change in soil water over 0–100 cm was used to estimate crop water use (CWU) assuming no drainage below the root zone.
CWU = P + I − ΔS
where P is growing season rainfall, ΔS is the difference between soil moisture at harvest and sowing and I = 0 in the rainfed treatments and I = 60 mm of irrigation at rosette stage (GS31) for irrigated treatments). Water-use efficiency (WUE) was calculated as the ratio of seed yield to CWU. To measure shoot N uptake, the samples were ground to pass a 2 mm sieve and the total N concentration of the above ground biomass was determined with a LECO combustion analyzer, where plant samples were loaded into the combustion tube (at 950 °C) and flushed with oxygen. Nitrogen concentration and oil content in seed were measured using a near infrared grain analyzer (Cropscan 1000B, Next Instruments Pty, Ltd., Condell Park, NSW 2200, Australia). The efficiency of N for canola was calculated by using the following formulae [14,41]:
N - use   efficiency   for   seed   yield   ( NUE GY )   ( kg   kg −1 )   = Seed   yield ( Fertilizer   N   +   Soil   N )
N - uptake   efficiency   ( kg   kg −1 )   = Total   N   uptake ( Fertilizer   N   +   Soil   N )
Agronomic   efficiency   = G F     G C F =   ( kg   kg −1 )
Apparent   fertilizer   recovery   =   N F     N C F   ×   100   =   ( % )
Physiological   efficiency   =   Y F     Y C N F N C   ( kg   kg −1 )
Utilization   efficiency   =   Physiological   efficiency   ×   Apparent   fertilizer   recovery   =   ( kg   kg 1 )
Agro - physiological   efficiency   =   G F     G C N F     N C   ( kg   kg −1 )
where GF and GC are the seed yield of the fertilized and unfertilized plots, YF and YC are the total dry matter of the fertilized and unfertilized plots, NF and NC is the N contained in biologic yield (kg ha−1) of the fertilized and unfertilized plots, and F is the amount of fertilizer N applied as granular urea [14,42]. The total N supply was the sum of the soil N at sowing plus the fertilizer N and there was no adjustment for in-season mineralization of N.

2.5. Statistics

The data obtained from the experiment were analyzed by the analysis of variance (ANOVA) using the GenStat statistical analysis software (15th edition) [43]. A Factorial + added control analysis of variance was used to identify the effects of N and water management of canola. For statistical comparisons, the least significant difference (LSD) at 5% level of probability (p = 0.05) was used to compare the treatments unless otherwise stated.

3. Results

3.1. Seed Yield, Harvest Index and Oil Content

At Roseworthy, both irrigation and N improved the yield over the rainfed and the control treatments, respectively and there were no significant Irrigation × N interactions for yield (Table 2). On average irrigation increased yield by about 858 kg ha−1 while N application increased yields by an average of 853 kg ha−1. There was no significant difference between yields at 100 kg N ha−1 or 200 kg N ha−1 nor was there a significant effect of the timing of N application. The application of 200 kg N ha−1 in three identical splits (rosette, green-bud and flowering) improved the HI over the single N application of the same amount after seedling emergence under rainfed conditions. However, no such improvement of HI was observed in the irrigated crop. Oil content was lower in the split application of 200 kg N ha−1 than the single N application of the same amount under rainfed conditions whereas no such reduction of oil content was observed in the irrigated crop (Table 2).
At Tarlee, N improved the yield of canola up to 100 kg ha−1 N, but there was no effect of the timing of N application (Table 3). Nitrogen treatments had little effect on HI, but a split application treatment resulted in a slightly lower HI than a single application of N (0.26 vs. 0.29; Table 3). Applying N reduced oil content, but the split application of N maintained a higher oil concentration compared to a single application of N (Table 3).

3.2. Yield Components

At Roseworthy the irrigated treatment produced more pods m−2 than the rainfed treatments (Table 4). Pod number increased with irrigation and the application of N. The effect of splitting the application of N on pod number depended on the rate of N: at 100 kg N ha−1 there was no increase, but at 200 kg N ha−1 there was a significant increase in pod number in both irrigated and rainfed treatments by splitting the application among different growth stages.
Seed number was only affected by irrigation and the application of N. Adding N increased seed number, but there were no significant difference between the rates of N or the timing of applications or their interactions (Table 4). Irrigating at the rosette stage increased seed m−2 × 33% compared to the rainfed treatments. On average, N increased the seed m−2 by approximately 50% compared to the control.
The irrigated crop had a higher mean seed weight than the rainfed treatment (3.92 g cf. 3.52 g; Table 4). There was a significant interaction between the rate and timing of N application. In irrigated treatments, the highest seed weight was obtained with the single application of 100 kg N ha−1, which was followed by the split applications of 100 kg N ha−1 and 200 kg N ha−1. In the rainfed treatment, the highest seed weight was observed in the split application 200 kg N ha−1 followed by the control, a single application of 200 kg N ha−1, 100 kg N ha−1 in splits and a single application of 100 kg N ha−1, respectively (Table 4). Interactions for seeds pod−1 were observed among irrigation, N application rate and time of N application. The lowest number of seeds pod−1 was observed in the split application of 100 kg N ha−1 in the irrigated crop. On the other hand, the same treatment produced the highest number of seeds pod−1 under rainfed conditions. Applications of 200 kg N ha−1 in three split applications and a single application of 100 kg N ha−1 had similar seeds pod−1 in rainfed and irrigated conditions. Seed pod−1 were higher in the rainfed than the irrigated treatments when no N was applied (Table 4).
At Tarlee, N increased pod m−2 with 200 kg N ha−1 producing a bigger response than 100 kg N ha−1 but splitting the application between different growth stages resulted in a smaller increase; the greater reduction in pod number from a split application occurred at 200 kg N ha−1. Consequently, the highest number of pods m−2 was observed with the single application of 200 kg N ha−1 (Table 5). In contrast, applications of N did not have a significant effect on seed m−2 (Table 5). Increase in N rate from 100 to 200 kg ha−1 reduced mean seed weight and seed pod−1. A single application of 100 kg N ha−1 had greater seed weight than the same rate applied in splits and 200 kg N ha−1 and the control. The lowest numbers of seed pod−1 were observed in the single application of 200 kg N ha−1 followed by the N application of same amount in three identical splits, single application of 100 kg N ha−1, 100 kg N ha−1 in three splits and control, respectively (Table 5).
High pod number was correlated with high seed number at Roseworthy both under in the irrigated (r = 0.85, p = 0.06, n = 5) and rainfed (r = 0.84, p = 0.06, n = 5) treatments, whereas at Tarlee high pod number was not associated with seed number (r = 0.54) because of the reduction in seeds pod as pod number increased (r = −0.87, p = 0.05, n = 5). Mean seed weight was not correlated with pod number of seed number at either site.
Seed yield showed a curvilinear relationship with pods m−2 at both sites with yields plateauing at high pod numbers (Figure S1). Under rainfed conditions, the upper limit was approximately 8000 pods m−2 while in the irrigated treatment it was about 10,000 pods m−2. The dominant cause of yield variation at Roseworthy was seeds m−2; there were strong associations with yield under irrigation (r = 0.84, p = 0.07, n = 5) and in rainfed crops (r = 0.91, p = 0.03, n = 5). In contrast there was no significant relation between yield and seed number at Tarlee (r = 0.47). The results from both sites are consistent with the general relationship between yield and seeds m−2 in experiments from southern and western Australia (Figure 2). The scatter within the relationship reflects the variation in seed weight among the experiments with the estimated range being between 2.75 mg and 4.00 mg. The experiments at Roseworthy produced fewer seeds, but a larger average seed weight whereas the Tarlee experiment produced small seed relative to the number of seeds m−2.

3.3. Water Use and Water-Use Efficiency (WUE)

The main factors that affected water use, WUE and N-use efficiency were Irrigation and the application of N; there were no significant effects of the rate (i.e., 100 vs. 200 kg N ha−1) or the timing of application of N. At Roseworthy, total crop water use was higher in the irrigated crop compared to the rainfed crop (Table 6). Irrigated canola had a higher WUEGY (p = 0.10) and WUEDM than the rainfed crop (WUEGY = 8.0 kg mm−1 ha−1 vs. 7.2 kg mm−1 ha−1; WUEDM 33.8 kg mm−1 ha−1 vs. 31.3 kg mm−1 ha−1). Total water use was not significantly affected by N, but WUEGY and WUEDM were improved with N compared to the control; the timing or rate of N had no effect on the response. It indicated that N altered the partitioning of WU rather than the total amount of water use.
Irrigation increased soil moisture storage by increasing subsoil moisture and resulted in a 63 mm increase in crop water use. This produced an additional 858 kg ha−1 of yield, equivalent to a marginal WUEGY of 13.6 kg ha−1 mm−1, which was almost twice the efficiency of the seasonal water use.
At Tarlee, applying N increased total water use slightly (15 mm) compared to the control. The lack of an effect of the rate and timing of N application on total water use indicated that both N treatments used similar amounts of water from sowing to maturity (Table 7). Water-use efficiency for yield (WUEGY) and water-use efficiency for dry matter (WUEDM) did not vary among the N treatments.
The relationship between crop water use and total dry matter and grain yield are shown in Figure 3. A boundary line was fitted though the most productive treatments to indicate the water-limited potential yield at the sites: for dry matter the marginal WUEDM (±seb) was 61 ± 3.1 kg ha−1 mm−1 with an intercept of 99 mm and for grain yield the marginal WUEGY was 16.1 ± 0.5 kg ha−1 mm−1 with an intercept of 121 mm (Figure 3b). The 95% confidence interval for the intercept for dry matter (±54.0 mm) and grain yield (±34.2 mm) were calculated using the method suggested by Zar [46] and indicated there was no significant difference between the two values. Without additional N dry matter, production and grain yield were substantially less than the water-limited potential.

3.4. Water Distribution in the Soil Profile

At Tarlee, there was >0.3 mm mm−1 of water in all 20 cm-depth increments down to 60 cm at the time of sowing whereas at Roseworthy soil to a depth of 40 cm had <0.2 mm mm−1 of water for each measured increment and deeper layers had >0.2–0.3 mm mm−1 of soil water at sowing. By maturity, at both the sites, crops that received 200 kg N ha−1 or 100 kg N ha−1 had dried the profile more than crops grown without N (Figure 4). At Tarlee, the maximum depth of water extraction was only about 70–80 cm with and without N application (Figure 4a,d,g,j,m). The crops dried the profile to the crop lower limit between 0 and 80 cm-depth, but irrespective of the N treatment, canola did not use all the available moisture below 80 cm and there was significant residual soil moisture deep in the profile.
At Roseworthy, the soil was very dry at sowing, and the moisture contents were generally below the crop lower limit. At maturity, values were consistently higher than the values at sowing in the top 60–80 cm and the subsoil was still very dry and below the crop lower limit, making it difficult to assess the depth of active root growth and water extraction. The Mudla Wirra reference soil profile is located in the same paddock in which the Roseworthy experiment was conducted, so it is reasonable to assume that the values for the crop lower limit are representative of the soil properties of the current experiment. While the soil moisture values were below the crop lower limits below 60–80 cm, there may have been evidence that canola extracted soil water to at least 90 cm in the irrigated and rainfed treatments (Figure 4b,c,e,f,h,i,k,l,n,o). Nitrogen management did not appear to influence the depth of water extraction by canola. At maturity, the profile in the rainfed treatment was drier than under the irrigated treatment between 50 cm and 80 cm.

3.5. Nitrogen Uptake, N Uptake Efficiency and Nitrogen Harvest Index

At Roseworthy, irrigation and N application improved the total N uptake, N uptake in seed and N uptake efficiency and there was no significant interaction between irrigation and N (Table 6). There was no effect of rate and timing of N application on total N uptake, N uptake in seed and N uptake efficiency. NHI was not affected by irrigation and N treatments (Table 6).
At Tarlee, total N uptake and N uptake in seed were improved by the N treatments, but there was no significant difference between the rate and timing of N (Table 7). Nitrogen uptake efficiency was the lowest at 200 kg N ha−1 and highest for the control. Split application of N did not increase N uptake efficiency relative to the single application. Nitrogen harvest index (NHI) slightly decreased with the addition of N (p = 0.10), but N treatments did not differ among each other for NHI (Table 7).

3.6. Nitrogen-Use Efficiency

At Roseworthy, irrigation and N applications improved the N-use efficiency for seed yield. The NUE for seed yield decreased with increasing rate of N application (Table 6). There was no significant difference between the single and split application of N for NUEGY. In the irrigated treatment, agronomic efficiency decreased at higher N rate whereas there was no effect of N rate in rainfed treatments (Table 8). Split applications of N had a similar agronomic efficiency as the single application of 100 kg N ha−1 and 200 kg N ha−1 in both irrigated and rainfed treatments. Apparent recovery and physiological efficiency were not influenced by irrigation or N, but utilization efficiency was higher for the irrigated crop compared to the rainfed treatment (Table 8). In irrigated treatments, N- utilization efficiency was higher with 100 kg N ha−1 compared to the application of 200 kg N ha−1 whereas it was similar for 100 kg N ha−1 and 200 kg N ha−1 in the rainfed treatment.
At Tarlee, NUE for seed yield decreased as N rate increased from 100 to 200 kg ha−1, but there was no effect of the timing of N application (Table 7). The highest agronomic efficiency of 5.1 kg kg−1 was achieved with the single application of 100 kg N ha−1 whereas all other N treatments have similar agronomy efficiency (range 2.0–2.6 kg kg−1) (Table 9). Apparent recovery of N at Tarlee was lower than at Roseworthy. It decreased at high N rates, but within the same rate of N application, splitting N applications did not improve the apparent recovery over a single N application. Physiological efficiency did not differ among N treatments and the control. Nitrogen- utilization efficiency decreased as N rate increased from 100 to 200 kg ha−1, especially at the lower rate of N (Table 9).

4. Discussion

Significant responses to N of between 16% and 69% were measured across both sites. The greatest increase occurred with 100 kg N ha−1 and there was little further yield increase at 200 kg N ha−1. This is consistent with the estimates of fertilizer N requirement based on an N balance described by Norton [47] which predicted fertilizer rates of between 70 kg N ha−1 and 100 kg N ha−1 for canola yielding 3 t ha−1, which was achieved under irrigation at Roseworthy and at Tarlee. However, a significant response to 100 kg N ha−1 was also measured in the rainfed trial at Roseworthy, which the N balance predicted to be nonresponsive to N. This suggest that in-season mineralization of N was overestimated in the N balance and/or the recovery of mineral N by the crop was poor in the rainfed treatment. Half the estimated soil mineral N at sowing was found in the top 20 cm at Roseworthy and there was approximately 30 kg N/ha below 40 cm, which remained dry throughout the season. Therefore, this subsoil mineral may not have been able to be used effectively.
The responses in yield to N were affected mainly by the rate of N rather than the timing of N application. There was no significant effect of the time of N on the yield response to N within the range of yields in the current experiments (approximately 2–3 t ha−1) irrespective of the moisture availability because similar effects were found under rainfed conditions at medium and high rainfall sites and in the rainfed and irrigated treatments at Roseworthy. The timing of N application did not have a significant effect on total crop water use, water-use efficiency, total N uptake or N-use efficiency. The results are consistent with earlier work which found similar yields for N applied at sowing or split between sowing and the first appearance of buds (GS51) [6,25]. Therefore, in terms of N management in the medium-high rainfall zone, estimating and applying the correct rate of N is more critical to yield and NUE than the time of application.
The improvements in yield from additional N were due to changes in crop dry matter because there was very little difference in the HI among the treatments or between the two sites. Interestingly, irrigation at the rosette stage at Roseworthy improved yield by 49% with an increase of 41% in total shoot dry matter without any considerable improvement in HI, which highlights the importance of crop biomass production to yield.
The independence of yield from HI in canola observed in this study was also reported for different Brassica species by Lewis and Thurling [
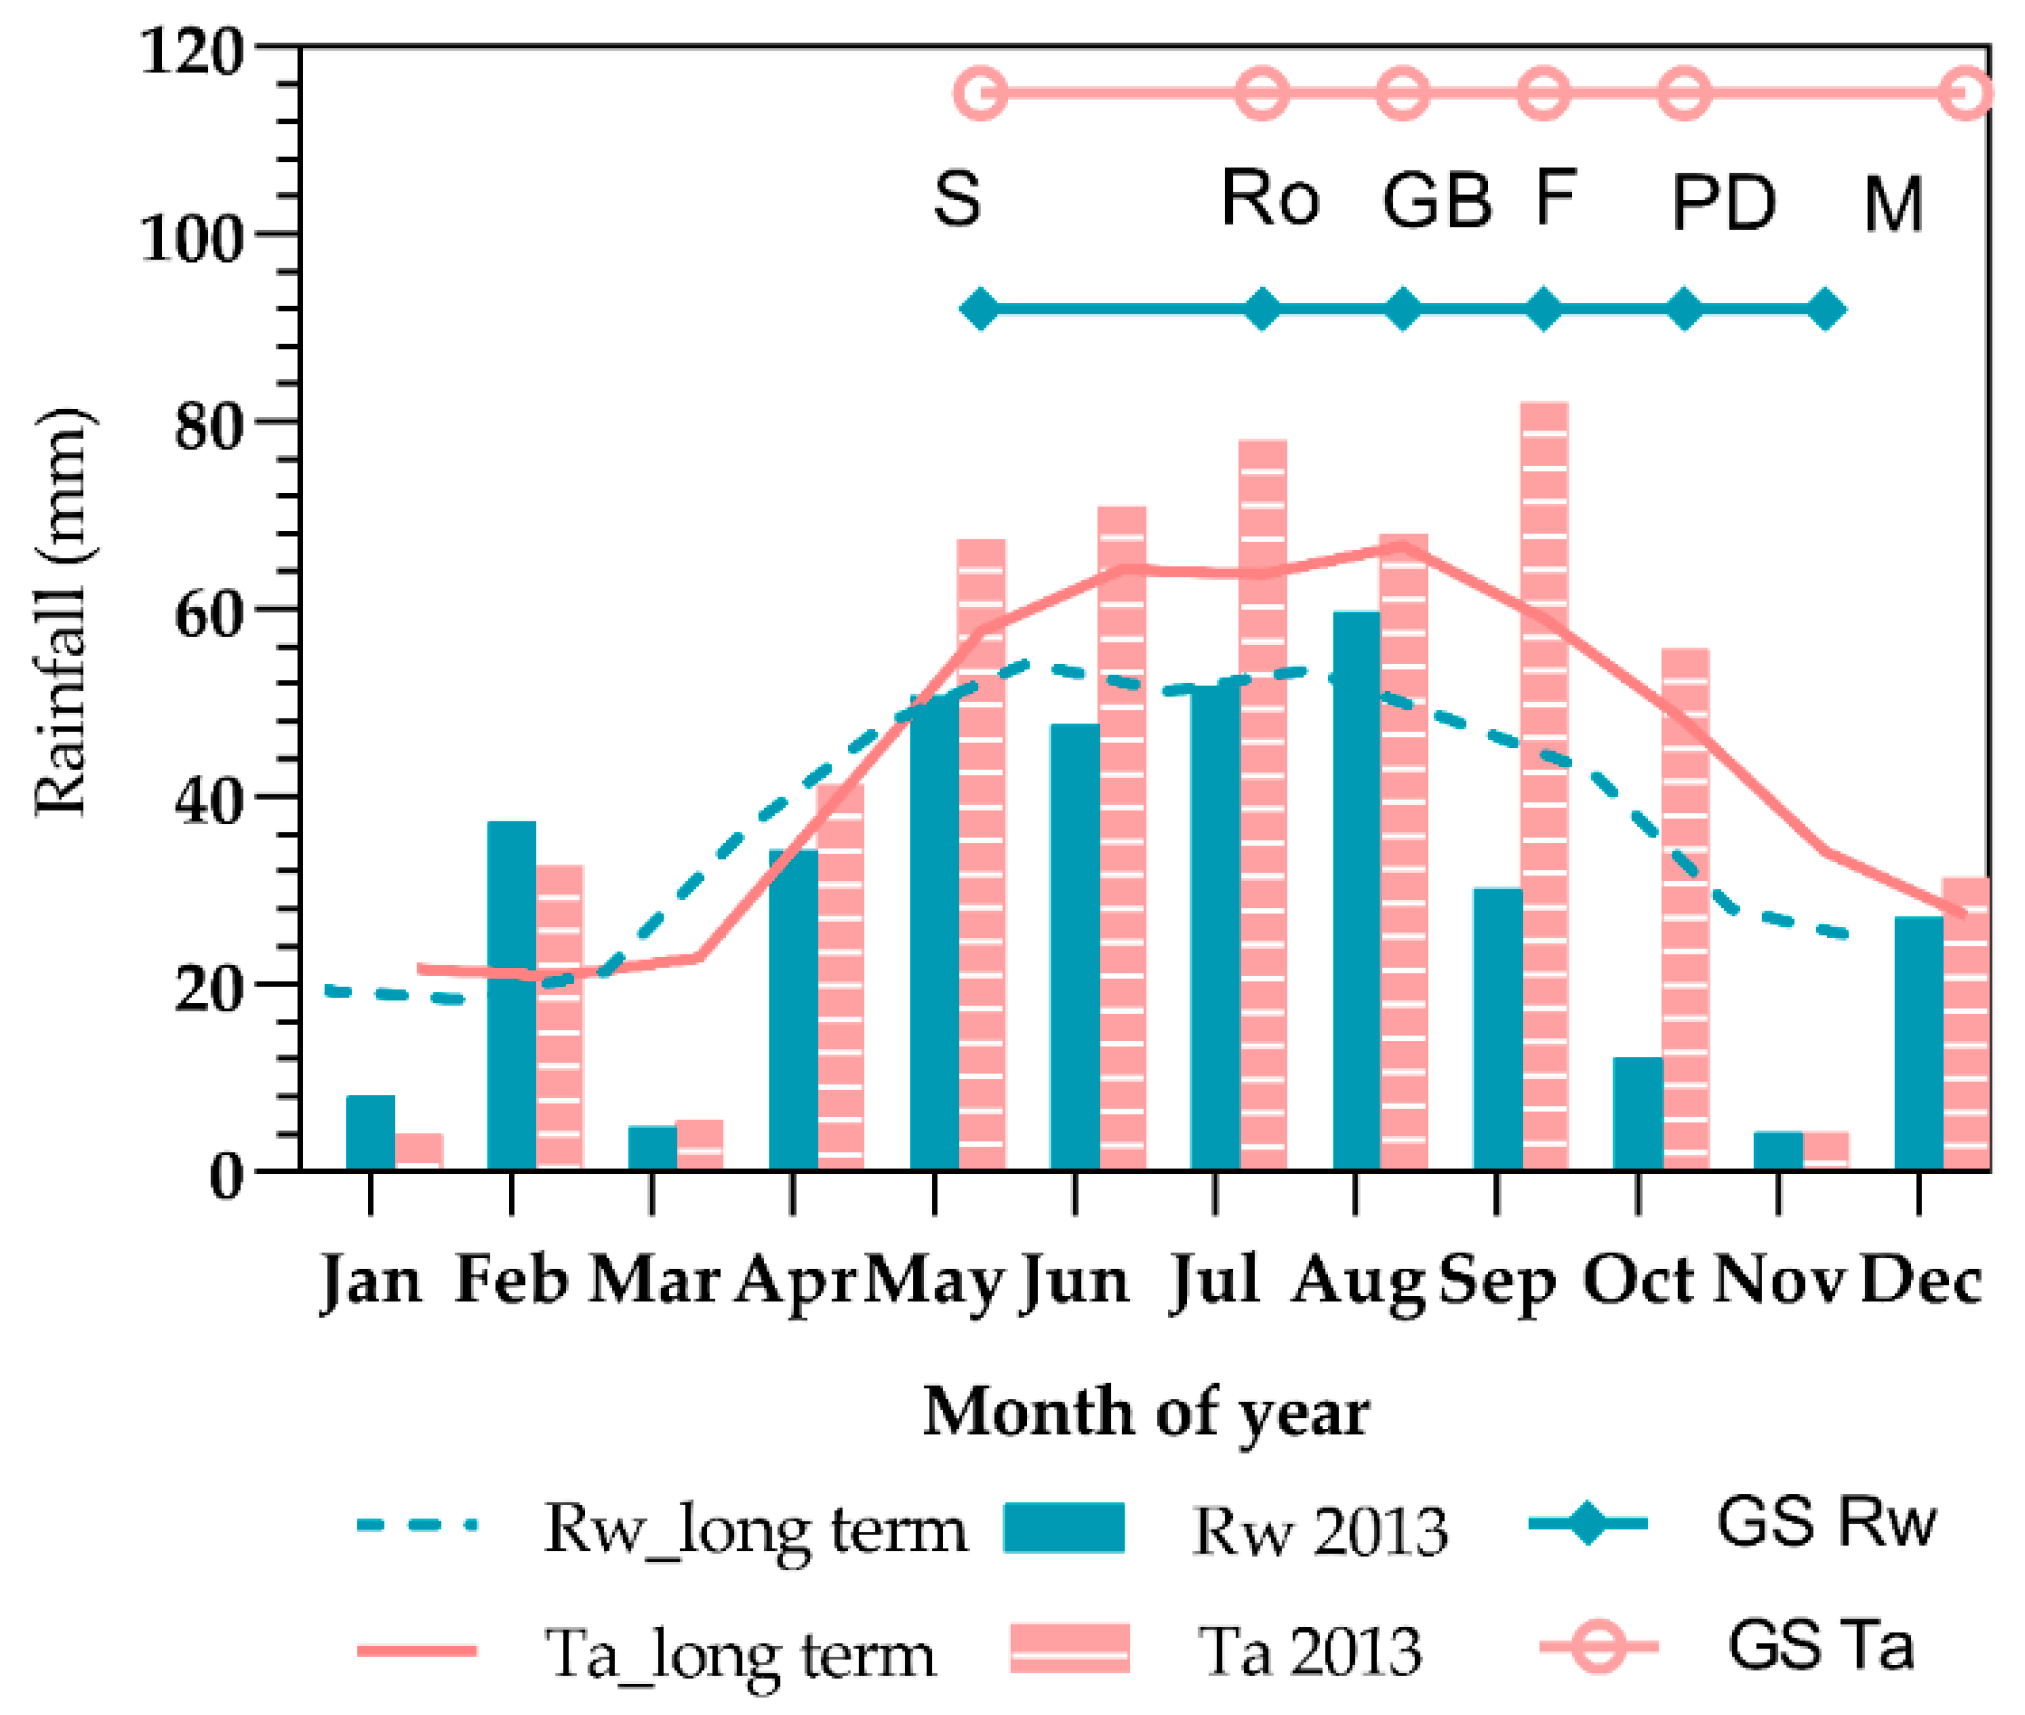
48]. Differences in total dry matter and yield between the two sites and different water regimes were attributed not only to water availability, but also to the different rainfall patterns. Tarlee received around 30% more rainfall than Roseworthy from sowing to mid-flowering period (May–August), but rainfall was 2.5 times higher during the late-flowering and pod initiation period (September) and around three times higher during the pod-development phase (October) (Figure 1). The lower dry matter and yield for the rainfed treatments at Roseworthy compared to Tarlee was due to lower available soil water during the flowering and pod-development phases, which reduced crop dry matter production and sink development leading to low N uptake and utilization [49,50]. Richards and Thurling [51] also found a significant reduction in canola dry matter and yield components due to water stress at flowering and pod development.
While differences in yield and responses to N were driven more by crop biomass rather than by HI, the values reported in these and other experiments in the region tend to be low and may be limiting yield and responsiveness to N. The average values in the current experiments were 0.24 (Roseworthy) and 0.27 (Tarlee) which are lower than the average HI reported for canola in Australia (0.28; [52]), but comparable to the average HI for commercial crops in South Australia and western Victoria (0.24) [53]. By comparison HI for canola in trials from SE New South Wales are often substantially higher; for example, Hocking and Stapper reported HIs of 0.29–0.37 for crops sown in April and May at two sites [44] and they only fell to values comparable to those reported in the current experiments (0.25–0.28) when the crops were sown late and exposed to a higher level of stress due to the short growing season. Previously, Hocking et al. measured HIs of 0.27–0.34 [54], while more recent work confirmed this difference with canola grown in South Australia having a HI of 0.27 compared to a HI of 0.34 in an experiment grown at Wagga Wagga in New South Wales [13]. This was associated with a 25% lower yield at the South Australian site. Both sites received well above-average rainfall and total dry matter production was similar at the two sites (only 7% lower in South Australia). The lower HI for crops in the South Australia and western Victoria indicates that growth during pod set and pod fill may be occurring under higher levels of environmental stress compared to SE New South Wales.
The mean oil concentration for canola was greater than 42% at both the sites. Oil concentration in canola seed was unaffected by the site or irrigation regime. Nitrogen application slightly reduced the oil content of seed at Tarlee compared to the control, which is consistent with the inverse relationship between oil and protein reported in the literature [24,54,55]. Split applications of N improved the oil content compared to the single N application at the high rainfall site, but the difference between the treatments was less than 0.5%. At Roseworthy, split application improved seed oil content in irrigated conditions, but not in rainfed environment. High oil content in the irrigated crop at Roseworthy may be attributed to a longer period of seed development and slower seed maturity than in the rainfed crop due to higher water availability.
Seed yield formation involves complex interactions between yield components and yield can be both sink-limited (related to pod and seed numbers) and source-limited (reflected in seed size) because of the indeterminate growth pattern of canola [27]. The importance of sink size to yield has been demonstrated in several studies that have reported pod number to be the main factor responsible for yield [29,56,57,58]. Irrigation increased pod numbers in the Roseworthy experiment (from 6700 to 8200 pods m−2), but N rate was the more important influence, increasing pods m−2 × 131% at Roseworthy under rainfed conditions and by 210% under irrigated conditions and by 130% at Tarlee. While producing large number of pods was important to yield, there was no benefit from setting more than 8000 pods m−2 under the rainfed conditions at either site or more than 10,000 pods m−1 under irrigation. The limit to the yield from high pod number in the rainfed treatments was due to a reduction in seeds pod−1, which may reflect the increasing contribution from pods on the branches and the higher level of competition for assimilate at seed set. Seed set in pods on the branches show greater sensitivity to stress than the seed set on the main stem pods [13].
The strong relationship between seed number and yield for both the rainfed and irrigated treatments at Roseworthy suggests that yields were sink-limited at this site. The dry spring severely curtailed growth during flowering and early pod set, a growth stage critical to seed number and yield [13,
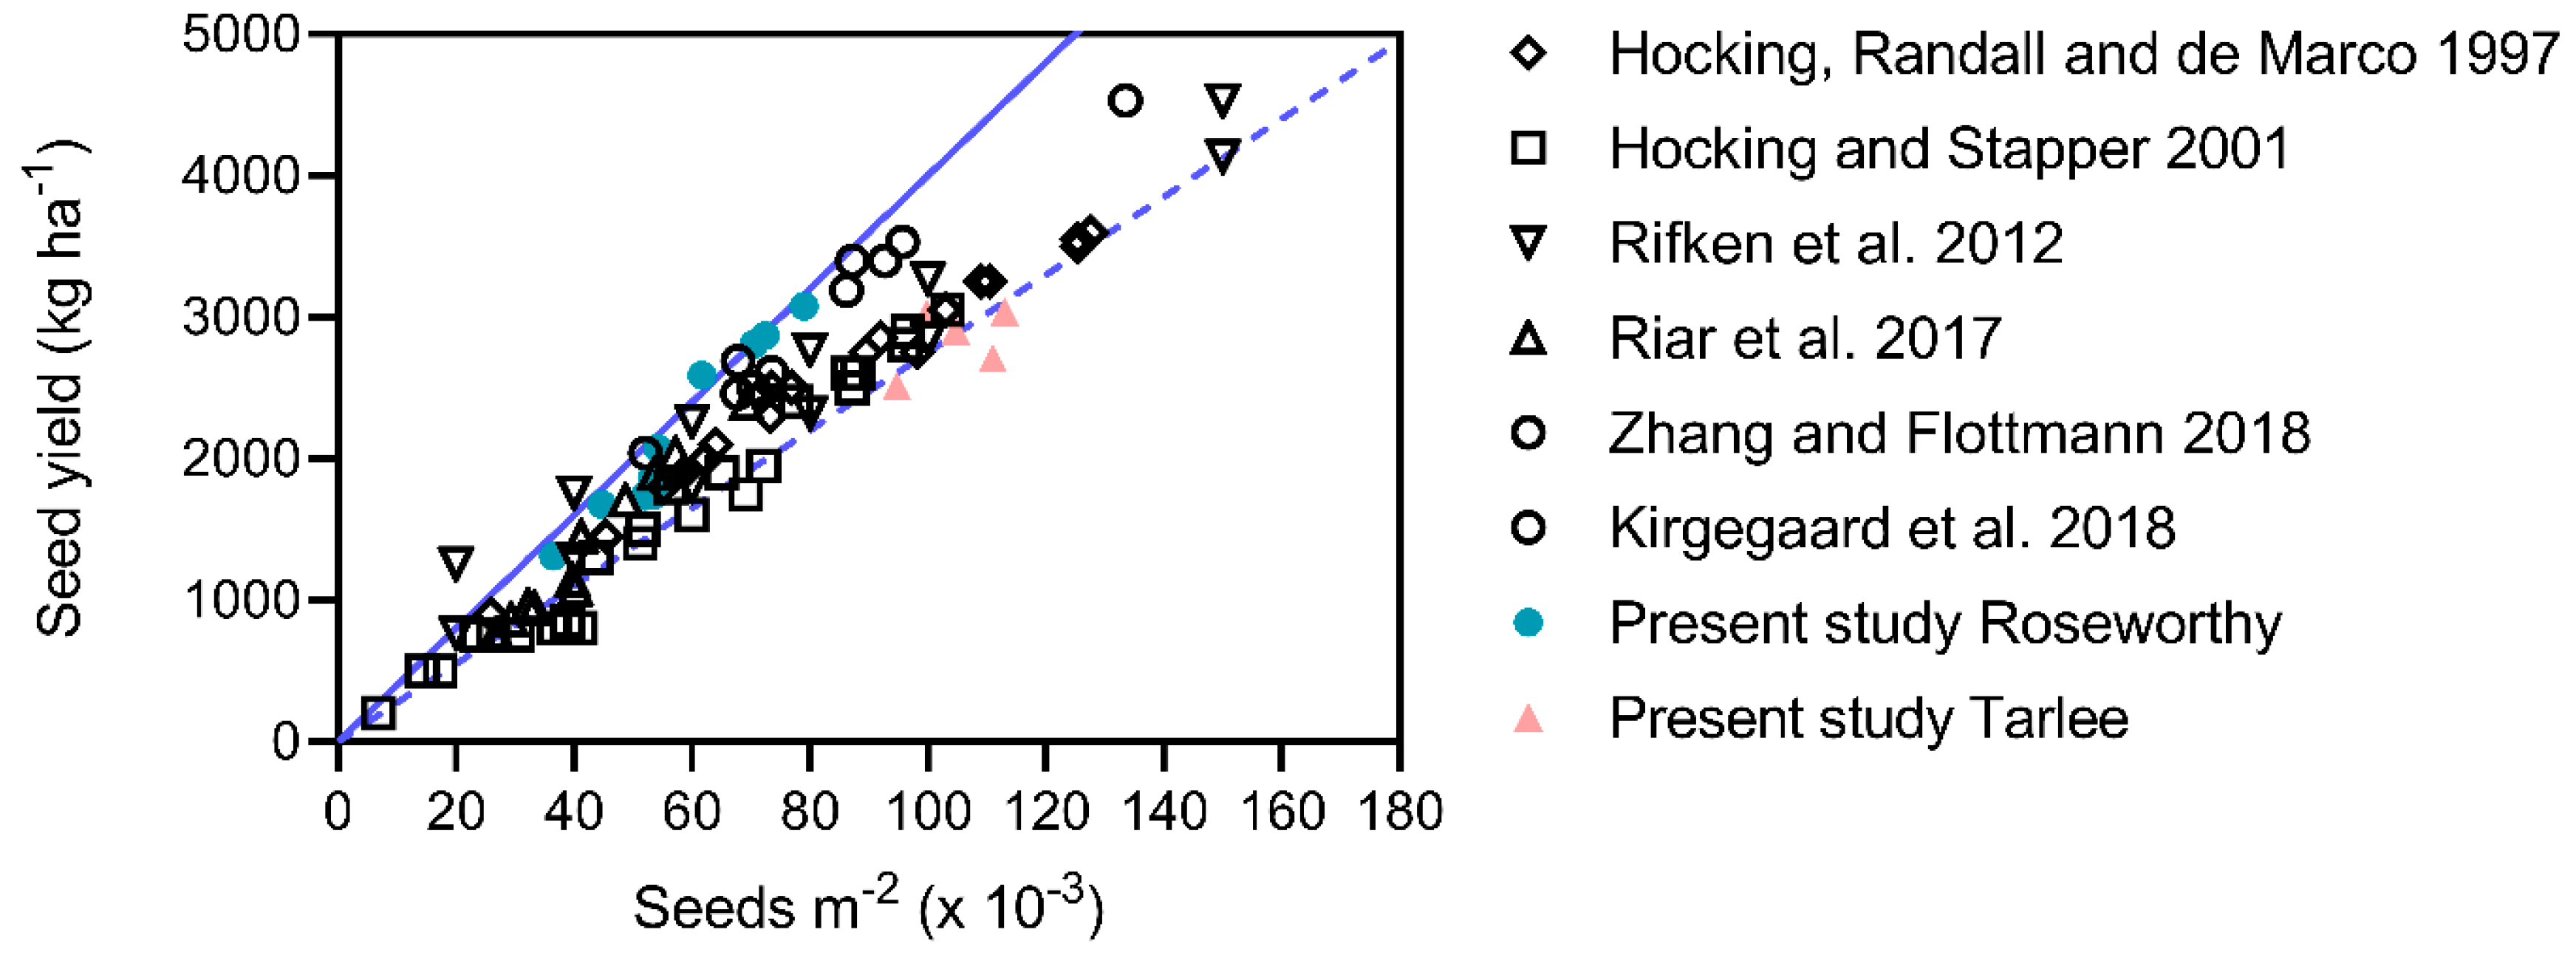
59] yet additional N still increased seed number. In contrast, there was evidence that the crops at Tarlee were more strongly source-limited. Despite producing more seeds m−2 than irrigated canola at Roseworthy, maximum yields were similar because of smaller seed weight. Moreover, the yields at Tarlee are generally lower than those achieved at other sites with comparable seeds m−2 (Figure 2).
Responses to water and N are linked and improvements in WUE are influenced by N supply. The seasonal marginal WUEGY indicates the water-limited yield in these experiments. The value derived from the trials (16 kg ha−1 mm−1) was not significantly different from the WUEGY estimated for canola over a much wider range of environments by Houshmandfer et al. (17 ± 1 kg ha−1 mm−1) [16], but higher than earlier reports of WUEGY by Nuttal and Armstrong (approximately 12 kg ha−1 mm−1, based on the marginal WUE in their Figure 7) [53] and Robertson and Kirkegaard (14 kg ha−1 mm−1), suggesting there has been an overall improvement in crop WUEGY in canola [60]. However, the current experiments demonstrated that an adequate supply of N is crucial to high WUEGY and the crop achieving its water-limited yield potential.
The greater response to N with irrigation at Roseworthy compared to the rainfed treatment clearly demonstrated how an increase in available moisture increases crop water use, N recovery, yield and WUE. Dependence of N uptake on plant available water has also been previously reported in wheat [
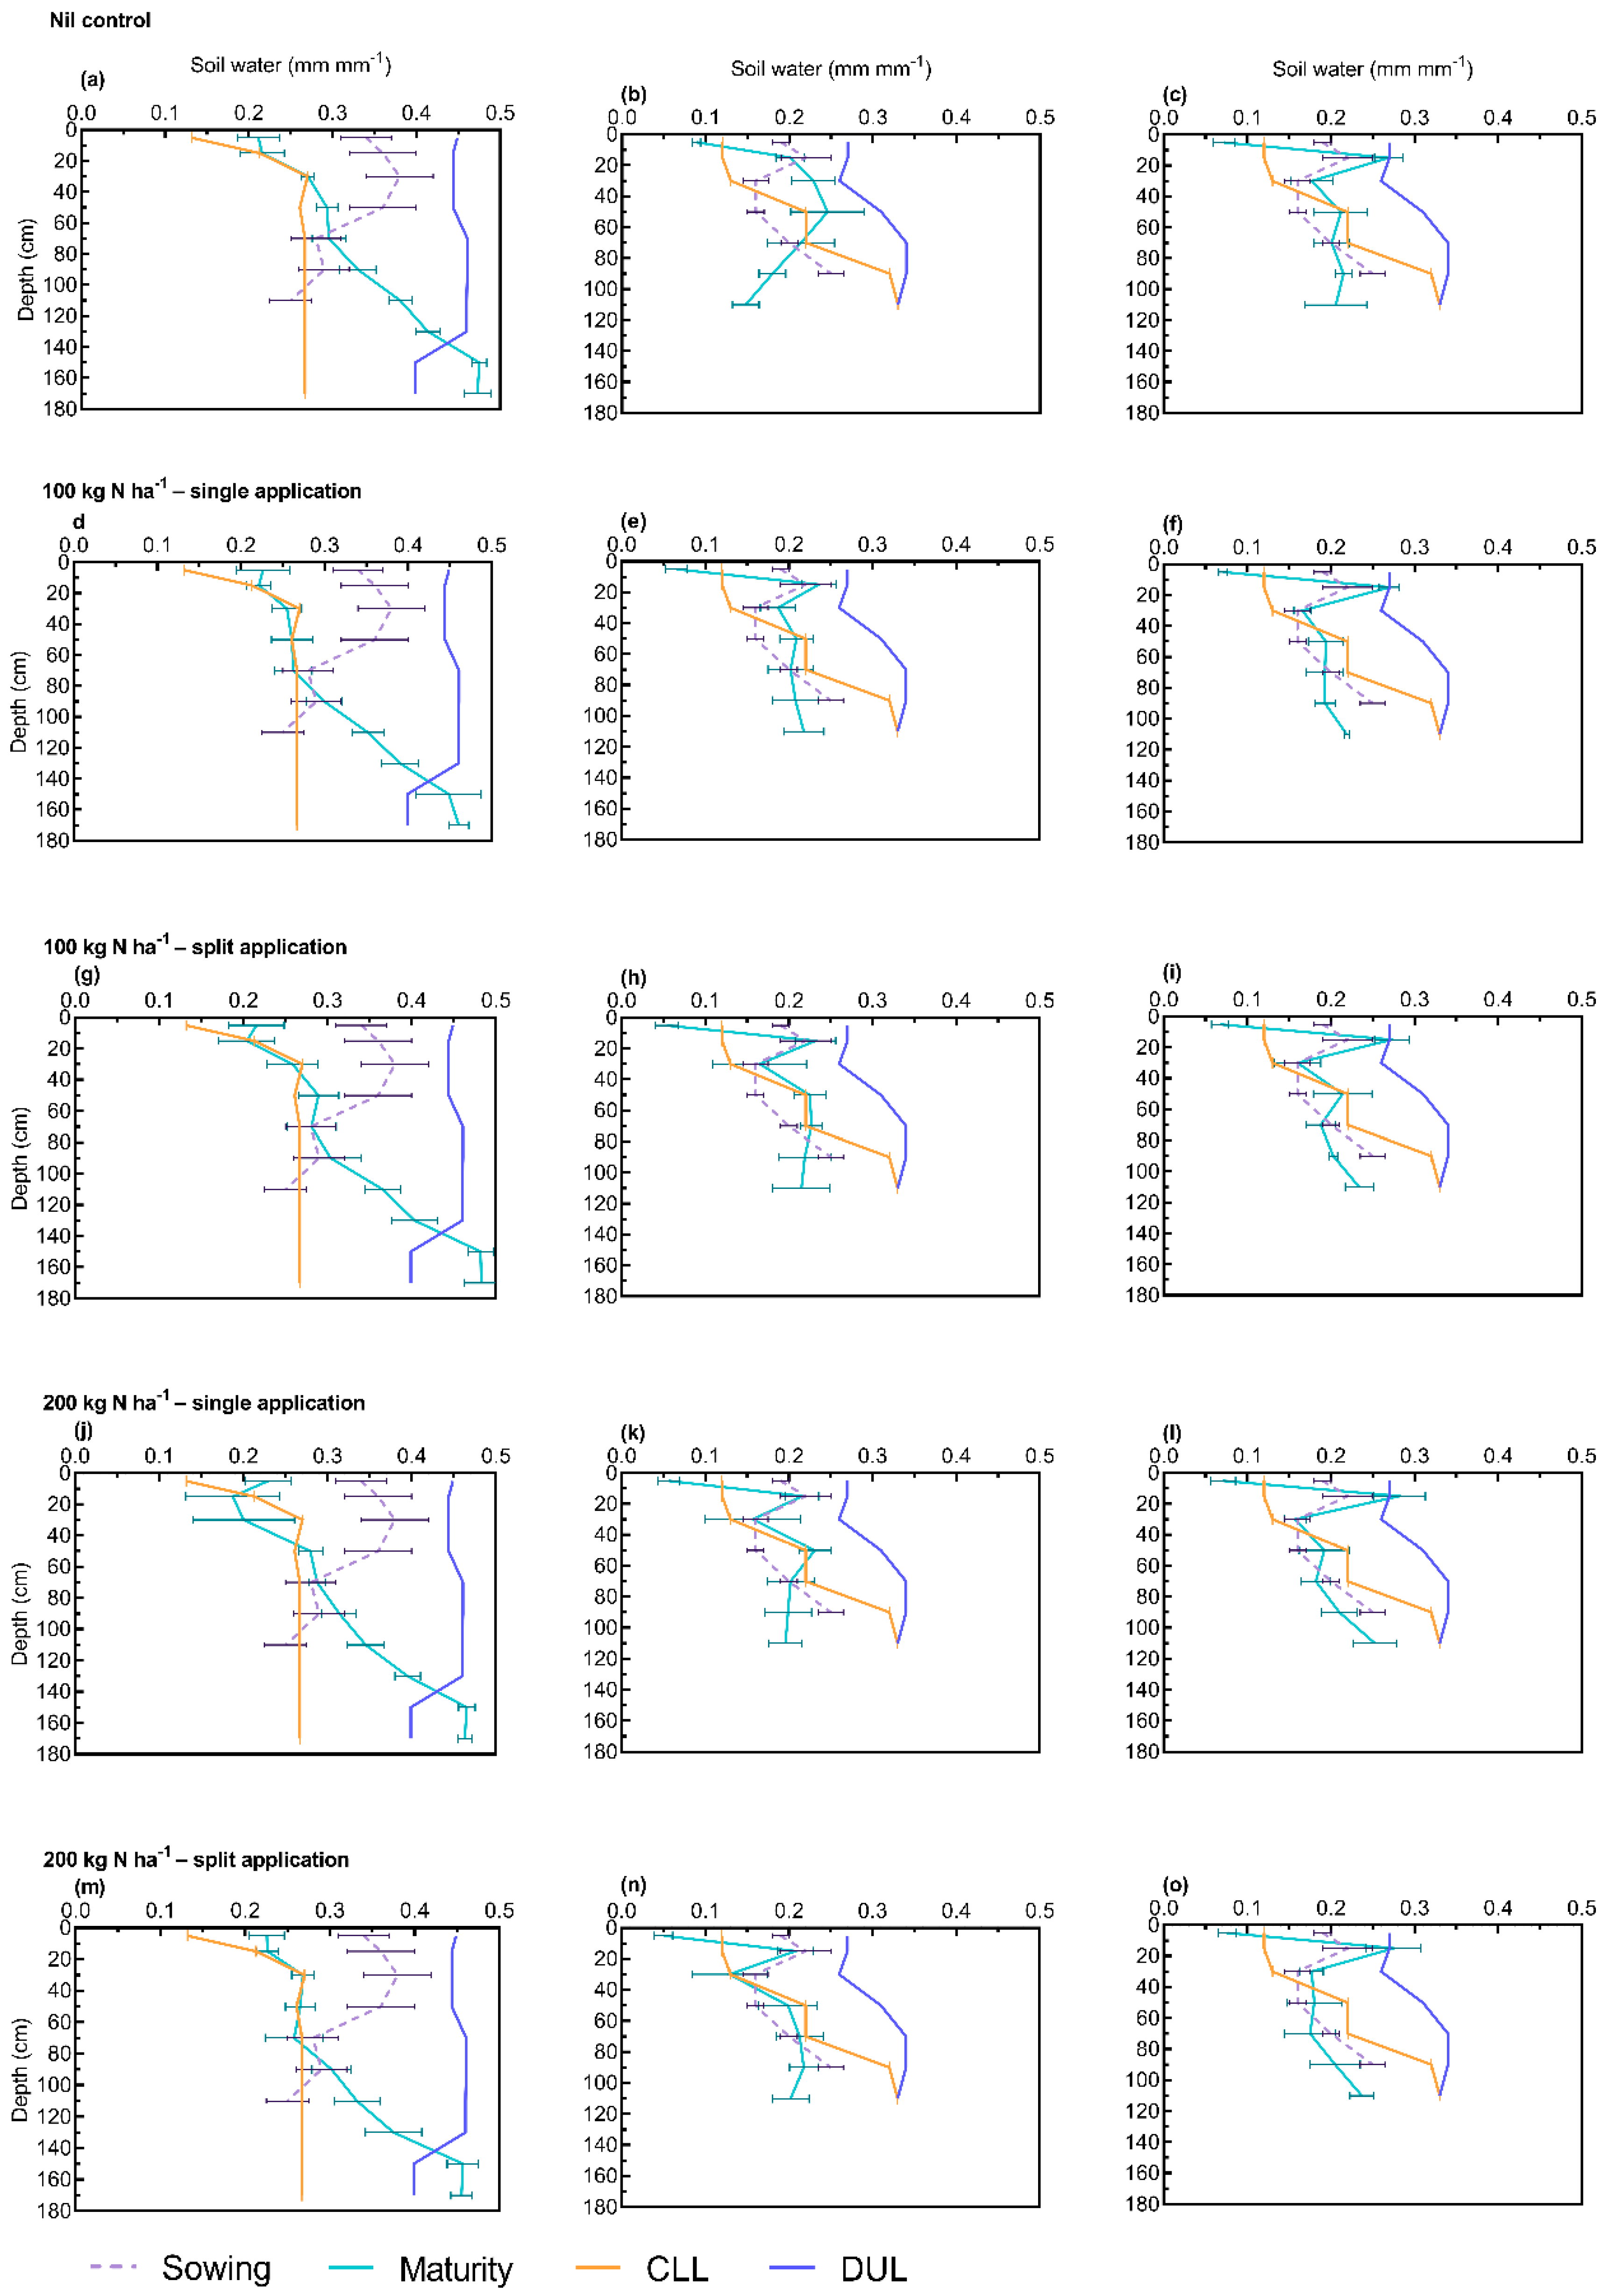
10]. However, crop water use at Tarlee was the same as the irrigated crop at Roseworthy despite receiving 46% more rainfall than water received from rainfall plus irrigation at Roseworthy. The patterns of water extraction at Tarlee indicated the effective root depth was 60–80 cm and the increase in soil moisture below 80 cm suggested the crops were unable to use available subsoil moisture effectively. Canola roots can grow rapidly in moist soil and have been reported to reach more than 2 m from May-sown crops in deep nonconstrained soils [61], so potentially this moisture should have been available to the crop if there was no impediment to root growth. However, in soil with subsoil constraints, canola roots may largely be limited to the top 80 cm [
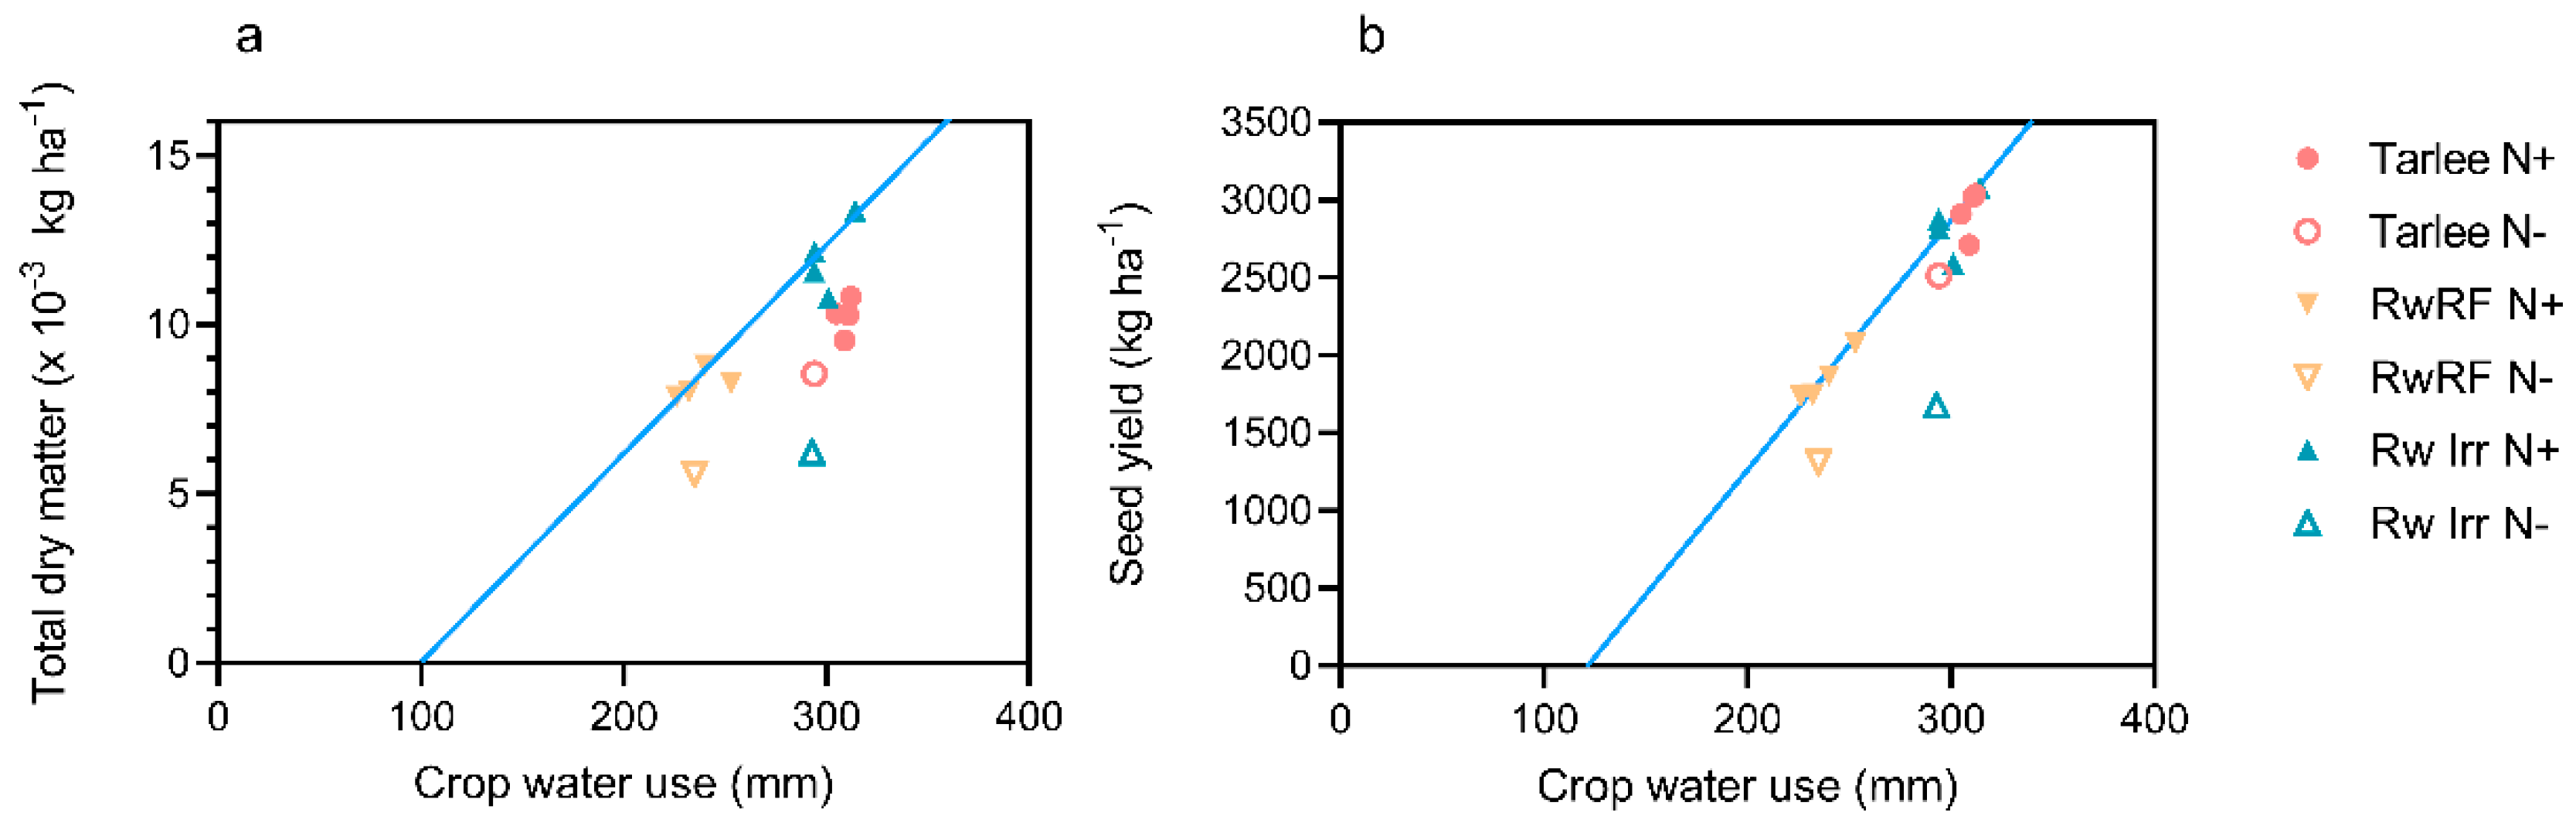
53]. When adequate N was supplied, the WUE at Tarlee was high (Figure 3) and so arguably the limitation to higher yields at Tarlee and responses to N was the inability to use available soil moisture in the subsoil completely rather than use the available water inefficiently. Kirkegaard et al. reported a marginal water-use efficiency of 38 kg ha−1 mm−1 from the additional use of subsoil moisture [61], which is about four times the seasonal WUEGY measured at Tarlee, so even improving the depth of soil water extraction to 1 m could potentially have a large effect on yield. Norton and Wachsmann also showed that small changes in crop water use had a large effect on yield in canola [9]. While a full chemical analysis was not done on the soil at Tarlee, the chemical properties of the nearby reference profile indicates the subsoil is sodic with high chloride and boron concentrations (Table S1), and the depth of root growth was likely limited by these soil properties.
The subsoil at Roseworthy was alkaline and had a much higher EC than Tarlee. The reference profile also indicates the subsoil also has high boron and is sodic (Table S1). The dry soil profile during the experiment makes interpretation of the changes in soil moisture difficult, but the high subsoil EC, boron and exchangeable sodium% may have contributed to a lower crop water use. Similar to Tarlee, when N was supplied the WUE was high (Figure 3), so the major limitation to high yields and WUE was the availability of moisture. However, comparison of water use in the irrigated and rainfed treatments also allowed an estimate of the marginal WUEGY (the increased in yield per mm of additional water use from irrigation) to be calculated and this suggested that even when the water supply was increased, the soil properties may impose a limit on WUE compared to less constrained soils. Irrigation in winter increased subsoil moisture resulting in a marginal WUEGY from irrigation of 13.6 kg ha−1 mm−1. However, this is only one-third of the value reported for canola crops in New South Wales (38 kg ha−1 mm−1), suggesting that while water was being extracted at depth the efficiency with which it was used was low. High salinity can reduce WUEGY of canola [62] and surveys of commercial crops indicate that canola is more sensitive to the limitations of sodic and saline soils than wheat or barley [53]. There has been little work examining the effect of the soil constraints associated with the calcareous and sodic soils in the region on canola growth and water use, but limitations to the ability of crops to extract subsoil water or use it efficiently may be a bottleneck to future improvements in NUE in canola on many of the sodic soils that are common in southern Australia. Poor use of subsoil moisture may also help explain the tendency for crops in the region to have lower HIs since low post flowering water use can reduce HI [52].
At Roseworthy, irrigation improved N uptake by 1.4-fold compared to the rainfed crop, which improved N uptake efficiency and N-use efficiency by 40%. Furthermore, irrigation resulted in a more than 2.0-fold improvement in agronomic efficiency and N-utilization efficiency. Physiological efficiency, apparent recovery and NHI were unaffected by irrigation suggesting that N uptake is a major limitation to yield and NUE in these environments [63]. Improving N uptake will not only be influenced by soil moisture, but the ability of the crop to use available soil moisture.

5. Conclusions

This study revealed that the rate of N application was more critical to yield than the timing of N application. Seed yield of canola was found to be closely associated with total dry matter production and seed m−2. NUE was influenced more by N recovery and uptake, rather than physiological efficiency, which highlights the importance of soil moisture availability and the ability of the crop to exploit soil water and N reserves. There was evidence that the soil properties at these sites may have limited crop water use with effective rooting depths of less than one meter and evidence of poor use of subsoil moisture. Better use of subsoil moisture may be an avenue for further improvements in yield and N responsiveness of canola in this environment and further work on the soil–plant interactions in canola on soils with subsoil constraints may be warranted.

Supplementary Materials

The following are available online at https://www.mdpi.com/2073-4395/10/10/1505/s1, Figure S1: The relationship between seed yield and pod number for canola at Tarlee, Roseworthy irrigated and rainfed treatments, Table S1: Soil properties of the soils at the two sites from the ApSoil data base. The Mudla Wirra profile relates to the Roseworthy site and the Navan West profile relates to the Tarlee site.

Author Contributions

Conceptualization and methodology, A.R., G.K.M. and G.G.; investigation, A.R.; validation and formal analysis A.R. and G.K.M.; data curation, A.R.; writing—original draft preparation, A.R.; writing—review and editing, A.R., G.K.M. and G.G.; visualization, A.R.; supervision, G.K.M. and G.G.; project administration, A.R. and G.K.M.; funding acquisition, A.R. All authors have read and agreed to the published version of the manuscript.

Funding

This research was funded by John Allwright Fellowship from the Australian Center for International Agricultural Research (ACIAR). Grant number: S00052W9.

Acknowledgments

We acknowledge the expert technical support of field research by Jeff Braun, Sam Kleemann, Ben Fleet and Chris Penfold. We also thank Andrew Etherton from Pacific seeds for providing the seed of Hyola575cl.

Conflicts of Interest

The authors declare no conflict of interest. The funders had no role in the design of the study; in the collection, analyses or interpretation of data; in the writing of the manuscript or in the decision to publish the results.

References

  1. Kirkegaard, J.A.; Lilley, J.M.; Morrison, M.J. Drivers of trends in Australian canola productivity and future prospects. Crop Pasture Sci. 2016, 67, i–ix. [Google Scholar] [CrossRef] [Green Version]
  2. ABARES. Australian Agricutural Commodities 2019: Oilseeds; Australian Bureau of Agricultural and Resource Economics and Sciences: Canberra, Australia, 2020. Available online: https://doi.org/10.25814/5de0912755baa (accessed on 15 March 2020).
  3. Lisson, S.N.; Kirkegaard, J.A.; Robertson, M.J.; Zwart, A. What is limiting canola yield in southern New South Wales? A diagnosis of causal factors. Anim. Prod. Sci. 2007, 47, 1435–1445. [Google Scholar] [CrossRef]
  4. Kebede, B.; Thiagarajah, M.; Zimmerli, C.; Rahman, M.H. Improvement of Open-Pollinated Spring Rapeseed (L.) Through Introgression of Genetic Diversity from Winter Rapeseed. Crop Sci. 2010, 50, 1236–1243. [Google Scholar] [CrossRef]
  5. Riar, A.; Gill, G.; McDonald, G. Effect of post-sowing nitrogen management on co-limitation of nitrogen and water in canola and mustard. Field Crop. Res. 2016, 198, 23–31. [Google Scholar] [CrossRef]
  6. Norton, R. Nitrogen management to optimise canola production in Australia. Crop Pasture Sci. 2016, 67, 419–438. [Google Scholar] [CrossRef]
  7. Sadras, V. Interaction between rainfall and nitrogen fertilisation of wheat in environments prone to terminal drought: Economic and environmental risk analysis. Field Crop. Res. 2002, 77, 201–215. [Google Scholar] [CrossRef]
  8. Ma, B.; Herath, A. Timing and rates of nitrogen fertiliser application on seed yield, quality and nitrogen-use efficiency of canola. Crop Pasture Sci. 2016, 67, 167–180. [Google Scholar] [CrossRef]
  9. Norton, R.; Wachsmann, N. Nitrogen use and crop type affect the water use of annual crops in south-eastern Australia. Aust. J. Agric. Res. 2006, 57, 257–267. [Google Scholar] [CrossRef]
  10. Campbell, C.; Zentner, R.; Selles, F.; Biederbeck, V.; McConkey, B.; Lemke, R.; Gan, Y. Cropping frequency effects on yield of grain, straw, plant N, N balance and annual production of spring wheat in the semiarid prairie. Can. J. Plant Sci. 2004, 84, 487–501. [Google Scholar] [CrossRef]
  11. Benjamin, J.G.; Porter, L.K.; Duke, H.R.; Ahuja, L.R. Corn growth and nitrogen uptake with furrow irrigation and fertilizer bands. Agron. J. 1997, 89, 609–612. [Google Scholar] [CrossRef]
  12. Maaz, T.; Pan, W.; Hammac, W. Influence of soil nitrogen and water supply on canola nitrogen use efficiency. Agron. J. 2016, 108, 2099–2109. [Google Scholar] [CrossRef]
  13. Kirkegaard, J.A.; Lilley, J.M.; Brill, R.D.; Ware, A.H.; Walela, C.K. The critical period for yield and quality determination in canola (Brassica napus L.). Field Crop. Res. 2018, 222, 180–188. [Google Scholar] [CrossRef]
  14. Fageria, N.; Baligar, V. Enhancing nitrogen use efficiency in crop plants. Adv. Agron. 2005, 88, 97–185. [Google Scholar]
  15. Grant, C.A.; Peterson, G.A.; Campbell, C.A. Nutrient considerations for diversified cropping systems in the northern Great Plains. Agron. J. 2002, 94, 186–198. [Google Scholar] [CrossRef]
  16. Houshmandfar, A.; Ota, N.; Siddique, K.H.; Tausz, M. Crop rotation options for dryland agriculture: An assessment of grain yield response in cool-season grain legumes and canola to variation in rainfall totals. Agric. Meteorol. 2019, 275, 277–282. [Google Scholar] [CrossRef]
  17. Meier, E.; Lilley, J.; Kirkegaard, J.; Whish, J.; McBeath, T. Management practices that maximise gross margins in Australian canola (Brassica napus L.). Field Crop. Res. 2020, 252, 107803. [Google Scholar] [CrossRef]
  18. Johnston, A.M.; Tanaka, D.L.; Miller, P.R.; Brandt, S.A.; Nielsen, D.C.; Lafond, G.P.; Riveland, N.R. Oilseed crops for semiarid cropping systems in the northern Great Plains. Agron. J. 2002, 94, 231–240. [Google Scholar] [CrossRef] [Green Version]
  19. Grant, C.; Derksen, D.; McLaren, D.; Irvine, R. Nitrogen fertilizer and urease inhibitor effects on canola emergence and yield in a one-pass seeding and fertilizing system. Agron. J. 2010, 102, 875–884. [Google Scholar] [CrossRef]
  20. Pan, W.L.; McClellan Maaz, T.; Hammac, W.A.; McCracken, V.A.; Koenig, R.T. Mitscherlich-modeled, semi-arid canola nitrogen requirements influenced by soil nitrogen and water. Agron. J. 2016, 108, 884–894. [Google Scholar] [CrossRef]
  21. Ahmad, A.; Abrol, Y.; Abdin, M. Effect of split application of sulphur and nitrogen on growth and yield attributes of Brassica genotypes differing in time of flowering. Can. J. Plant Sci. 1999, 79, 175–180. [Google Scholar] [CrossRef]
  22. Barłóg, P.; Grzebisz, W. Effect of timing and nitrogen fertilizer application on winter oilseed rape (Brassica napus L.). II. Nitrogen uptake dynamics and fertilizer efficiency. J. Agron. Crop Sci. 2004, 190, 314–323. [Google Scholar] [CrossRef]
  23. Cheema, M.; Malik, M.; Hussain, A.; Shah, S.; Basra, S. Effects of time and rate of nitrogen and phosphorus application on the growth and the seed and oil yields of canola (Brassica napus L.). J. Agron. Crop Sci. 2001, 186, 103–110. [Google Scholar] [CrossRef]
  24. Taylor, A.; Smith, C.; Wilson, I. Effect of irrigation and nitrogen fertilizer on yield, oil content, nitrogen accumulation and water use of canola (Brassica napus L.). Fertil. Res. 1991, 29, 249–260. [Google Scholar] [CrossRef]
  25. Riar, A.; Gill, G.; McDonald, G. Effect of Post-Sowing Nitrogen Management on Canola and Mustard: I. Yield Responses. Agron. J. 2017, 109, 2266–2277. [Google Scholar] [CrossRef]
  26. Potter, T. The Canola Plant and how it grows. In Canola Best Practice Management Guide for South-Eastern Australia; McCaffery, D., Potter, T., Marcoft, S., Pritchard, F., Eds.; Grains Research & Development Corporation (GRDC): Kingston, ON, Canada, 2009; pp. 11–14. [Google Scholar]
  27. Zhang, H.; Flottmann, S. Source-sink manipulations indicate seed yield in canola is limited by source availability. Eur. J. Agron. 2018, 96, 70–76. [Google Scholar] [CrossRef]
  28. Bernardi, A.; Banks, L. Petiole Nitrate Nitrogen; is it a Good Indicator of Yield Potential in Irrigated Canola, Proceedings of the 9th Australian Research Assembly on Brassicas’, Wagga Wagga, Australia, 5–7 October 1993; Wratten, N., Mailer, R., Eds.; Australian Research Assembly on Brassicas: Wagga Wagga, Australia, 1993; pp. 51–56. [Google Scholar]
  29. Hocking, P.; Randall, P.; DeMarco, D. The response of dryland canola to nitrogen fertilizer: Partitioning and mobilization of dry matter and nitrogen, and nitrogen effects on yield components. Field Crop. Res. 1997, 54, 201–220. [Google Scholar] [CrossRef]
  30. Dreccer, M.; Schapendonk, A.H.; Slafer, G.; Rabbinge, R. Comparative response of wheat and oilseed rape to nitrogen supply: Absorption and utilisation efficiency of radiation and nitrogen during the reproductive stages determining yield. Plant Soil 2000, 220, 189–205. [Google Scholar] [CrossRef]
  31. Habekotté, B. Options for increasing seed yield of winter oilseed rape (Brassica napus L.): A simulation study. Field Crop. Res. 1997, 54, 109–126. [Google Scholar] [CrossRef]
  32. Angus, J.; Van Herwaarden, A. Increasing water use and water use efficiency in dryland wheat. Agron. J. 2001, 93, 290–298. [Google Scholar] [CrossRef]
  33. Cooper, P.; Gregory, P.; Tully, D.; Harris, H. Improving water use efficiency of annual crops in the rainfed farming systems of West Asia and North Africa. Exp. Agric. 1987, 23, 113–158. [Google Scholar] [CrossRef] [Green Version]
  34. Sadras, V.O.; Roget, D.K. Production and environmental aspects of cropping intensification in a semiarid environment of southeastern Australia. Agron. J. 2004, 96, 236–246. [Google Scholar]
  35. French, R.; Schultz, J. Water use efficiency of wheat in a Mediterranean-type environment. I. The relation between yield, water use and climate. Crop Pasture Sci. 1984, 35, 743–764. [Google Scholar] [CrossRef]
  36. Isbell, R. The Australian Soil Classification, Australian Soil and Land Survey Handbook Series 4; CSIRO Publishing: Melbourne, Australia, 2002. [Google Scholar]
  37. FAO-Unesco. FAO-Unesco Soil Map of the World; Food Agriculture Organization of the United Nations (FAO): Rome, Italy, 1998; p. 140. [Google Scholar]
  38. Hazelton, P.; Murphy, B. Interpreting Soil Test Results: What Do All the Numbers Mean; CSIRO Publishing: Melbourne, Australia, 2016. [Google Scholar]
  39. Lancashire, P.D.; Bleiholder, H.; Boom, T.V.D.; Langelüddeke, P.; Stauss, R.; Weber, E.; Witzenberger, A. A uniform decimal code for growth stages of crops and weeds. Ann. Appl. Biol. 1991, 119, 561–601. [Google Scholar] [CrossRef]
  40. Rayment, G.E.; Lyons, D.J. Soil Chemical Methods: Australasia; CSIRO Publishing: Melbourne, Australia, 2011; Volume 3. [Google Scholar]
  41. Rathke, G.-W.; Behrens, T.; Diepenbrock, W. Integrated nitrogen management strategies to improve seed yield, oil content and nitrogen efficiency of winter oilseed rape (Brassica napus L.): A review. Agric. Ecosyst. Environ. 2006, 117, 80–108. [Google Scholar] [CrossRef]
  42. McDonald, G. The contribution of nitrogen fertiliser to the nitrogen nutrition of rainfed wheat crops in Australia: A review. Anim. Prod. Sci. 1989, 29, 455–481. [Google Scholar] [CrossRef]
  43. VSN. GenStat for Windows, 15th ed.; VSN International: Hemel Hempstead, UK, 2012. [Google Scholar]
  44. Hocking, P.; Stapper, M. Effects of sowing time and nitrogen fertiliser on canola and wheat, and nitrogen fertiliser on Indian mustard. I. Dry matter production, grain yield, and yield components. Aust. J. Agric. Res. 2001, 52, 623–634. [Google Scholar] [CrossRef]
  45. Riffkin, P.; Potter, T.; Kearney, G. Yield performance of late-maturing winter canola (Brassica napus L.) types in the High Rainfall Zone of southern Australia. Crop Pasture Sci. 2012, 63, 17–32. [Google Scholar] [CrossRef]
  46. Zar, J.H. Biostatistical Analysis, 4th ed.; Prentice Hall: Upper Saddle River, NJ, USA, 1999. [Google Scholar]
  47. Norton, R. 4R Canola Nutrition Guide; International Plant Nutrition Institution: Norcross, GA, USA, 2013. [Google Scholar]
  48. Lewis, G.; Thurling, N. Growth, development, and yield of three oilseed Brassica species in a water-limited environment. Anim. Prod. Sci. 1994, 34, 93–103. [Google Scholar] [CrossRef]
  49. Sadras, V.O. Yield and water-use efficiency of water-and nitrogen-stressed wheat crops increase with degree of co-limitation. Eur. J. Agron. 2004, 21, 455–464. [Google Scholar] [CrossRef]
  50. Sinclair, T.R.; Rufty, T.W. Nitrogen and water resources commonly limit crop yield increases, not necessarily plant genetics. Glob. Food Secur. 2012, 1, 94–98. [Google Scholar] [CrossRef]
  51. Richards, R.; Thurling, N. Variation between and within species of rapeseed (Brassica campestris and B. napus) in response to drought stress. I. Sensitivity at different stages of development. Crop Pasture Sci. 1978, 29, 469–477. [Google Scholar] [CrossRef]
  52. Unkovich, M.; Baldock, J.; Forbes, M. Variability in harvest index of grain crops and potential significance for carbon accounting: Examples from Australian agriculture. In Advances in Agronomy; Elsevier: Amsterdam, The Netherlands, 2010; Volume 105, pp. 173–219. [Google Scholar]
  53. Nuttall, J.; Armstrong, R. Impact of subsoil physicochemical constraints on crops grown in the Wimmera and Mallee is reduced during dry seasonal conditions. Soil Res. 2010, 48, 125–139. [Google Scholar] [CrossRef]
  54. Hocking, P.; Kirkegaard, J.; Angus, J.; Gibson, A.; Koetz, E. Comparison of canola, Indian mustard and Linola in two contrasting environments. I. Effects of nitrogen fertilizer on dry-matter production, seed yield and seed quality. Field Crop. Res. 1997, 49, 107–125. [Google Scholar] [CrossRef]
  55. Zhao, F.; Evans, E.J.; Bilsborrow, P.E.; Syers, J.K. Influence of sulphur and nitrogen on seed yield and quality of low glucosinolate oilseed rape (Brassica napus L). J. Sci. Food Agric. 1993, 63, 29–37. [Google Scholar] [CrossRef]
  56. Beversdorf, W.; Hume, D.; Daonnelly-Vanderloo, M. Agronomic performance of Trianzine-resistant and susceptible reciprocal spring canola hybrids. Crop Sci. 1988, 28, 932–934. [Google Scholar] [CrossRef]
  57. Scott, R.; Ogunremi, E.; Ivins, J.; Mendham, N. The effect of fertilizers and harvest date on growth and yield of oilseed rape sown in autumn and spring. J. Agric. Sci. 1973, 81, 287–293. [Google Scholar] [CrossRef]
  58. Wright, G.; Smith, C.; Woodroofe, M. The effect of irrigation and nitrogen fertilizer on rapeseed (Brassica napus) production in South-Eastern Australia. Irrig. Sci. 1988, 9, 15–25. [Google Scholar] [CrossRef]
  59. Tayo, T.; Morgan, D. Quantitative analysis of the growth, development and distribution of flowers and pods in oil seed rape (Brassica napus L.). J. Agric. Sci. 1975, 85, 103–110. [Google Scholar] [CrossRef]
  60. Robertson, M.J.; Kirkegaard, J.A. Water-use efficiency of dryland canola in an equi-seasonal rainfall environment. Aust. J. Agric. Res. 2006, 56, 1373–1386. [Google Scholar] [CrossRef]
  61. Kirkegaard, J.; Bullock, M.; Swan, T.; Lilley, J.; Brill, R. 2020 Canola’s Deep Roots—Agronomy to Capture Benefits and Manage Legacies. Available online: https://grdc.com.au/resources-and-publications/grdc-update-papers/tab-content/grdc-update-papers/2020/02/canolas-deep-roots-agronomy-to-capture-benefits-and-manage-legaciesGRDCupdates.WaggaWagga (accessed on 14 August 2020).
  62. Grewal, H.S. Water uptake, water use efficiency, plant growth and ionic balance of wheat, barley, canola and chickpea plants on a sodic vertosol with variable subsoil NaCl salinity. Agric. Water Manag. 2010, 97, 148–156. [Google Scholar] [CrossRef]
  63. Riar, A.; Gill, G.; McDonald, G. Different Post-Sowing Nitrogen Management Approaches Required to Improve Nitrogen and Water Use Efficiency of Canola and Mustard. Front. Plant Sci. 2020, 11, 1111. [Google Scholar] [CrossRef] [PubMed]
Figure 1. Long-term (1876–2013) mean and monthly rainfall during 2013 at Roseworthy (Rw) and Tarlee (Ta) sites. Growth stages (GS) for Rw and Ta measured on the BBCH canola scale are shown: Sowing (S: GS00), rosette stage (Ro: GS30, green bud appearance (GB: GS51), first flower (F:GS60), PD (GS71) and maturity (M: GS97) [39].
Agronomy 10 01505 g001
Figure 2. Relationship between seed yield and seed number for canola at Tarlee, Roseworthy irrigated and rainfed treatments in comparison to other studies from southern and western Australia. Dotted line represents lower boundary function (equivalent to 2.75 mg seed weight) and solid line represents upper boundary function (4.0 mg seed weight) for the relationship [13,25,27,29,44,45].
Agronomy 10 01505 g002
Figure 3. Relationship between crop water use and (a) total dry matter and (b) grain yield for canola at Tarlee rainfed, Roseworthy irrigated (Rw Irr) and rainfed treatments (RwRF) either with no N fertilizer (N−) or with N fertilizer (N+).
Agronomy 10 01505 g003
Figure 4. Soil water distribution in profile at sowing and maturity for Tarlee rainfed (a,d,g,j,m), Roseworthy irrigated (b,e,h,k,n) and Roseworthy rainfed (c,f,i,l,o) for different N regimes of 0, 100 single, 100 split, 200 single and 200 split kg ha−1 N applications, respectively. CLL and DUL are the crop lower limit and drainage upper limit for water extraction from the APSoil data base. Mudla Wirra profile (profile CL028) used for Roseworthy and site the Navan West profile (No. 281) was used for Tarlee.
Agronomy 10 01505 g004
Table 1. Soil characteristics of Roseworthy (RW) and Tarlee sites used in 2013. Analyzed by CSBP Soil and Plant Analysis Laboratories, Perth WA, as explained by Rayment and Lyons [40].
SiteLayerAmmonium NNitrate NElectrical Conductivity (1:5 Soil Water)pH (1:5 Soil Water) Bulk Density
cm(mg kg−1) (mg kg−1) (dS m−1) (g cm−3)
RW0–20819.00.2858.21.2
20–4048.00.5509.01.2
40–6040.91.0639.21.2
60–8020.91.2159.31.3
80–10031.01.7959.41.3
Tarlee0–10311.00.1638.60.9
10–4015.00.1958.81.0
40–70<14.00.3339.21.0
70–100<13.00.6199.41.1
Table 2. Effect of different nitrogen (N) applications on seed yield, total dry matter (TDM), HI and oil content of canola under irrigated and rainfed conditions at Roseworthy *.
Irrigation TreatmentN TreatmentsGY (kg ha−1)TDM (kg ha−1)HIOil Content (%)
Rate (kg ha−1)Time
I0 167662280.2742.8
I100Single259010,7960.2441.5
I100Split281211,5680.2442.9
Mean (100) 270111,1820.2442.2
I200Single307513,3760.2342.4
I200Split286712,1640.2443.0
Mean (200) 297112,7700.2342.7
RF0 131055870.2443.2
RF100Single174580020.2242.3
RF100Split173674730.2342.3
Mean (100)174177380.2342.3
RF200Single186688120.2144.1
RF200Split207482720.2542.5
Mean (200)197085420.2343.3
LSD 0.05
Irrigation (I)1932285NSNS
N treatments (N) (nil vs. N fertilizer)35415770.01NS
I × NNS2179NSNS
N . RateNSNSNSNS
N . TimeNSNS0.02NS
N . (I × Rate)NSNSNSNS
N . (I × Time)NSNSNS1.4
N . (Rate × Time)NSNSNSNS
N . (I × Rate × Time)NSNSNSNS
* Within each irrigated treatment, the N plots were a nil control plus a factorial combination of N rate and N timing. The N effect tests the nil N treatment vs. the application of N across both irrigation treatments and all rates and times of application, while the main effect of the rate of N is indicated by N . Rate and the main effect of time of N application by N . Time. The interaction between N rate and timing among the treatments that received N is shown as N . (Rate × Time) and the interactions with irrigation as N . (I × Rate), N . (I × Time) and N . (I × Rate × Time).
Table 3. Effect of different N applications on yield, total dry matter (TDM), HI and oil content of canola under rainfed conditions at Tarlee *.
N TreatmentsGY (kg ha−1)TDM (kg ha−1)HIOil Content (%)
Rate (kg ha−1)Time
0 251385550.2844.7
100Single302110,2830.2943.9
100Split290810,3290.2544.4
Mean (100)296510,3060.2744.1
200Single271195340.2843.7
200Split303810,8280.2644.1
Mean (200)287510,1810.2743.9
LSD 0.05
N treatments (N) (nil vs. N fertilizer)3341463NS0.4
N . RateNSNSNSNS
N . TimeNSNS0.030.4
N . (Rate × Time)NSNSNSNS
* The N trial was designed as a nil control plus a factorial combination of N rate and N timing. The N effect tests the nil N treatment vs. the application of N across all rates and times of N application, while the main effect of the rate of N is indicated by N . Rate and the main effect of time of N application by N . Time. The interaction between N rate and timing among the treatments that received N is shown as N . (Rate × Time).
Table 4. Effect of different N application on yield components of canola under irrigated and rainfed conditions at Roseworthy *.
Irrigation TreatmentN TreatmentsPods m−2 × 10⁻³Seed m−2 × 10−31000 Seed Weight (g)Seed Pod−1
Rate (kg ha−1)Time
I0 4.044.83.7312.7
I100Single7.161.84.1912.7
I100Split7.770.63.988.0
Mean (100)7.466.24.0910.3
I200Single10.179.13.8913.7
I200Split12.472.43.9611.0
Mean (200)11.275.73.9312.3
RF0 3.836.53.5914.7
RF100Single8.853.73.2511.0
RF100Split6.452.03.3418.0
Mean (100)7.652.83.3014.5
RF200Single6.053.23.5116.0
RF200Split8.754.33.8212.0
Mean (200)7.453.73.6714.0
LSD 0.05
Irrigation (I)0.85.10.031.3
N treatments (N) (nil vs. N fertilizer)0.89.40.03NS
I × N1.0NS0.04NS
N . Rate0.8NS0.031.1
N . Time0.8NS0.031.1
N . (I × Rate)1.1NS0.041.4
N . (I × Time)1.1NS0.041.4
N . (Rate × Time)1.0NS0.041.2
N . (I × Rate × Time)1.3NSNS1.7
* Within each irrigated treatment, the N plots were a nil control plus a factorial combination of N rate and N timing. The N effect tests the nil N treatment vs. the application of N across both irrigation treatments and all rates and times of application, while the main effect of the rate of N is indicated by N . Rate and the main effect of time of N application by N . Time. The interaction between N rate and timing among the treatments that received N is shown as N . (Rate × Time) and the interactions with irrigation as N . (I × Rate), N . (I × Time) and N . (I × Rate × Time).
Table 5. Effect of different N applications on yield components of rainfed canola at Tarlee site *.
N TreatmentsPods m−2 × 10⁻³Seed m−2 × 10−31000 Seed Weight (g)Seed Pod−1
Rate (kg ha−1)Time
0 4.994.82.4920.5
100Single7.699.92.8419.5
100Split5.7104.72.4321.3
Mean (100)6.7102.32.6320.4
200Single11.3111.02.4515.0
200Split6.6113.02.5217.5
Mean (200)8.9112.02.4916.3
LSD 0.05
N treatments (N) (nil vs. N fertilizer)1.4NS0.040.6
N . Rate1.5NS0.040.7
N . Time1.5NS0.040.7
N . (Rate × Time)1.8NS0.05NS
* The N trial was designed as a nil control plus a factorial combination of N rate and N timing. The N effect tests the nil N treatment vs. the application of N across all rates and times of N application, while the main effect of the rate of N is indicated by N . Rate and the main effect of time of N application by N . Time. The interaction between N rate and timing among the treatments that received N is shown as N . (Rate × Time).
Table 6. Effect of different N applications on water use, water-use efficiency, N uptake efficiency, N-use efficiency for seed yield and nitrogen harvest index (NHI) of canola under irrigated and rainfed conditions at Roseworthy *.
Irrigation TreatN TreatmentsWU (mm)WUEGY (kg mm−1 ha−1)WUEDM (kg mm−1 ha−1)Total N Uptake (kg ha−1)N Up Efficiency (kg kg−1)NUESY (kg kg−1)NHI
Rate (kg ha−1)Time
I0 2935.821.41511.2113.410.38
I100Single3018.635.92531.1211.510.34
I100Split2949.639.32100.9312.500.44
Mean (100)2989.137.62311.0312.000.39
I200Single31410.043.62830.879.460.36
I200Split2949.741.32400.748.820.38
Mean (200)3049.942.52610.809.140.37
RF0 2355.724.11110.8910.480.39
RF100Single2327.634.81800.807.760.34
RF100Split2268.034.51690.757.720.35
Mean (100)2297.834.71740.777.740.34
RF200Single2407.836.81790.555.740.31
RF200Split2538.533.61740.546.380.40
Mean (200)2478.235.21760.546.060.35
LSD 0.05
Irrigation (I)54NS2.1380.240.82NS
N treatments (N) (nil vs. N fertilizer)NS1.56.6430.231.741NS
N × INSNSNSNSNSNSNS
N . RateNSNSNSNSNSNSNS
N . TimeNSNSNSNSNSNSNS
N . (I × Rate)NSNSNSNSNSNSNS
N . (I × Time)NSNSNSNSNSNSNS
N . (Rate × Time)NSNSNSNSNSNSNS
N . (I × Rate × Time)NSNSNSNSNSNSNS
* Within each irrigated treatment, the N plots were a nil control plus a factorial combination of N rate and N timing. The N effect tests the nil N treatment vs. the application of N across both irrigation treatments and all rates and times of application, while the main effect of the rate of N is indicated by N . Rate and the main effect of time of N application by N . Time. The interaction between N rate and timing among the treatments that received N is shown as N . (Rate × Time) and the interactions with irrigation as N . (I × Rate), N . (I × Time) and N . (I × Rate × Time).
Table 7. Effect of different N applications on water use, water-use efficiency, N uptake efficiency, N-use efficiency for seed yield and nitrogen harvest index (NHI) of rainfed canola at Tarlee site *.
N TreatmentsTotal WU (mm)WUEGY (kg mm−1 ha−1)WUEDM (kg mm−1 ha−1)Total N Uptake (kg ha−1)N Uptake Efficiency (kg kg−1)NUESY (kg kg−1)NHI
Rate (kg ha−1)Time
0 2948.5329.01791.2617.70.42
100Single3119.7233.12370.9812.50.39
100Split3058.9234.02310.9511.20.35
Mean (100)3089.3233.52340.9711.80.37
200Single3099.4731.02360.698.50.38
200Split3129.7535.02470.728.90.38
Mean (200)3109.6133.02410.718.70.38
LSD 0.05
N treatments (N) (nil vs. N fertilizer)10NSNS410.221.7NS
N . RateNSNSNSNS0.241.9NS
N . TimeNSNSNSNSNSNSNS
N . (Rate × Time)NSNSNSNSNSNSNS
* The N trial was designed as a nil control plus a factorial combination of N rate and N timing. The N effect tests the nil N treatment vs. the application of N across all rates and times of N application, while the main effect of the rate of N is indicated by N . Rate and the main effect of time of N application by N . Time. The interaction between N rate and timing among the treatments that received N is shown as N . (Rate × Time).
Table 8. Effect of irrigation and different N applications on agronomic efficiency, physiological efficiency, apparent recovery, utilization efficiency and agro-physiological efficiency of canola under irrigated and rainfed conditions at Roseworthy (see definitions and equations in Section 2.4).
Irrigation TreatmentN TreatmentsAgronomic Efficiency (kg kg−1)Physiological Efficiency (kg kg−1)Apparent Recovery (%)Utilization Efficiency (kg kg−1)Agro-Physiological Efficiency (kg kg−1)
Rate (kg ha−1)Time
I100Single9.145682.354.89.1
I100Split11.366458.664.831
Mean (100)10.256070.559.820.1
I200Single6.997365.942.711.1
I200Split5.968744.535.614.8
Mean (200)6.488055.239.213.0
RF100Single4.358345.628.513.8
RF100Split4.263757.523.16.8
Mean (100)4.316051.625.810.3
RF200Single2.786933.918.910.3
RF200Split3.827231.517.217.3
Mean (200)3.307132.718.113.8
LSD 0.05
Irrigation (I)1.819NSNS10.47NS
I × Rate2.572NSNS14.8NS
I × TimeNSNSNSNSNS
I × Rate × TimeNSNSNSNSNS
Table 9. Effect of different N applications on agronomic efficiency, physiological efficiency, apparent recovery, utilization efficiency and agro-physiological efficiency of rainfed canola at Tarlee site (see definitions and equations in Section 2.4).
N TreatmentsAgronomic Efficiency (kg kg−1)Physiological Efficiency (kg kg−1)Apparent Recovery (%)Utilization Efficiency (kg kg−1)Agro-Physiological Efficiency (kg kg−1)
Rate (kg ha−1)Time
100Single5.132.658.222.410.9
100Split2.040.951.619.75.8
Mean (100)3.536.854.921.18.4
200Single2.037.728.56.99.6
200Split2.648.133.914.08.3
Mean (200)2.342.931.210.59.0
LSD 0.05
RateNSNS21.28.5NS
TimeNSNSNSNSNS
Rate × Time2.3NSNSNSNS

