Article

Water and Soil Nutrient Dynamics of Huanglongbing-Affected Citrus Trees as Impacted by Ground-Applied Nutrients

by
Alisheikh A. Atta
1,*,
Kelly T. Morgan
1,
Said A. Hamido
1,
Davie M. Kadyampakeni
2 and
Kamal A. Mahmoud
1
1
Southwest Florida Research and Education Center, University of Florida, 2685 SR 29 N, Immokalee, FL 34142, USA
2
Citrus Research and Education Center, 700 Experiment Station Rd, Lake Alfred, FL 33850, USA
*
Author to whom correspondence should be addressed.
Agronomy 2020, 10(10), 1485; https://doi.org/10.3390/agronomy10101485
Submission received: 20 August 2020 / Revised: 18 September 2020 / Accepted: 22 September 2020 / Published: 28 September 2020
(This article belongs to the Section Soil and Plant Nutrition)

Abstract

:
The decrease in the rate of inflow and outflow of water—and thereby the uptake of plant nutrients as the result of Huanglongbing (HLB or citrus greening)—leads to a decline in overall tree growth and the development of nutrient deficiencies in HLB-affected citrus trees. This study was conducted at the University of Florida, Southwest Florida Research and Education Center (SWFREC) near Immokalee, FL from January 2017 through December 2019. The objective of the study was to determine the effect of rootstocks, nutrient type, rate, and frequency of applications on leaf area index (LAI), water relations (stomatal conductance [gs], stem water potential [Ψw], and sap flow), soil nutrient accumulation, and dynamics under HLB-affected citrus trees. The experiment was arranged in a split-split plot design that consisted of two types of rootstocks, three nitrogen (N) rates, three soil-applied secondary macronutrients, and an untreated control replicated four times. LAI significantly increased in response to the secondary macronutrients compared with uncontrolled trees. A significantly greater gs, and thus a decline in Ψw, was a manifestation of higher sap flow per unit LA (leaf area) and moisture stress for trees budded on Swingle (Swc) than Cleopatra (Cleo) rootstocks, respectively. The hourly sap flow showed significantly less water consumption per unit LA for trees that received a full dose of Ca or Mg nutrition than Ca + Mg treated and untreated control trees. The soil nutrient concentrations were consistently higher in the topmost soil depth (0–15 cm) than the two lower soil depths (15–30 cm, 30–45 cm). Mobile nutrients: soil nitrate–nitrogen (NO3-N) and Mg2+ Mg2+, Mn2+, Zn2+, and B leached to the lower soil (15–30 cm) depth during the summer season. However, the multiple split applications of N as Best Management Practices (BMPs) and optimum irrigation scheduling based on reference evapotranspiration (ETo) maintained soil available N (ammonium nitrogen [NH4-N] and NO3-N) below 4.0 mg kg−1, which was a magnitude 2.0–4.0× less than the conventional N applications. Soil NH4-N and NO3-N leached to the two lower soil depths during the rainy summer season only when trees received the highest N rate (280 kg ha−1), suggesting a lower citrus N requirement. Therefore, 224 kg ha−1 N coupled with a full Ca or Mg dose could be the recommended rate for HLB-affected citrus trees.

1. Introduction

Florida is the second-largest producer of U.S. citrus fruit, accounting for 41% in the 2016–2017 and 2017–2018 growing season [1]. During the last 15 years, the Florida citrus industry has experienced significant citrus production decline because of Huanglongbing (HLB) disease outbreaks. HLB is a destructive disease, caused by the phloem-limited bacterium ‘Candidatus Liberibacter asiaticus’, and it was first identified in Florida in 2005 where currently dispersed throughout the commercial citrus groves [2]. After a citrus tree is infected with Candidatus Liberibacter asiaticus, photosynthesis, xylem sap flow, phloem movement, fine root length density (FRLD), and water and nutrient uptake are severely affected [2,3,4]. Furthermore, the availability of water is one of the most significant restrictions on crop production in Florida. In contrast, higher irrigation amounts could result in a substantial runoff of nutrients and herbicides from the citrus root zone through deep percolation. It has been reported that HLB can cause nutrient deficiency for divalent cations, including Ca2+, Mg2+, Mn2+, and Zn2+ [5,6]. Meanwhile, ground-applied fertilizers are subject to various soil processes, including the precipitation of nutrients to forms inaccessible to plants roots, leaching, and runoff [7,8]. Additionally, due to lower fibrous root density, HLB-affected trees roots are restricted to soil nutrient uptake [9,10,11,12].
Florida citrus growers typically use either bulk blended and water-soluble fertilizers of N-potassium (K+) combinations or complete N–P–K fertilizers along with micronutrients [13]. Yet, the leaching of N and P from agricultural fields in general and citrus grove in particular is a water quality concern globally because of an increase in NO3-N concentration and the eutrophication of water bodies [14,15,16,17]. Moreover, the Ca2+ channel may cause cell membrane damage, thus resulting in cytoplasm leakage, which serves as a source for pathogens [18]. The apparent decrease in Ca concentrations in HLB-affected citrus trees may occur primarily because of restrictions in nutrient uptake and movement [19], and it is an essential feature of HLB-induced physiological disorders [5]. Magnesium (Mg2+), as a mobile element that may be leached in sandy soils as a result of excessive rainfall or irrigation, could eventually contribute to soil acidification and result in plant nutrient deficiency [20,21].
Agriculture consumes the highest water volume globally, accounting for 70% of all worldwide freshwater withdrawals [22,23]. Florida citrus accounts for the highest share (30%) of irrigated cropland acreage, with a projected crop water consumption of 1888 megaliters water per day contributing 24% of the statewide irrigation demand by the crop for 2016–2020 [24]. Water is expected to remain the limiting factor for the citrus industry [2,11,12,25] because of Florida’s sandy soil, low water-holding capacity, irregular rainfall pattern, and poor fibrous root density of HLB-affected citrus trees [9,11,25,26,27]. Fertigation programs to circumvent rainy periods or excessive irrigation, and splitting the annual fertilizer requirement into more than fifteen split applications, will probably reduce nutrient leaching potentials [8,16,17,28]. Therefore, the growers in the citrus industry must improve sustainable N use efficiency, because the total maximum allowable daily load of N and/or implementation will restrict N use in the watersheds where citrus trees are grown [13]. Since HLB-affected citrus trees have as low as 50% potential root density [2,6,11], trees are subjected to low water and nutrient uptake [11,25]. The link between mineral nutrients and plant disease ultimately influences the severity of disease disorders, thus prompting a paradigm shift toward ameliorating disease symptoms by improving nutrient and water use efficiency [13,29,30]. The objectives of the current study were to determine the effect of rootstocks, nutrient type, and frequency of application on tree leaf area index (LAI), water relations (stomatal conductance, Ψw, and sap flow), soil nutrient accumulation, and the dynamics of HLB-affected citrus trees.

2. Materials and Methods

2.1. Site Conditions, Experimental Design, and Irrigation

The study was conducted at the University of Florida, SWFREC nears Immokalee, FL (26°27′44″ N and 81°26′36″ W) from 2017 to 2019. The citrus trees cv. ‘Hamlin’ (Citrus sinensis [L.] Osbeck) budded on Cleopatra (Citrus reshni) or Swingle (Swc citrumelo (Citrus paradisi Macf. Poncirus trifoliata [L.] Raf.) rootstocks were planted in 2006 on Immokalee fine sand (sandy, siliceous, hyperthermic Arenic Alaquods). Foliar laboratory results at the beginning of the study, using quantitative real-time polymerase chain reaction (qPCR), indicated that the trees were positive for the HLB-associated bacterium, ‘Candidatus Liberibacter asiaticus’ with Ct value of 25.9 ± 0.25 and 24.7 ± 0.36 for trees budded on Cleo and Swc rootstocks, respectively. The experiment had three main effects, namely: two rootstocks, three N rates, and three secondary macronutrient rates. The treatments were arranged in a split-split plot design comprised of the largest plot assigned with the rootstocks, the intermediate sub-plots were the N rates (168, 224, and 280 kg ha−1), and three soil-applied secondary macronutrients (Ca or Mg-thiosulfates) rates and untreated control trees replicated four times. Within the intermediate N rate plots, each sub-sub-plot received one of the following treatments: untreated control, and one of the three secondary macronutrients (Ca or Mg at 45 kg ha−1 and Ca + Mg at 22 kg ha−1 each) as recommended by the University of Florida, Institute of Food and Agricultural Sciences for citrus nutrition. The K fertilizer (K2O) was applied at 168 kg ha−1 and applied to the largest plot uniformly to all trees. The N and K were applied as split forms on a biweekly basis, resulting in 20 applications per year between February and November in each study year.
All trees were irrigated with a micro-sprinkler placed approximately 15 cm from the tree trunk to keep the soil near field capacity. The micro-sprinkler irrigation was accommodated with a 172.4 kpa irrigation pump and a flow rate of 45 L h−1 with Max-14 (Maxijet Inc., Dundee, FL, USA), stream Jet fill-in blue deflector of 360. The trees received daily irrigation determined with irrigation scheduling citrus Smartphone programming apps (e.g., smartphones, tablets), which are available on the two mobile operating systems: iOS and Android interfaces (http://smartirrigationapps.org/). These SmartIrrigation apps are invented to estimate the irrigation duration for specific crops (i.e., avocado, blueberries, citrus, corn, cotton, peach, peanut, strawberry, soybean, and vegetables) using ETo estimated with the Food and Agricultural Organization (FAO) Penman–Monteith and crop coefficient associated with real-time meteorological information acquired from the Florida Automated Weather Network located 200 m away from the study site (https://fawn.ifas.ufl.edu/data/reports/).

2.2. Leaf Area Index

Leaf area index, a unit green leaf area per unit of ground surface area, is an indicator of above-ground vegetation density, where essential biological processes such as light interception, heat energy and sap flow, photosynthesis, and evapotranspiration are performed. The non-destructive measurement of LAI was estimated from the transmission of radiation through the canopy using the radiative transfer principle [29]. The LAI of each tree was determined using a SunScan canopy sensor system (Dynamax Inc., Houston, TX, USA) during a sunny day when the direct solar beam was at its solar zenith angle <±10° (±0.1) (1130 to 1330 HR). The delta-T device BF5 Sunshine Sensor (Dynamax, Inc, Houston, TX, USA) measures global and diffuse components of incident light and sends a signal to the SunScan, which in turn provides information about the penetration of light into crops. An Emulator mode of the Personal Digital Assistant (PDA) running SunData software simulates SunScan and the BF5 sensor, which eventually provides the LAI readings. The LAI was determined by taking the average of four readings per tree across the four directions: east, west, north, and south from the trunk of three sub-plots and replicated four times (n = 48).

2.3. Water Relations

2.3.1. Stomatal Conductance (gs)

Stomatal conductance (gs) was measured on three fully expanded mature and fully sunlit spring and summer leaves per plant contained in three plots replicated four times per treatment (n = 36). The leaves were selected from the upper 2/3 of the tree canopy, the outermost part of the tree facing to the southwest, measured during sunny days, in spring (February or March) and summer (August or September) of each year [31,32]. Stomatal conductance (gs) was conducted in the late morning (1000 to 1200 HR) to avoid high afternoon temperatures and low humidity, which otherwise would decrease gas exchange [31]. Measurements were taken using a steady-state porometer (Model LI 1600; LI-COR Inc., Lincoln, NE, USA).

2.3.2. Stem Water Potential (Ψw)

The Ψw was measured on three matured spring (February or March) and summer (August or September) leaves per tree of three sub-sub-plots and replicated four times (n = 36) in the 2017 and 2018 growing seasons. The leaves were selected from the outermost part of the tree facing to the southwest and upper ≈½ of a tree canopy. Each leaf was covered with a transparent plastic sheath followed by aluminum foil [33,34,35]. Leaves including the petiole were cut from the shoot, and the Ψw was measured using a pressure chamber (Model 3005 plant water status console; Soil Moisture Equipment Corporation, Santa Barbara, CA, USA) [25,36,37]. After an equilibrium period of 24 h Ψw of enclosed leaves, the measurement of the Ψw was completed at mid-day (1200 to 1300 HR) [34,38].

2.3.3. Sap Flow

Sap flow measurement was performed from mid-April to early May in 2017, 2018, and 2019. The sap flow was determined with sap flow sensors (Flow32-1K; Dynamax®, Houston, TX, USA) attached to two branches per tree of four trees per cycle and replicated four times [11,25,27,39]. A branch diameters ranging from 13 to 25 mm were randomly selected as per the size of the sensors to fit on the branches. The trunks were rubbed with thin silicone grease (Dow Corning 4; Dow Corning, Midland, MI, USA) to improve the contact of the sensors with the branch and minimize the branches from thermal damage. The sap flow sensors were attached to a data logger (CR 1000, Campbell Scientific Inc., Logan, UT, USA) registering the data each hour for two weeks, which is a typical standard duration used for the stem heat balance (SHB) technique [40,41,42]. The leaf area on measured stems was measured using a digital portable leaf area meter (LI-COR LI-3000A and LI-3050A/4, Columbia, MO, USA) [41,42]. Sap flow data were recorded by the data logger (g h−1) and were converted to water flow per unit leaf area [25,42].

2.4. Soil Nutrient Concentrations

Soil samples were collected from three different sites in three soil depths: 0–15, 15–20, and 30–45 cm using a 2.5 cm internal diameter (i.d.) soil core sampler in March and August of each year. The samples were collected within 0.5–1.0 m radius from the tree trunk under the tree canopy. The collected samples were pooled into a sampling bag consistent with their depths and stored at a freezer pending for soil extraction [9]. Soil NH4-N and NO3−1N concentration were determined using the 2M KCl extraction procedure [43]. Approximately 5.0g (±0.05) of wet soil was weighed, and 40 mL of 2M KCl solution was added into an extraction tube [44]. Separate soil samples were used to measure the moisture content in the wet soil sample used for extraction because the analytical results were calculated on an oven-dry soil basis. Soil NH4-N and NO3-N were determined using a spectrophotometric Microplate Reader (Epoch BioTec, Winooski, VT, USA) technique at 630 and 540 nm, respectively.
Dry soil samples of 2.5g (±0.05) and 25 mL of Mehlich III extractant, (0.2 M CH3COOH + 0.015 M NH4F + 0.013 M HNO3 + 0.001 M EDTA + 0.25 M H4NO3) were placed into an extraction tube [45,46]. The sample was capped and shaken for 5 min at a high rate (200 reciprocating per minute). After shaking, all the sample solutions were allowed to settle for 30 min and filtered using Fisher Scientific filter paper medium porosity placed onto labeled vials and stored in a freezer until analysis. Mehlich III extractant of soil P, K, Ca, Mg, Zn, Cu, Mn, and B were analyzed using inductively coupled plasma optical emission spectroscopy (ICP-OES) (Spectro Ciros CCD, Fitzburg, MA) [6]. All results were expressed on an oven-dry soil weight basis.

2.5. Statistics and Data Analysis

Three-way analysis of variance (ANOVA) was used to determine treatment effects on LAI, gs, Ψw, and soil nutrient concentration. Repeated-measures analysis of the PROC General Linear Model (GLM) procedures SAS 14.1 (SAS Institute, Cary, NC, USA) was used to analyze the data. The data were tested for linearity, normality, homogeneity of variance, and independent errors before the derivable statistics analyses were performed. For those data that fail to satisfy the above four assumptions, log-transformation was used to make the data conform to normality. For F-tests with a statistical difference at (p ≤ 0.05), the Tukey–Kramer honestly significant difference grouping range test was used to compare the means. All graphs were formed, and the logarithmic relationships between the sap flow and solar radiation were analyzed using Sigma Plot 14 (SigmaPlot 14, Systat Software, San Jose, CA, USA).

3. Results and Discussion

3.1. Leaf Area Index

During spring 2018, LAI was significantly greater for trees that received secondary macronutrients than the untreated control trees for trees budded on Cleo rootstocks as compared with Swc rootstocks (Table 1). Conversely, there was no significant difference detected for trees budded on Swc rootstocks under the secondary macronutrients. In the summer of the same year, a significantly greater LAI increment was observed for both rootstocks. During summer 2018, the increase in LAI was 1.2×, 1.5×, and 1.5× more and 1.3×, 1.3×, and 1.9× more under the secondary macronutrient as compared with the untreated control trees for trees budded on Cleo and Swc rootstocks, respectively. Invariably, in summer 2019, LAI showed an increase of 3.1×, 3.2×, and 3.5× and 4.4×, 2.6×, and 2.7× more under the secondary macronutrient relative to the untreated control trees for trees budded on Cleo and Swc rootstocks, respectively. In the 2018 growing seasons, variation in LAI was eliminated when trees on both rootstocks received the highest N rate. This implied that for every increase in N above the moderate N rate, the trees budded on Swc rootstocks responded higher compared with trees budded on Cleo rootstocks.
Previous studies indicated that fleshy fruits responded to a higher N rate during the early stage of tree growth, and the reaction decline significantly in the later growth stages [47,48,49,50]. During spring seasons, the value of LAI reduces because of the cold winter season, massive leaf and branch drop, and fruit harvest, but it revives when the temperature increases during the spring seasons. Generally, leaf flush in Florida citrus trees occurs during early spring (February/March), early summer (May/June), and late summer (September/October). The summer season produces larger, greater numbers of leaves per shoot and more LAI per tree [51].

3.2. Meteorological Conditions

The meteorological data obtained from the Florida Automated Weather Network, located 200 m from the study site, indicate that the weather conditions were suitable for the citrus production (http://fawn.ifas.ufl.edu/). The ETo increased by almost 3× from 1.5 mm day−1 during cold weather (December 2017) to 4.3 mm day−1 during warm weather (July 2018). Rainfall data, ETo, and other climatic variables were obtained from Florida Automated Weather Network (FAWN) stations located 200 m from the study site (Supplementary Figure S1). In addition, precipitation patterns were not uniform during the same period; cumulative precipitation increased by 9.5× from 24 mm during November 2017 to 229 mm during August 2018. Evapotranspiration is a dominating determinant in the water cycle for most crops, including citrus; therefore, it represents a crucial role in agrarian irrigation management [41,42,52]. Irrigation was delayed for 48 h for rainfall events recorded between 6 and 12 mm day−1 during the study period as per the Citrus Microsprinkler Irrigation Scheduler. The minimum, maximum, and average solar radiation in the three years during the peak sap flow (1000–1600 HR) reading were 510, 789.3, and 692.2 ± 15.5 J m−2 s−1, respectively. Similarly, the minimum, maximum, and average air temperature readings were 25.9, 29.2, and 27.9 ± 0.23 °C, respectively (Supplementary Figure S2).

3.3. Water Relations

3.3.1. Stomatal Conductance

At the beginning of the experiment (spring 2017), no significant differences for gs were observed regardless of the treatments. During summer 2017, higher gs values were recorded for the control and Mg-treated trees budded on Swc rootstocks than Cleo rootstocks (Table 2). In spring 2018, a pairwise comparison showed higher gs for trees that received Ca nutrition compared with trees that received Mg nutrition. This result could be related to the greater FRLD for the Ca relative to Mg-treated trees. Trees treated with Ca had the highest FRLD, which had the highest water uptake; hence, they had the highest gs as compared with the trees treated with Mg. In turn, this result can confirm that trees treated with Mg have greater LAI but low FRLD, which introduced a stress factor for treatments that resulted in lower gs.
Results for spring 2018 indicated a decrease in gs for trees budded on Swc rootstocks compared with Cleo rootstocks. That could be also related to unbalanced above-ground biomass relative to root length density for trees budded on Swc compared with Cleo rootstocks. During the summer of 2018, Ca + Mg treated trees budded on Swc rootstock showed 16% significant gs than the untreated control trees, whereas no significant nutrient effects were noted on Cleo rootstocks. This result implied that tree water consumption per unit LA was significantly higher when trees received Ca + Mg nutrients at half dose compared with trees that received a full single dose under Ca or Mg-treated trees. The probable reasons for the mid-day weakening in gs could be an increase in leaf–air vapor pressure deficit, which is caused by the exposure of leaves to prolonged high solar radiation as the result of low LAI for trees budded on Swc rootstocks [38,53]. In addition, since water loss cannot surpass the rate of uptake, plants have an inherent capability to control the resistance to water loss, which is accomplished by regulating gs [53,54].

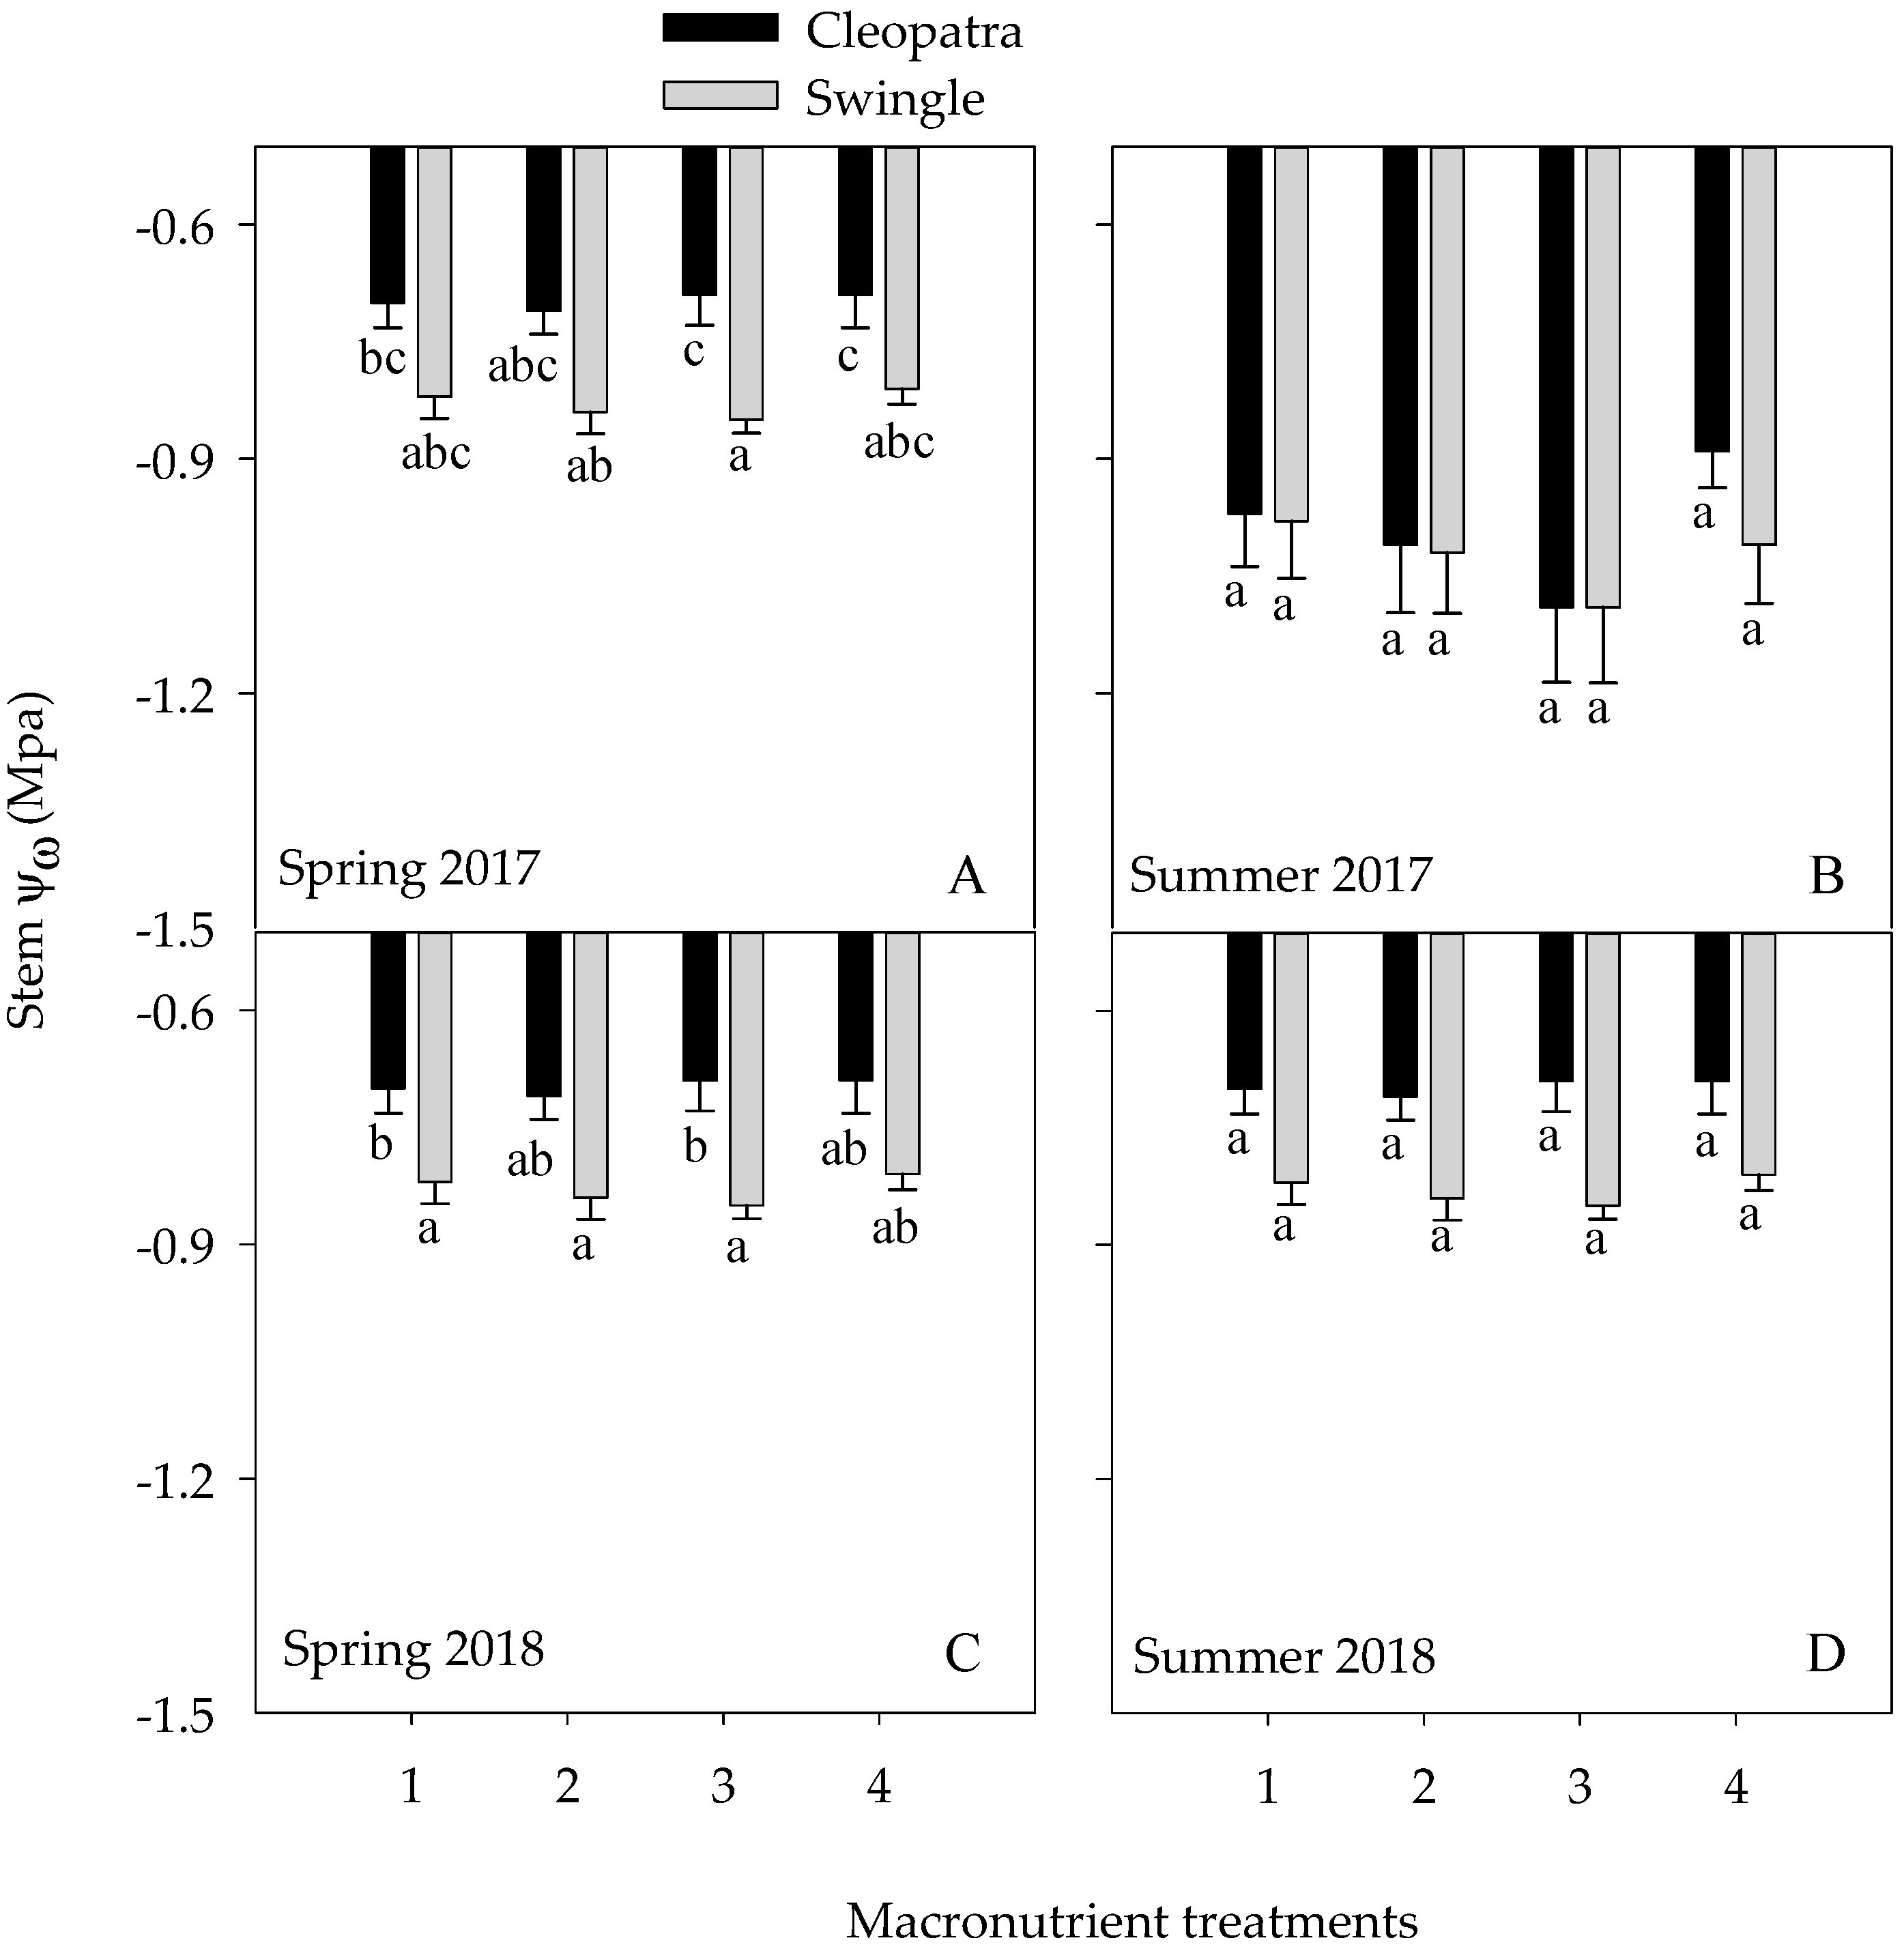
3.3.2. Stem Water Potential (Ψw)
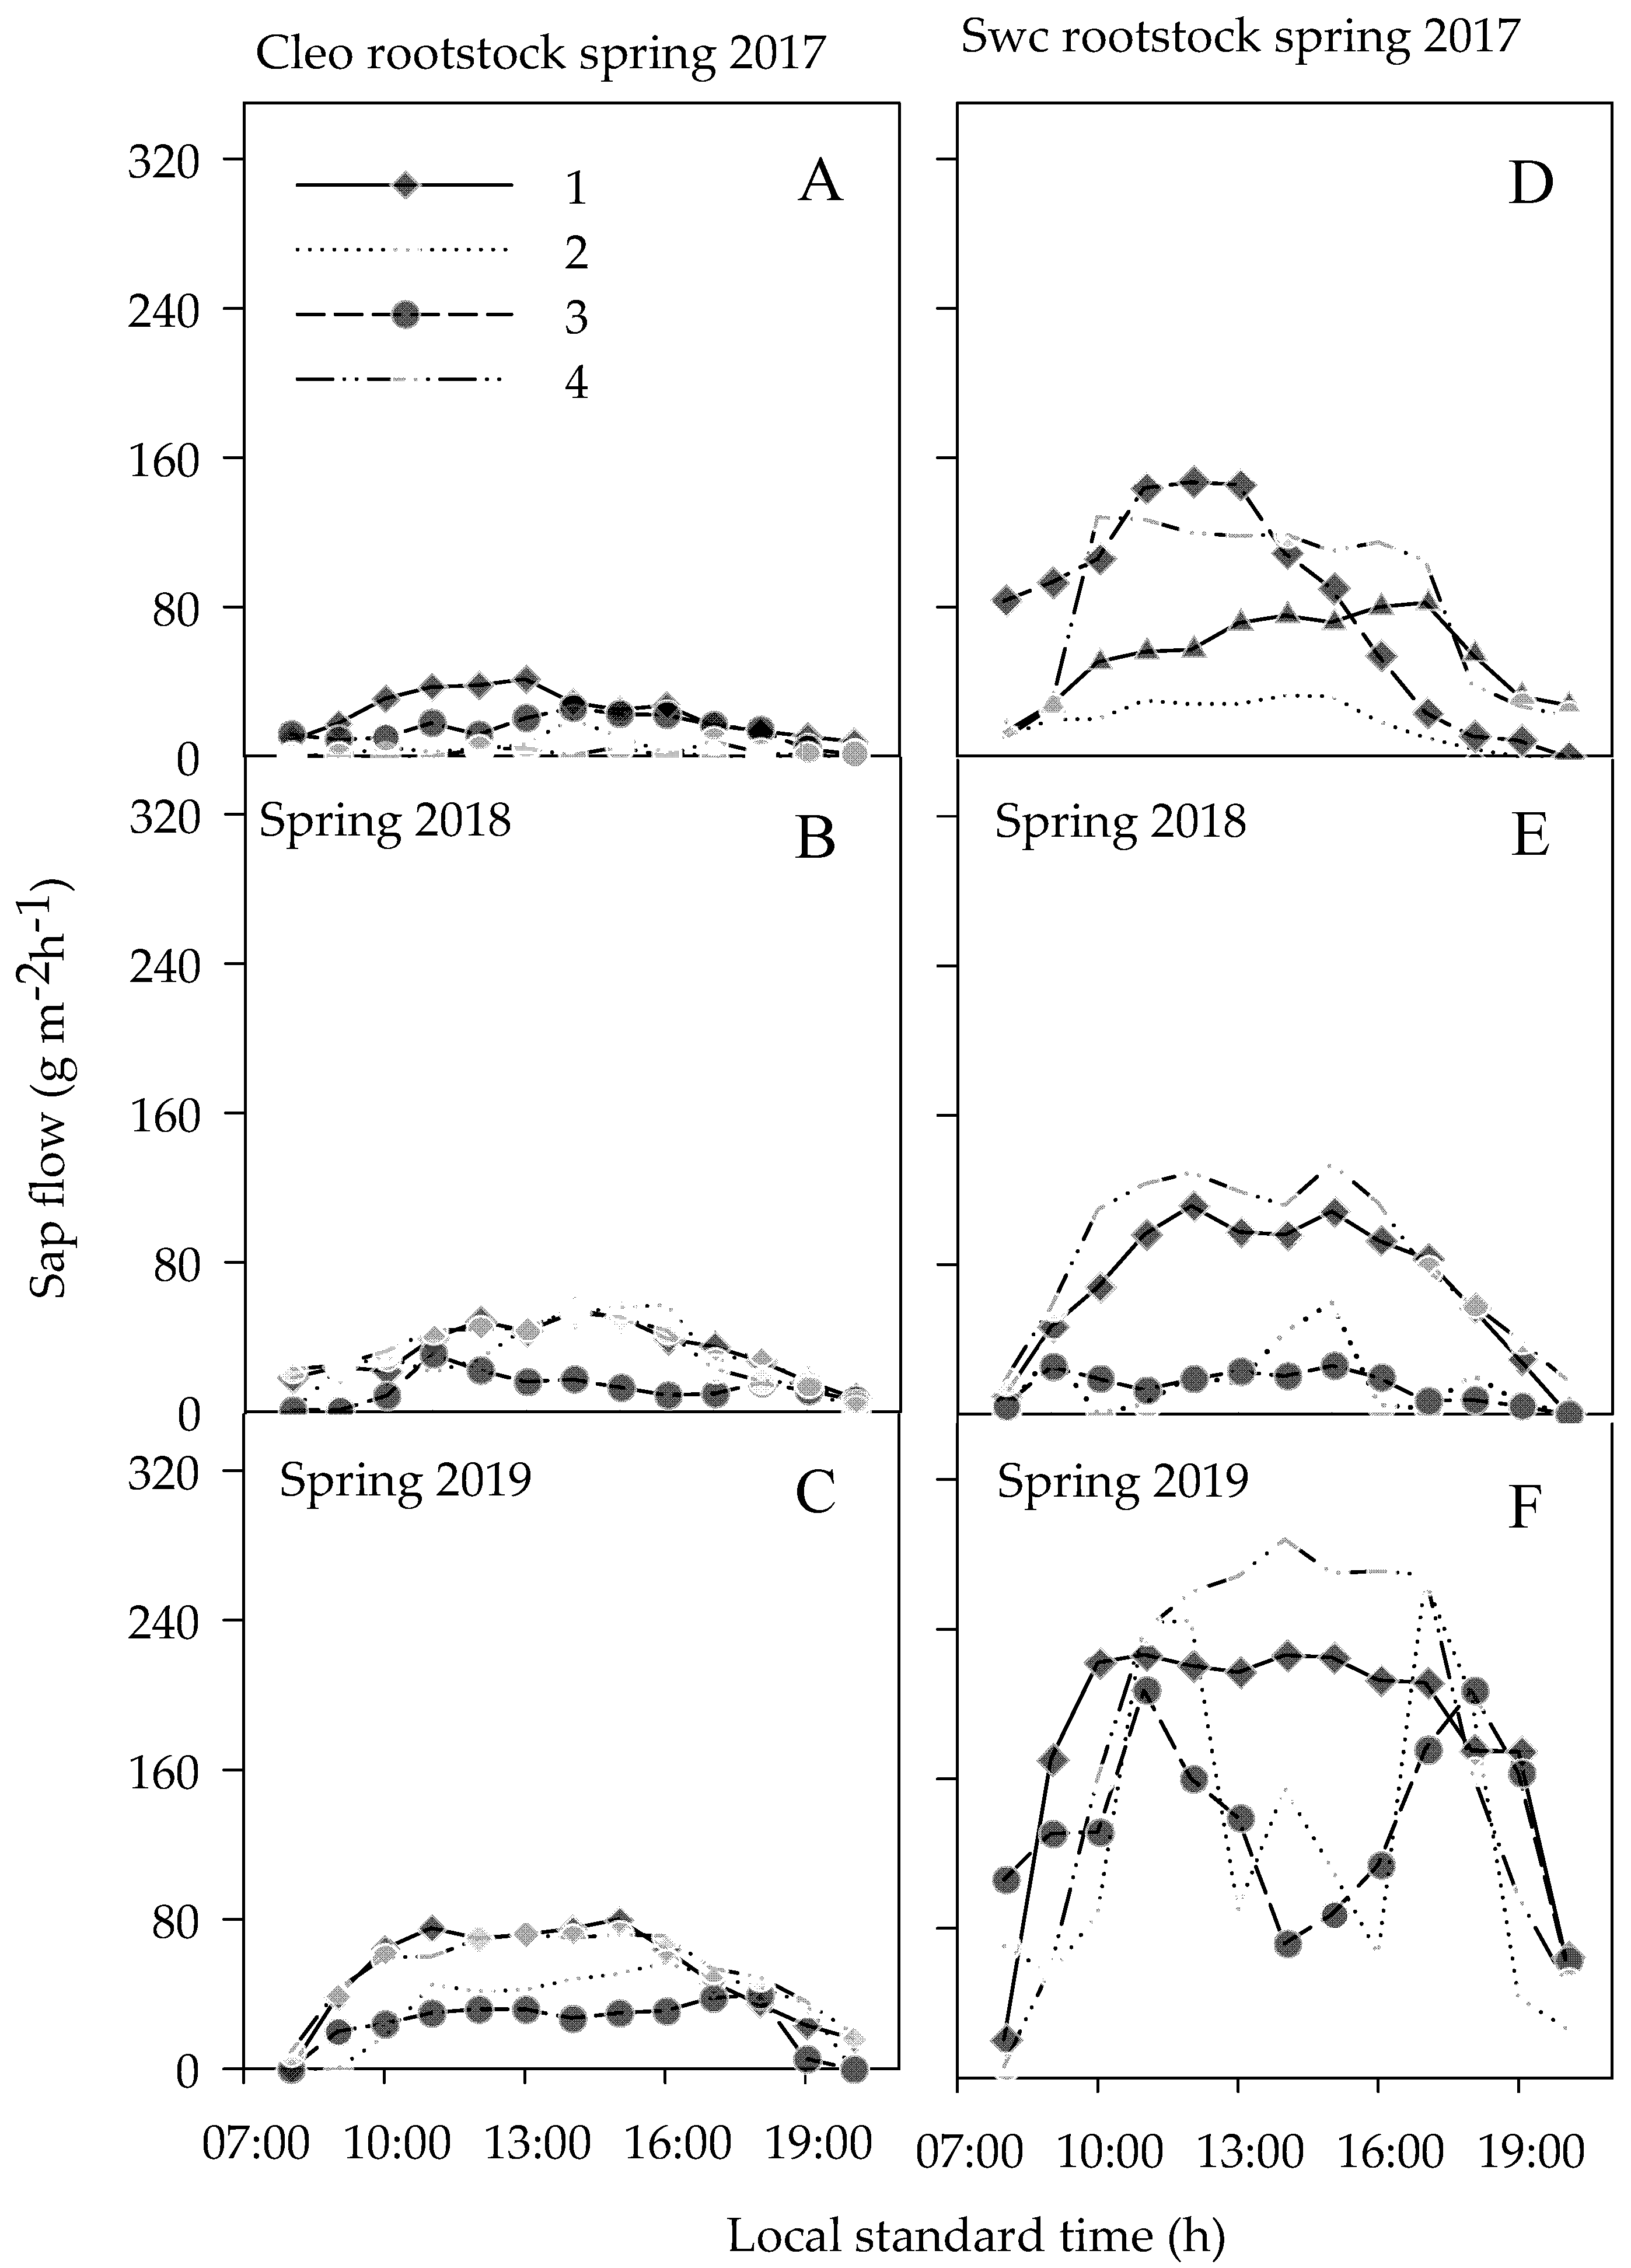
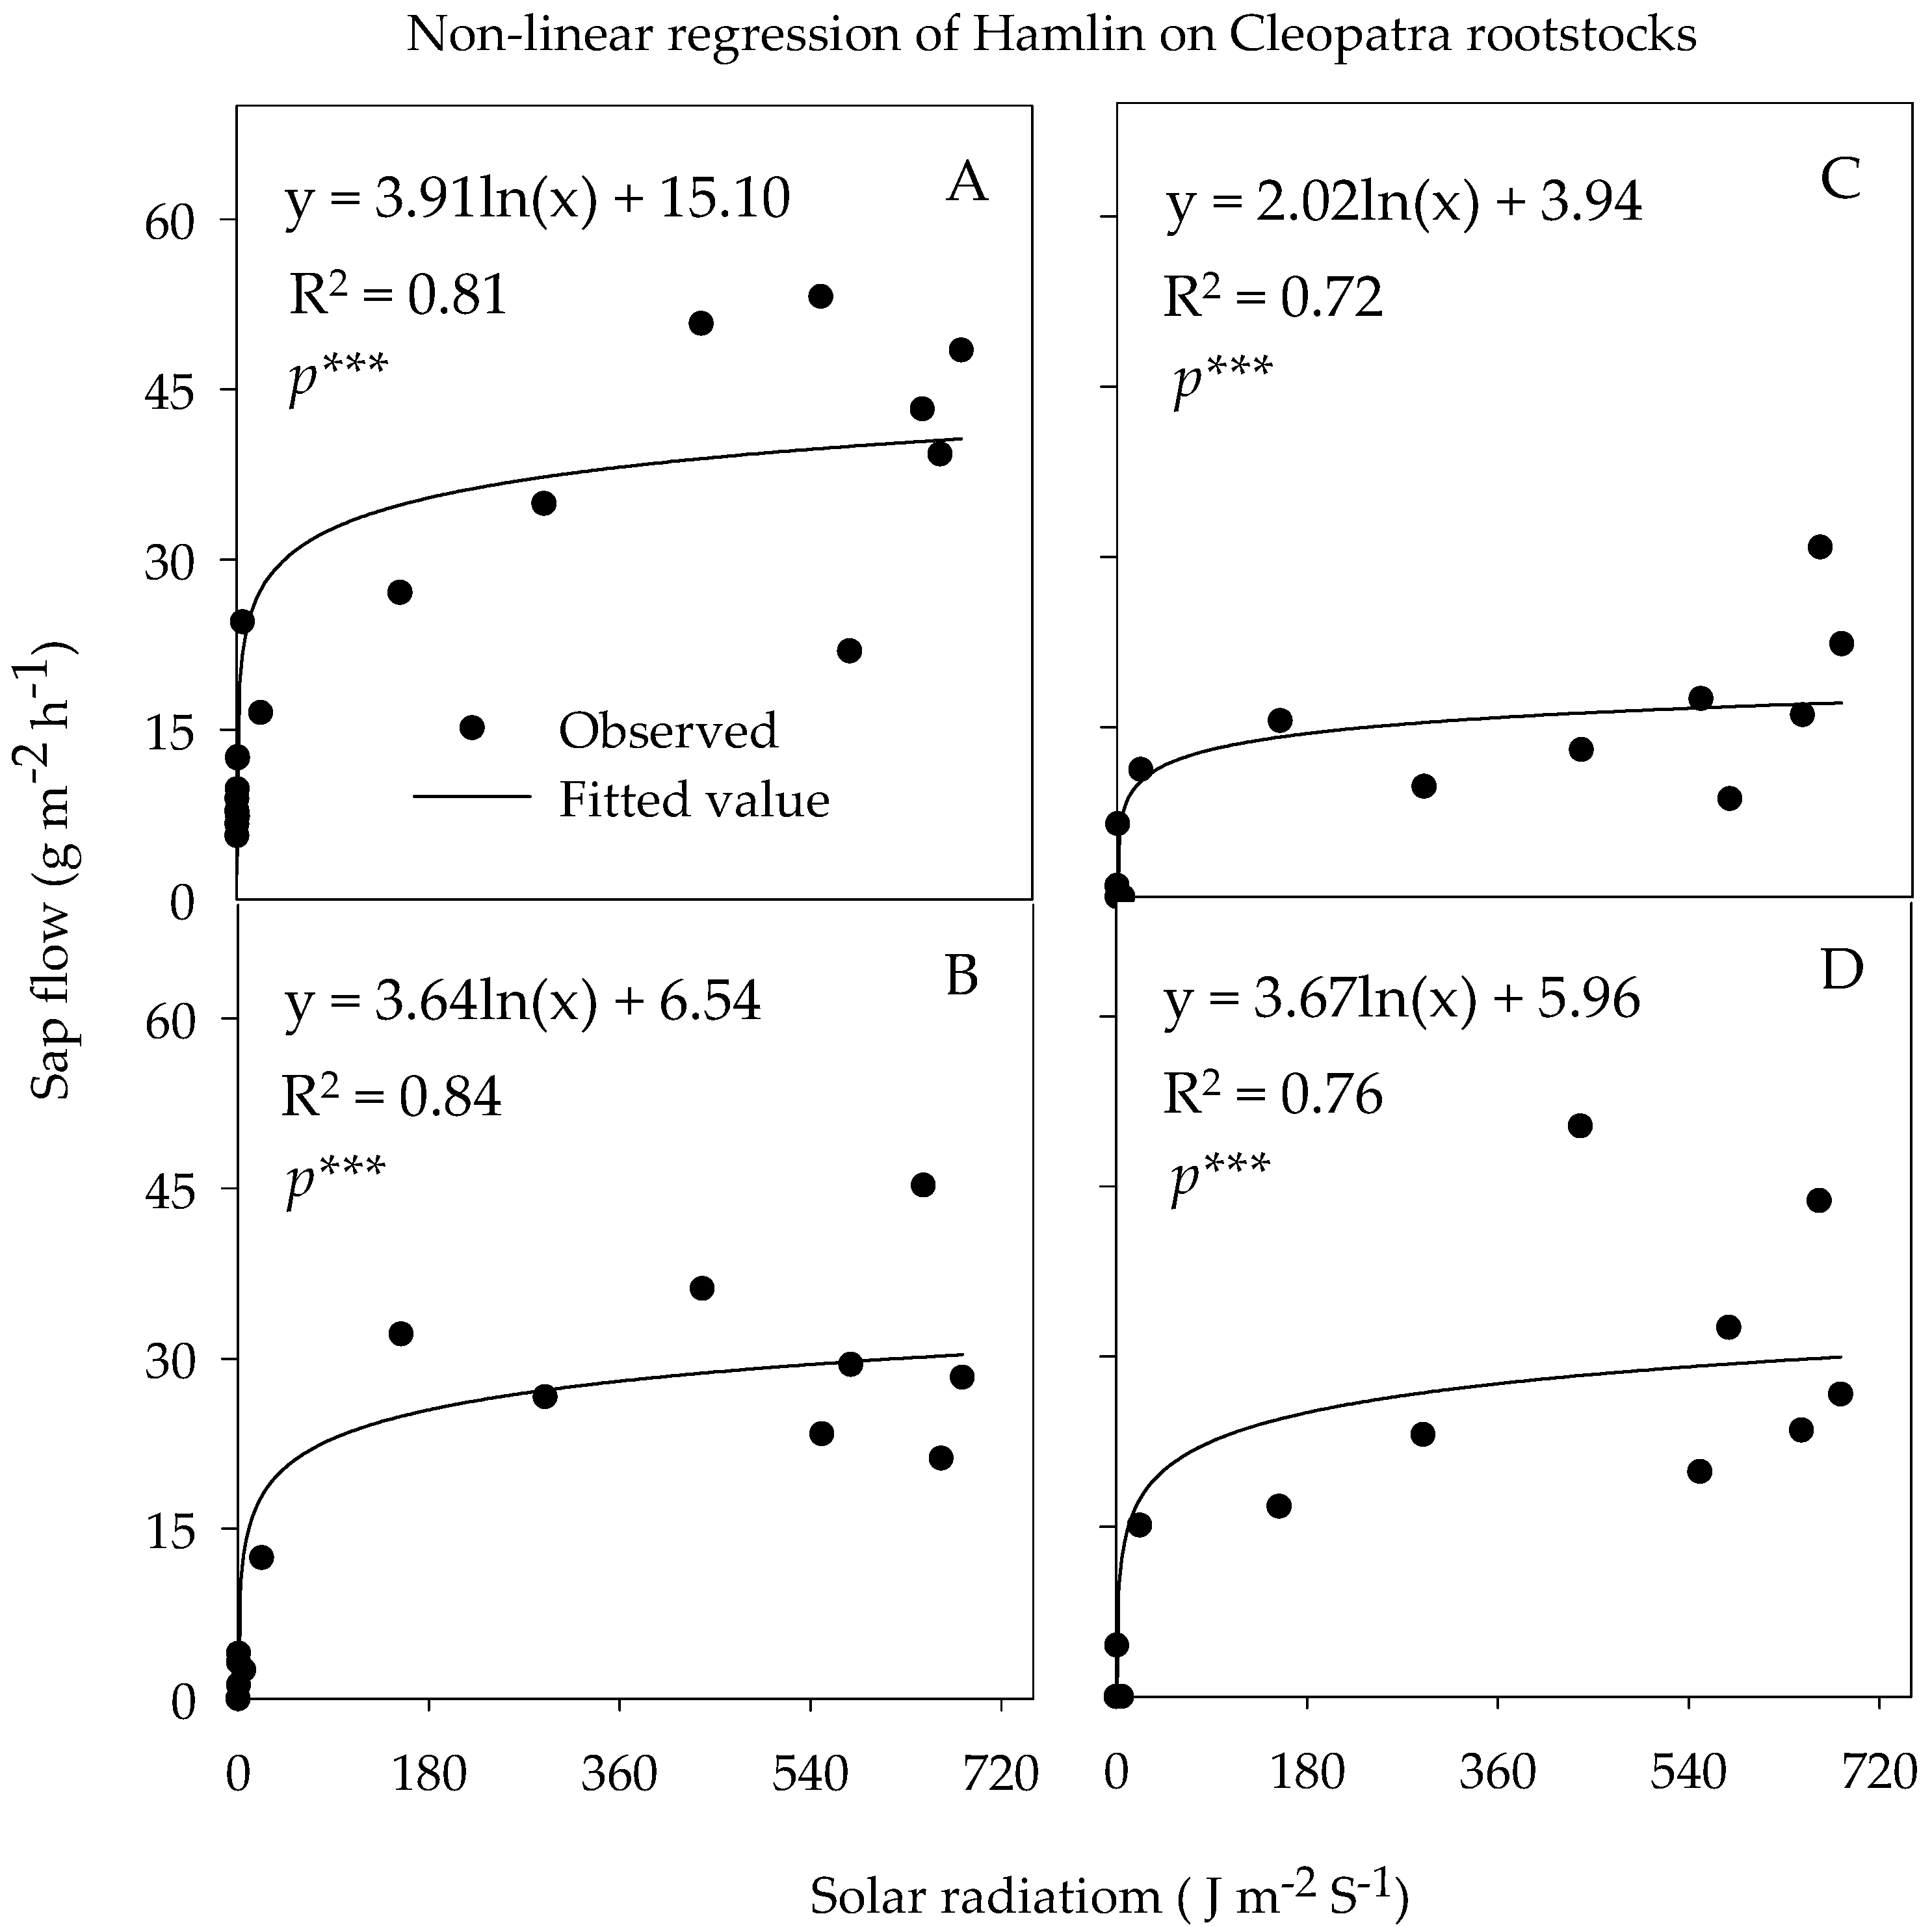
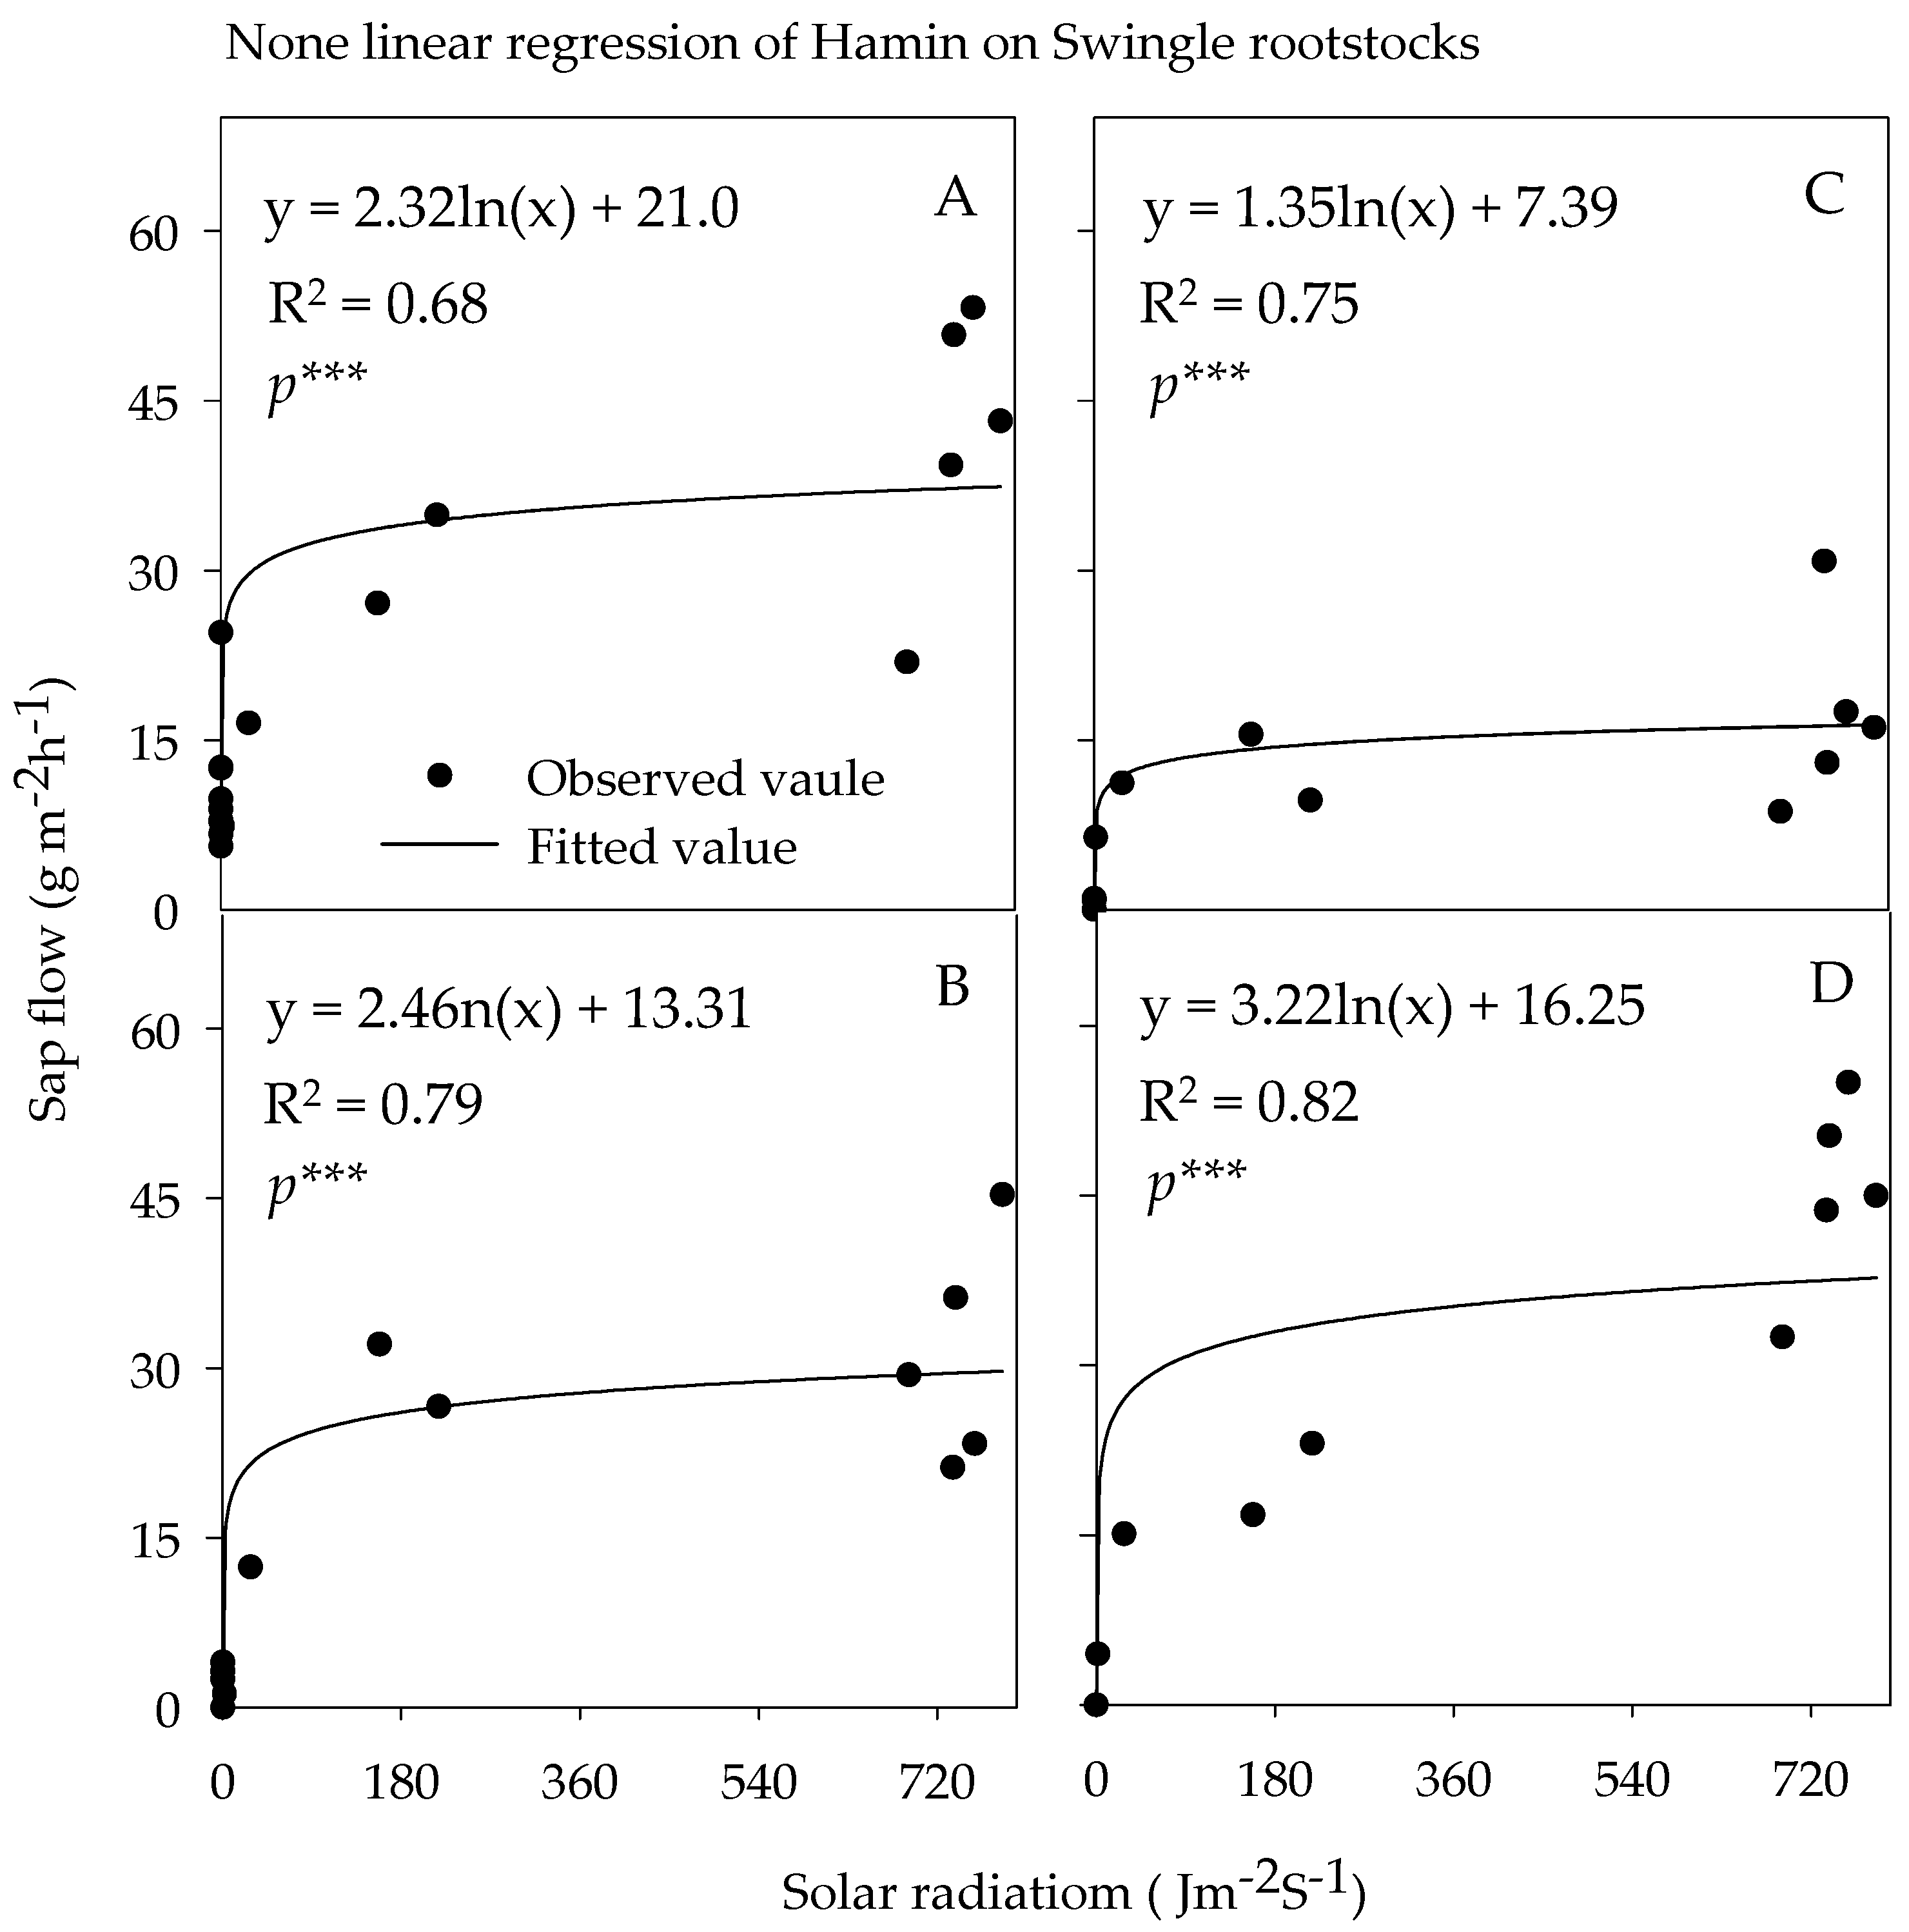
At the beginning of the experiment, the higher Ψw was recorded for trees budded on Cleo rootstock that received only Mg than on Swc rootstocks with the same treatment, with average values of −0.69 ± 0.04 and −0.83 ± 0.02 Mpa, respectively (Figure 1A). During summer 2017, none of the treatments caused significant differences among treatments for the Ψw (Figure 1B). However, on average, the Ψw increased by 11% (−0.62 ± 0.087 Mpa) and 20% (−0.69 ± 0.071 Mpa) for trees budded on Cleo and Swc rootstocks, respectively. In a similar study conducted on HLB-affected 12-year-old sweet orange trees with the UF/IFAS recommended irrigation schedule, researchers have reported a Ψw of −0.66 ± 0.08, −0.80 ± 0.01, and −0.68 ± 0.05 in the Arcadia, Avon Park, and Immokalee sites, respectively [25]. During spring 2018, a higher Ψw was recorded for trees that received Mg or untreated control trees budded on Cleo compared with Swc rootstocks, with average values of −0.57 ± 0.06 and −0.66 ± 0.02 Mpa, respectively (Figure 1C). During the 2017 and 2018 summer seasons, a significantly lower Ψw was recorded, and variation based on rootstocks was eliminated. However, no variation among treatments was observed for trees budded on both rootstocks (Figure 1D). A significant lower Ψw near to 2 Mpa and non-stressed citrus trees with a value of less than 1.0 Mpa on Navelina (Citrus sinensis (L.) Osbeck) citrus trees [25,54], respectively. A value between –0.5 and –1.0 and as low as –3.0 Ψw Mpa was reported on prune trees (Prunus domestica (L). cv. French) on irrigated and non-irrigated trees, respectively [38]. A plant-based measurement, such as Ψw, is a reliable indicator of plant water stress and plant reaction to treatment effect [35,41,54].

3.3.3. Sap Flow

The sap flow readings were taken when the daily crop water requirement was at its maximum and the rainfall was near the annual minimum to detect a treatment effect. The sap flow was significantly lower for trees budded on Cleo compared with Swc rootstocks (Figure 2A–C). This could be related to the smaller tree size and less vegetation cover of trees budded on Swc than trees budded on Cleo rootstocks (Figure 2D–F). This result was supported by a significantly lower Ψw during 2017 and 2018 and high gs during the 2018 growing season for trees budded on Swc than trees budded on Cleo rootstocks. Provided trees budded on the same rootstocks, trees that received full doses of Ca or Mg nutrition had significantly lower sap flow per unit LA as compared with the combined Ca + Mg treated trees and untreated control trees. The untreated control trees and the combined Ca + Mg treated trees at mid-day showed a magnitude of 2× more sap flow (water consumption) per unit LA as compared with the full Ca or Mg treated trees budded on Cleo rootstocks (Figure 2B,C). Consistently, the untreated control trees and the Ca + Mg treated trees showed a magnitude of 4× more sap flow than the full Ca or Mg treated trees for trees budded on Swc rootstocks (Figure 2E,F). The result showed that Ca and Ca + Mg treatments had the highest regression value for trees budded on Cleo and Swc rootstocks, respectively. This indicated that the water budget of a tree is highly impacted by the amount of fertilizer and management.
The pattern of the sap flow depicted rises at around 0800 HR with an exponential increase for two hours, reaching maximum at 1100 HR through 1700 HR, then declining until 1900 HR, and reaching the minimum flow at 2000 HR. Thus, solar radiation significantly affected the tree’s sap flow, indicating that solar radiation was an important environmental factor to frame the daily sap flow. The pattern of solar radiation had a similar pattern to the sap flow, showing that solar radiation was the most driving environmental factor to trigger the sap flow (Supplementary Figure S2). Similar sap flow pattern has been reported on 3-year-old sweet orange trees of ‘Hamlin’ and ‘Valencia’ grafted on ‘Swingle’ rootstocks in a greenhouse study [25], Hamlin orange (Citrus sinensis [L.] Osb.) trees budded on Swingle rootstocks [40], and on twenty-year-old vines (Vitis vinifera cv. Weißer Riesling) [38].
There was a strong logarithmic regression between the solar radiation and sap flow for trees budded on Cleo (R2 = 0.81, 0.84, 0.72, and 0.7 with p ≤ 0.0001) and on Swc (R2 = 0.68, 0.79, 0.75, and 0.82 with p ≤ 0.0001) rootstocks under the untreated control, Ca, Mg, or Ca + Mg treated trees, respectively (Figure 3A–D and Figure 4A–D). This result strongly supported that Ca for trees budded on Cleo and Ca + Mg combined treatments for trees budded on Swc rootstocks had significant FRLD as compared to the rest of the treatments [9,55]. Hence, the relationship between the solar radiation and the sap flow had the highest R2 values of 0.84 (Figure 3B) and 0.82 (Figure 4D) under Ca for trees budded on Cleo and Ca + Mg ftreatments on Swc rootstocks, respectively. Generally, the results supported that Ca or Mg treatments improved water uptake per unit LA, hence the sap flow, eventually the soil–plant–atmosphere continuum, the pathway of soil water moving from soil through plants to the atmosphere. A lower regression value for Mg treated trees could be associated with the higher vegetative growth compared with the root system, which consequently was less effective to balance the water budget of the tree as compared with the other treatments (Figure 3C and Figure 4C).

3.4. Soil Nutrient Concentrations and Dynamics

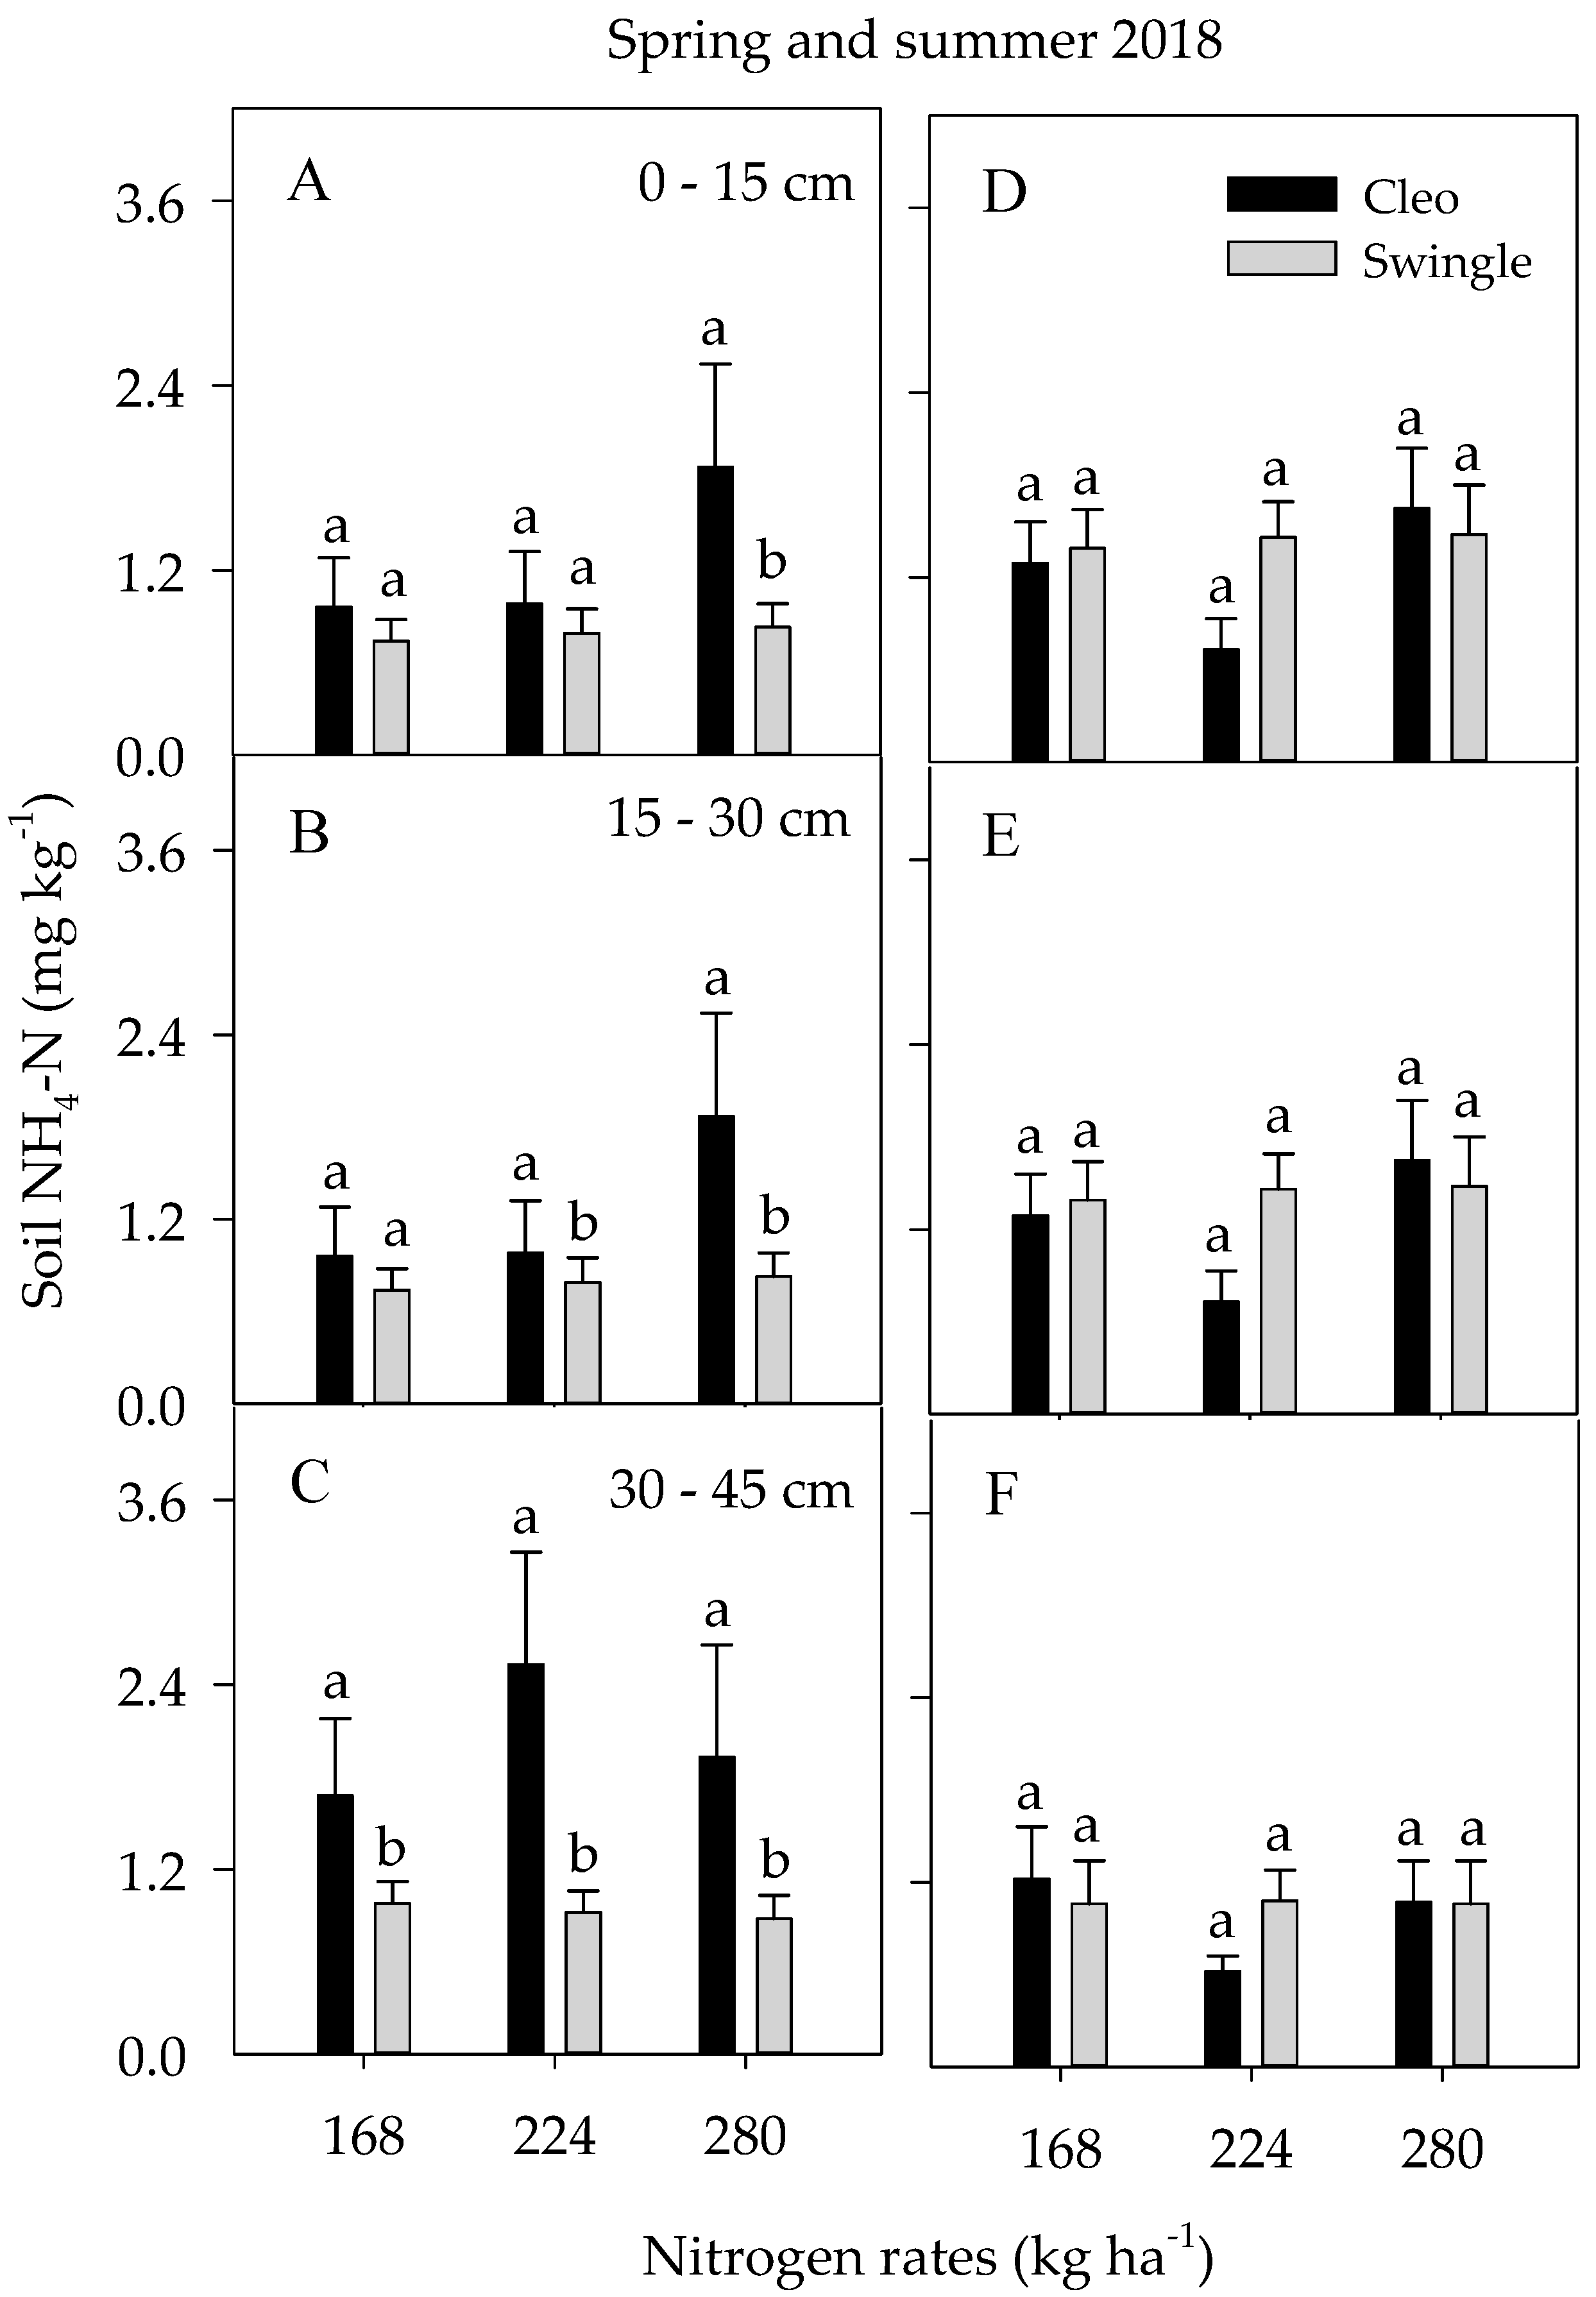
3.4.1. Soil Macronutrients

Soil nitrate–nitrogen. During spring 2017, the average NO3-N concentration was significantly lower than that in the same season of 2018 for trees budded on Cleo rootstocks and Swc rootstocks (Supplementary Figure S3). Significantly higher NO3-N was observed in the soil surface layer (0–15 cm) as compared with the two lower soil depths, regardless of the N rates and rootstock effect (Table 3). Six months later, after 10 split applications of the 20 annual split applications, higher NO3-N concentration was detected in the topmost soil layer when trees received 280 kg ha−1 of N for trees budded on Cleo compared with Swc rootstocks. Similarly, a higher NO3-N concentration was recorded in the lowest soil depth (30–45 cm) for trees budded on Cleo compared with Swc rootstocks, followed by the middle soil depth (15–30 cm). This indicated that NO3-N leached to the lowest soil depth as a result of the leaching rain events (300 mm day−1) of hurricane Irma during the summer of 2017. The remarkably lower NO3-N concentration that was detected for trees budded on Swc rather than Cleo rootstocks could be related to the higher sap flow rate for trees budded on Swc rootstocks, which enhanced the uptake of NO3-N (data not shown). Generally, a greater NO3-N concentration was observed in the topmost soil depth under the highest N rate (280 kg ha−1) than the two lower soil depths. However, the highest N rate did not contribute more than 4.0 mg kg−1 during the summer 2017 and 2018 seasons. Thus, multiple split N applications can be deemed as N Best Management Practices (BMPs) for the citrus industry, where citrus trees are impacted by deteriorating fine roots because of the HLB pandemic disease.
In spring 2018, the accumulated NO3-N concentration in the topmost relative to its immediate lower soil depth was a magnitude of 1.6×, 1.7×, and 1.1× for trees budded on Cleo rootstock and 1.2×, 1.3×, and 1.7× for trees budded on Swc rootstocks under 168, 224, and 280 kg ha−1 N rates treated trees, respectively (Figure 5A–C). In the following summer of 2018, the concentrations were 1.4, 2.0, and 1.3× for trees budded on Cleo rootstocks and 1.1×, 1.3×, and 1.2× NO3-N leached for trees budded on Swc rootstocks under 168, 224, and 280 kg ha−1 N treated trees, respectively (Figure 5D–F). The relative increase in a well-established root structure during the second year resulted in reducing the amount of NO3-N leaching down the soil profile. Previous studies showed that the estimated NO3-N leached below the root zone of a mature sweet orange grove on well-drained soil with optimal irrigation scheduling and with regular split fertigation ranging from 112 to 280 kg ha−1 N was 8–15 mg kg−1, which was a magnitude that was 2.0–4.0× more than the current study [13,17]. Therefore, the multiple split application of N coupled with optimum irrigation scheduling could be considered as a proper BMP for sustainable HLB-affected citrus production suffering from severe FRLD decline while protecting the downstream ecosystem.
Soil ammonium nitrogen. The concentration of NH4-N in the topmost soil depth was higher as compared with the two lower depths regardless of the N rates and rootstock type (Table 3). Meanwhile, the NH4-N concentration was higher when the trees received the highest N rate during the spring seasons, and the differences were eliminated during the summer season. The accumulation of soil NH4-N was higher for trees budded on Cleo than Swc rootstocks. In the spring of 2018, the NH4-N that accumulated in the topmost soil as compared with its immediate lower soil depth was a magnitude of 1.6×, 1.7×, and 1.1× more for trees budded on Cleo rootstock and 1.2×, 1.3×, and 1.7× more for trees budded on Swc rootstocks under 168, 224, and 280 kg ha−1 N rates treated trees, respectively (Figure 6A–C and Supplementary Figure S4). In the summer of 2018, there was 1.4, 2.0, and 1.3× more NH4-N leached for trees budded on Cleo rootstocks and 1.1×, 1.3×, and 1.2× more for trees budded on Swc rootstocks under 168, 224, and 280 kg ha−1 N rates treated trees, respectively (Figure 6D–F). The relative lower concentration of NH4-N under Swc as compared with the Cleo rootstocks trees could be the higher sap flow rate, which could accelerate the uptake of NH4-N from the soil provided that the conversion of NH4-N to NO3-N is equally affected under both rootstocks. This was manifested in the high leaf concentration for trees budded on Swc than Cleo rootstocks (data not included). The NH4-N movement was affected only during the summer season and when the trees received the highest N rates, with a factor of 1.25× more from the middle N rate and 1.67× more than the lowest N rate. Previous studies also indicated that the leaching of NH4-N was restricted as compared with NO3-N [56] because of the adsorption, impedance effects, and inadequate soil moisture, which was due to a low-volume drip irrigation system that limited to trigger NH4-N displacement in the soil [11].
Phosphorus. Soil P concentration was greater in the topmost soil layer (Supplementary Table S1) compared with the two lower soil depths (data not shown) during the entire study, and there was no significant differences between the rootstocks. The amount of soil P concentration was higher for the untreated control and lower for Ca2+ treated trees for trees budded on Cleo rootstocks at the beginning of the study during spring 2017. However, in summer 2018, the concentration of soil P increased for trees treated with Ca and Ca + Mg treated trees and untreated control trees. Phosphate ions are slowly converted into available forms; the majority of the phosphate will gradually react with soil-applied Ca2+, forming compounds that cause the phosphate to turn out into unavailable forms for plant roots [57,58]. Trees under the current study did not receive any P addition due to higher P concentration in the soil.
Potassium. During spring 2017, the soil K+ was higher in the topmost soil layer only as compared with its respective two lower soil depths. Following the multiple splitting K+ applications, the highest soil K+ concentration was detected in the topmost layer as compared with the two soil depths during the entire study (Supplementary Table S1). This indicated the increase in accumulation of soil K+ in the topmost soil layer, and it showed less leaching potential. Previous studies showed that the citrus trees significantly reacted to K+ application when the exchangeable soil K+ is less than 2.5 mmolc dm−3 [59,60]. Current soil K+ showed a maximum, minimum, and an average of 33.8, 0.8, and 9.7 mmolc dm−3 soil, respectively. Similar results were reported on a K+ study performed across several study sites in Brazil on Pera, Valencia, lemon, and Natal citrus cultivars whose K+ concentration was ranging from 0.9 to 5.1 mmolc dm−3 [60]. Thus, split applications of K+ was the best nutrient management strategy that kept leaf K+ concentration at the optimum range for Florida citrus nutrition during the experiment (data not included).

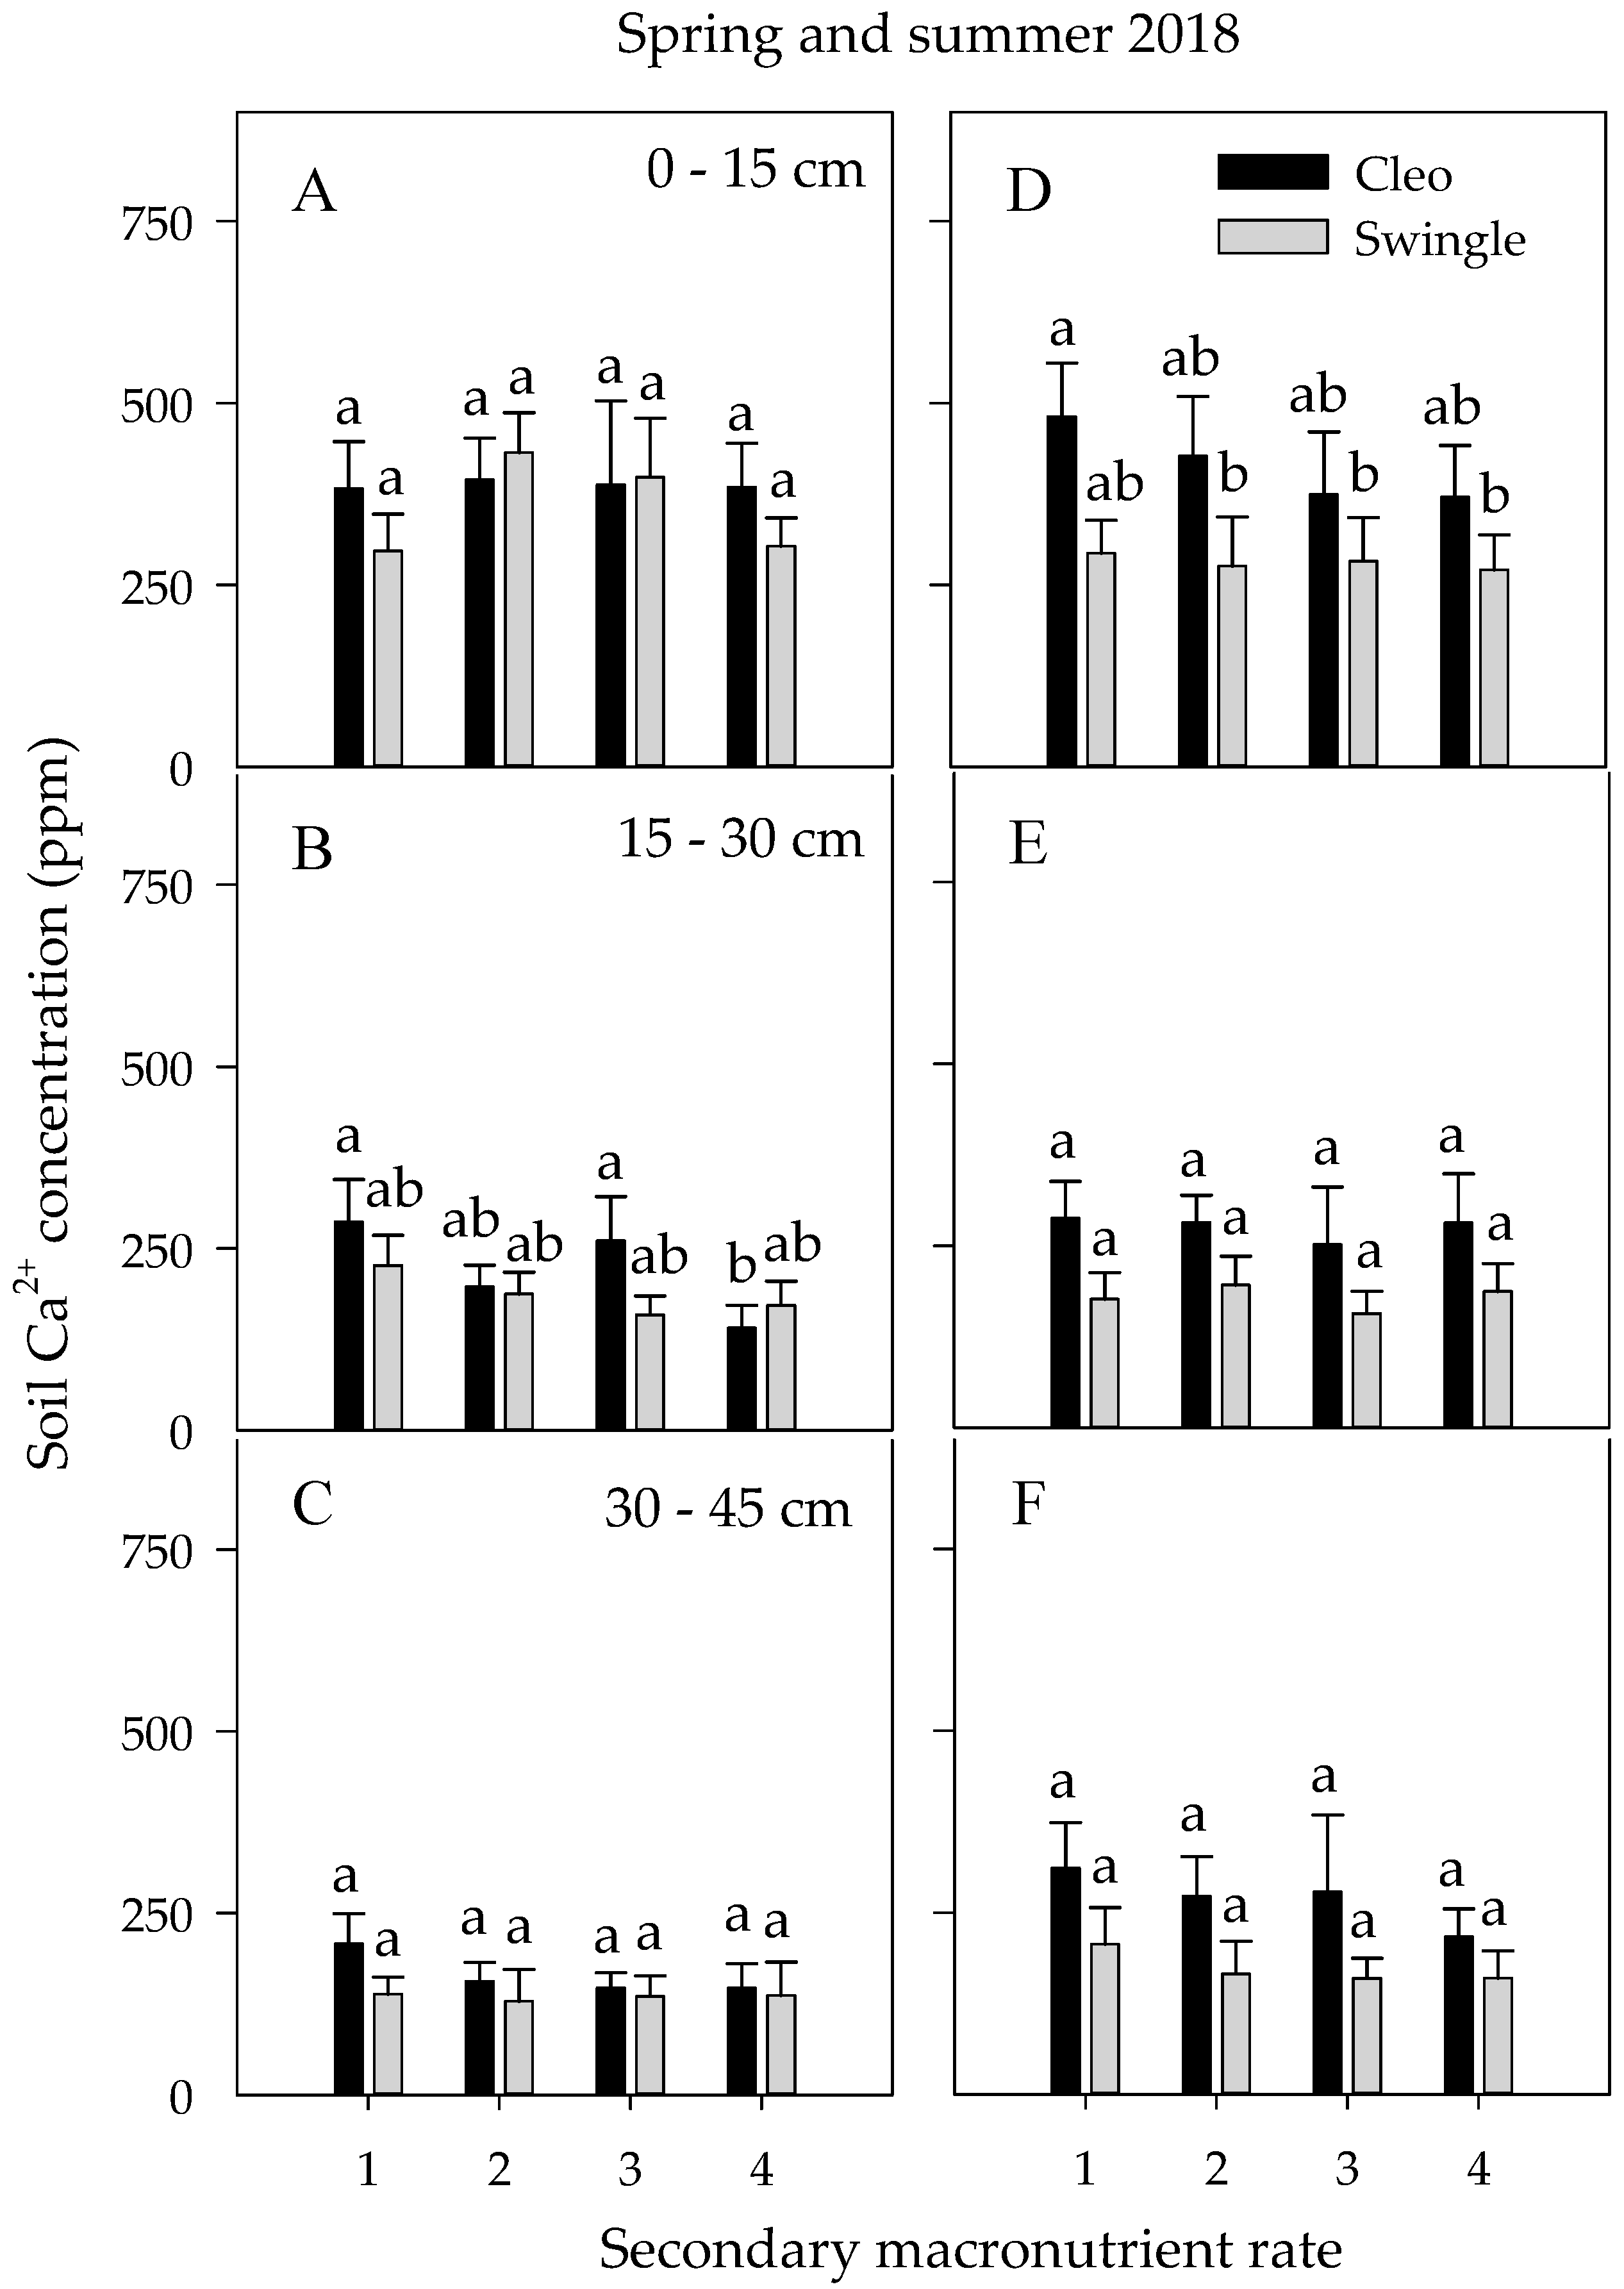
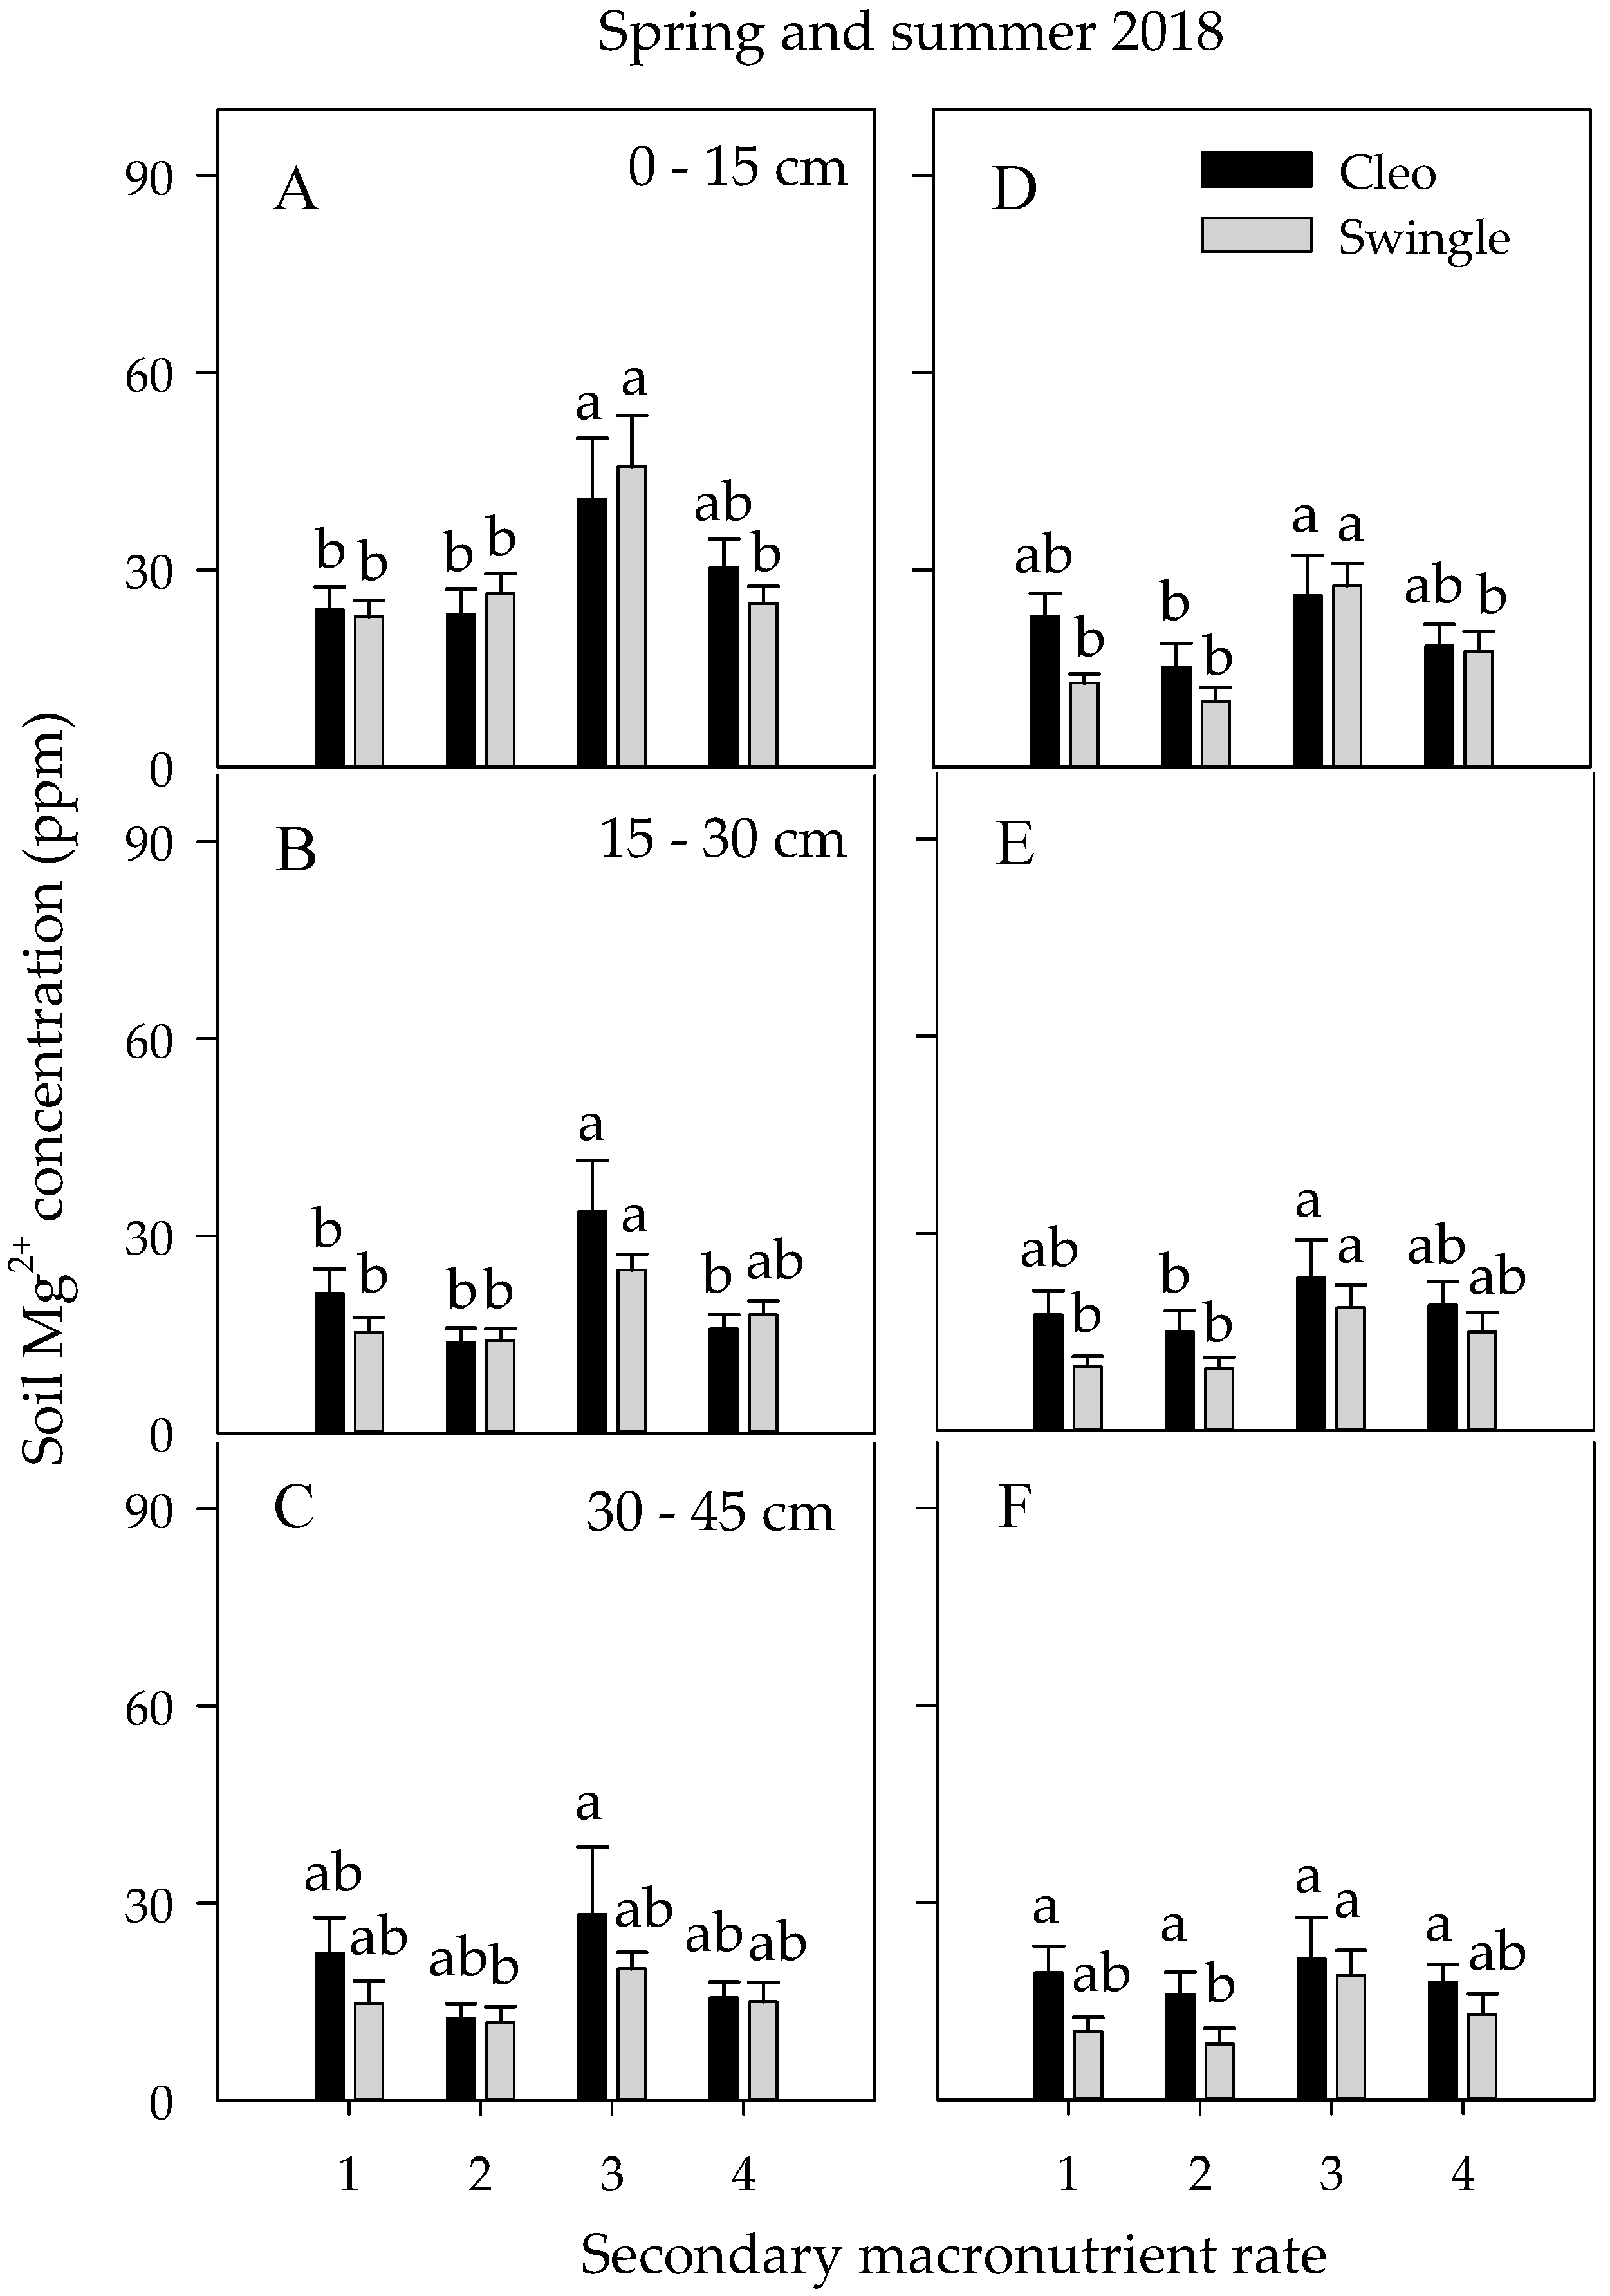
3.4.2. Secondary Macronutrients

Calcium. Soil Ca2+ concentration showed a higher value in the topmost soil layer during the entire study from 2017 to 2018, and the middle soil depth had also a higher Ca2+ concentration during the summer 2017 and spring 2018 season as compared with the lowest soil depth (Supplementary Figure S5). There was a significant interaction effect of rootstock × secondary macronutrients during most of the sampling seasons; the amount of soil Ca2+ was higher for trees budded on Cleo than Swc rootstocks (Table 3). The concentration of soil Ca2+ was significantly higher on Cleo compared with Swc rootstock in the untreated control trees in the top and lowest soil depth during the summer season of 2017. The variation of soil Ca2+ was magnified during the summer seasons compared with the spring seasons. Even though there was a leaching rain event during Hurricane Irma, the amount of soil Ca2+ did not show a change in the pattern along the three soil depths. The Ca2+ concentration was higher in the Ca treated topsoil (Figure 7A) as compared to the lower soil depth during the second year (Figure 7B,C), indicating an increased accumulation of soil Ca2+ concentration over time due to the supplemental Ca nutrition applications. The significantly higher soil Ca2+ concentration in the soil for trees budded on Cleo compared with Swc rootstocks was probably due to the comparative significantly higher sap flow for trees budded on Swc than Cleo rootstock. Meanwhile, the relative significant reduction in the soil Ca2+ for the full dose of Ca2+ and Mg2+ treated trees could also be related to the higher above-ground vegetative growth resulting in the removal of these nutrients from the soil following massive spring and summer vegetative growth (Figure 7D–F).
Magnesium. The results of soil Mg2+concentration indicated that the topmost soil depth had the highest Mg2+ concentration regardless of the treatments. Similarly, the soil Mg2+ concentration was consistently the highest during the entire sampling seasons for trees that received Mg2+ nutrition as compared with the other secondary macronutrient treated trees and untreated control trees (Table 3). Soil Mg2+ concentration was also higher for trees budded on Cleo as compared with Swc rootstocks for the untreated control trees during the summer of 2017 (Supplementary Figure S6). In the spring of 2018, soil Mg2+ concentration was also the highest for the Mg2+ treated trees as compared with the rest of the treatments in the topmost and middle soil depths (Figure 8A–C). During the first year, the soil Mg2+ pool depleted faster for trees budded on Swc than Cleo rootstocks, inferring the rapid uptake of soil Mg2+. This result proved the higher mobility of Mg2+ under Mg2+ starvation [61] and agreed with the higher sap flow for trees budded on Swc than Cleo rootstocks. The soil Mg2+ concentration was higher in the Mg treated topsoil as compared with its immediate lower soil depth during the second year, indicating an increased accumulation soil Mg2+ concentration over time due to the ground-applied Mg nutrition. Low soil Mg2+ concentration during summer 2018 was because of massive vegetative growth results in heavy removal of Mg2+ from the soil (Figure 8D–F).
Since soil can be characterized by low Mg2+ concentration in Florida sandy soils and readily leaches under acidic soil condition, the soil pH was regularly checked, and it was above 6.0 during the entire study [9,62]. In addition, soil NH4-N concentration as a sole source of N could reduce the uptake of K+, Ca2+, and Mg2+ [62]. However, this is unlikely to be a problem, as Florida Spodosol in the Flatwoods has a pH of around 6.1 [9,62]. The split application of the annual Mg2+ doses in three sub-doses and optimum irrigation scheduling to avoid over-irrigation resulted in less leaching of Mg2+. Therefore, the soil Mg2+ concentration was maintained significantly as the lowest in the lowest soil depth. However, during the spring of 2018, following the Hurricane Irma leaching rain events of the summer of 2017, a significantly high soil Mg concentration was detected on the two lower soil depths as compared with the rest of the treatments.

3.4.3. Micronutrients

Micronutrients: Soil Mn2+ and Zn2+ concentrations showed a significant decreasing order from the topmost soil, middle soil depth, and the lowest soil depth throughout the experiment regardless of the rootstocks (Supplementary Tables S1 and S2). Meanwhile, significantly higher soil Mn2+ and Zn2+ concentrations were detected for trees budded on Cleo compared with Swc rootstocks, indicating higher Mn2+ and Zn2+ uptake for trees budded on Swc than Cleo rootstocks and when trees received Mg2+ treatments during both summer seasons. One of the distinguishing features of Mn2+ as compared with the Zn2+ was that Mn2+ had a significant interaction effect of soil depth × rootstocks and rootstock × secondary macronutrients during most of the sampling seasons. Studies indicated that Mn had a 2.2 sorption coefficient (KD) in the topmost soil depth and was 22 times higher than the lower and lowest soil depths. [63]. However, the amount of soil Mn2+ and Zn2+ concentration in the current experiment was not enough to meet the optimum level of leaf nutrition concentration for Florida citrus (data not shown). This study indicated that Mn2+ and Zn2+ nutrition application is a required cultural practice to enhance HLB-affected citrus trees following fruit harvest and heavy defoliation results from a hurricane-induced wind gust.
Unlike the above two micronutrients, soil boron (B) concentration did not show consistency along the soil depths except during the spring seasons of 2017 and 2018, which had the highest soil B in the topmost soil depth. However, soil B showed constantly higher concentration for trees budded on Cleo compared with Swc rootstocks. The inconsistency of soil B along the soil profile was because of the significantly low KD < 0.1 L kg−1 for Florida sandy soils as compared with Mn2+ and Zn2+ [65a]. Therefore, the inconsistency of soil B concentration along with the soil profile during the summer season coupled with its low sorption characteristics to soil colloids was because of the excessive rainfall that resulted in leaching of the nutrient [63,64].
Soil Cu2+ concentration was steadily the highest in the topmost soil depth during the entire sampling seasons regardless of the rootstocks. Yet, higher soil Cu2+ concentration was detected for trees budded on Cleo compared with Swc rootstocks. The amount of soil Cu2+ observed in the current experiment was enough to meet the optimum level of leaf nutrition concentration for Florida citrus. The high soil accumulation of Cu2+ could be because of the Florida growers application of 408 metric tons of copper hydroxide [Cu (OH)2] on about 149,000 ha of citrus trees per year as a means to control citrus canker disease, inferring no need for extra Cu2+ application [10,12]. Soil Fe3+ concentration showed a steadily significant concentration in the topmost soil layer as compared with the two lower soil depths. Similar to any other soil nutrient elements, soil Fe3+ had a higher concentration for trees budded on Cleo than Swc rootstocks, except at the end of the study season. There was a significant interaction effect of depth × rootstocks and rootstock × secondary macronutrients. The accumulation of soil Fe3+ was pronounced for trees that received full doses of Ca2+ for trees budded on Cleo than Swc rootstocks because mineral elements physically and chemically antagonize and probably replace each other by racing for the similar uptake, movement, and storage site [65].

4. Conclusions

The split application of essential nutrients in association with optimum irrigation scheduling based on crop water requirement in the Florida sandy soils improved vegetative growth, nutrient uptake, and accumulation, and it also restricted nutrients leaching. The macro (N, P, and K) coupled with secondary macronutrients increased vegetative growth, water consumption per unit LA, and soil nutrient accumulation, and it limited nutrient dynamics. Mobile nutrients including NO3-N showed leaching to the lowest soil depth only during the summer season when trees received the highest N rate (280 kg ha−1), suggesting a lower citrus N requirement. Thus, the split application of N maintained the total available N (NH4-N and NO3-N) below 4.0 mg kg−1 throughout the study, and it can be considered as a BMP to be adopted by growers. Therefore, 224 kg ha−1 N coupled with a full Ca2+ or Mg2+ dose could be the recommended rate for HLB-affected citrus trees. The current study also showed that multiple split N and K+ applications coupled with the secondary macronutrients over several years of application could probably boost the uptake of other essential micronutrients including Mn2+, Zn2+, B, which previously were known to be deficient in HLB-affected citrus trees. Therefore, 224 kg ha−1 N coupled with a full Ca2+ or Mg2+ dose could be the recommended rate for HLB-affected citrus trees.

Supplementary Materials

The following are available online at https://www.mdpi.com/2073-4395/10/10/1485/s1. Supplementary Figure S1: Mean monthly evapotranspiration and precipitation observed at Southwest Florida Research and Education Center (SWFREC) near Immokalee, FL from January 2017 to December 2018, Supplementary Figure S2: Mean solar radiation (SolRad) and air temperature (T°) at 2 m high from the ground observed at Southwest Florida Research and Education Center near Immokalee, FL from April 15–30, 2017, 2018, and 2019, Supplementary Figure S3: Soil NO3-N dynamics and accumulation of Huanglongbing (HLB)-affected Hamlin citrus trees budded on Cleopatra and Swingle rootstocks, Supplementary Figure S4: Soil NH4-N dynamics and accumulation of Huanglongbing (HLB)-affected Hamlin citrus trees budded on Cleo and Swc rootstocks, Supplementary Figure S5: Soil Ca2+ nutrient dynamics and accumulation of Huanglongbing (HLB)-affected Hamlin citrus trees budded on Cleo and Swc rootstocks, Supplementary Figure S6: Soil Mg2+ dynamics and accumulation of Huanglongbing (HLB)-affected Hamlin citrus trees budded on Cleo and Swc rootstocks, Supplementary Table S1: Analysis of variance of soil nutrient concentration on a dry weight basis under Huanglongbing (HLB)-affected Hamlin citrus trees, Supplementary Table S2. Soil nutrient concentration at 0–15 cm soil depth as affected by nitrogen and ground-applied secondary macronutrients on a dry weight basis of ‘Hamlin’ citrus trees.

Author Contributions

A.A.A., Conceptualization, Data curation, Software, Investigation, Methodology, Visualization, Formal Analysis, and Writing—original Draft Preparation; K.T.M., Funding Acquisition, project administration, Resources, Supervision, Visualization, and Writing—review and editing; S.A.H., Data curation, Formal analysis, Visualization, and Writing—review and editing; D.M.K., Formal analysis, Visualization, review, and editing; K.A.M., Formal analysis, Software, Methodology, Visualization, Formal Analysis, review, and editing. All authors have read and agreed to the published version of the manuscript.

Funding

The authors gratefully acknowledge study funding provided by The Citrus Initiative (Florida legislature) and Multi-Agency Committee (MAC).

Conflicts of Interest

The authors declare no conflict of interest.

References

  1. Citrus Fruits 2019 Summary; United States Department of Agriculture: Washington, DC, USA, 2019.
  2. Graham, J.H.; Johnson, E.G.; Gottwald, T.R.; Irey, M.S. Presymptomatic fibrous root decline in citrus trees caused by huanglongbing and potential interaction with Phytophthora spp. Plant. Dis. 2013, 97, 1195–1199. [Google Scholar] [CrossRef] [PubMed] [Green Version]
  3. Kadyampa, K.; Davie, M.; Morgan, K.T.; SchuMann, A.W. Root density distribution and water uptake of citrus trees infected with huanglongbing. Proc. Fla. State Hort. Soc. 2014, 127, 37–41. [Google Scholar]
  4. Coleman, M. Spatial and temporal patterns of root distribution in developing stands of four woody crop species grown with drip irrigation and fertilization. Plant. Soil 2007, 299, 195–213. [Google Scholar] [CrossRef] [Green Version]
  5. Aubert, B. Huanglongbing (HLB) a Diagnosis and strategies for control in Reunion Island—A case study. IRCHLB Proc. 2008, 2008, 1–34. [Google Scholar]
  6. Nwugo, C.C.; Duan, Y.; Lin, H. Study on citrus response to huanglongbing highlights a down-regulation of defense-related proteins in lemon plants upon ‘ca. Liberibacter asiaticus’ infection. PLoS ONE 2013, 8, e67442. [Google Scholar] [CrossRef]
  7. Morgan, K.T.; Kadyampakemi, D. Open field hydroponics: Concept and application. Adv. Citrus Nutr. 2012, 271–280. [Google Scholar] [CrossRef]
  8. Paramasivam, S.; Alva, A.K.; Fares, A.; Sajwan, K.S. Estimation of nitrate leaching in an entisol under optimum citrus production. Soil Sci. Soc. Am. J. 2010, 65, 914. [Google Scholar] [CrossRef]
  9. Atta, A.A.; Morgan, K.T.; Hamido, S.A.; Kadyampakeni, D.M. Effect of essential nutrients on roots growth and lifespan of huanglongbing affected citrus trees. Plants 2020, 9, 483. [Google Scholar] [CrossRef] [Green Version]
  10. Hamido, S.A.; Ebel, R.C.; Morgan, K.T. Interaction of huanglongbing and foliar applications of copper on water relations of citrus sinensis cv. Valencia. Plants 2019, 8, 298. [Google Scholar] [CrossRef] [Green Version]
  11. Kadyampakeni, D.M.; Morgan, K.T.; Schumann, A.W.; Nkedi-Kizza, P. Effect of irrigation pattern and timing on root density of young citrus trees infected with Huanglongbing disease. Horttechnology 2014, 24, 209–221. [Google Scholar] [CrossRef]
  12. Ebel, R.C.; Hamido, S.; Morgan, K.T. Interaction of huanglongbing and foliar applications of copper on growth and nutrient acquisition of citrus sinensis cv. Valencia. Plants 2019, 54, 297–302. [Google Scholar] [CrossRef] [Green Version]
  13. Obreza, T.A.; Schumann, A. Keeping water and nutrients in the Florida citrus tree root zone. Horttechnology 2010, 20, 67–73. [Google Scholar] [CrossRef]
  14. Kiggundu, N.; Migliaccio, K.W.; Schaffer, B.; Li, Y.; Crane, J.H. Water savings, nutrient leaching, and fruit yield in a young avocado orchard as affected by irrigation and nutrient management. Irrig. Sci. 2012, 30, 275–286. [Google Scholar] [CrossRef]
  15. Quiñones, A.; Martínez-Alcántara, B.; Legaz, F. Influence of irrigation system and fertilization management on seasonal distribution of N in the soil profile and on N-uptake by citrus trees. Agric. Ecosyst. Environ. 2007, 122, 399–409. [Google Scholar] [CrossRef]
  16. Syvertsen, J.P.; Sax, S.M. Fertigation frequency, wetting patterns and nitrate leaching from lysimeter-grown citrus trees. Proc. Fla. State Hortic. Soc. 1999, 112, 9–13. [Google Scholar]
  17. Alva, A.K.; Paramasivam, S. Nitrogen management for high yield and quality of citrus in sandy soils. Soil Sci. Soc. Am. J. 1998, 62, 1335–1342. [Google Scholar] [CrossRef]
  18. Spann, T.M.; Schumann, A.W. The role of plant nutrients in disease development with emphasis on citrus and huanglongbing. Proc. Fla. State Hortic. Sci. 2009, 122, 169–171. [Google Scholar]
  19. Spann, T.M.; Atwood, R.A.; Dewdney, M.M.; Ebel, R.C.; Ehsani, R.; England, G.; Rogers, M.E. IFAS guidance for huanglongbing (greening) management. Citrus Ind. 2010, 1–8. [Google Scholar] [CrossRef]
  20. Gerendás, J.; Führs, H. The significance of magnesium for crop quality. Plant. Soil 2013, 368, 101–128. [Google Scholar] [CrossRef] [Green Version]
  21. Kleiber, T.; Golcz, A.; Krzesiński, W. Effect of magnesium nutrition of onion (Allium cepa L.). Part, I. Yielding and nutrient status. Ecol. Chem. Eng. S 2012, 19, 97–105. [Google Scholar] [CrossRef] [Green Version]
  22. Mbabazi, D.; Migliaccio, K.W.; Crane, J.H.; Fraisse, C.; Zotarelli, L.; Morgan, K.T.; Kiggundu, N. An irrigation schedule testing model for optimization of the Smartirrigation avocado app. Agric. Water Manag. 2017, 179, 390–400. [Google Scholar] [CrossRef]
  23. UN WWAP (United Nations World Water Assessment Programme). The United Nations World Water Development Report 2015: Water for a Sustainable World; UNESCO: Paris, France, 2015.
  24. Han, S.H.; Yun, S.; Lee, J.; Kim, S.; Chang, H.; Son, Y. Estimating the production and mortality of fine roots using minirhizotrons in a Pinus densiflora forest in Gwangneung, Korea. J. For. Res. 2016, 27, 1029–1035. [Google Scholar] [CrossRef]
  25. Morgan, K.T. Improved irrigation management of sweet orange with huanglongbing. HortScience 2017, 52, 916–921. [Google Scholar] [CrossRef]
  26. Barry, G.H.; Castle, W.S.; Davies, F.S. Rootstocks and plant water relations affect sugar accumulation of citrus fruit via osmotic adjustment. J. Am. Soc. Hortic. Sci. 2004, 129, 881–889. [Google Scholar] [CrossRef]
  27. Eissenstat, D.M.; Achor, D.S. Anatomical rootstocks that of characteristics vary in specific roots root of citrus length. New Phytol. 2010, 141, 309–321. [Google Scholar] [CrossRef] [Green Version]
  28. Hamido, S.A.; Morgan, K.T.; Kadyampakeni, D.M. The effect of huanglongbing on young citrus tree water use. HortTechnology 2017, 27, 659–665. [Google Scholar] [CrossRef] [Green Version]
  29. Syvertsen, J.P.; Smith, M.L. Nitrogen uptake efficiency and leaching losses from lysimeter-grown citrus trees fertilized at three nitrogen rates. J. Am. Soc. Hortic. Sci. 1996, 121, 57–62. [Google Scholar] [CrossRef] [Green Version]
  30. Christos, D. Review article Role of nutrients in controlling plant diseases in sustainable agriculture. A review. Agron. Sustain. Dev. 2008, 28, 33–46. [Google Scholar]
  31. Bréda, N.J.J. Ground-based measurements of leaf area index: A review of methods, instruments and current controversies. J. Exp. Bot. 2003, 54, 2403–2417. [Google Scholar] [CrossRef]
  32. Cimo, G.; Lo Bianco, R.; Gonzalez, P.; Bandaranayake, W.; Etxeberria, E.; Syvertsen, J.P. Leaf starch and nutrient responses to stem girdling and drought stress with respect to understanding HLB (greening) symptoms in citrus. Acta Hortic. 2016, 1130, 293–299. [Google Scholar] [CrossRef]
  33. Keel, S.G.; Pepin, S.; Leuzinger, S.; Körner, C. Stomatal conductance in mature deciduous forest trees exposed to elevated CO2. Trees Struct. Funct. 2007, 21, 151–159. [Google Scholar] [CrossRef] [Green Version]
  34. Barkataky, S.; Ebel, R.C.; Morgan, K.T.; Dansereau, K. Water relations of well-watered citrus exposed to cold-acclimating temperatures. HortScience 2013, 48, 1309–1312. [Google Scholar] [CrossRef] [Green Version]
  35. Naor, A. Midday stem water potential as a plant water stress indicator for irrigation scheduling in fruit trees. Acta Hortic. 2000, 537, 447–454. [Google Scholar] [CrossRef]
  36. Cimò, G.; Bianco, R.L.; Gonzalez, P.; Bandaranayake, W.; Etxeberria, E.; Syvertsen, J.P. Carbohydrate and nutritional responses to stem girdling and drought stress with respect to understanding symptoms of Huanglongbing in citrus. HortScience 2013, 48, 920–928. [Google Scholar] [CrossRef]
  37. Scholander, P.F.; Hammel, H.T.; Bradstreet, E.D.; Hemmingsen, E.A. Sap pressure in vascular plants. Science 1965, 148, 339–346. [Google Scholar] [CrossRef]
  38. Mccutchan, H.; Shackel, K.A. Stem-water potential as a sensitive indicator of water stress in prune trees (Prunus domestica L.). J. Am. Soc. Hortic. Sci. 1992, 117, 607–611. [Google Scholar] [CrossRef] [Green Version]
  39. Barry, G.H.; Castle, W.S.; Davies, F.S. Soluble solids accumulation in ‘Valencia’ sweet orange as related to rootstock selection and fruit size. J. Am. Soc. Hortic. Sci. 2019, 129, 594–598. [Google Scholar] [CrossRef]
  40. Braun, P.; Schmid, J. Sap flow measurements in grapevines (Vitis vinifera L.) 1. Stem morphology and use of the heat balance method. Plant. Soil 1999, 215, 39–45. [Google Scholar] [CrossRef]
  41. Ham, J.M.; Heilman, J.L.; Lascano, R.J. Determination of soil water evaporation and transpiration from energy balance and stem flow measurements. Agric. For. Meteorol. 1990, 52, 287–301. [Google Scholar] [CrossRef]
  42. Kadyampakeni, D.M.; Morgan, K.T.; Schumann, A.W.; Nkedi-Kizza, P.; Obreza, T.A. Water use in drip- and microsprinkler-irrigated citrus trees. Soil Sci. Soc. Am. J. 2014, 78, 1351. [Google Scholar] [CrossRef]
  43. Ringuet, S.; Sassano, L.; Johnson, Z.I. A suite of microplate reader-based colorimetric methods to quantify ammonium, nitrate, orthophosphate and silicate concentrations for aquatic nutrient monitoring. J. Environ. Monit. 2011, 13, 370–376. [Google Scholar] [CrossRef] [PubMed]
  44. Scrimgeour, C. Soil Sampling and Methods of Analysis, 2nd ed.; Carter, M.R., Gregorich, E.G., Eds.; CRC Press: Boca Raton, FL, USA, 2008; p. 1224. ISBN 978-0-8593-3586-0. [Google Scholar]
  45. Mehlich, A.; Carolina, N. Communications in soil science and plant analysis mehlich 3 soil test extractant: A modification of mehlich 2 extractant. Commun. Soil Sci. Plant Anal. 2008, 3624, 1409–1416. [Google Scholar]
  46. Mylavarapu, R.S.; Sanchez, J.F.; Nguyen, J.H.; Bartos, J.M. Evaluation of mehlich-1 and mehlich-3 extraction procedures for plant nutrients in acid mineral soils of Florida. Commun. Soil Sci. Plant Anal. 2002, 33, 807–820. [Google Scholar] [CrossRef]
  47. Brunetto, G.; Melo, G.W.B.; de Toselli, M.; Quartieri, M.; Tagliavini, M. The role of mineral nutrition on yields and fruit quality in grapevine, pear and apple. Rev. Bras. Frutic. 2015, 37, 1089–1104. [Google Scholar] [CrossRef] [Green Version]
  48. Carranca, C.; Brunetto, G.; Tagliavini, M. Nitrogen nutrition of fruit trees to reconcile productivity and environmental concerns. Plants 2018, 7, 4. [Google Scholar] [CrossRef] [Green Version]
  49. Jiang, H.B.; Li, H.X.; Zhao, M.X.; Mei, X.L.; Kang, Y.L.; Dong, C.X.; Yangchun, X.U. Strategies for timing nitrogen fertilization of pear trees based on the distribution, storage, and remobilization of 15N from seasonal application of (15NH4)2SO4. J. Integr. Agric. 2020, 19, 1340–1353. [Google Scholar] [CrossRef]
  50. Quartieri, M.; Millard, P.; Tagliavini, M. Storage and remobilisation of nitrogen by pear (Pyrus communis L.) trees as affected by timing of N supply. Eur. J. Agron. 2002, 17, 105–110. [Google Scholar] [CrossRef]
  51. Hall, D.C. Estimating the relative abundance of flush shoots in citrus with implications on monitoring insects associated with flush. HortScience 2007, 42, 364–368. [Google Scholar] [CrossRef] [Green Version]
  52. Morgan, K.T.; Zotarelli, L.; Dukes, M.D. Use of irrigation technologies for citrus trees in Florida. Hort Technol. 2010, 20, 74–81. [Google Scholar] [CrossRef] [Green Version]
  53. Hu, L.M.; Xia, R.X.; Xiao, Z.Y.; Huang, R.H.; Tan, M.L.; Wang, M.Y.; Wu, Q.S. Reduced leaf photosynthesis at midday in citrus leaves growing under field or screenhouse conditions. J. Hortic. Sci. Biotechnol. 2007, 82, 387–392. [Google Scholar] [CrossRef]
  54. Gasque, M.; Martí, P.; Granero, B.; González-Altozano, P. Effects of long-term summer deficit irrigation on ‘Navelina’ citrus trees. Agric. Water Manag. 2016, 169, 140–147. [Google Scholar] [CrossRef] [Green Version]
  55. Vahrmeijer, J.T.; Taylor, N.J. We Are Intech Open, the World’s Leading Publisher of Open Access Books Built by Scientists, for Scientists TOP 1%; Intech Open: London, UK, 2018; pp. 1–15. [Google Scholar]
  56. Sato, S.; Morgan, K.T.; Ozores-Hampton, M.; Simonne, E.H. Spatial and temporal distributions in sandy soils with seepage irrigation: I. Ammon. Nitrate 2009, 73, 1044–1052. [Google Scholar]
  57. Kadyampakeni, D.M.; Morgan, K.T.; Schumann, A.; Alfred, L.; Nkedi-Kizza, P. Phosphorus and Potassium distribution and adsorption on two Florida sandy soils. Soil Sci. Soc. Am. J. 2014, 78, 325–334. [Google Scholar] [CrossRef]
  58. Busman, B.L.; Lamb, J.; Randall, G.; Rehm, G.; Schmitt, M. Nutrient management: The nature of phosphorus in soils. Univ. Minn. Ext. 2017, 1–4. Available online: https://extension.umn.edu/crop-production#nutrient-management (accessed on 28 July 2001).
  59. Sartain, J.B. Soil Testing and Interpretation for Florida Turfgrasses; Elec. Data Info. Source, SL181; University of Florida Institute of Food and Agricultural Sciences: Gainesville, FL, USA, 2018; pp. 1–6. [Google Scholar]
  60. Quaggio, J.A.; Cantarella, H.; van Raij, B. Phosphorus and potassium soil test and nitrogen leaf analysis as a base for citrus fertilization. Nutr. Cycl. Agroecosyst. 1998, 52, 67–74. [Google Scholar] [CrossRef]
  61. Gransee, A.; Führs, H. Magnesium mobility in soils as a challenge for soil and plant analysis, magnesium fertilization and root uptake under adverse growth conditions. Plant Soil 2013, 368, 5–21. [Google Scholar] [CrossRef] [Green Version]
  62. Morton, A.R.; Trolove, S.N.; Kerckhoffs, L.H.J. Magnesium deficiency in citrus grown in the Gisborne district of New Zealand. N. Z. J. Crop Hortic. Sci. 2008, 36, 199–213. [Google Scholar] [CrossRef]
  63. Elrashidi, M.A.; O’Connor, G.A. Boron sorption and desorption in soils1. Soil Sci. Soc. Am. J. 1982, 46, 27. [Google Scholar] [CrossRef]
  64. Mesquita, G.L.; Zambrosi, F.C.; Tanaka, F.A.; Boaretto, R.M.; Quaggio, J.A.; Ribeiro, R.V.; Mattos, D. Anatomical and physiological responses of citrus trees to varying boron availability are dependent on rootstock. Front. Plant Sci. 2016, 7, 224. [Google Scholar] [CrossRef] [PubMed]
  65. Eller, F.; Brix, H. Influence of low calcium availability on cadmium uptake and translocation in a fast-growing shrub and a metal accumulating herb. AoB Plants 2016, 8, 1–9. [Google Scholar] [CrossRef] [Green Version]
Figure 1. Stem water potential (Ψw) of Huanglongbing (HLB)-affected Hamlin citrus trees in spring (A,C) 2017 and summer (B,D) 2018 seasons. Treatments (T): Control (1), full Ca dose (2), full Mg dose (3), and half Ca and half Mg doses (4), (full dose = 45 kg ha−1). Means followed by different lower case letters are significantly different at p ≤ 0.05, based on the Tukey–Kramer honestly significant difference test (n = 36) [1 MPa = 10 bar, 1 g m–2 = 0.0033 oz/ft2].
Agronomy 10 01485 g001
Figure 2. Sap flow of Huanglongbing (HLB)-affected Hamlin citrus trees budded on Cleopatra (AC) and Swingle (DF) rootstocks during April–May 2017, 2018, and 2019 at Southwest Florida Research and Education Center near Immokalee, FL. Treatments: Control (1), full Ca dose (2), full Mg dose (3), and half Ca and half Mg doses (4), (full dose = 45 kg ha−1).
Agronomy 10 01485 g002
Figure 3. Logarithmic regression of sap flow and solar radiation of Huanglongbing (HLB)-affected Hamlin citrus trees under control (A), full Ca dose (B), full Mg dose (C), and half Ca and half Mg doses (D), (full dose = 45 kg ha−1) treated trees. NS, *** Non-significant or significant at p < 0.0001.
Agronomy 10 01485 g003
Figure 4. The logarithmic regression of sap flow and solar radiation of Huanglongbing (HLB)-affected Hamlin citrus trees budded on Swingle rootstocks under control (A), full Ca dose (B), full Mg dose (C), and half Ca and half Mg doses (D), (full dose = 45 kg ha−1) treated trees. NS, *** Non-significant or significant at p < 0.0001.
Agronomy 10 01485 g004
Figure 5. Soil NO3-N dynamics and accumulation of Huanglongbing (HLB)-affected Hamlin citrus trees budded on Cleo and Swc rootstocks during spring (AC) and summer (DF) 2018 in three soil depths (0–15, 15–30, and 30–45 cm). Means with different lower case letters are significantly different at p ≤ 0.05, based on the Tukey–Kramer honestly significant difference test (n = 36).
Agronomy 10 01485 g005
Figure 6. Soil NH4-N dynamics and accumulation of Huanglongbing (HLB)-affected Hamlin citrus trees budded on Cleo and Swc rootstocks during spring (AC) and summer (DF) 2018 in three soil depths (0–15, 15–30, and 30–45 cm). Means with different lower case letters are significantly different at p ≤ 0.05, based on the Tukey–Kramer honestly significant difference test (n = 36).
Agronomy 10 01485 g006
Figure 7. Soil Ca2+ dynamics and accumulation of Huanglongbing (HLB)-affected Hamlin citrus trees budded on Cleo and Swc rootstocks during spring (AC) and summer (DF) 2018 in three soil depths (0–15, 15–30, and 30–45 cm). Treatments: Control (1), full Ca dose (2), full Mg dose (3), and half Ca and half Mg doses (4), (full dose = 45 kg ha−1). Means with different lower case letters are significantly different at p ≤ 0.05, based on the Tukey–Kramer honestly significant difference test (n = 36).
Agronomy 10 01485 g007
Figure 8. Soil Mg2+ dynamics and accumulation of Huanglongbing (HLB)-affected Hamlin citrus trees budded on Cleo and Swc rootstocks during spring (AC) and summer (DF) 2018 in three soil depths (0–15, 15–30, and 30–45 cm). Treatments: Control (1), full Ca dose (2), full Mg dose (3), and half Ca and half Mg doses (4), (full dose = 45 kg ha−1). Means with different lower case letters are significantly different at p ≤ 0.05, based on the Tukey–Kramer honestly significant difference test (n = 36).
Agronomy 10 01485 g008
Table 1. Effect of rootstock and soil-applied plant nutrition on the leaf area index (LAI) and analysis of variance (ANOVA) of Huanglongbing (HLB)-affected Hamlin citrus trees during the 2017–2019 seasons at Immokalee, FL.
20182019
SpringSummerSpringSummer
Rootstocks 2
Treatments 1CleoSwcCleoSwcCleoSwcCleoSwc
10.67 b 3−0.34 a0.62 b0.50 b−0.46 a−0.01 b0.28 a0.09 b
20.75 a−0.29 a0.73 a0.66 a−0.39 b0.18 a0.86 b0.40 a
30.87 a−0.13 a0.91 a0.65 a−0.45 b0.35 a0.89 b0.23 a
40.87 a−0.05 b0.94 a0.95 a−0.63 a0.08 b0.98 b0.24 a
Significance 4NS****************
Effect 5Significance level
R****NS*
S***********
N***NSNS
1 Treatment: control (1), full Ca dose (2), full Mg dose (3), and half Ca and half Mg doses (4), (full dose = 45 kg ha−1). 2 Hamlin citrus trees budded on either Cleopatra (Cleo) or Swingle (Swc) rootstocks. 3 Means values on vertical columns followed with different letters are significantly different at p ≤ 0.05, based on the Tukey–Kramer honestly significant difference test (n = 48). Negative values indicate a decrease in LAI following the cold winter season and vegetative reduction after fruit harvest. 4 NS, *, **, or *** Non-significant or significant at p ≤ 0.05, 0.01, or <0.0001, respectively. 5 Factorial effects: R = rootstocks, N = nitrogen rate, and S = secondary macronutrients (Ca, Mg, or Ca + Mg combined).
Table 2. Effect of rootstock and soil-applied plant essential nutrients on stomatal conductance of Huanglongbing (HLB)-affected Hamlin citrus trees during the 2017–2018 seasons at Immokalee, FL.
20172018
SpringSummerSpringSummer
Rootstocks 1
Macro 2CleoSwcCleoSwcCleoSwcCleoSwc
Stomatal conductance (mmol m−2 s−1)
12.66 a 32.56 a4.84 a4.43 a4.43 a5.31 a4.14 a4.27 b
22.70 a2.58 a5.12 a4.43 a4.63 a5.24 a4.41 a4.72 ab
32.66 a2.54 a5.01 a4.12 a4.35 a5.23 a4.53 a4.87 a
42.61 a2.55 a4.79 a4.61 a4.59 a5.12 a4.61 a5.07 a
Significance 4NSNSNSNSNSNSNS*
Effect 5ANOVA
R************
SNSNSNS***
NNSNSNSNS
1 Hamlin citrus trees budded on either Cleopatra (Cleo) or Swingle (Swc) rootstocks. 2 Treatments: control (1), full Ca dose (2), full Mg dose (3), and half Ca and half Mg doses (4), (full dose = 45 kg ha−1). 3 Means on vertical columns followed with different letters are significantly different at p ≤ 0.05, based on the Tukey–Kramer honestly significant difference test (n = 36). 4 NS, * or *** non-significant or significant at p ≤ 0.05, or < 0.0001, respectively. 5 Factorial effects: R = rootstocks, N = nitrogen rate, and S = secondary macronutrients.
Table 3. Analysis of variance (ANOVA) of soil nutrient concentration on a dry weight basis in Huanglongbing (HLB)-affected Hamlin citrus trees.
Spring 2017Summer 2017
NO3-NNH4-NCaMgNO3-NNH4-NCaMg
Effect 1Significance level 2
D******NS*************
R******NS************
NNSNSNSNS***NSNSNS
S**NS*NS*NSNSNS
D × RNSNSNSNSNS*****
R × SNSNS**NSNS****NS
R × NNS**NSNSNSNSNSNS
Spring 2018Summer 2018
DNS********************
R******NSNSNS******NS
N*NSNS*NSNSNSNS
SNS**NS***NSNSNS***
R × SNSNSNSNSNSNSNS*
R × NNSNS*NS*****NS
N × SNSNSNS**NSNS*****
N × R × SNSNS***NSNS*****
1 Factorial effects: D = depths of the soil, R = rootstocks, N = nitrogen rate, and S = secondary micronutrients. 2 NS, *, **, and *** represent non-significant or significant at p ≤ 0.05, < 0.01, and < 0.0001, respectively.

