Article

Plant Nutrient Availability and pH of Biochars and Their Fractions, with the Possible Use as a Component in a Growing Media

1
Compost/AD Research & Advisory (IE, CY), Naas, W91 TYH3 Kildare, Ireland
2
Department of Agricultural Sciences, Biotechnology and Food Science, Cyprus University of Technology, Limassol 3603, Cyprus
3
Bord na Mona Research Centre, Main Street, Newbridge, W12 XR59 Kildare, Ireland
4
Department of Horticultural Science, INRES-Institute of Crop Science and Resource Conservation, University of Bonn, 53121 Bonn, Germany
*
Authors to whom correspondence should be addressed.
Agronomy 2020, 10(1), 10; https://doi.org/10.3390/agronomy10010010
Submission received: 20 November 2019 / Revised: 15 December 2019 / Accepted: 17 December 2019 / Published: 19 December 2019
(This article belongs to the Special Issue Soilless Culture, Growing Media and Horticultural Plants)

Abstract

:
Biochar has the potential to be used as a growing media component, and therefore plays a role in reducing peat usage. It has unique properties apart from the ability to sequester carbon. Here we investigated the nutrient contents of four commercial biochars and their fractions. The biochars’ feedstock was wood waste, except for one with paper fibres and husk. The fine or finer fractions in wood waste biochars contained higher levels of nutrients that were available to plants. The coarse fraction of the biochar derived from husk and paper fibre feedstock had a higher level of total N, P and K in contrast to the other three biochars. The pH of the finer fraction (pH of 9.08) was also higher compared with coarse fraction (pH of 8.71). It is important that when biochar a is used as a component of a peat based growing media, particle size information should be provided, as fractions from the same biochar can have different levels of total extractable nutrients and pH levels. If biochar is used to replace or reduce lime application rates of a peat-biochar mixtures, one must take into account the levels of total and extractable Ca and Mg levels, as these can vary. The variation of these elements was not only between biochars’ feedstocks, even at similar pH-values, but within different fractions in the same biochar. We concluded that biochars should be characterized from the feedstock as well as from the particle size aspect, as it could have a profound effect on nutrient availability of Ca and Mg. This could lead to nutrient imbalances in cultivating plants on substrate mixtures. In addition to nutrient ratios, the suitable pH-level for a given grown species should be adjusted.

1. Introduction

Biochar is an organic carbon-rich solid by-product, which is gaining great interest in research for its utilization under the environmental and agricultural management [1,2,3]. Therefore, in addition to the common use as soil amendment material, biochar is being explored in terms of use for soil remediation [4,5,6,7], water filtration [8] and soilless substrates [9,10]. Recently there has been great interest in the use of biochar as a bioresource and growing media material [11,12,13,14]. Biochar and hydrothermal carbonization might play more important roles as constituents of growing media [15].
Biochar can be produced from several organic sources using pyrolysis under minimal oxygen supply, but also, for the use as growing media, from chunky timber waste; e.g., wood chips are suitable. This has to be milled to particles sized generally less than 10 mm as a result of crushing, in order to be considered as a growing media component. A number of commercial producers supply biochars in different sizes. There are also limitations for the feedstocks used, as soft woody materials (e.g., from greenhouse crop waste), including stems, are not suitable due to excessive salinity levels [16]. In this case a hydrothermal carbonization process that requires only moderate temperatures and pressures is usually used [15].
A raft of publications has described biochar as a partial peat replacement over last three years [17,18,19,20,21], with several different organic materials playing an important role in decreasing the C footprint of the horticultural industry [15]. Peat is the principal material for container growing media in Europe, and peat production in Europe is more than 40 million m3. Peat currently represents 77%–80% of the growing media annually used in the horticultural industry in Europe [22,23,24]. However, peat comes from peatland ecosystems, which are very important for carbon sequestration. Peatlands are most important carbon sinks and one of the most important effective eco-systems in the terrestrial biosphere. The carbon storage in peatlands in Europe is estimated to be approximately 43,000 million tons [24]. Peat has a low pH, around pH 4, and is generally almost devoid of plant nutrients. It has the advantage that due to its low pH and nutrient levels, both pH and other nutrients can be brought to pre-determined levels for crop growth [25]. Hence, when peat is used as a substrate, stored carbon is released, negatively affecting the environment and CO2 balance [26]. For instance, Vaughn et al. [27] reported that biochar can substitute peat at levels lower than 15% (v/v), whereas higher rates derived unsatisfactory results, possible due to the high salinity and pH values, imbalance of nutrients and high C:N ratio.
Biochar has unique chemical properties. It can reduce leaching of nutrients, including nitrate [28] and P; act as a bio stimulant, especially affecting the roots and suppressing root disease [10,29,30]; reduce greenhouse gases (GHG) from growing media when ebb and flood irrigation is practiced, as anoxic conditions occur for short periods; and sequester C at the end of life of growing media, when it ultimately ends in soil [17]. At present, the costs of biochars are prohibitive. However, if during the pyrolysis process all products are used, e.g., for heat to generate electricity, bio oil for heating and using biochar as a minor component of a growing medium, and there is a gate fee for waste wood, biochar would be particularly viable. Biochar has generally a very high pH and contains nutrient elements, e.g., K, at quite high levels. These elements could be used for plant nutrition. However, only in few plant growth trials the nutrients presented in biochar were taken into account when used as a growing medium [30,31]. On the other hand, biochar’s high pH was considered and the rates of lime were reduced [32,33]; or lime rate can be eliminated [34], when biochar is added. Bedussi et al. [32] used biochar that was produced by gasification instead of pyrolysis. Gasification takes place at a much higher temperature (1100 to 1200 °C) than pyrolysis (400 to 600 °C). Higher temperature has a major effect on biochar properties such as pH, total Ca and Mg levels [1,35]. Thus, products from these two above processes may not be directly comparable.
Numerous papers have evaluated biochar’s positive effects on plant growth [10,11,36], but very few, such as the studies from Bedussi et al. [32], Kaudal et al. [20] and Mendez et al. [37], have characterized the biochar used in the growing media. Recently, some studies have been conducted to look at the effect of biochar particle size on physical properties of growing media [27,38]. Zaccheo et al. [33], have also shown that biochar having fine granulometry can be more effective in increasing the pH, and therefore, eliminating the need for liming of peat [32]. The nutrient properties of the particle size of biochar have been studied but only in terms of soil application [39] or for environmental use [40,41].
We are not aware of relevant studies on pH, total and extractable macronutrients and micronutrient contents of different biochar particle size fractions. Generally, quite high levels of fine fractions < 1 mm and < 2 mm have been administered, when biochar has been used in growing media [20,29,30,32,37,38]. In ad hoc trials in a few commercial biochar products with different fractions, we were surprised to find differences in pH and nutrient contents in the different fractions from the same biochar. This is in contrast to peat, as no difference in pH was reported between fine, medium and coarse peat [42]. In the present study, we studied the pH, total and available macronutrients and micronutrient contents of biochar fractions from a number of commercial biochars that have the potential for use as growing media. The nutrient availability test that we used has been found to be very strongly correlated to plant nutrient uptake in a series of publications [43], and on this basis has been accepted as a European test [44]. We particularly looked at both total and extractable (available) Ca and Mg in relation to pH in the biochar fractions.

2. Materials and Methods

For our investigations we selected four commercial grade biochars: three from Europe and one from China. One of them derived from having cereal husk and paper fibre as a feedstock (Biochar A—DU). Three were derived from wood-based materials; namely, bamboo (Biochar B—No commercial name), wood screenings (Biochar C—Verora) and forest wood (Biochar D—Carbon Terra). Following pyrolysis by different manufactures, the biochars were chunky and had been milled to approximately less than 10 mm. The four biochars were characterized for pH [45] and electrical conductivity [46] in water extract at a 1:5 (v:v) ratio. The materials were characterised by extractable NH4-N and NO3-N; total N, K and P [44]; bulk density; and specific surface areas of the different biochars, including pore volume and diameter that were measured with a Quantachrome Autosorb-1 surface area Analyser, using N2 (Brunauer, Emmett and Teller—BET) sorption methods [47].
Each material was sieved to three fractions as < 1 mm, 1–2 mm and 2–4 mm (see Figure A1). We took care to ensure each entire fraction that passed through the screens for the various fractions was obtained. For each particle size fraction, 20 to 30 g of biochar was obtained, dried and mixed well prior to physic-chemical analyses. They were then analysed for total macronutrients and micronutrients, as described by Chrysargyris et al. [48]. Nitrogen was analysed using Kjeldahl method (Buchi Digest Automat K 439 and Distillation Kjelflex K 366, Switzerland). Other macro and micronutrients were ashed and the ash was digested with hydrochloric acid (2N HCl). Ash extracts were analysed using atomic absorption spectroscopy (PG Instruments AA 500 FG, Leicestershire, UK). The determinations of K and Na were made using a flame photometer (Lasany Model 1832, Lasany International, Haryana, India). Results are expressed in g kg−1 and mg kg−1 for macronutrients and micronutrients, respectively. Biochars’ fractions were extracted for available nutrients using BaCl2/DTPA extraction on volume basis according to EN 13651 [44]. BaCl2 was used at the same concertation as the standard CaCl2/DTPA, EN 13651 [44]. The extracts were analysed for macro and micronutrients. The four biochar materials by three particle sizes were assessed for pH [45] in water extracts, at 1:5 (v:v) ratios, and BaCl2/DTPA extractable NH4-N and NO3-N [44,49]. Determination of BaCl2/DTPA extractable nutrients P, K, Ca, Mg, Fe, Na, Zn, Cu, Mn and B were determined in the filtered extract by inductively coupled plasma atomic emission spectrometry (Perkin Elmer ICP-OES, Waltham, MA, USA). Sulphate was measured in the extract by separating the anions by their affinity for an anion exchange resin packed in the anion separator column. The concentration of the sulphate anion was determined by measuring the conductance as it passed through conductivity cell.

Statistical Methods

Data were statistically analysed with the IBM SPSS version 22 (IBM Corp., Armonk, NY, USA) and results are expressed as means (n = 3) ± standard errors (SEs). Differences between treatment means were compared at p = 0.05 with ANOVA, followed by Duncan’s multiple range test (DMRT).

3. Results

The characterization of the examined commercial, and an unscreened biochar, showed high pH, relatively high electrical conductivity, high extractable K and very low extractable N in all four biochars (Table 1). Extractable P was significantly (p < 0.05) higher in Biochar B compared with the other Biochars. The surface area tended to be highest with Biochar D, and lowest with Biochar B. The bulk density was highest for Biochar D. The pore volume and pore size followed the same trend as the surface area (Table 1).
The total macronutrients and micronutrients of different fractions of four biochars are given in Figure 1 and Figure 2, respectively. The pH values and extractable contents of elements of the three fractions are presented in Figure 2. The extractable macronutrients and extractable micronutrients of three fractions of four biochars are given in Figure 3 and Figure 4, respectively, while selected correlation analysis among some elements are presented in Figure 5.

3.1. Biochar’s Total Elemental Contents and Correlations

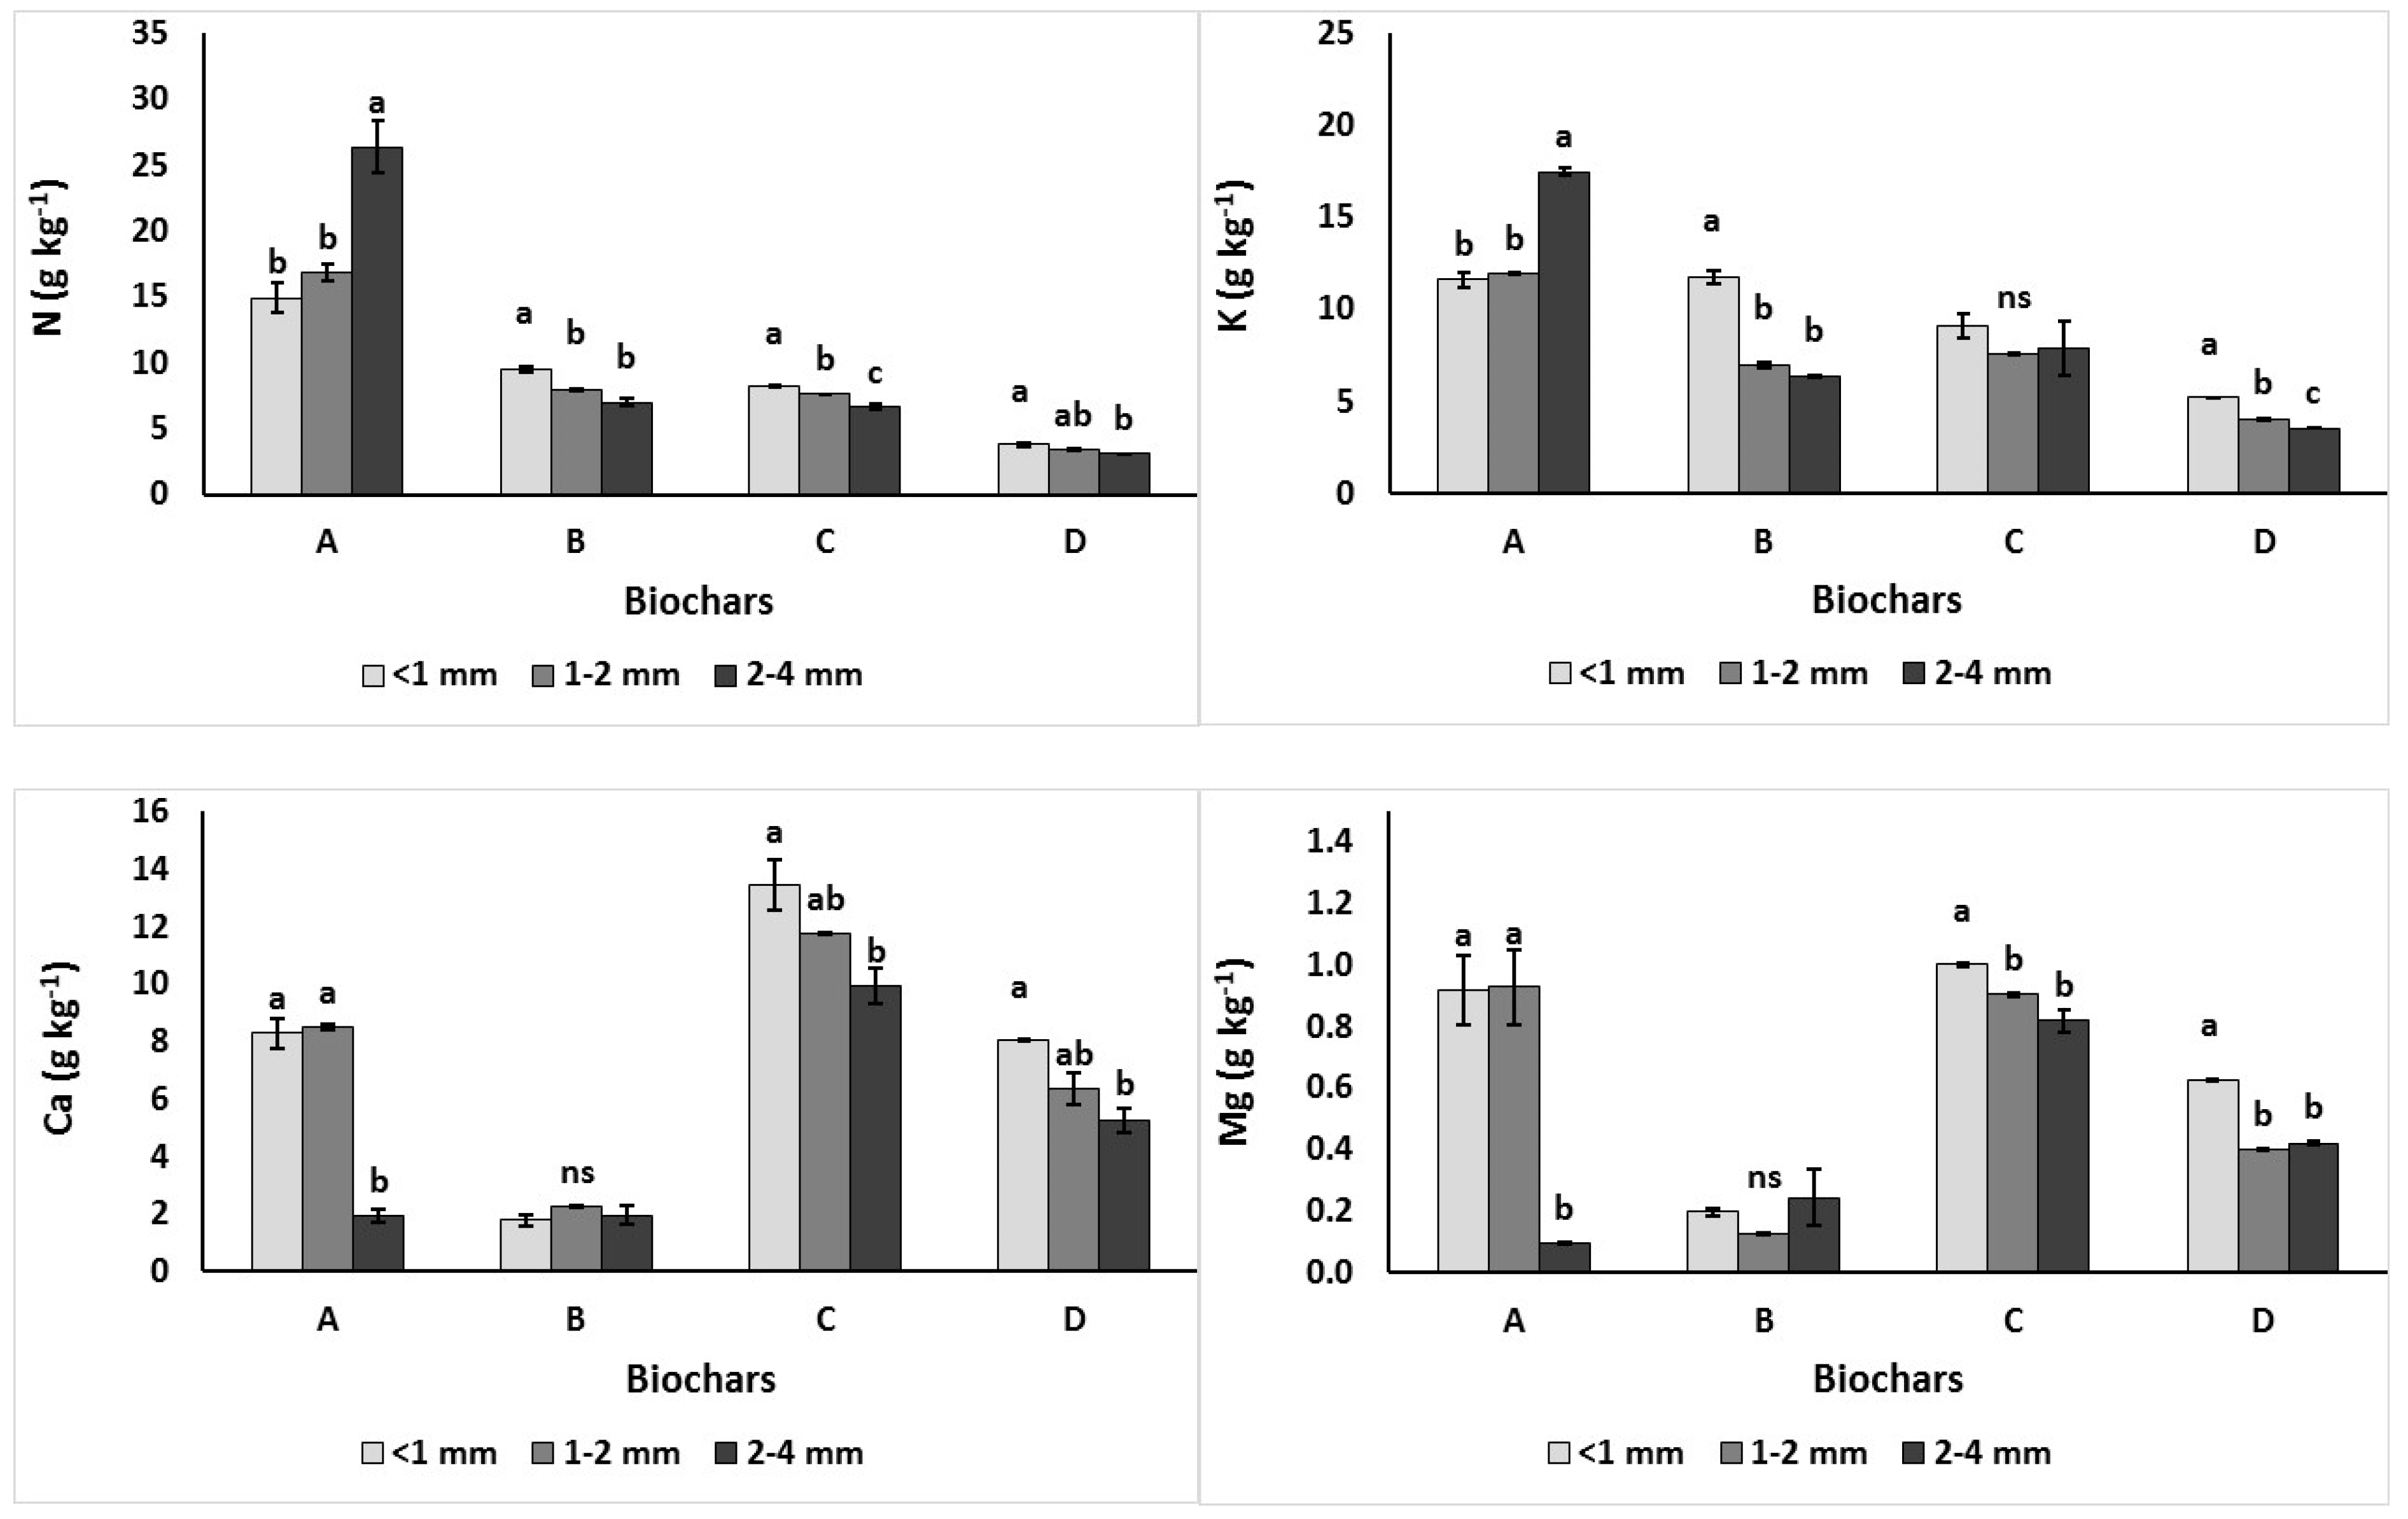
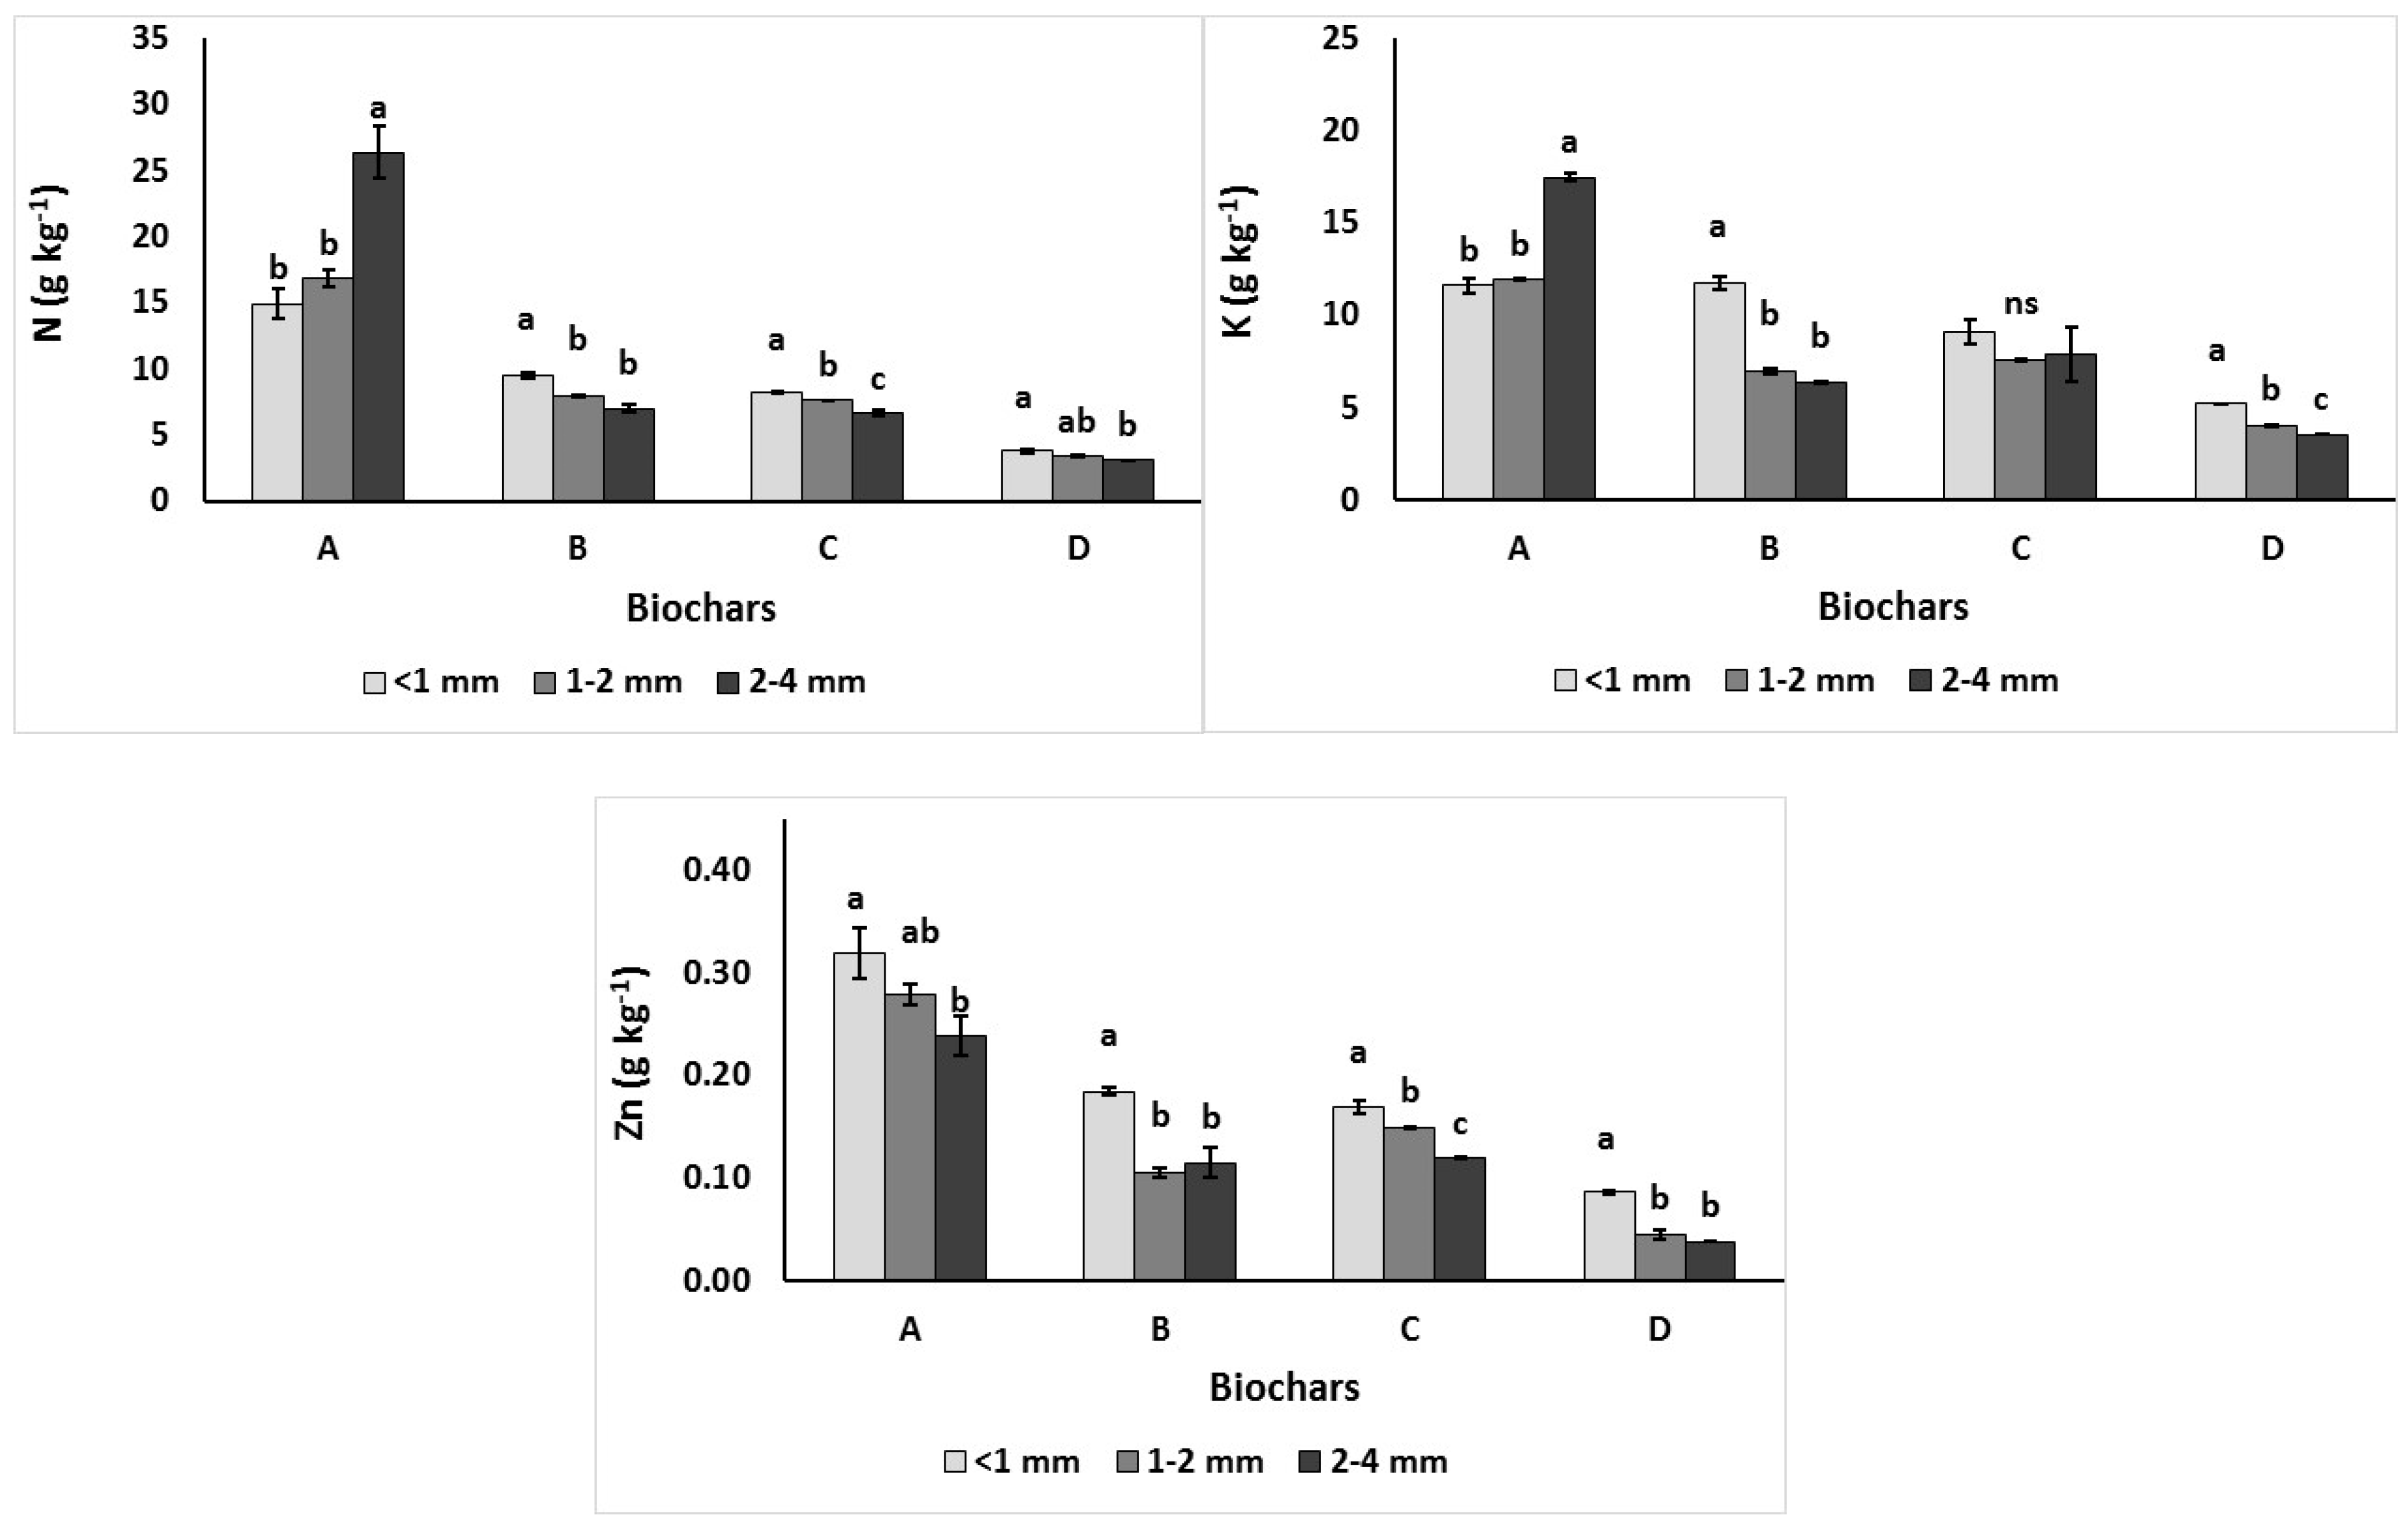
3.1.1. Total Macronutrients N, K, Ca, Mg, P and Na

The fine fraction had significantly (p < 0.05) higher levels of N (25.9%, 19.0% and 18.9%) for the Biochars B, C and D, respectively, compared with the coarse fraction (Figure 1), while the opposite was found in case of the Biochar type A. The coarse fraction of 2–4 mm of Biochar A showed 26.41 mg kg−1 N, which was 77% higher than the fine fraction, and that high N level was present only in Biochar A, which was the opposite to the other three biochars (Figure 1). The total K levels followed the same pattern as N, except that Biochar C that showed no significant effects of particle size (Figure 1). The biochar derived by husks and paper fibres, named Biochar A, revealed 17.50 mg kg−1 of K, which was the highest content at 2–4 mm fraction. Similar to N and K, the higher levels of total P were found in Biochar B, Biochar C and Biochar D in the finer fraction. An exception was Biochar A, which had the opposite trend with higher levels in the coarser fraction (Figure 1).
The Ca levels were significantly higher in the fine (<1 mm) and medium (1–2 mm) fractions for the examined biochars, except for Biochar B, which had no significant differences between fractions (Figure 1). Similarly, to Ca, the Mg levels were higher in the fractions of < 1 mm and 1–2 mm for the Biochar A, whereas in Biochar C and Biochar D, greater Mg contents were observed in their fractions < 1 mm. The total contents of Mg in Biochar B were the same among fractions (Figure 1). No differences were evident between the fractions for the total Na content, as presented in Figure 1.

3.1.2. Total Micronutrients Cu, Mn and Zn

Higher levels of total Cu were found in the finer fractions of two biochars—A and D. There was a clear-cut trend with the fine fraction with higher levels of Zn for the examined biochars (Figure 2). This was similar to the results that we got with extractable Zn (Figure 4). Only in Biochar C, the trend of higher levels of Mn in the fine fraction was present (Figure 2), and the results did not reflect in extractable Mn (Figure 4).

3.2. Biochars’ Extractable Elemental Contents

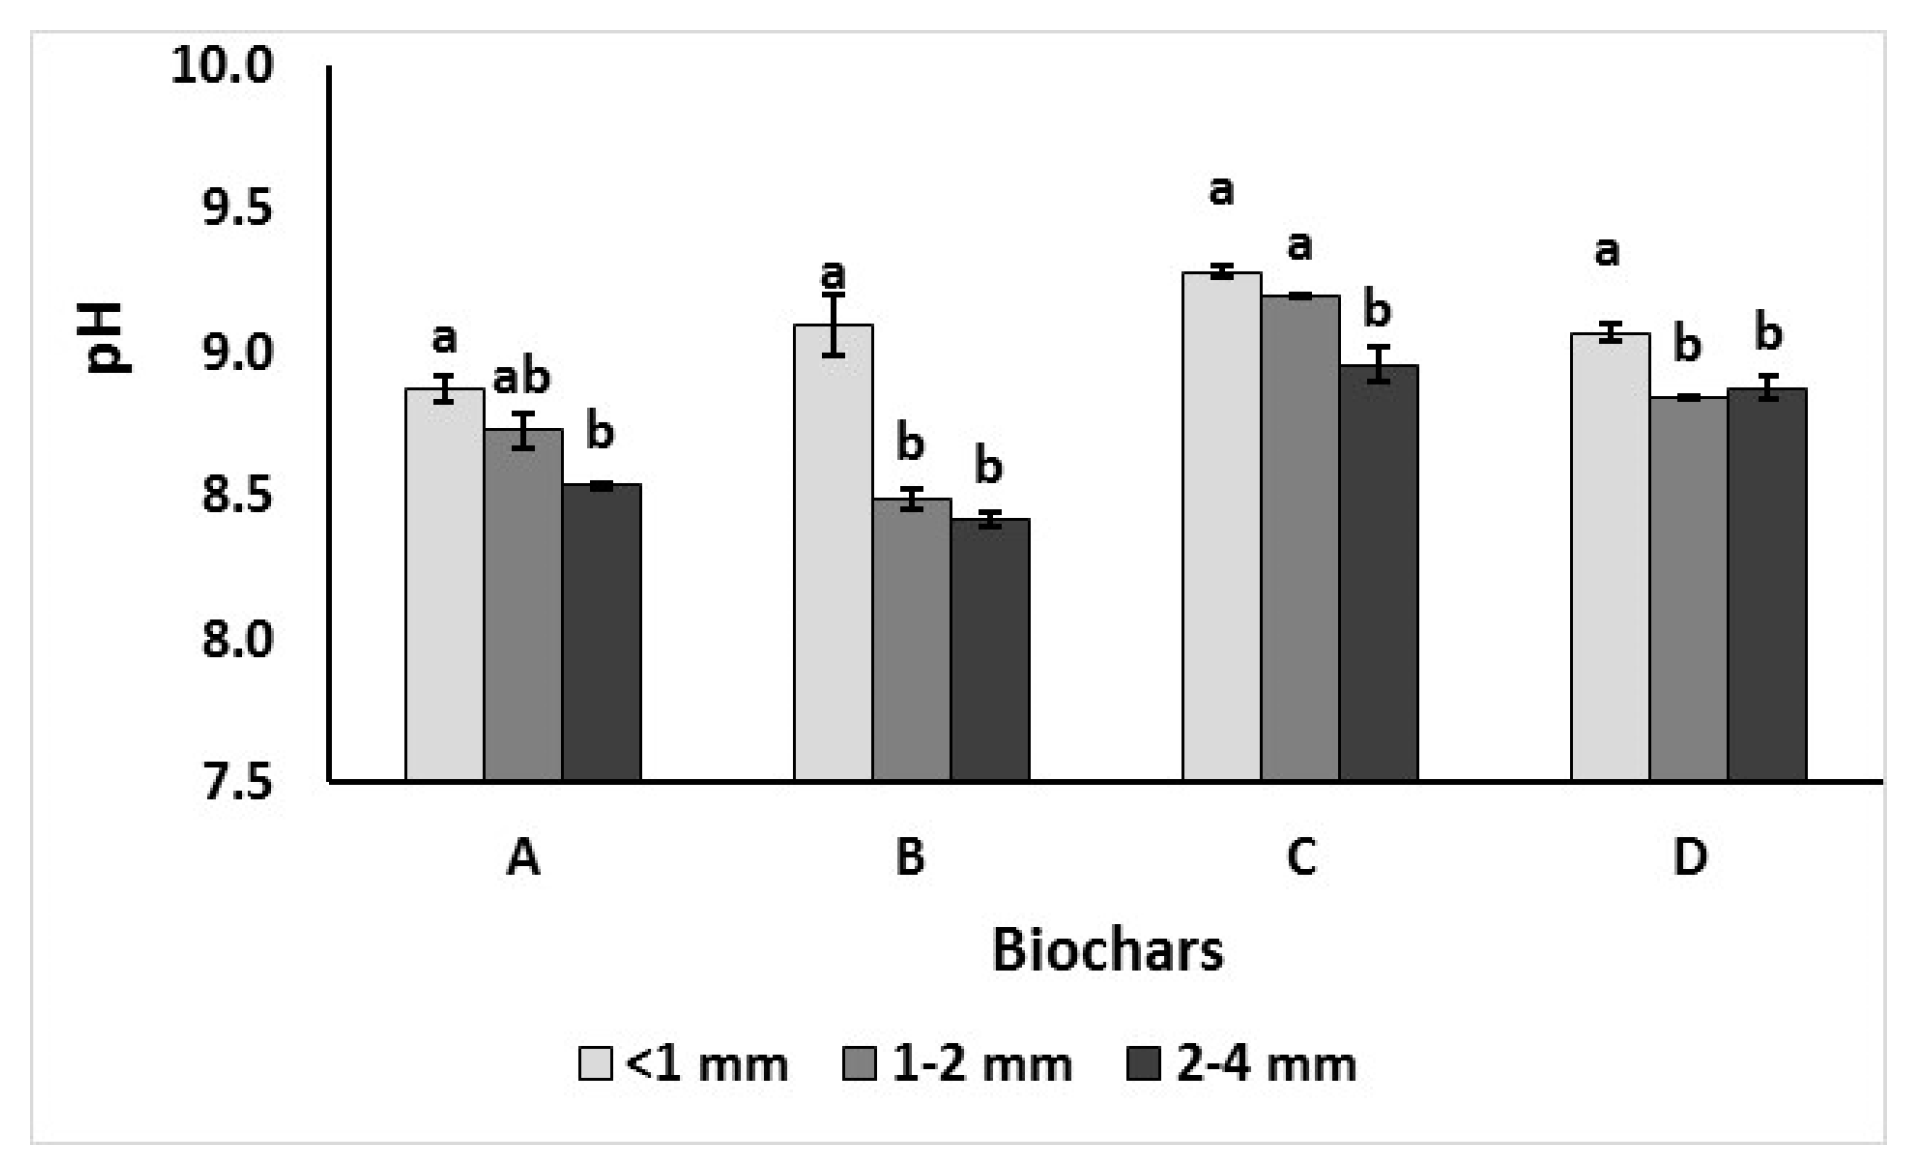
3.2.1. The pH and Extractable Macronutrients N, K, P, Ca, Mg, Na and SO4

The pH was higher in the fine fraction for all four biochars (Figure 3). The pH levels revealed the same values for the medium (1–2 mm) and coarse (2–4 mm) fractions for Biochar A, Biochar B and Biochar D.
Levels of NH4-N and NO3-N were very low, with values < 2 mg L−1 (data not presented). There was a clear trend of increasing K in the fine fraction (Figure 4). The two biochars, C and D, based on wood waste material, had a similar trend. Biochar B from paper fibre and cereal husk had higher (2535 mg L−1) levels of K (Figure 2).
The finer fraction (<1 mm) had significantly higher levels of extractable P in three (A, B and C) of the four biochars, while no significant differences were found among 1–2 mm and 2–4 mm fractions. Biochar D had very low values of extractable P in all the three fractions and there was no significant effect of biochar fraction (Figure 4).
Regarding extractable Ca, there was also a clear significant trend of the fine fraction containing higher levels calcium, with the woody materials, Biochars C and D, being very similar. The level of calcium in the Biochar A was high (up to 1094 mg L−1 at < 1 mm), while in the Biochar B, even in the fine fraction it was very low (up to 271 mg L−1 at < 1 mm) (Figure 4).
The fine fraction had significantly higher levels of magnesium but there was no significant difference between 1–2 mm and 2–4 mm. As with potassium the levels, in the biochar derived by bamboo (B), Mg was high, reaching 145.7 mg L−1 of extractable Mg (Figure 4).
Only in two types of the biochars, namely, A and D, did the fine fraction have significantly higher levels of Na, while biochars B and C did not differ among the fractions examined (Figure 4). There were no significant differences between the fine and coarser fractions among the biochars in relation to extractable SO4 (Figure 4).

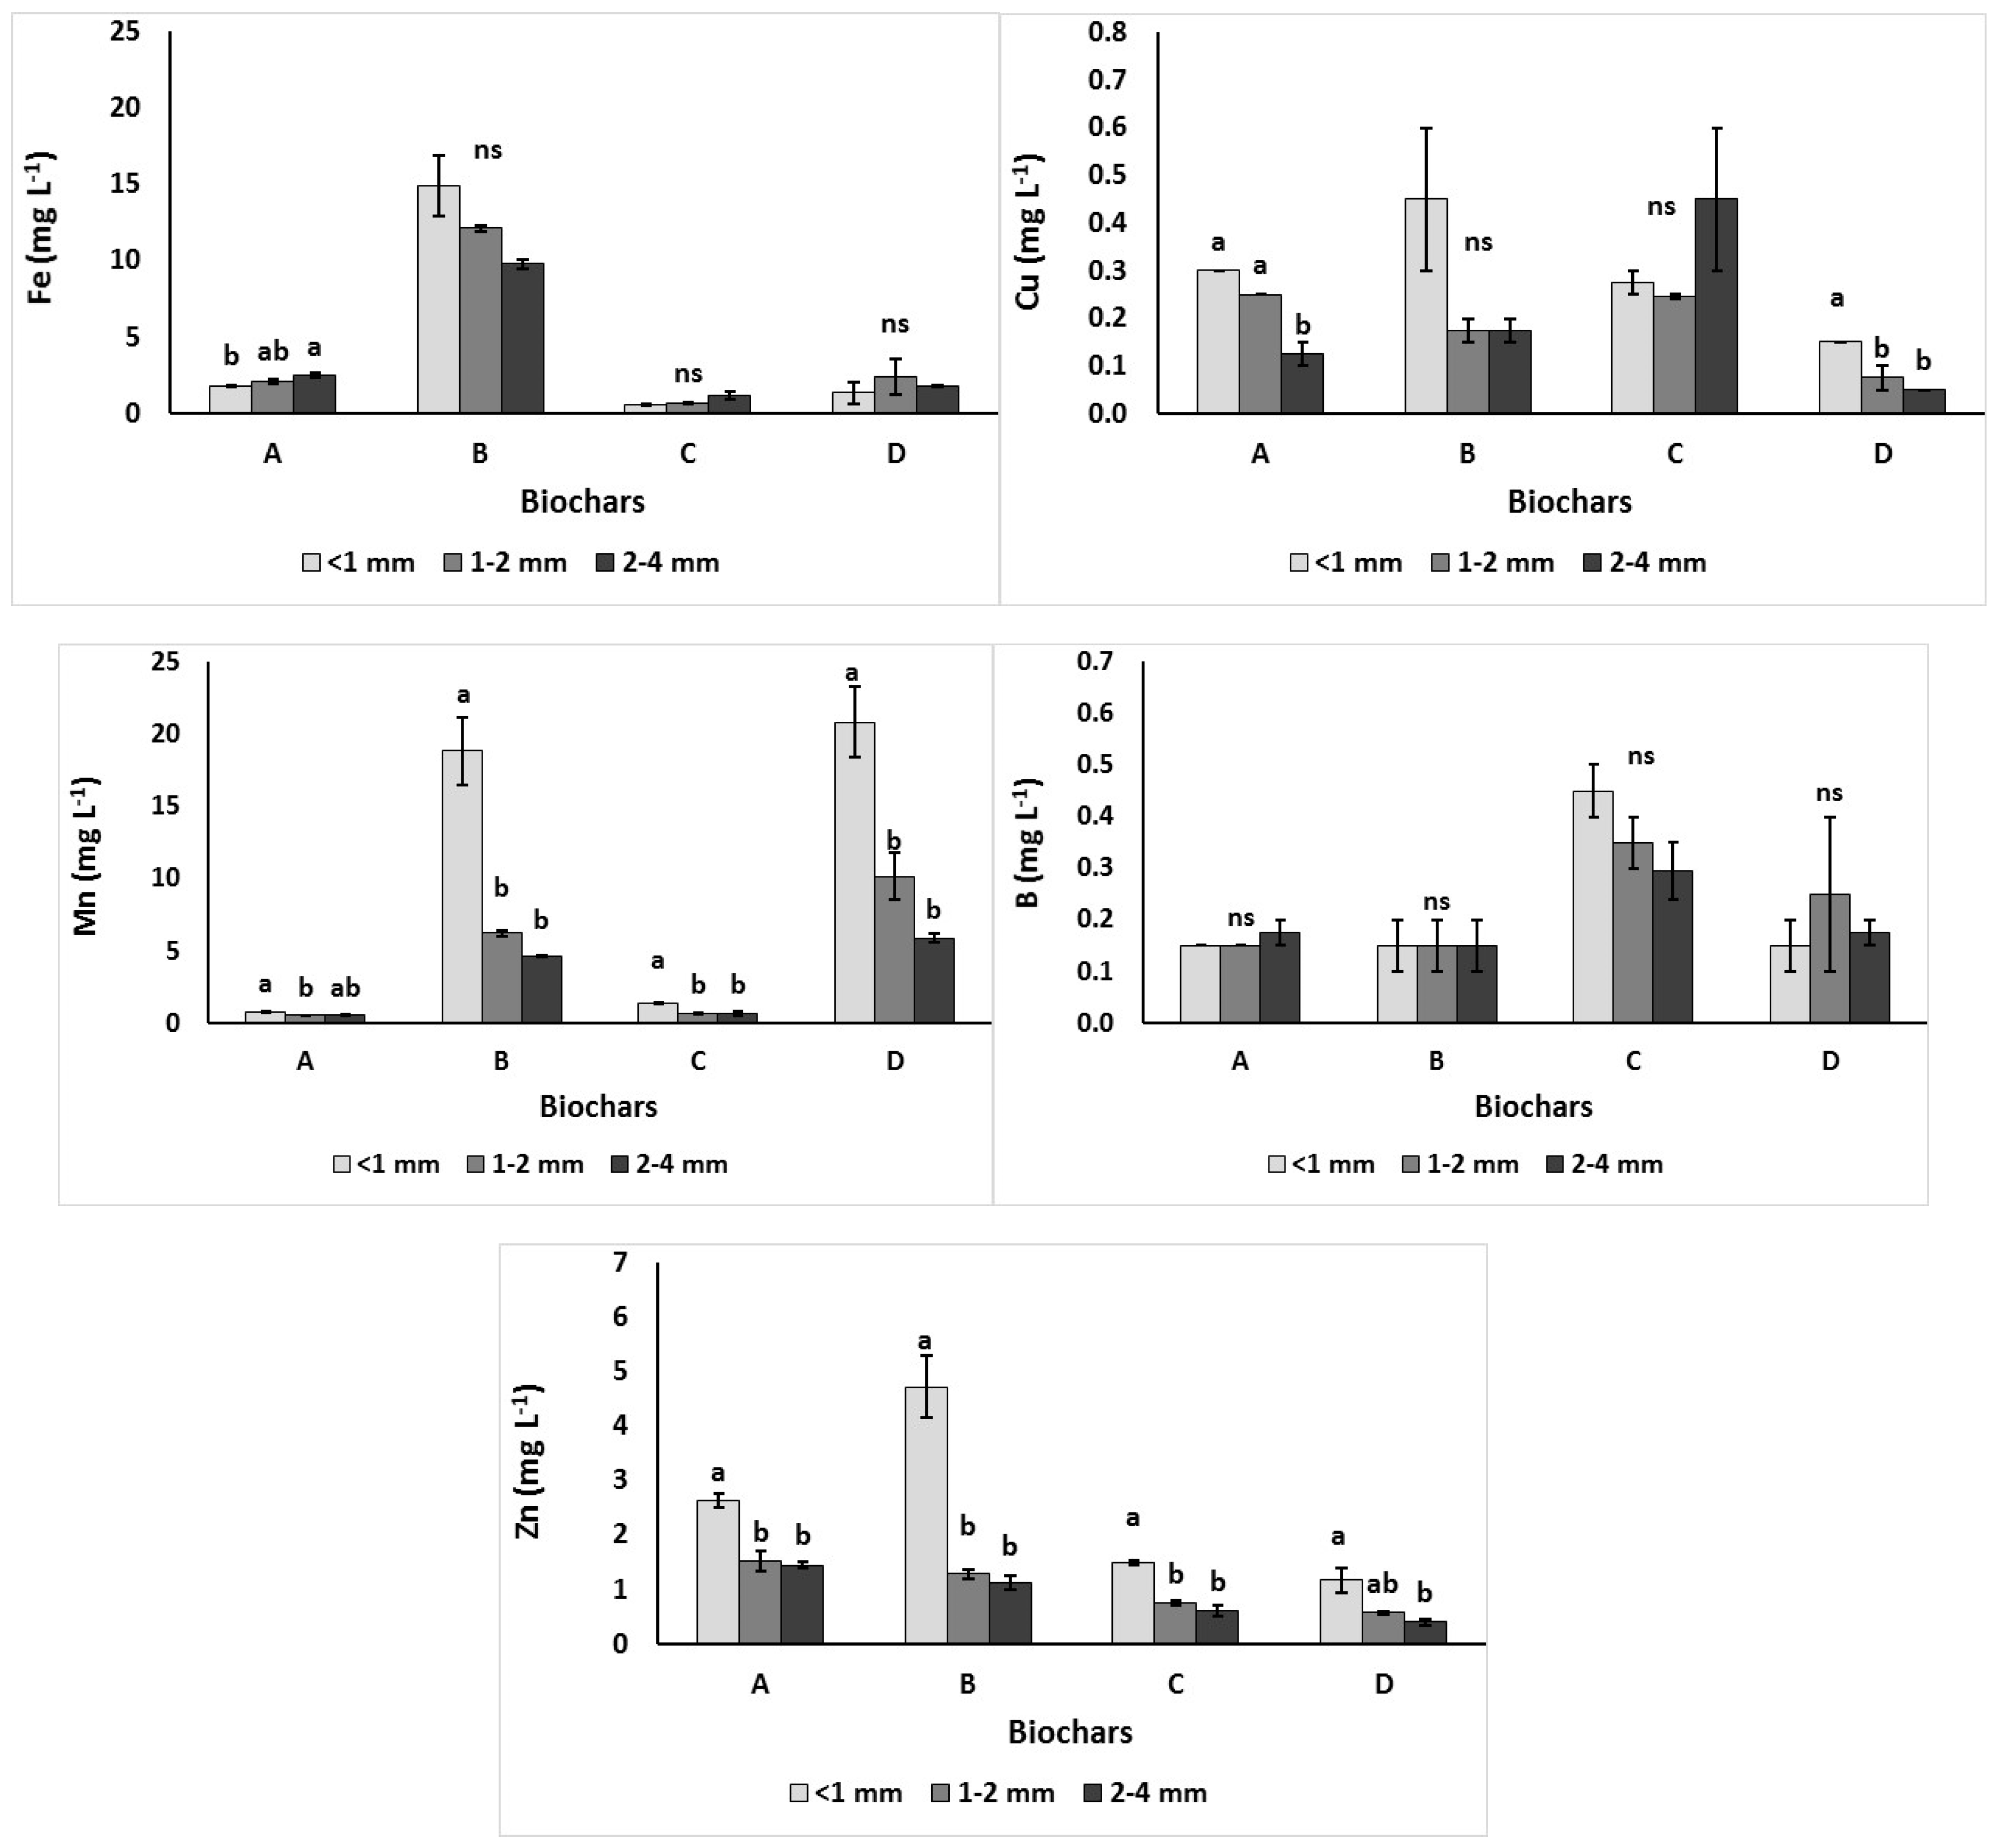
3.2.2. Extractable Micronutrients (Zn, Mn, Fe, B and Cu)
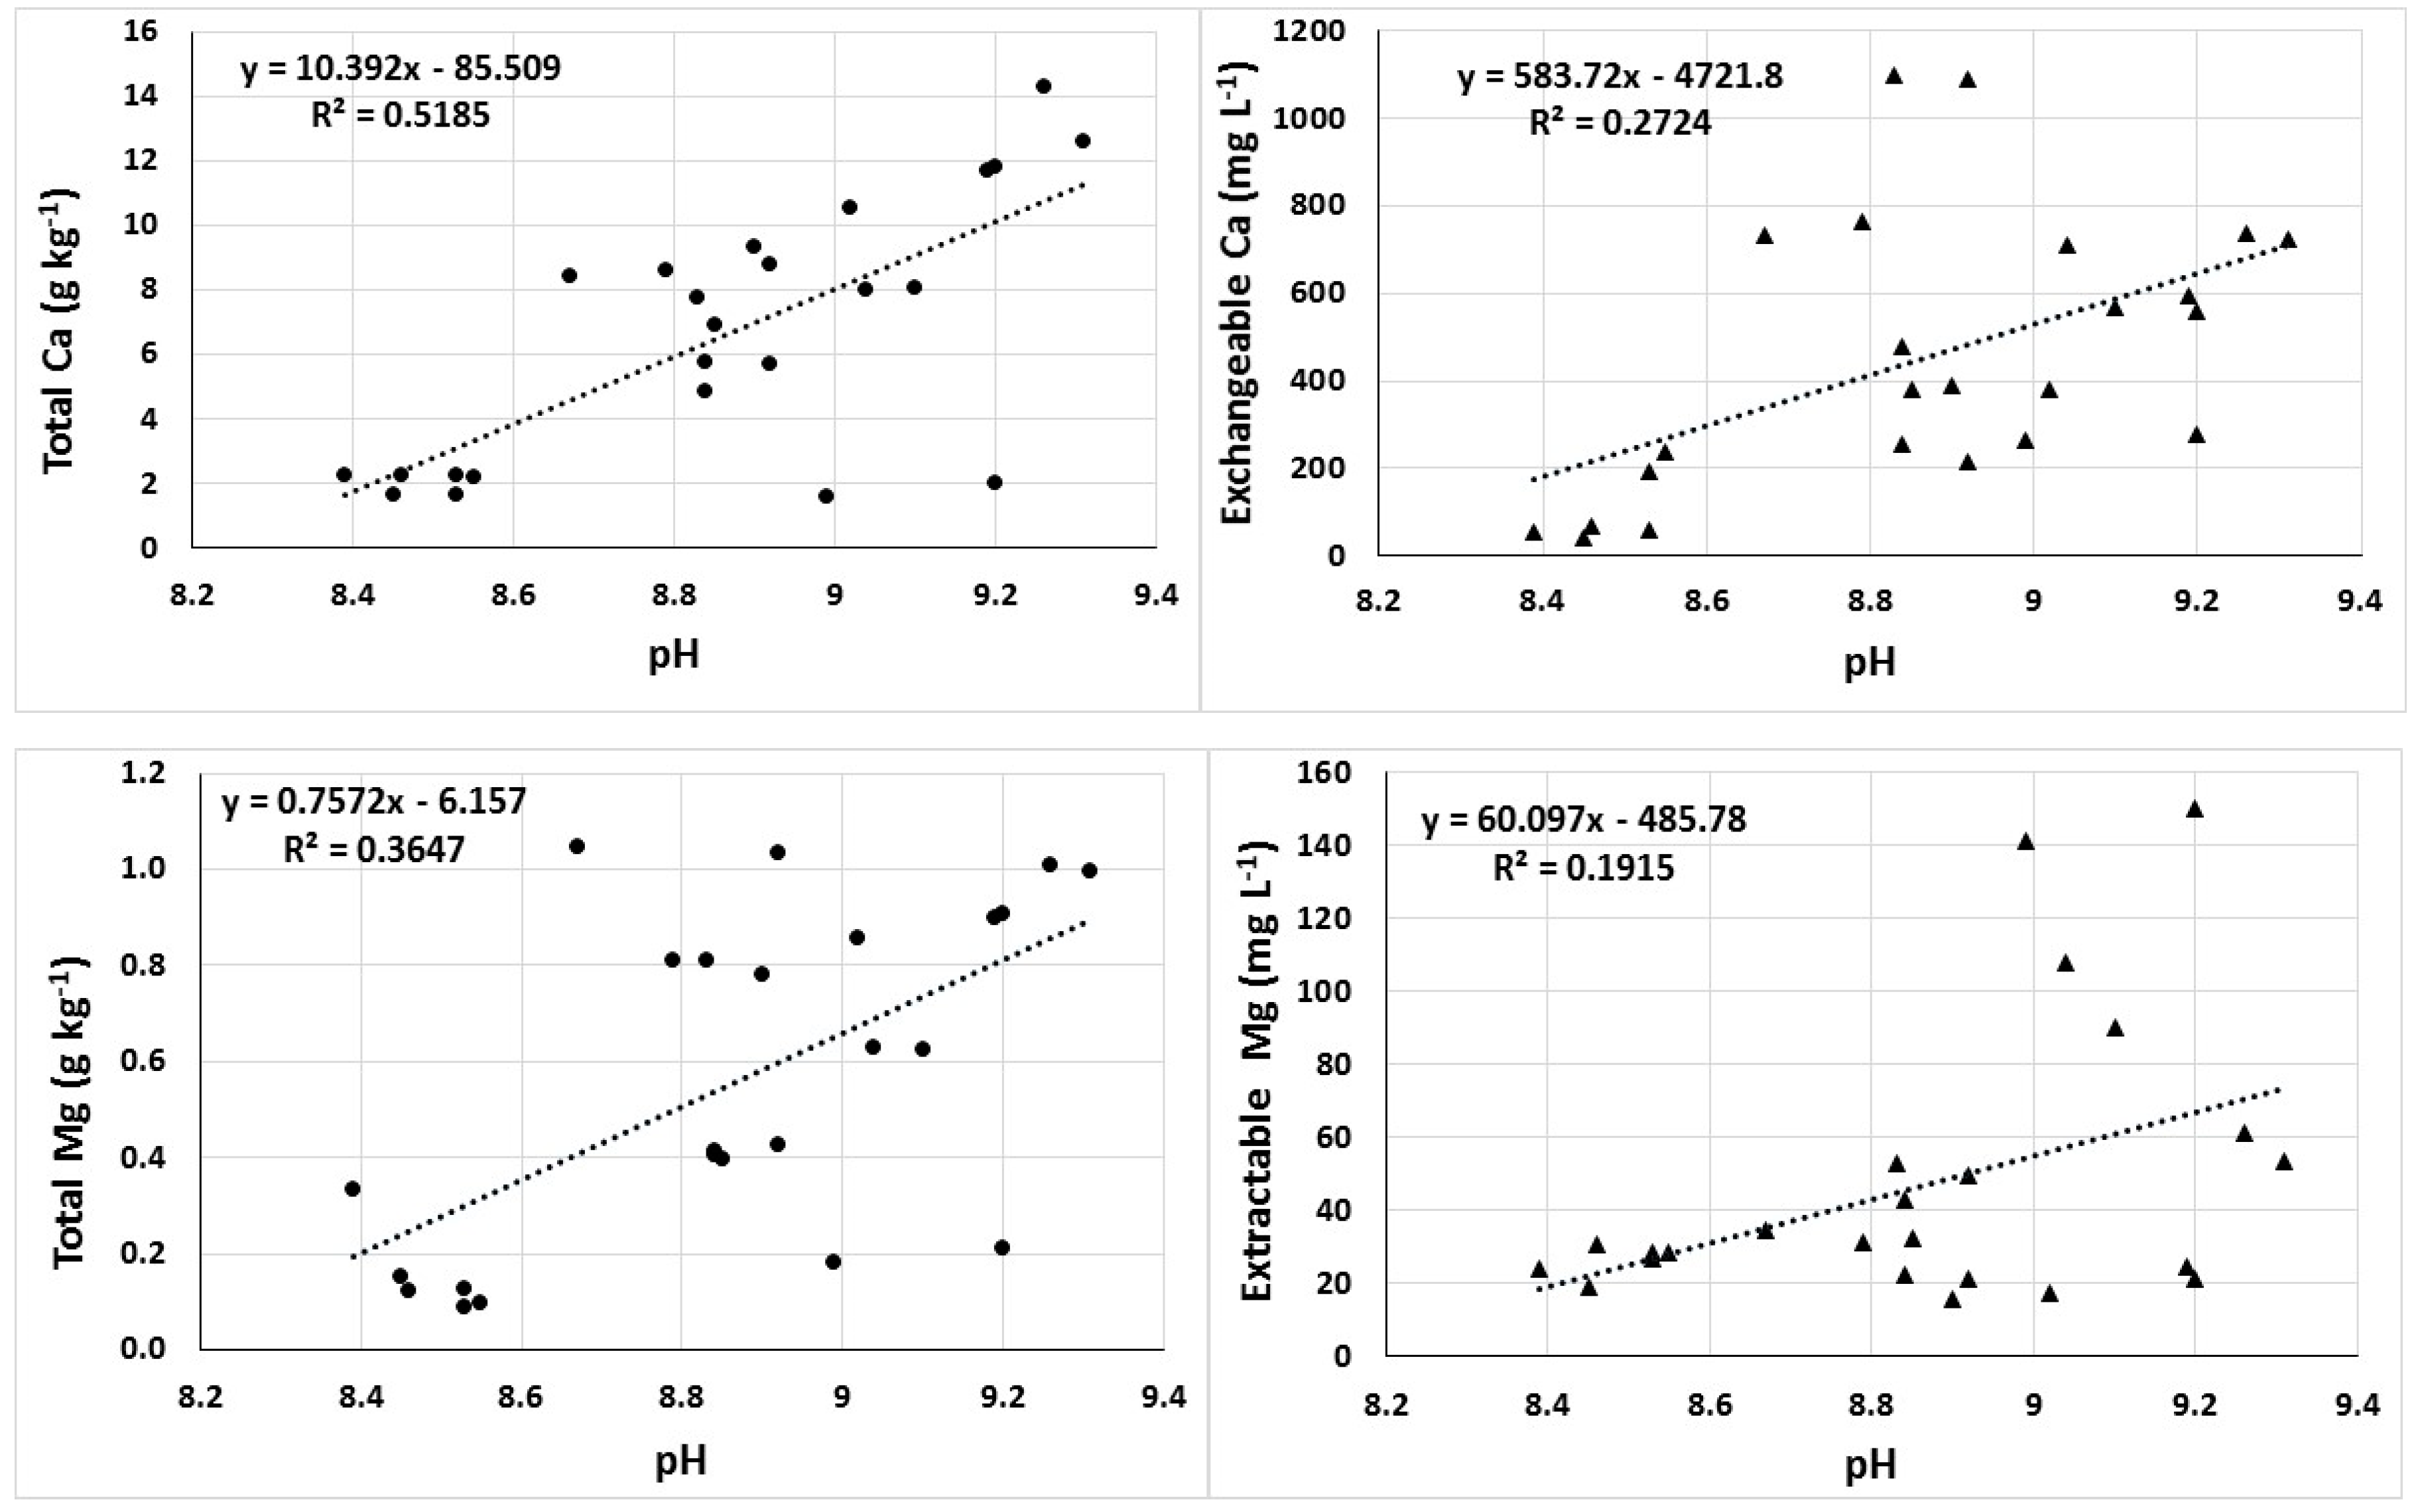
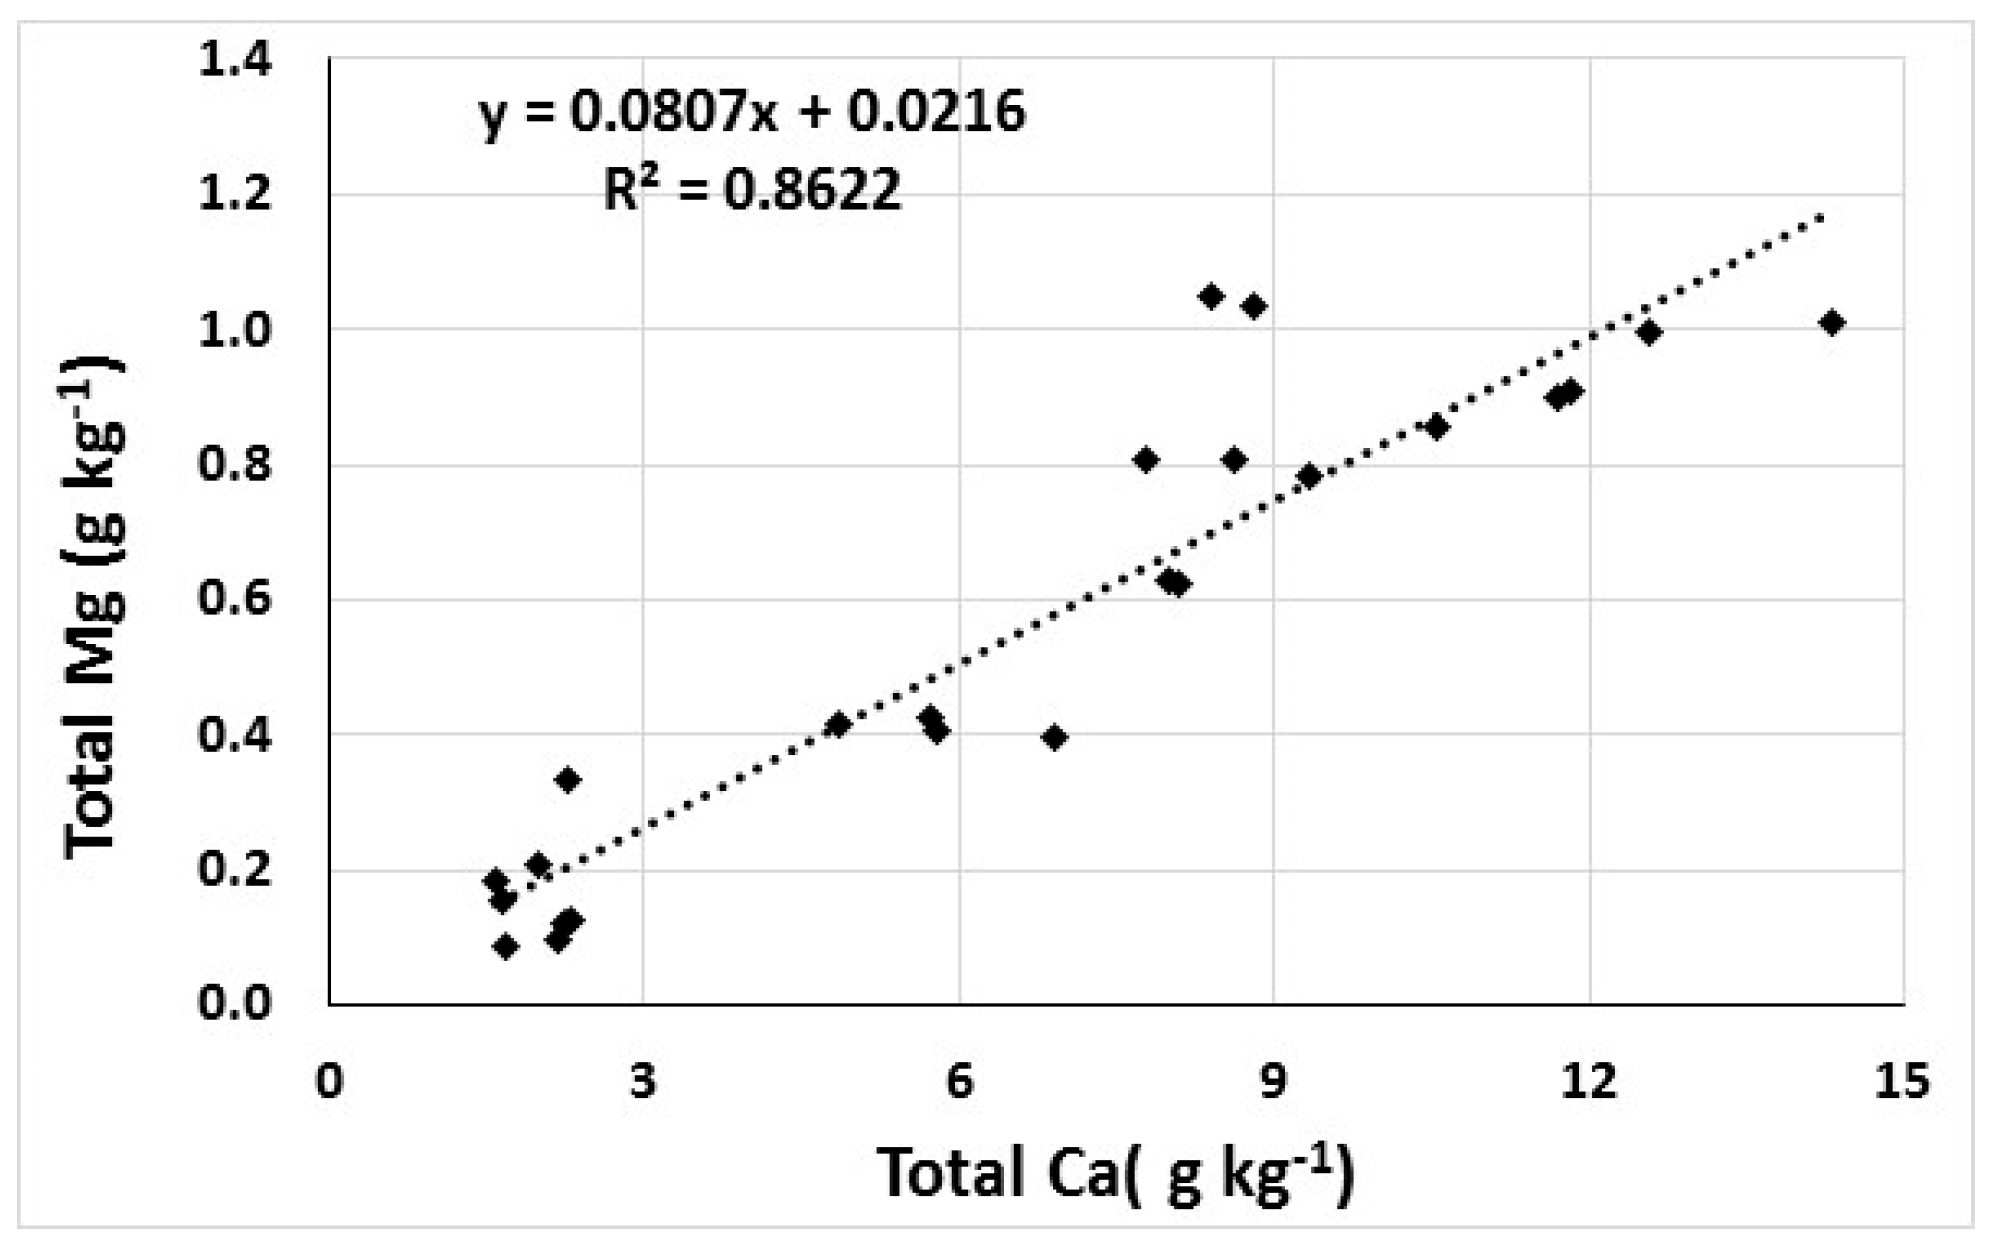
There was a clear significant trend of higher levels of Zn in the fine fraction for all four biochars, but the differences between 1–2 mm and 2–4 mm were not significant (Figure 5). Biochars derived by bamboo revealed the higher (4.72 mg L−1) Zn levels in the < 1 mm fraction. Manganese levels were particularly low in Biochar A and Biochar C, while both Biochar B and Biochar D revealed high (ranged from 18.82 to 20.85 mg L−1) levels of Mn in their fine fractions (Figure 5).
Higher levels of extractable Cu were found in the finer fractions of two biochars, A and D, those being the same biochars with higher levels of total Cu (Figure 2). There was no clear trend regarding the four biochars in the fractions regarding the Fe and B levels (Figure 5).

3.3. Correlations

The pH value was correlated with total Ca (r = 0.518; Figure 6), and with total Mg (r = 0.364; Figure 6), respectively. However, the correlation was poor with extractable Ca (r = 0.272; Figure 6) and extractable Mg (r = 0.191; Figure 6). There was a strong correlation between total K and total N (r = 0.870) at level of p ≤ 0.01 (Figure 7). There was a very strong correlation between total Ca and total Mg (r = 0.862) at level of p ≤ 0.001 (Figure 7), indicating when Ca is high or low, the Mg content would follow a similar pattern. There was a very strong correlation (p ≤ 0.001) between extractable Ca and total Ca (r = 0.711) and total Mg (r = 0.823, Figure 7). Moreover, there was a very strong correlation (p = 0.001) between extractable K and total Mg (r = 0.941). There was fairly a strong correlation (p = 0.001) between extractable Zn and extractable SO4 (r = 0.616), extractable Fe (r = 0.602), extractable Cu (r = 0.857), respectively. Additionally, there was a strong correlation (p ≤ 0.001) between extractable Mn and extractable Zn (r = 0.795), and a fairly good correlation (r = 0.640) between extractable Mn and extractable Cu.

4. Discussion

It is well known that feedstock, pyrolysis temperature and residence time have a major effect on pH and nutrient content of a biochar [1,14,35]. We investigated four commercial biochars and found a high variation between them with regard to total nutrients. This variation can be partially explained on the basis of different processing conditions and differences in feedstock. However, due to the propriety nature of the materials used in the current study, exact information on processing and feedstocks are lacking. In the present study, the levels of total N, P and K were in the same range as previously reported [20,28,32,49]. Biochar A was an exception, having particularly high nutrient levels. The feedstock of this material was different from the other three, as it was based on paper fibre and cereal husk.
The finer fraction has higher levels of total macronutrients, and to a lesser extent, micronutrients, for the three-wood based biochar. The percentage of finer fraction of a biochar is of importance through the dependence of nutrients on the particle size. Regarding the biochars used in the present study, their particle sizes have been investigated previously; they have fine particles less than 1 mm in the range of 23% to 64% [30]. Biochar B in that study had 49.5% less than 1 mm. Other authors who investigated biochars derived from woody material, reported levels of less than 1 mm of 40%–81% [29], 21%–79% [37], 38%–73% [20] and 2%–98% [38]. It is most likely that the partial removal of the fine fraction (<1 mm) could make it suitable as a component of a growing media. This could be explained on the basis that different particle size of feedstock may lead to differential heating during pyrolysis and the finer fraction could have been more carbonized than the coarser fraction. Kloss et al. [35] have shown that the levels of cations Ca, Mg and K increase with greater carbonization. They, however, found that total N levels fall as carbonization increases. However, other authors have found that N levels can increase with carbonization [41,50,51,52].
He et al. [41] studied the chemical properties of biochar fractions of 2–5 mm, 1–2 mm and 0.5–1 mm but also seven fractions below 0.5 mm made from pine wood. In the three fractions, which were somewhat similar to our fractions, they found an increase in total N, Ca and Mg contents in the finer fraction. The authors argued that longitudinal and transverse heterogeneity of biochar and the dominant cleavage during the preparation process may be responsible for the significant differences in properties initiated by particle size. In our investigation, N, P and K of Biochar A derived from cereal husk and paper fibre, were higher in the coarser fraction.
Generally, all the extractable nutrients were higher in the fine fraction. The fact that the availability of nutrients based on extraction with BaCl2/DTPA increases as the fraction size decreases can be explained to some extent, as it is understandable, due to the greater surface area of the fine material that allows the extractant to extract more nutrients. It may also be due to higher bulk density.
In the present study, we showed that particle size of the same biochar can have different levels on pH and total and extractable macro and micro nutrients in the different fractions (i.e., higher in the fine fraction) in the context of its use as a component of a growing media. This would ultimately affect the acidity and macro and some micronutrient content and availability of peat-biochar growing media due to fact that each fraction, particularly the fine fraction has significantly different levels of nutrients and acidity.
Numerous studies have been published showing the beneficial effects on crops due to the addition of biochar to peat; however, only in a limited number of studies has the particle size of the biochar been presented. There have been a few publications that showed the particle size of the biochar has a marked effect on physical properties of the growing media [27,32,38]. Our results indicate that in the use of biochars in growing media, particle size should be taken into serious consideration not only for physical properties, but just as importantly, chemical properties. This information should be essential when formulating nutrients/lime addition and subsequent nutrient management during cropping.
The higher nutrient availability from the four biochars in fine fractions as found in the present study, are in agreement with previous reports [39]. However, Angst and Sohi [39] examined the effect of particle size in context of a soil application of biochar, which is different from the growing media conditions. They found that the availability and the release of limited number of nutrients, namely, magnesium, potassium and phosphorus, were affected by particle size with the fine fraction material showing greater water-soluble contents of these nutrients, and better release. The fraction sizes they looked at were smaller than ours, as they studied fractions of 0.15 μm to 0.60 μm, 0.60 μm to 1.8 mm, 1.8 mm to 4 mm and > 4 mm. For K and Mg, the differences between the finer fractions were relatively small but the differences were greater between the fine fractions, that was, < 4 mm, and > 4 mm. For P the differences in the finer fraction were even less and the difference between the finer fraction and > 4 mm was less than for K and Mg [39]. The extraction solution might affect the nutrients extracted derived by different fractions of biochar. Angst and Sohi [39] carried out six extractions and for K there was little change but for Mg and P the amount and the difference between the fractions increased. They used water as an extractant, unlike our extractant which had a cation in it. One is aware that biochar has a high cation exchange capacity and also has the ability to bind nitrate nitrogen, and as such a stronger extraction, which includes a cation and contains DTPA, which may give a bigger difference between the fractions and perhaps better picture on plant availability in growing media. In any case the extractant used here has been strongly correlated the plant uptake of some macro nutrients and micronutrients in a growing media situation [30,43].
Due to the nature of biochar coming from woodchips, thereby the need for crushing and relatively easy break down of particles, variation in particle size is likely to occur between batches, and this could possibly have reflected variation in physical and chemical properties of growing media, when biochar is added to peat. Our findings point to the need to be vigilant about particle size for each batch. However, the use of dolomitic lime was added not only to neutralize the acidity of peat but also to supply essential nutrients such as calcium and magnesium. The pH values in biochar can vary according to the pyrolysis temperature, as biochars produced from sewage sludge at low temperatures (300 and 400 °C) were acidic, whereas at high temperatures (500 and 600 °C), they were alkaline [53].
The levels for the Cu, Zn and Mn were in the same range as found by Altland and Locke [28] and Bedussi et al. [32]. The average extractable K, Ca and Mg as a percentage (%) of the total K, Ca and Mg for Biochar A, Biochar B, Biochar C and Biochar D were as follows: for K—Approximately 18%, 34%, 31% and 48%, respectively; for Ca—24%,16%,16% and 19%, respectively; and for Mg—14%, 9%, 11% and 28%, respectively. Angst and Sohi [39] found greater water extractability of K compared to Mg, probably reflecting the feedstock.
It is well known that most biochars have high pH-values [31], and peats have very low pH-values, ranging from 3 to 4 [54]. Therefore, peat requires additional lime, e.g., in form of a dolomitic lime, to adjust the pH to values to around 5.5, while other substrates, e.g., wood fibres, do not need it [55]. A number of researchers suggested that biochars could be used to replace lime application [30,34]. However, surprisingly, biochar-peat blends can contain up to 80% biochar without raising the pH above 7 [34]. Unfortunately, these studies do not give any information on particle size; one can surmise it was a coarse material. Zaccheo et al. [33] reported that particle size can have an effect in increasing the pH of growing medium. Furthermore, the same authors found that the finer fraction, 0–3.3 mm, was more effective at raising the pH of a peat-biochar mixture [33]. This is in agreement with our findings, as the finer fraction had a higher pH and a higher content on Ca and Mg. However, in the same study of Zaccheo et al. [33], the premise that dolomitic lime or ordinary lime is added not only to increase the pH but also supply Ca and Mg, which are essential plant nutrients with very low levels in peat, was not taken into consideration [32]. In our study, despite the minor differences in pH, the levels of extractable Ca varied enormously between Biochar A with very high extractable Ca and Biochar B with very low extractable Ca. In addition, most biochars contain high levels of K. This could depress and reduce Mg uptake by plants, due to the cation antagonism among them. Increased K-rates, varied from 4.61–5.39 g kg−1 by different biochars, were also reported by Gasco et al. [31], being in agreement with the findings of the present study.
Although generally there is good relationship between pH and total calcium and magnesium content, in our case the relationship would not be good enough to predict Ca and Mg levels. This is related to the poorer relationship of pH and available and extractable Ca and Mg content in biochars. The example of a good relationship or otherwise between Ca and Mg is important, as in peat dolomitic lime is added not only to adjust pH but to supply Ca and Mg. Extractable levels of Ca are generally very low in peat. The good relationship found in our study indicates that biochar is a similar material to dolomitic lime rather than calcitic lime. The good relationship between extractable Ca and total Ca gives confidence on the supply of Ca, whereas a poor relationship would invoke doubt, either from total Ca or extractable Ca: extractable Ca gives an indication of short term availability, while total Ca gives an indication of long term availability. P levels are too low to have any significance as a biochar is added at low rates with peat. However, K would be of importance. For instance, data from Bedussi et al. [32] shows that the finer biochar from poplar using pyrogasification has higher contents of total N, P, Ca, Mg and many micronutrients. The poplar biochar had higher contents of total Ca and Mg, despite having a lower pH. In addition, Bedussi et al. [32] measured water-soluble N, P and K which were higher for these nutrients, but found lower levels of Ca and no difference for Mg. Therefore, a blanket recommendation or a suggestion that biochar can replace lime in peat-based media needs serious rethinking. We feel it is essential that the total Ca and total Mg and available Ca and available Mg, should be analysed in biochar and taken into account when recommending lime application rates if biochar has been added to peat. This is in agreement with our previous works. As the biochar component increases in a peat/biochar-mixtures, this is affecting nutrient levels in plants; for example, the levels of Mg content in a leaf dropped due to the antagonistic effect of K on Mg [30]. This is primarily due to the excessive level of K, which is a feature of most but not all biochars. Additionally, in our resent study, K, P and Cu accumulation and Mg deficiency in cabbage leaves were related to the biochar presence and feedstock [10]. In that study, the biochar’s feedstock, rate and the addition of fertilizers could affect the cabbage seedling performance.

5. Conclusions

The results of the present study have shown that within the same batch of biochar, total macronutrient and micronutrient levels are different in different fraction sizes. One can clearly state from our data that the use of a biochar when added to peat and when it is considered as a substitute for lime, due to its high pH, may not be valid in many cases, as Ca levels in biochars do not always equate to a pH value. Extractable Ca and perhaps total Ca in biochars need to be considered when advising biochar rates and lime rates to peat. Moreover, the particle size of biochar is very important regarding electrical conductivity and nutrient availability, especially K. This has far reaching consequences regarding nutrient imbalances in growing media and in formulating a base dressing and a liquid feeding programme. To our knowledge, this is the first time that it has been reported for biochar in context of growing media. The variation in total nutrients in biochar fractions of the same biochar was an unexpected result for a growing media. Our recommendation is to partially take out the biochar fraction < 1 mm if the EC levels and nutrients are particularly high and use it for other purposes. The reduction of EC and extractable K would, thus, make the biochar suitable as a component of a growing medium.

Author Contributions

Conceptualization, M.P. and N.T.; data curation, A.C., M.P. and N.T.; formal analysis, M.P., N.M. and A.C.; funding acquisition, A.K. and N.T.; investigation, M.P., and N.T.; methodology, M.P., A.C. and N.T.; project administration, M.P. and N.T.; resources, N.M. and A.C.; software, A.C. and N.T.; supervision, M.P. and N.T.; validation, M.P., N.S.G. and N.T.; visualization, A.C.; writing—original draft, M.P. and A.C.; writing—review and editing, M.P., N.S.G. and N.T. All authors have read and agreed to the published version of the manuscript.

Funding

This research was funded by Bord na Mona Horticulture Ltd and Cyprus University of Technology under the project OPTIBIOCHAR and Cyprus University of Technology Open Access Author Fund.

Acknowledgments

The authors are grateful to the project OPTIBIOCHAR that has been developed under the Cooperation Programme Cyprus-Ireland, co-funded by the Bord na Mona LtD and Cyprus University of Technology.

Conflicts of Interest

The authors declare no conflict of interest.

Appendix A

Figure A1. Biochar (A, B, C, D) particle size illustration.
Agronomy 10 00010 g0a1

References

  1. Rehrah, D.; Bansode, R.R.; Hassan, O.; Ahmedna, M. Physico-chemical characterization of biochars from solid municipal waste for use in soil amendment. J. Anal. Appl. Pyrolysis 2016, 118, 42–53. [Google Scholar] [CrossRef]
  2. Xu, C.Y.; Hosseini-Bai, S.; Hao, Y.; Rachaputi, R.C.N.; Wang, H.; Xu, Z.; Wallace, H. Effect of biochar amendment on yield and photosynthesis of peanut on two types of soils. Environ. Sci. Pollut. Res. 2015, 22, 6112–6125. [Google Scholar] [CrossRef] [PubMed]
  3. Kerré, B.; Willaert, B.; Cornelis, Y.; Smolders, E. Long-term presence of charcoal increases maize yield in Belgium due to increased soil water availability. Eur. J. Agron. 2017, 91, 10–15. [Google Scholar] [CrossRef]
  4. Gomez-Eyles, J.L.; Sizmur, T.; Collins, C.D.; Hodson, M.E. Effects of biochar and the earthworm Eisenia fetida on the bioavailability of polycyclic aromatic hydrocarbons and potentially toxic elements. Environ. Pollut. 2011, 159, 616–622. [Google Scholar] [CrossRef] [PubMed]
  5. Han, Y.; Cao, X.; Ouyang, X.; Sohi, S.P.; Chen, J. Adsorption kinetics of magnetic biochar derived from peanut hull on removal of Cr (VI) from aqueous solution: Effects of production conditions and particle size. Chemosphere 2016, 145, 336–341. [Google Scholar] [CrossRef]
  6. Komnitsas, K.; Zaharaki, D.; Pyliotis, I.; Vamvuka, D.; Bartzas, G. Assessment of pistachio shell biochar quality and its potential for adsorption of heavy metals. Waste Biomass Valoriz. 2015, 6, 805–816. [Google Scholar] [CrossRef]
  7. Spokas, K.A.; Koskinen, W.C.; Baker, J.M.; Reicosky, D.C. Impacts of woodchip biochar additions on greenhouse gas production and sorption/degradation of two herbicides in a Minnesota soil. Chemosphere 2009, 77, 574–581. [Google Scholar] [CrossRef]
  8. Vaccari, F.P.; Baronti, S.; Lugato, E.; Genesio, L.; Castaldi, S.; Fornasier, F.; Miglietta, F. Biochar as a strategy to sequester carbon and increase yield in durum wheat. Eur. J. Agron. 2011, 34, 231–238. [Google Scholar] [CrossRef]
  9. Kim, H.S.; Kim, K.R.; Yang, J.E.; Ok, Y.S.; Kim, W., II; Kunhikrishnan, A.; Kim, K.H. Amelioration of horticultural growing media properties through rice hull biochar incorporation. Waste Biomass Valoriz. 2017, 8, 483–492. [Google Scholar] [CrossRef]
  10. Chrysargyris, A.; Prasad, M.; Kavanagh, A.; Tzortzakis, N. Biochar type and ratio as a peat additive/partial peat replacement in growing media for cabbage seedling production. Agronomy 2019, 9, 693. [Google Scholar] [CrossRef] [Green Version]
  11. Álvarez, J.M.; Pasian, C.; Lal, R.; López, R.; Díaz, M.J.; Fernández, M. Morpho-physiological plant quality when biochar and vermicompost are used as growing media replacement in urban horticulture. Urban For. Urban Green. 2018, 34, 175–180. [Google Scholar] [CrossRef]
  12. Hilioti, Z.; Michailof, C.M.; Valasiadis, D.; Iliopoulou, E.F.; Koidou, V.; Lappas, A.A. Characterization of castor plant-derived biochars and their effects as soil amendments on seedlings. Biomass Bioenergy 2017, 105, 96–106. [Google Scholar] [CrossRef]
  13. Huang, L.; Gu, M. Effects of biochar on container substrate properties and growth of plants—A review. Horticulturae 2019, 5, 14. [Google Scholar] [CrossRef] [Green Version]
  14. Kaudal, B.B.; Chen, D.; Madhavan, D.B.; Downie, A.; Weatherley, A. Pyrolysis of urban waste streams: Their potential use as horticultural media. J. Anal. Appl. Pyrolysis 2015, 112, 105–112. [Google Scholar] [CrossRef]
  15. Gruda, N.S. Increasing sustainability of growing media constituents and stand-alone substrates in soilless culture systems. Agronomy 2019, 9, 298. [Google Scholar] [CrossRef] [Green Version]
  16. Blok, C.; Van Der Salm, C.; Hofland-Zijlstra, J.; Streminska, M.; Eveleens, B.; Regelink, I.; Fryda, L.; Visser, R. Biochar for horticultural rooting media improvement: Evaluation of Biochar from gasification and slow pyrolysis. Agronomy 2017, 7, 6. [Google Scholar] [CrossRef] [Green Version]
  17. Alvarez, J.M.; Pasian, C.; Lal, R.; Lopez, R.; Fernandez, M. Vermicompost and Biochar as growing media replacement for ornamental plant production. J. Appl. Hortic. 2017, 19, 205–214. [Google Scholar]
  18. Dispenza, V.; De Pasquale, C.; Fascella, G.; Mammano, M.M.; Alonzo, G. Use of biochar as peat substitute for growing substrates of Euphorbia × lomi potted plants. Span. J. Agric. Res. 2016, 14. [Google Scholar] [CrossRef] [Green Version]
  19. Fryda, L.; Visser, R.; Schmidt, J. Biochar replaces peat in horticulture: Environmental impact assessment of combined biochar & bioenergy production. Detritus 2019, 5, 132–149. [Google Scholar]
  20. Kaudal, B.B.; Chen, D.; Madhavan, D.B.; Downie, A.; Weatherley, A. An examination of physical and chemical properties of urban biochar for use as growing media substrate. Biomass Bioenergy 2016, 84, 49–58. [Google Scholar] [CrossRef]
  21. Margenot, A.J.; Griffin, D.E.; Alves, B.S.Q.; Rippner, D.A.; Li, C.; Parikh, S.J. Substitution of peat moss with softwood biochar for soil-free marigold growth. Ind. Crops Prod. 2018, 112, 160–169. [Google Scholar] [CrossRef] [Green Version]
  22. Gruda, N. Current and future perspective of growing media in Europe. Acta Hortic. 2012, 960, 37–43. [Google Scholar] [CrossRef]
  23. Schmilewski, G. The role of peat in assuring the quality of growing media. Mires Peat 2008, 3, 1–8. [Google Scholar]
  24. Prins, F. Carbon storage in peat bog areas in Europe. In Proceedings of the Workshop on CO2 Sequestration & Biodiversity, Bratislava, Slovakia, 9–10 November 2009. [Google Scholar]
  25. Armstrong, H.; Aendekerk, T.G.L. International Substrate Manual: Analysis, Characteristics, Recommendations; International Business Information; Elsevier: Amsterdam, The Netherlands, 2000; ISBN 9054391022. [Google Scholar]
  26. Gruda, N.; Bisbis, M.; Tanny, J. Impacts of protected vegetable cultivation on climate change and adaptation strategies for cleaner production—A review. J. Clean. Prod. 2019, 225, 324–339. [Google Scholar] [CrossRef]
  27. Vaughn, S.F.; Kenar, J.A.; Eller, F.J.; Moser, B.R.; Jackson, M.A.; Peterson, S.C. Physical and chemical characterization of biochars produced from coppiced wood of thirteen tree species for use in horticultural substrates. Ind. Crops Prod. 2015, 66, 44–51. [Google Scholar] [CrossRef]
  28. Altland, J.E.; Locke, J.C. Effect of biochar type on macronutrient retention and release from soilless substrate. HortScience 2013, 48, 1397–1402. [Google Scholar] [CrossRef] [Green Version]
  29. Solaiman, Z.M.; Murphy, D.V.; Abbott, L.K. Biochars influence seed germination and early growth of seedlings. Plant Soil 2012, 353, 273–287. [Google Scholar] [CrossRef]
  30. Prasad, M.; Tzortzakis, N.; McDaniel, N. Chemical characterization of biochar and assessment of the nutrient dynamics by means of preliminary plant growth tests. J. Environ. Manag. 2018, 216, 89–95. [Google Scholar] [CrossRef]
  31. Gascó, G.; Álvarez, M.L.; Paz-Ferreiro, J.; Miguel, G.S.; Méndez, A. Valorization of biochars from pinewood gasification and municipal solid waste torrefaction as peat substitutes. Environ. Sci. Pollut. Res. 2018, 25, 26461–26469. [Google Scholar] [CrossRef]
  32. Bedussi, F.; Zaccheo, P.; Crippa, L. Pattern of pore water nutrients in planted and non-planted soilless substrates as affected by the addition of biochars from wood gasification. Biol. Fertil. Soils 2015, 51, 625–635. [Google Scholar] [CrossRef]
  33. Zaccheo, P.; Crippa, L.; Cattivello, C. Liming power of different particle fractions of biochar. Acta Hortic. 2014, 1034, 363–368. [Google Scholar] [CrossRef]
  34. Steiner, C.; Harttung, T. Biochar as a growing media additive and peat substitute. Solid Earth 2014, 5, 995–999. [Google Scholar] [CrossRef]
  35. Kloss, S.; Zehetner, F.; Dellantonio, A.; Hamid, R.; Ottner, F.; Liedtke, V.; Schwanninger, M.; Gerzabek, M.H.; Soja, G. Characterization of slow pyrolysis biochars: Effects of feedstocks and pyrolysis temperature on biochar properties. J. Environ. Qual. 2012, 41, 990–1000. [Google Scholar] [CrossRef] [PubMed]
  36. Kern, J.; Tammeorg, P.; Shanskiy, M.; Sakrabani, R.; Knicker, H.; Kammann, C.; Tuhkanen, E.M.; Smidt, G.; Prasad, M.; Tiilikkala, K.; et al. Synergistic use of peat and charred material in growing media–an option to reduce the pressure on peatlands? J. Environ. Eng. Landsc. Manag. 2017, 25, 160–174. [Google Scholar] [CrossRef]
  37. Méndez, A.; Paz-Ferreiro, J.; Gil, E.; Gascó, G. The effect of paper sludge and biochar addition on brown peat and coir based growing media properties. Sci. Hortic. 2015, 193, 225–230. [Google Scholar] [CrossRef]
  38. Nemati, M.R.; Simard, F.; Fortin, J.P.; Beaudoin, J. Potential use of biochar in growing media. Vadose Zone J. 2015, 14, 1–8. [Google Scholar] [CrossRef]
  39. Angst, T.E.; Sohi, S.P. Establishing release dynamics for plant nutrients from biochar. GCB Bioenergy 2013, 5, 221–226. [Google Scholar] [CrossRef]
  40. Li, Y.; Liao, Y.; He, Y.; Xia, K.; Qiao, S.; Zhang, Q. Polycyclic aromatic hydrocarbons concentration in straw biochar with different particle size. Procedia Environ. Sci. 2016, 31, 91–97. [Google Scholar] [CrossRef] [Green Version]
  41. He, P.; Liu, Y.; Shao, L.; Zhang, H.; Lü, F. Particle size dependence of the physicochemical properties of biochar. Chemosphere 2018, 212, 385–392. [Google Scholar] [CrossRef]
  42. Prasad, M.; Maher, M.J. Physical and chemical properties of fractioned peat. Acta Hortic. 1993, 342, 257–263. [Google Scholar] [CrossRef]
  43. Alt, D.; Peters, I.; Fokken, H. Estimation of phosphorus availability in composts and compost/peat mixtures by different extraction methods. Commun. Soil Sci. Plant Anal. 1994, 25, 2063–2080. [Google Scholar] [CrossRef]
  44. EN 13651-2002. Soil Improvers and Growing Media—Extraction of Calcium Chloride/DTPA (CAT); British Standards Institution: London, UK, 2002. [Google Scholar]
  45. EN 13037-2002. Soil Improvers and Growing Media—Determination of pH; British Standards Institution: London, UK, 2002. [Google Scholar]
  46. EN 13038-2002. Soil Improvers and Growing Media—Determination of Electrical Conductivity; British Standards Institution: London, UK, 2002. [Google Scholar]
  47. Hu, X.; Ding, Z.; Zimmerman, A.R.; Wang, S.; Gao, B. Batch and column sorption of arsenic onto iron-impregnated biochar synthesized through hydrolysis. Water Res. 2015, 68, 206–216. [Google Scholar] [CrossRef] [PubMed]
  48. Chrysargyris, A.; Xylia, P.; Botsaris, G.; Tzortzakis, N. Antioxidant and antibacterial activities, mineral and essential oil composition of spearmint (Mentha spicata L.) affected by the potassium levels. Ind. Crops Prod. 2017, 103, 202–212. [Google Scholar] [CrossRef]
  49. Zainul, A.; Koyro, H.-W.; Huchzermeyer, B.; Gul, B.; Khan, M.A. Impact of a biochar or a compost-biochar mixture on water relation, nutrient uptake and photosynthesis of Phragmites karka. Pedosphere 2017. [Google Scholar] [CrossRef]
  50. Al-Wabel, M.I.; Al-Omran, A.; El-Naggar, A.H.; Nadeem, M.; Usman, A.R.A. Pyrolysis temperature induced changes in characteristics and chemical composition of biochar produced from conocarpus wastes. Bioresour. Technol. 2013, 131, 374–379. [Google Scholar] [CrossRef]
  51. Calvelo Pereira, R.; Kaal, J.; Camps Arbestain, M.; Pardo Lorenzo, R.; Aitkenhead, W.; Hedley, M.; Macías, F.; Hindmarsh, J.; Maciá-Agulló, J.A. Contribution to characterisation of biochar to estimate the labile fraction of carbon. Org. Geochem. 2011, 42, 1331–1342. [Google Scholar] [CrossRef]
  52. Gaskin, C.; Steiner, K.; Harris, K.C.; Das, B. Bibens Effect of Low-Temperature Pyrolysis Conditions on Biochar for Agricultural Use. Trans. ASABE 2008, 51, 2061–2069. [Google Scholar] [CrossRef]
  53. Hossain, M.K.; Strezov Vladimir, V.; Chan, K.Y.; Ziolkowski, A.; Nelson, P.F. Influence of pyrolysis temperature on production and nutrient properties of wastewater sludge biochar. J. Environ. Manag. 2011, 92, 223–228. [Google Scholar] [CrossRef]
  54. Gruda, N.; Caron, J.; Prasad, M.; Maher, M. Growing Media. In Encyclopedia of Soil Sciences; Lal, R., Ed.; CRC Press Taylor & Francis Group: Boca Raton, FL, USA, 2016; pp. 1053–1058. ISBN 9781498738903. [Google Scholar]
  55. Jackson, B.E.; Wright, R.D.; Gruda, N. Container medium pH in a pine tree substrate amended with peatmoss and dolomitic limestone affects plant growth. HortScience 2009, 44, 1983–1987. [Google Scholar] [CrossRef] [Green Version]
Figure 1. The effects of biochar (A, B, C and D) particle size on total macronutrients. Non-significant differences are indicated by ns, while significant differences (p < 0.05) among particle size for each Biochar are indicated by different Latin letters according to Duncan’s Multiple Range test. Error bars show standard errors-SE.
Agronomy 10 00010 g001aAgronomy 10 00010 g001b
Figure 2. The effects of biochar (A, B, C, D) particle size on total micronutrients. Non-significant differences are indicated by ns, while significant differences (p < 0.05) among particle size for each Biochar are indicated by different Latin letters according to Duncan’s Multiple Range test. Error bars show standard errors-SE.
Agronomy 10 00010 g002
Figure 3. The effects of biochar (A, B, C, D) particle size on the pH value. Significant differences (p < 0.05) among particle size for each Biochar are indicated by different Latin letters according to Duncan’s Multiple Range test. Error bars show standard errors-SE.
Agronomy 10 00010 g003
Figure 4. The effects of biochar (A, B, C, D) particle size on extractable macronutrients. Non-significant differences are indicated by ns, while significant differences (p < 0.05) among particle size for each Biochar are indicated by different Latin letters according to Duncan’s Multiple Range test. Error bars show standard errors-SE.
Agronomy 10 00010 g004
Figure 5. The effects of biochar (A, B, C, D) particle size on extractable micronutrients. Non-significant differences are indicated by ns, while significant differences (p < 0.05) among particle size for each Biochar are indicated by different Latin letters according to Duncan’s Multiple Range test. Error bars show standard errors-SE.
Agronomy 10 00010 g005
Figure 6. Correlation analysis of pH with total and extractable elements from four biochars over three fractions.
Agronomy 10 00010 g006
Figure 7. Correlation analysis of total elements from four biochars over three fractions.
Agronomy 10 00010 g007aAgronomy 10 00010 g007b
Table 1. Characterization of commercial biochars as is (pre-screening). Values are means ± standard errors of two measurements made on pH, electrical conductivity (µS cm−1) and minerals (mg L−1). Means values followed by the same letter do not differ significantly at p < 0.05.
FeedstockTrade NamepHEC (µS cm−1)NH4-N (mg L−1)NO3-N (mg L−1)N (mg L−1)P (mg L−1)K (mg L−1)BD 1 (g L−1)BET 2 (m3 g−1)Pore Vol 3 (cc g−2)Pore Vol 3 (cc mL−1)Pore Size 4 (Å)
Biochar ACereal husk/paper fibreDU9.56 ± 0.09 a653 ± 7.5 a1 ± 0.0 a1.0 ± 0.0 a2.0 ± 0.0 a8.5 ± 1.5 b891 ± 9.5 c23281.30.005920.0025429.04
Biochar BBamboon/a8.84 ± 0.08 b571 ± 12 b1 ± 0.0 a0.5 ± 0.5 a1.5 ± 0.5 a23.0 ± 2.0 a1158 ± 13.0 a2964.70.000210.0000617.90
Biochar CWood screeningsVerora9.54 ± 0.10 a410 ± 16 c1 ± 0.0 a1.0 ± 0.0 a2.0 ± 0.0 a10.5 ± 1.5 b659 ± 4.5 d25862.60.00450.001728.81
Biochar DForest woodCarbon Terra9.51 ± 0.04 a637 ± 5.5 a1 ± 0.0 a0.5 ± 0.5 a1.5 ± 0.5 a5.5 ± 1.5 b990 ± 7.0 b389243.00.1460.05624.03
1 Specific surface area. 2 Total pore volumes for pores with diameters less than 31917.2. 3 Average pore diameters. 4 Å at P/Po = 0.99940.

