1. Introduction
Rapid progress in seismic design has resulted in new reinforced concrete (RC) buildings with improved prospects of satisfactory behavior during an earthquake. However, innovations in seismic design methodologies have simultaneously created some doubts regarding the adequacy of the seismic behavior of existing RC buildings, as shown by the 1995 Kobe Earthquake in Japan, the 1999 Chi-Chi Earthquake in Taiwan, the 2008 Sichuan Earthquake in China, the 2010 Chile Earthquake, the 2011 Christchurch Earthquake in New Zealand, the 2012 Great East Japan Earthquake, and the 2013 Lushan Earthquake in China.
Over the last two decades, rehabilitation procedures have been promoted, and many seismic strengthening techniques have been developed to improve the seismic performance of existing concrete buildings, especially their columns [
1,
2,
3,
4,
5]. Conventional methods for seismic retrofitting of concrete columns include reinforcement with steel plates or steel frame braces, as well as cross-sectional increments and in-filled walls. However, these methods have some disadvantages, such as the increase in mass and the requirement for precise construction. Others methods, such as fiber-reinforced polymer (FRP) sheets for seismic strengthening of concrete columns using new light-weight composite materials, including carbon fiber and glass fiber, have excellent durability and performance and have been used widely to overcome the shortcomings of conventional seismic strengthening methods [
6,
7,
8]. Nonetheless, the FRP-sheet reinforcement method still has some drawbacks, such as the need for prior surface treatment, problems at joints, and relatively expensive material costs. Recently, to overcome the weakness of FRP, a new class of cement-based composites was introduced in the civil engineering field [
9,
10,
11,
12,
13,
14,
15,
16]. Thus, there is a continuing need for the development of new strengthening techniques with better workability and reduced costs for concrete columns.
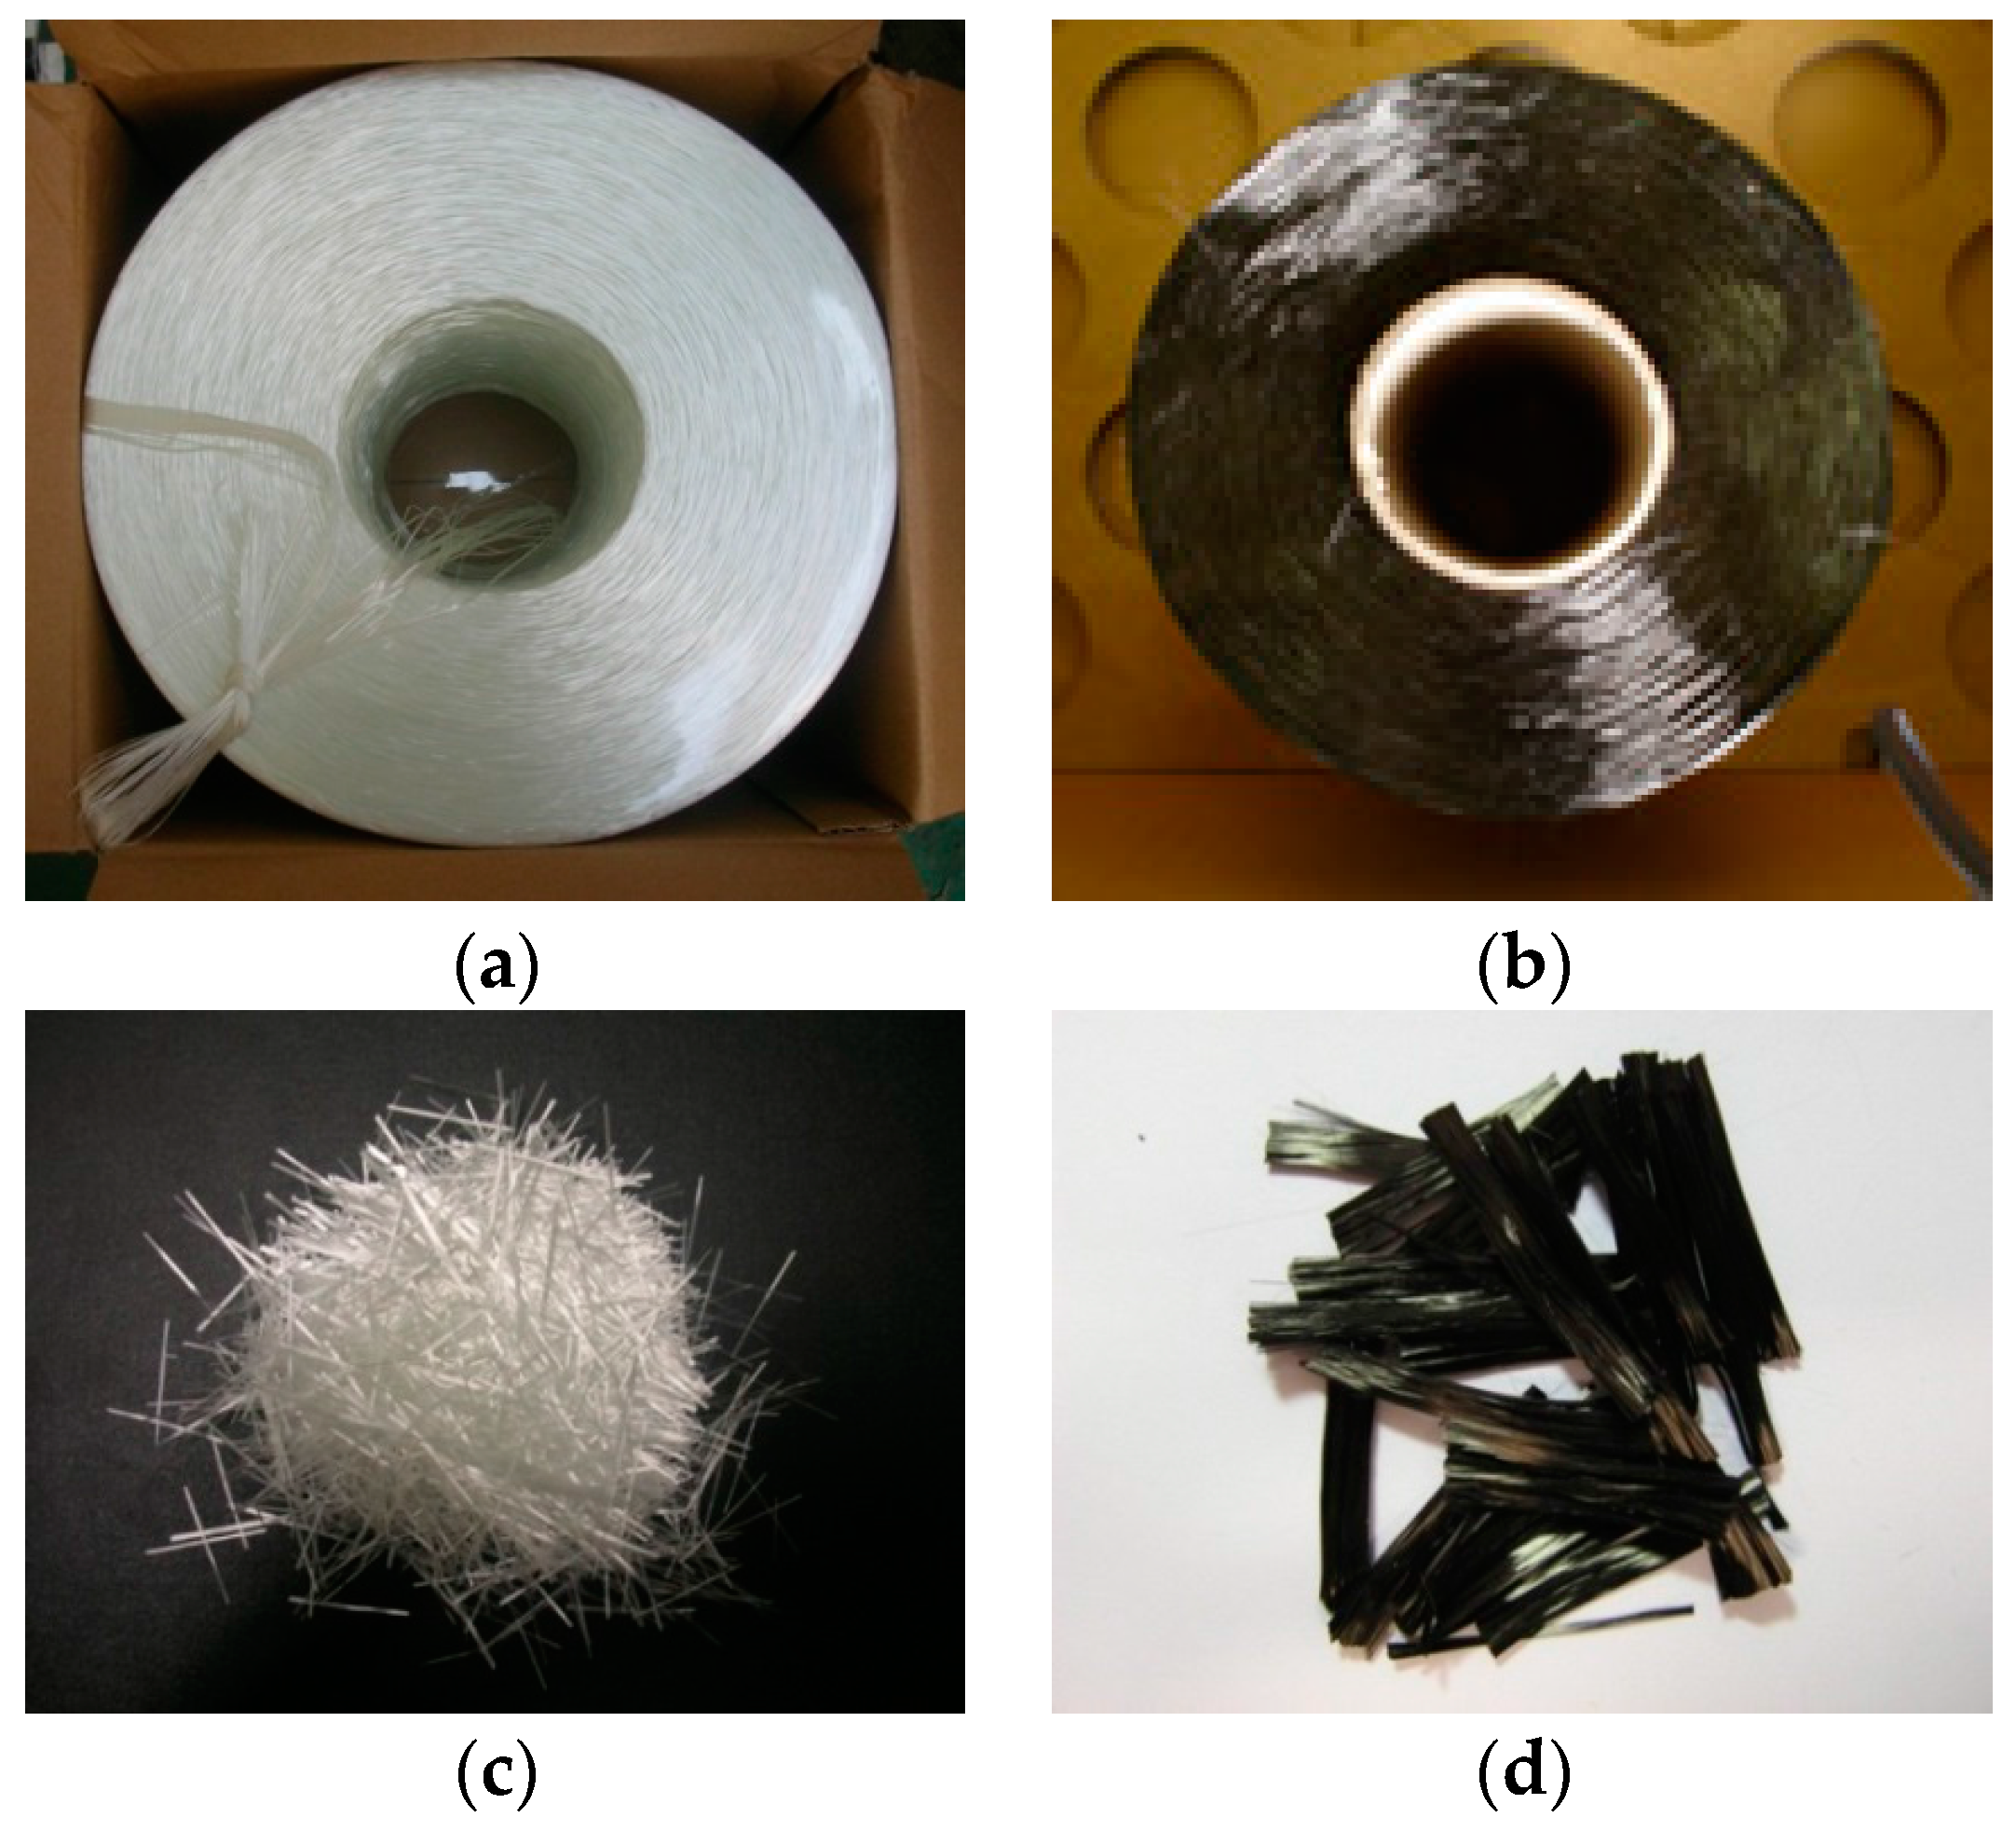
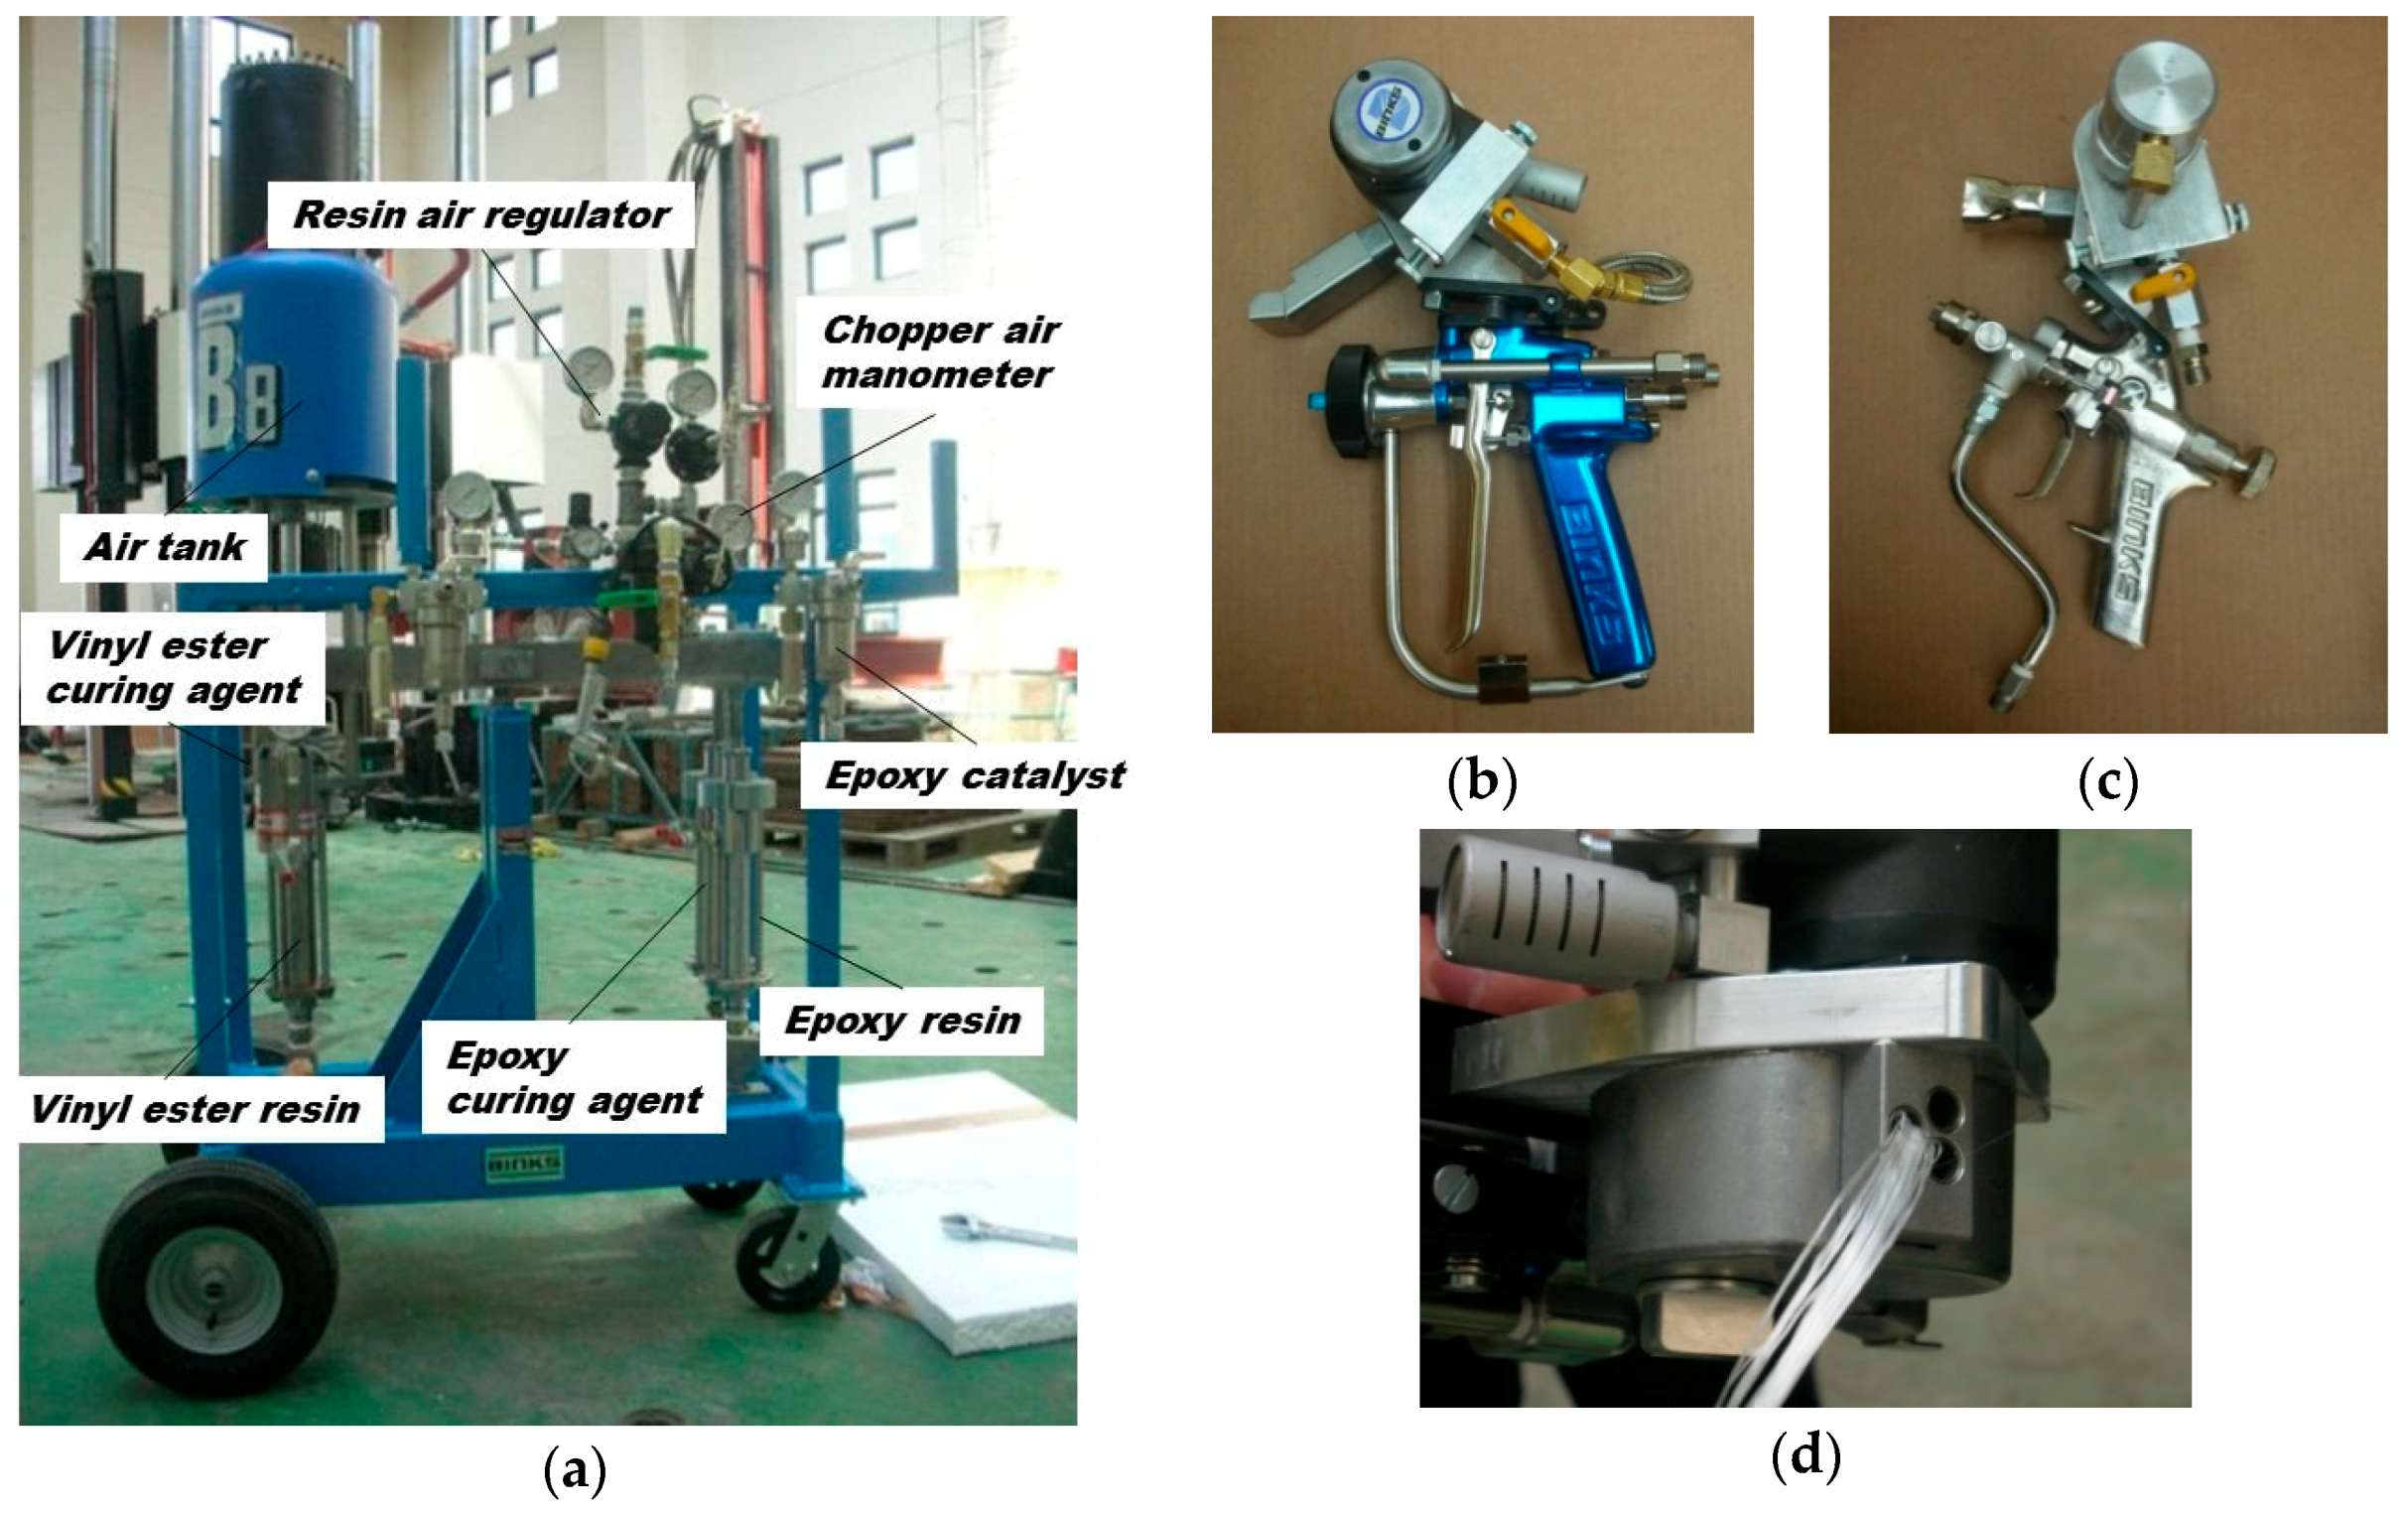
In the current research, the structural effectiveness of a new type for seismic strengthening of concrete columns with FRP is investigated. The proposed technique is a sprayed FRP system, achieved by mixing chopped glass and carbon fibers with epoxy and vinyl ester resin in the open air and randomly spraying the resulting mixture onto the uneven surface of the concrete columns. There has been little research on sprayed FRP [
17,
18,
19,
20,
21,
22,
23]. Furthermore, the use of sprayed FRP for seismic strengthening on columns using epoxy or vinyl ester resins has not been fully investigated.
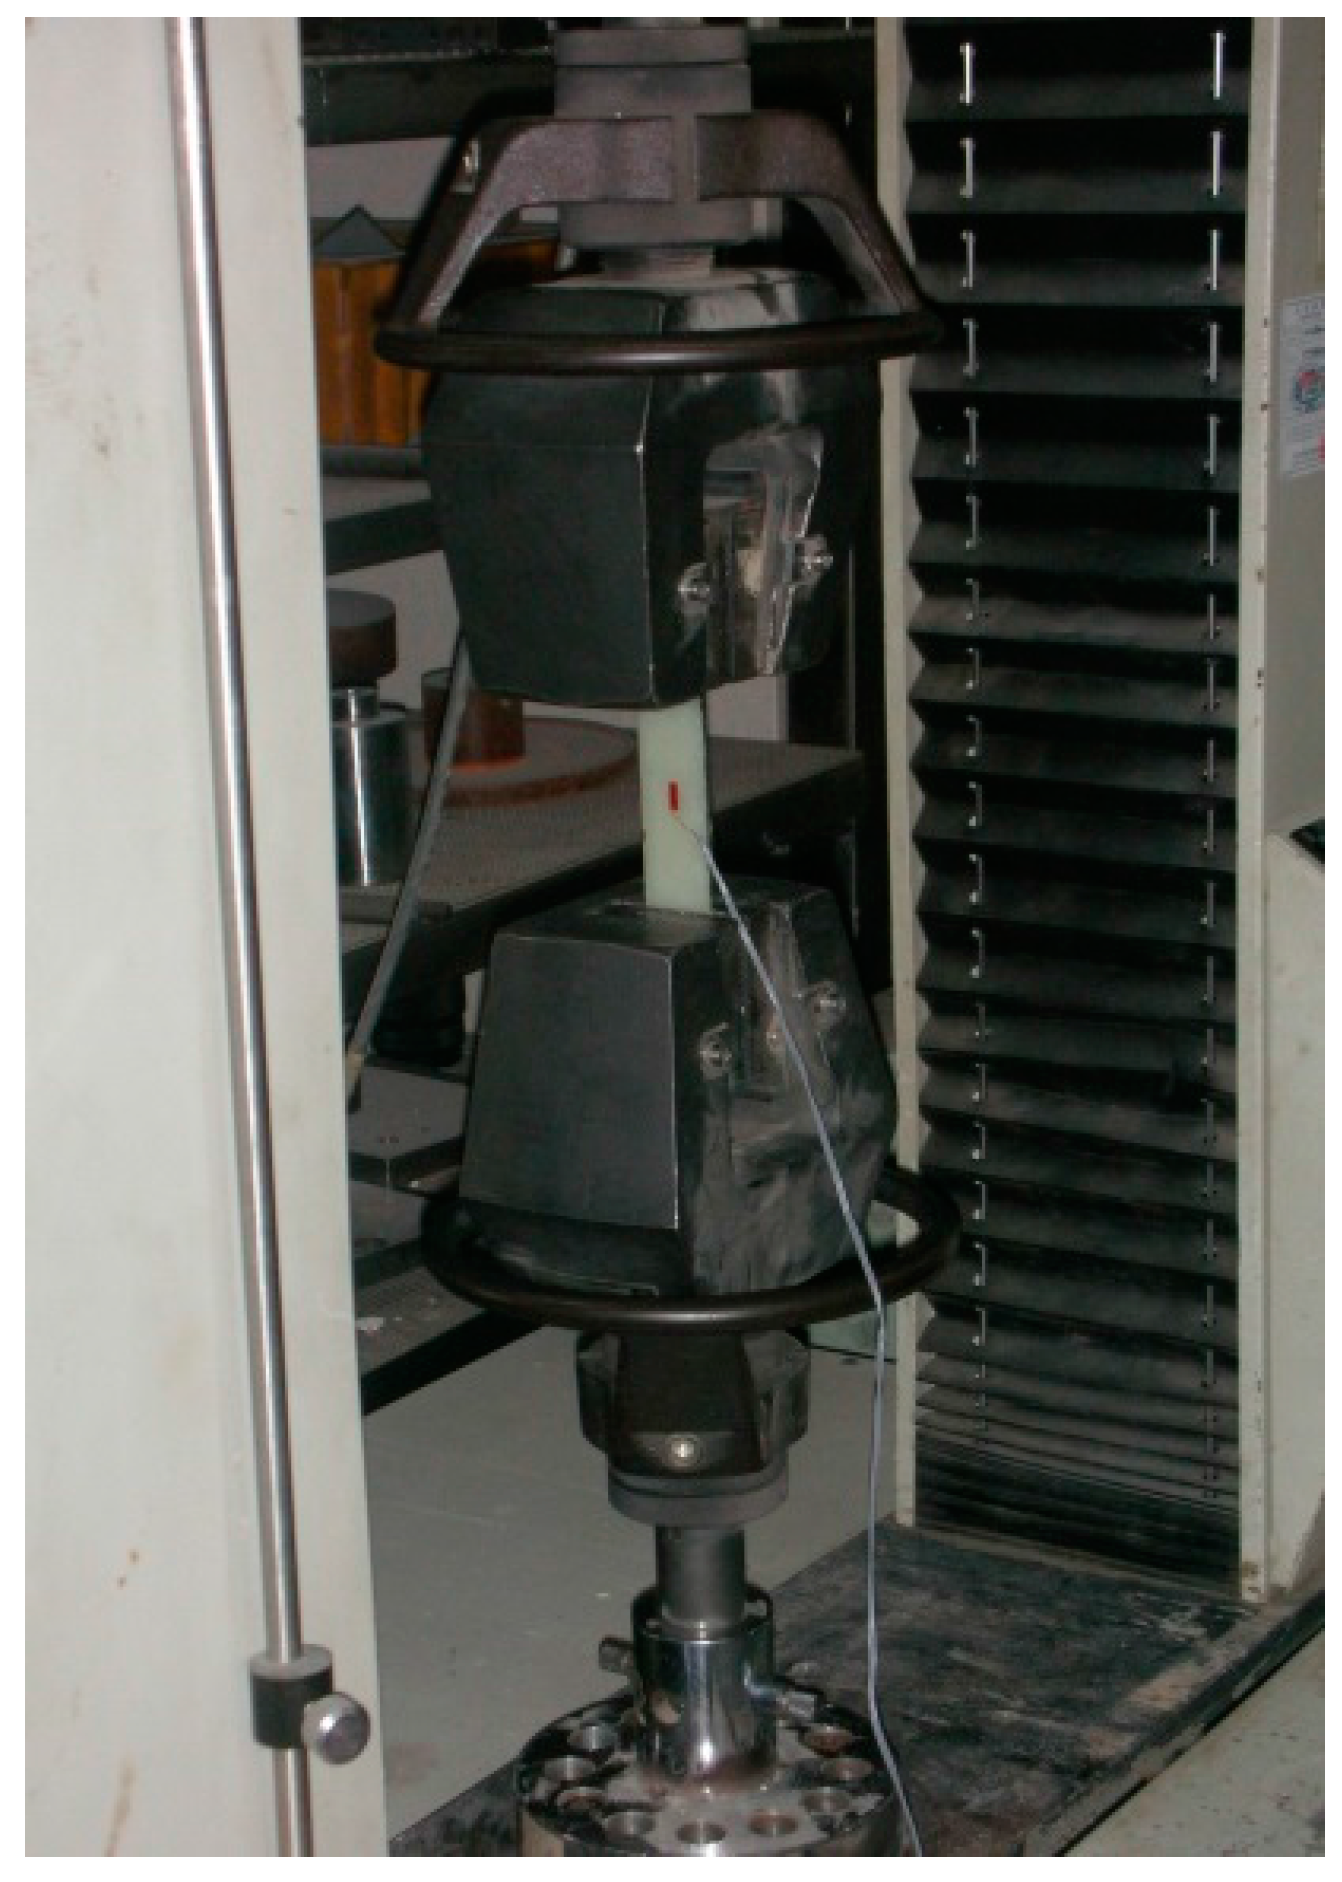
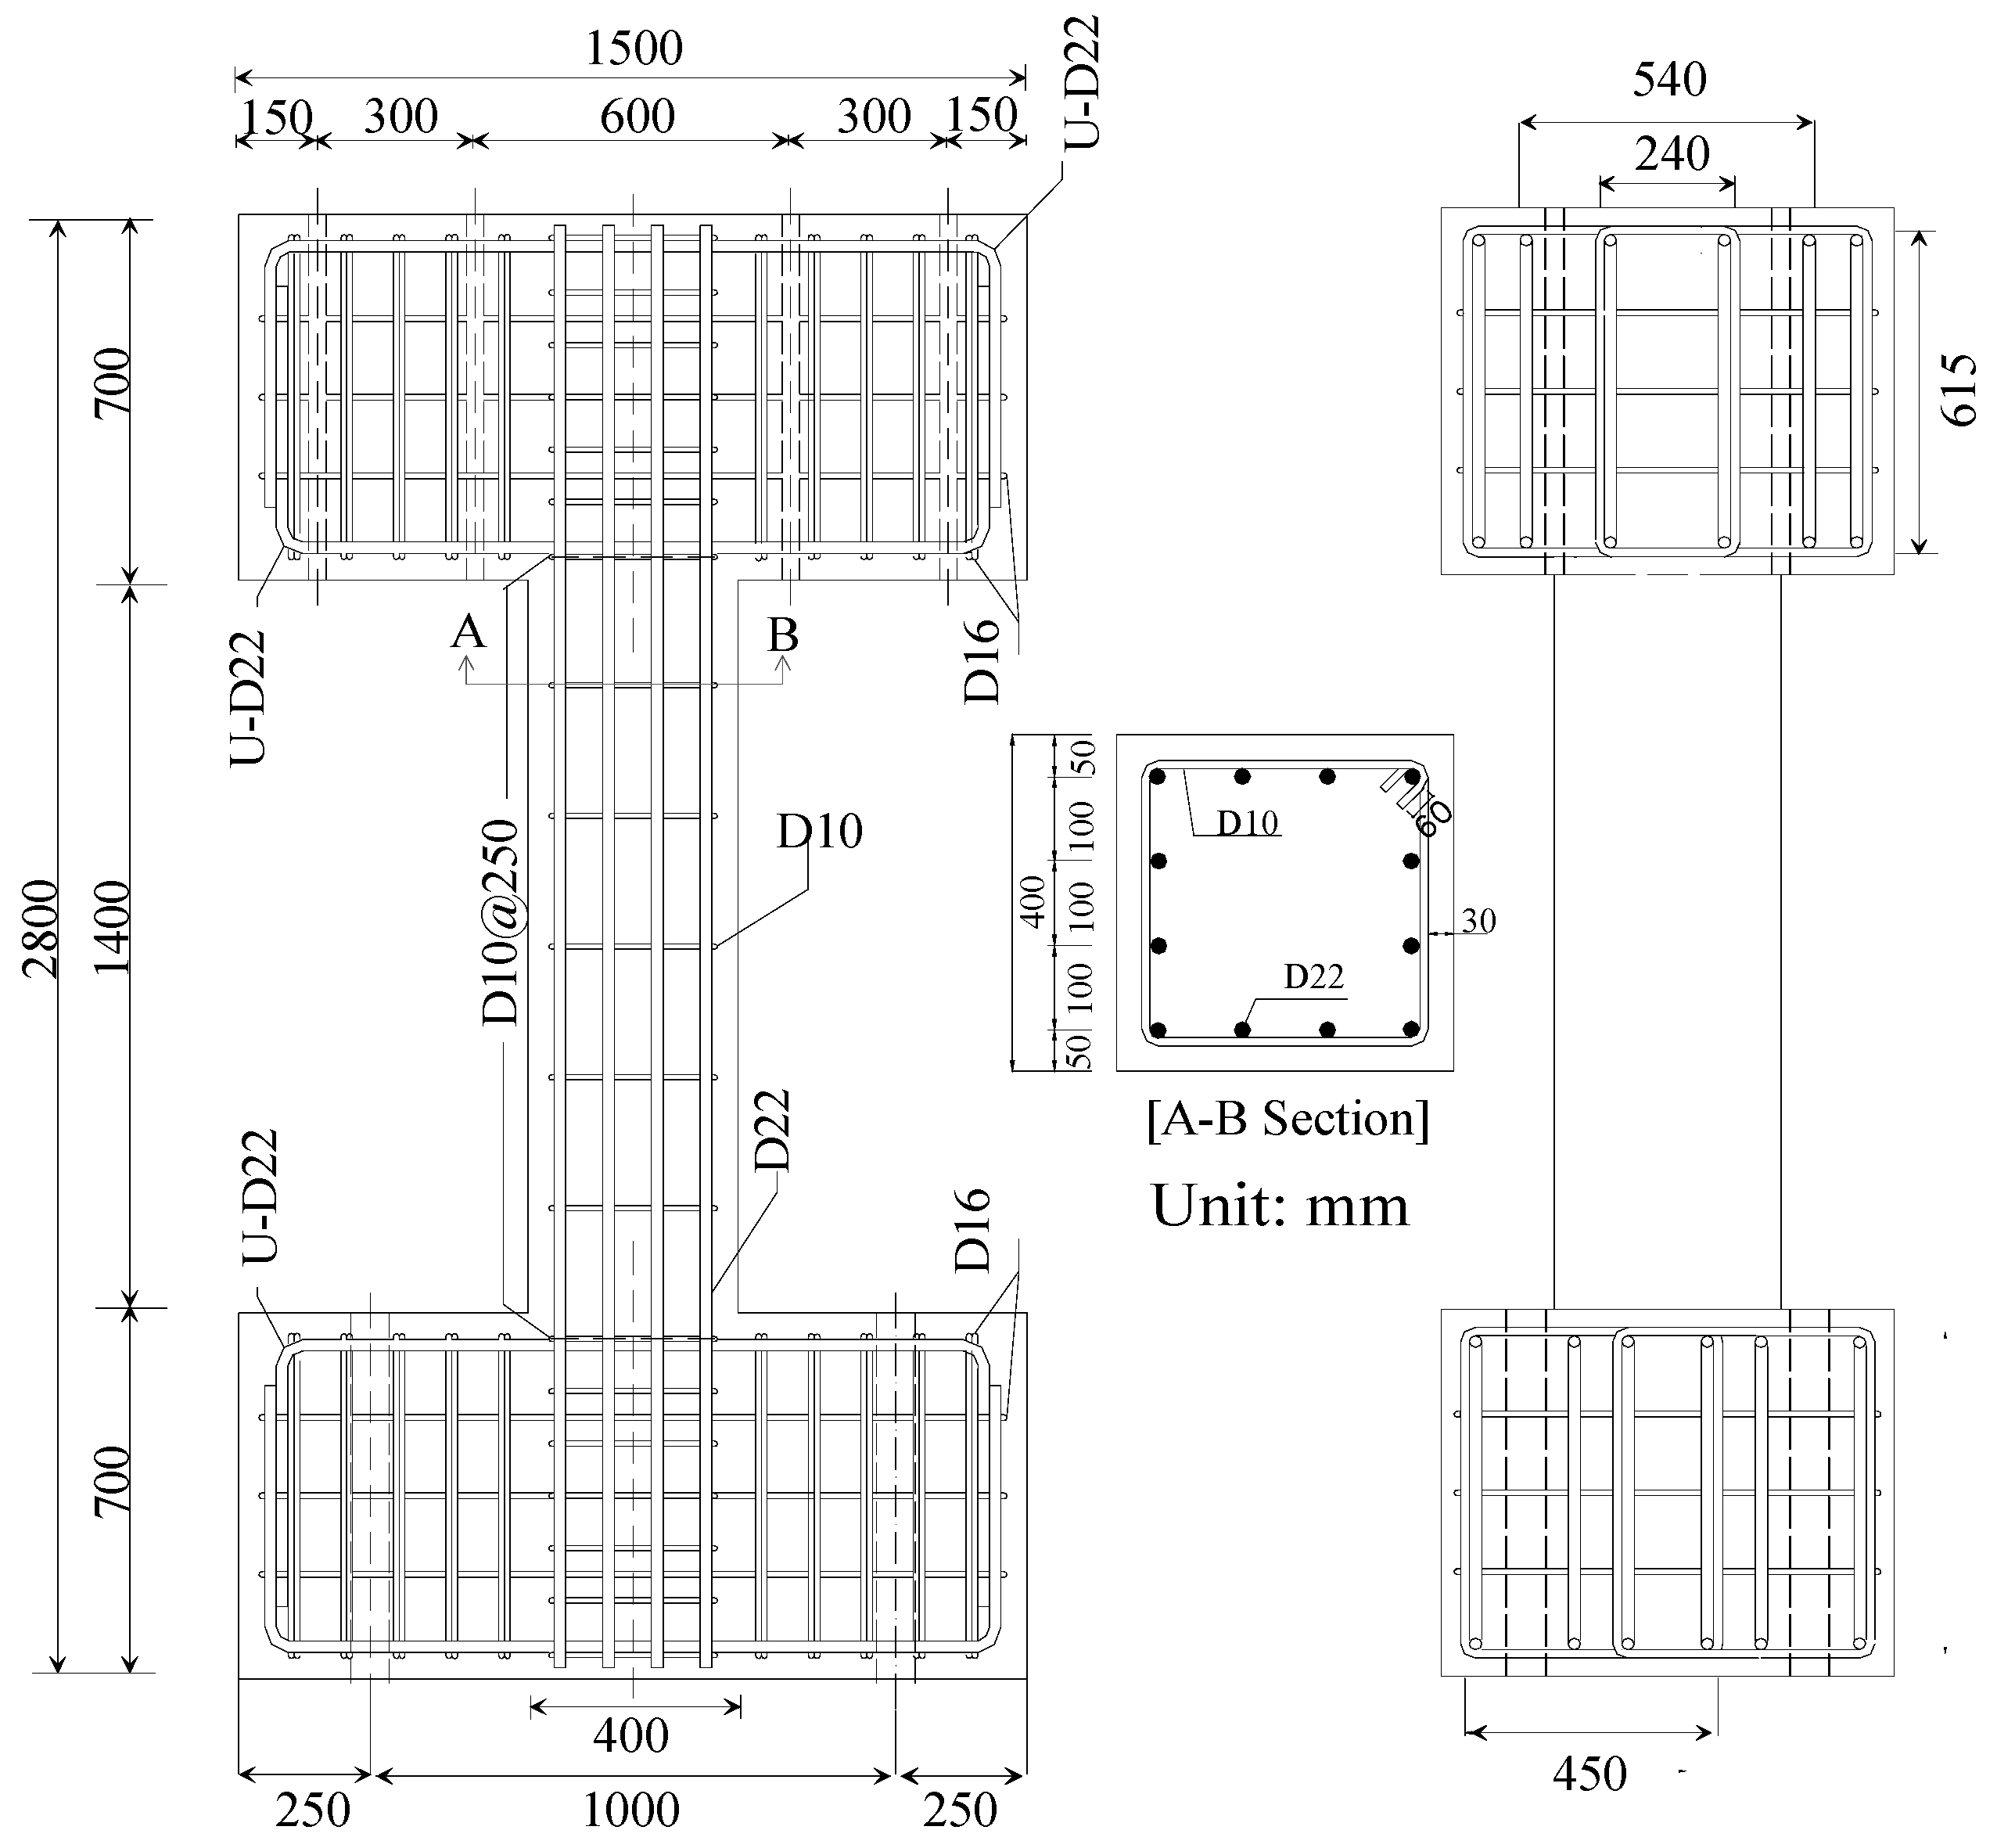
The main purpose of this study was to develop a new technique for seismic strengthening of existing RC columns. This study first involved tensile testing of the composed material, with the length of the chopped glass and carbon fibers as well as the mix ratio of the fibers, epoxy, and vinyl ester resin, all serving as test variables to determine the optimum properties for sprayed FRP on concrete columns. The optimum sprayed FRP, based on the results of this material testing, was used to strengthen RC columns controlled by shear (shear columns). Five specimens of shear columns were prepared and strengthened by sprayed FRP with different combinations of short carbon or glass fibers and epoxy or vinyl ester resins, including a non-strengthened control specimen. Cyclic loading tests were carried out, and the ultimate shear load carrying capacity and deformation were investigated, as well as hysteresis in the lateral load-drift relationship.
Although vinyl ester resin is generally used for sprayed FRP because it hardens rapidly after being applied, this study considered a mixture of stronger epoxy resin and vinyl ester resin to reduce the viscosity of the spray, resulting in an improvement in the overall workability of the sprayed FRP technique. Material properties and cyclic loading tests were conducted to assess the seismic strengthening performance, as well as the practical design equation, of sprayed FRP on RC columns, and to determine the optimal chopped fiber length and fiber-resin mix ratio to achieve the same strength as one layer of the currently used FRP sheets.
4. Failure Sequence and Lateral Load-Drift Curves
The lateral load-carrying capacity of the control and the sprayed FRP-strengthened specimens differed significantly. Generally, all specimens strengthened using the sprayed FRP technique exhibited similar evidence of failure mode, with similar fracture appearance and lateral load-drift relationships. The strengthened specimens, with complete hardening after spraying, showed a shear failure mode, along with the simultaneous movement of the concrete and the reinforcement material, resulting in the eventual fracture of both. In the following discussion, the authors focus on the fracture and failure patterns of the reinforcement materials on the concrete surface in terms of the lateral drift and load-drift relationships during the final stages of the test. Each loading step was identical during the three loading cycles.
Table 9 lists the results in terms of maximum shear strength and displacement with positive and negative loads for the five specimens.
4.1. Non-Strengthened Control Specimen (SC-N)
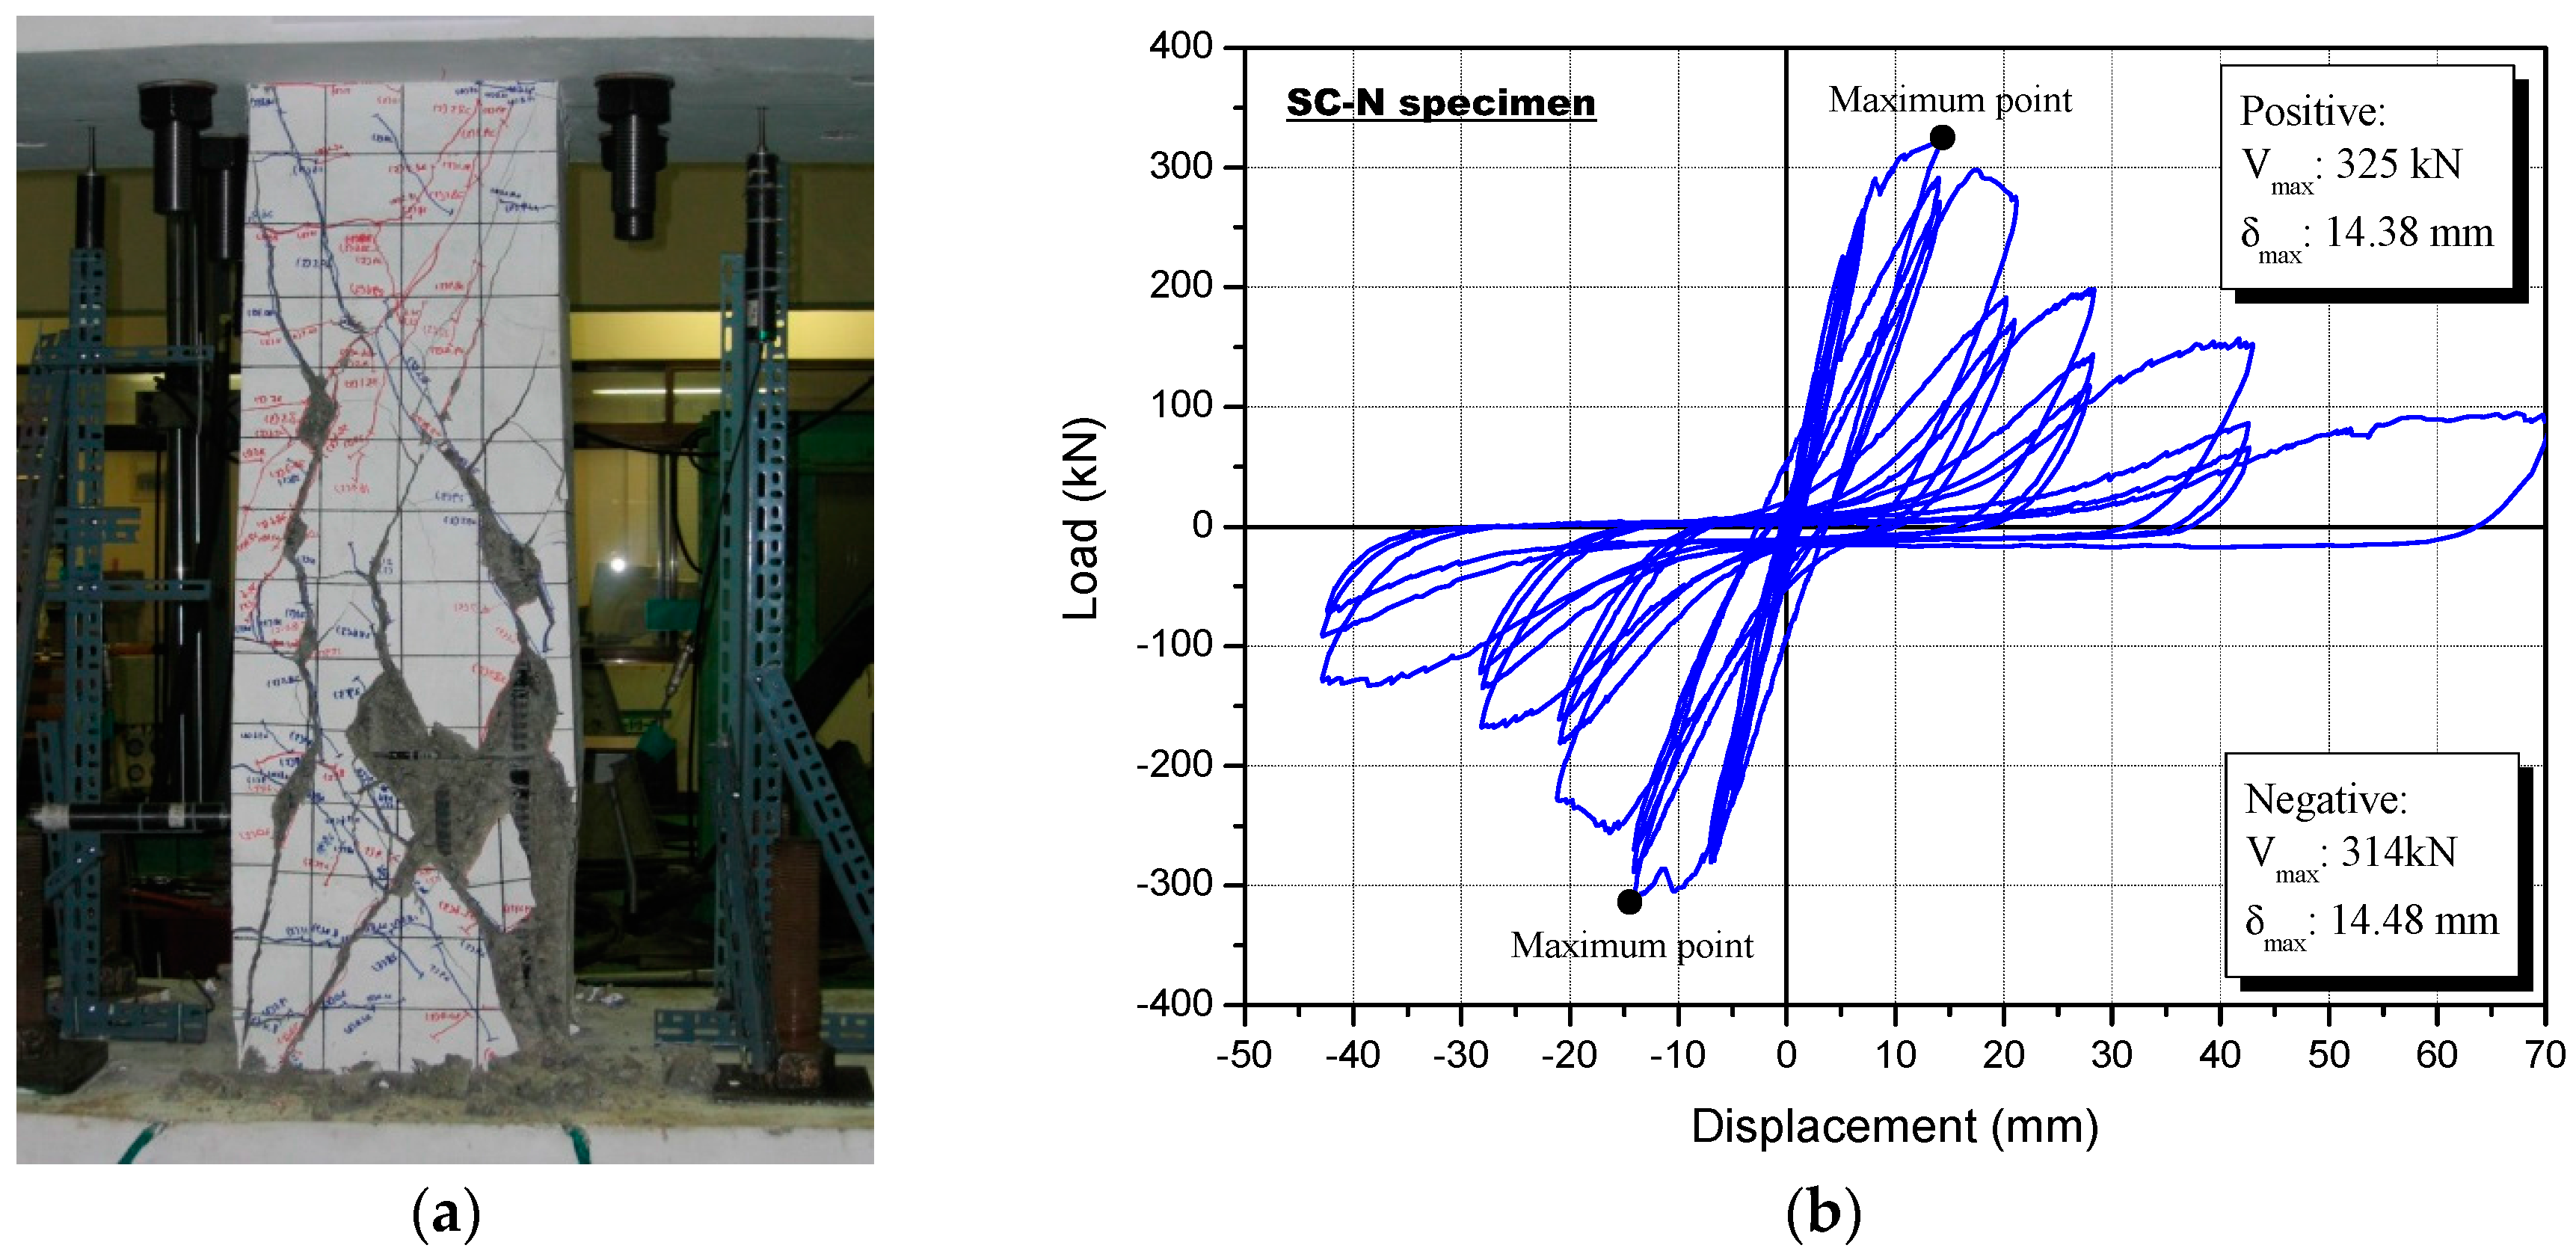
Figure 10 shows the failure pattern of the SC-N specimen following the final cyclic load test, as well as the lateral load-drift curve for the SC-N specimen, which was designed to exhibit shear failure as shown previously in
Table 6. The first observed crack occurred at a negative load of 19.6 kN, and a small flexural crack appeared in the bottom column faces after three cycles at the fourth loading step (
R = 0.15%). Cracking was not observed in the center of the column. Flexural cracks extended into the middle of the column after step four. Following the seventh loading step (
R = 0.31%), with a load of both positive 225 kN and negative 219 kN, shear cracks were observed at the top faces of the columns, and diagonal shear cracks appeared, some of which were more than 2 mm wide. When the applied load reached 250 kN, at the ninth positive loading step (
R = 0.46%), larger shear cracks were observed, with increased widths. During the test, peeling failure due to shear forces from the concrete cover was observed. This was likely the result of insufficient shear confinement.
Shear failure occurred at the bottom of the column following the application of a load of 100 kN, with a lateral drift of 70.0 mm (
R = 5%). The maximum load capacity of the column of the SC-N specimen was a positive load of 325 kN, with a lateral drift of 14.38 mm (
R = 1.03%;
Table 9). The maximum positive load capacity was similar to the maximum negative load capacity of 314 kN, with a lateral drift of 14.48 mm.
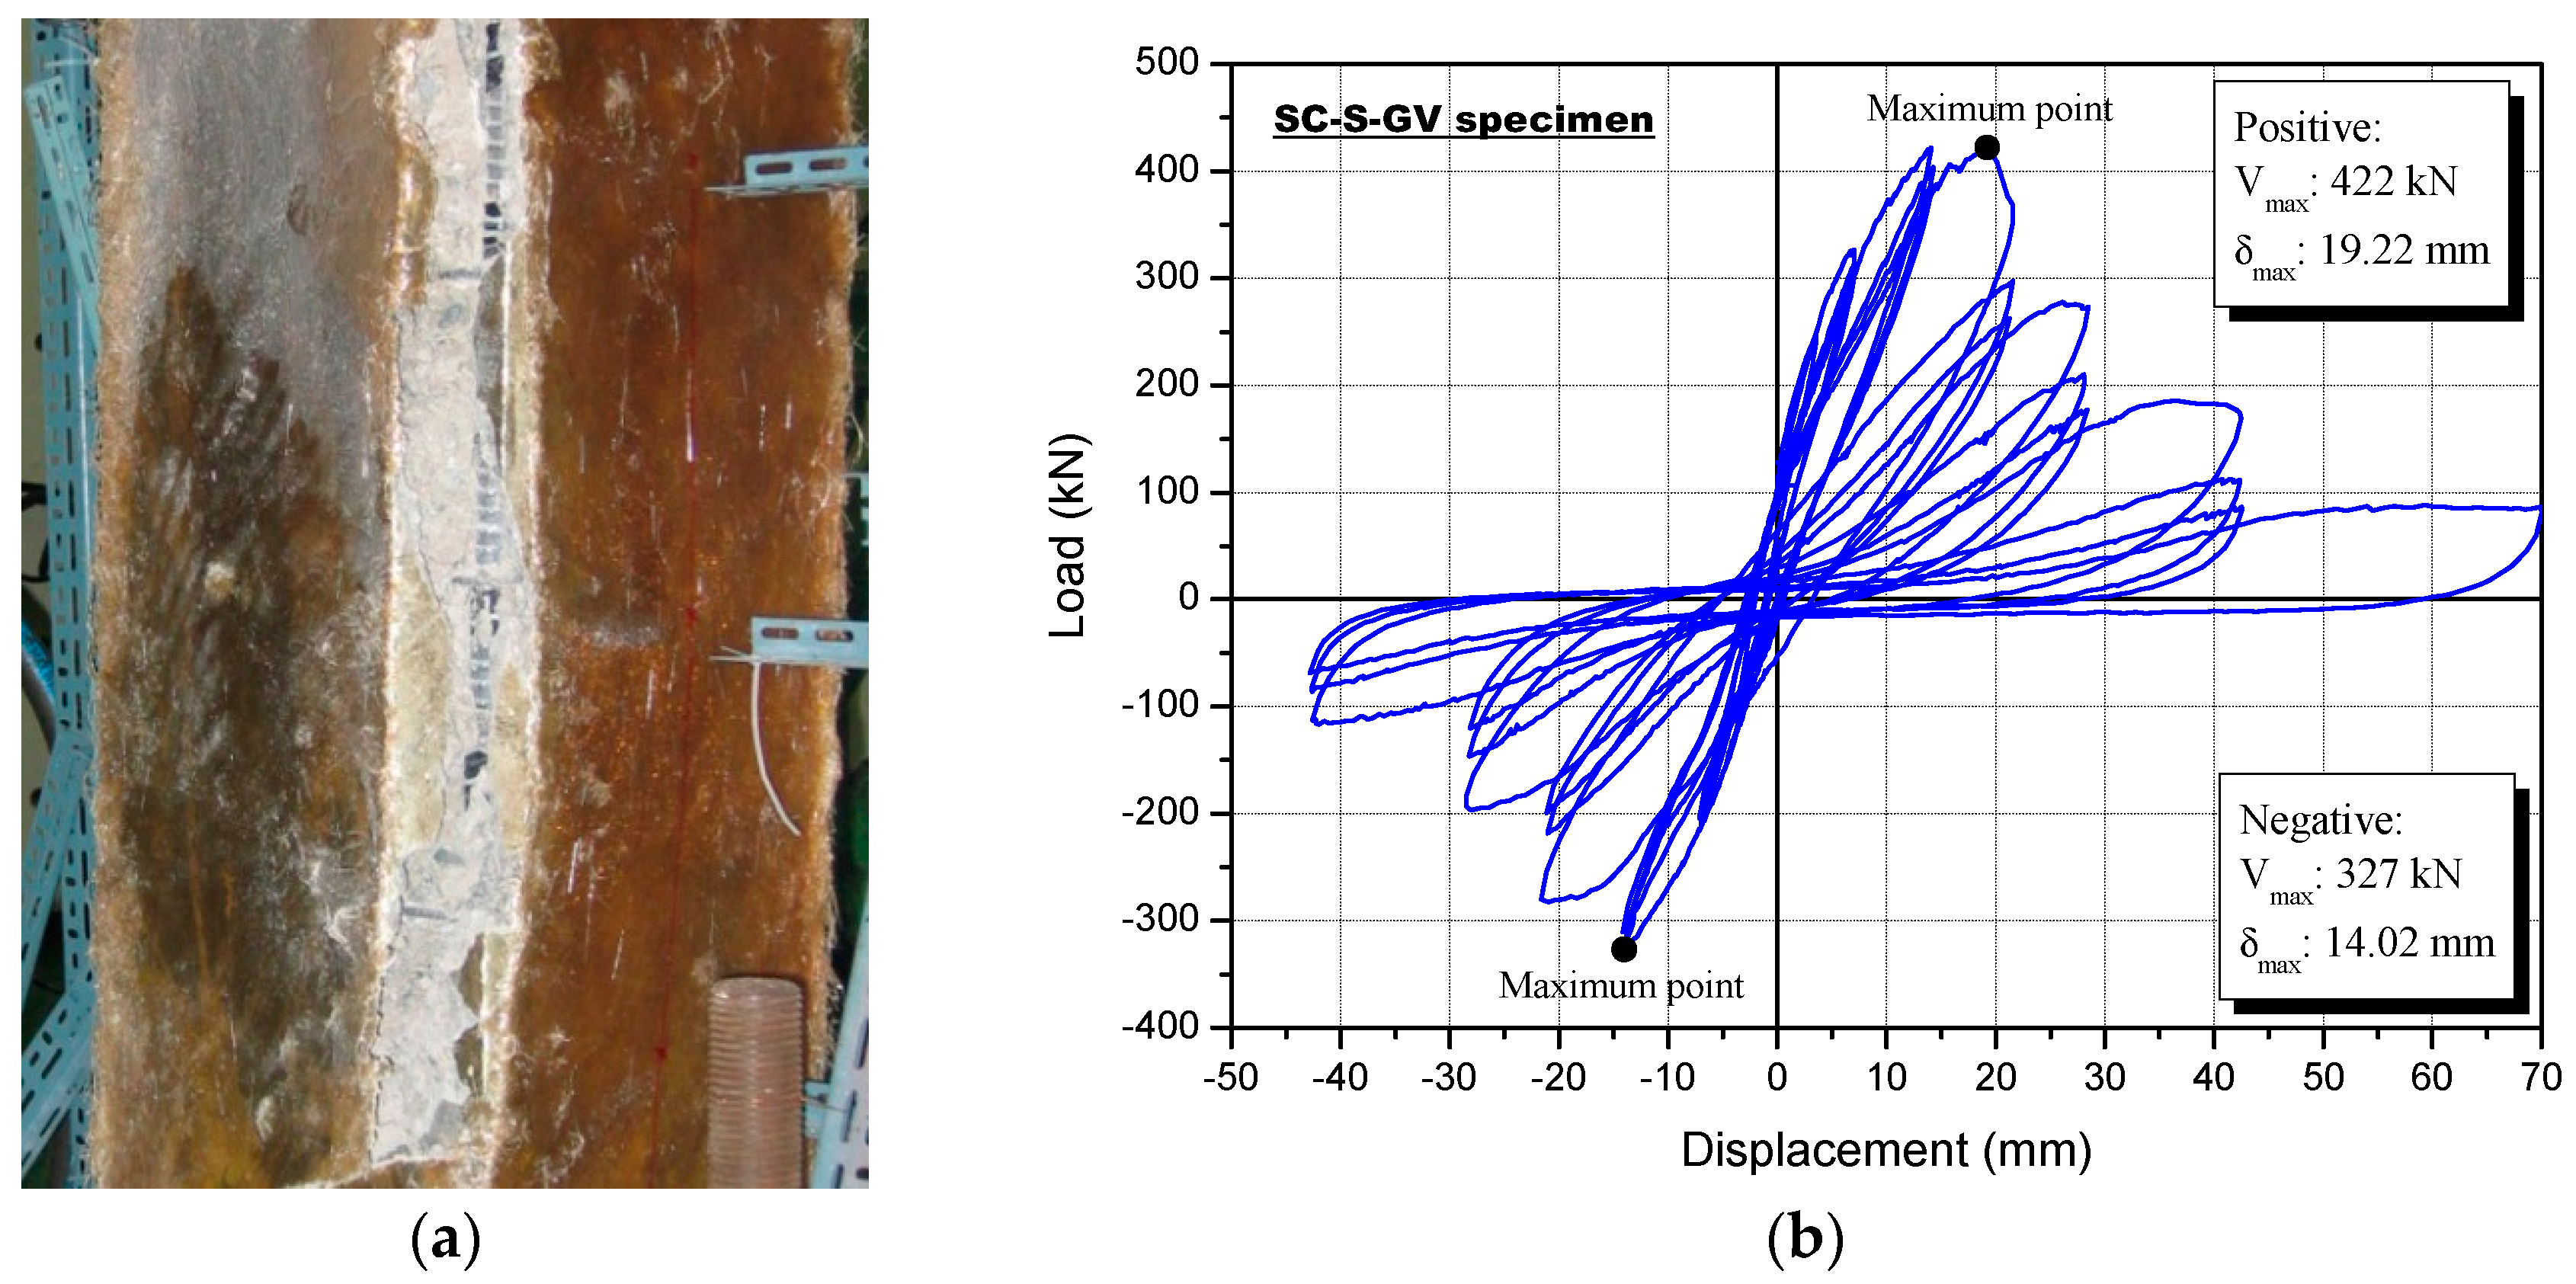
4.2. Sprayed FRP-Strengthened Specimens Using Glass Fiber and Vinyl Ester Resin (SC-S-GV)
Figure 11a shows a photograph of the SC-S-GV specimen following the cyclic loading test, and
Figure 11b shows the lateral load-drift curves. The SC-S-GV specimen did not show surface cracks, because the surface had the reinforcement material sprayed on it, with glass fiber and vinyl ester resin. For the first time, a fracturing sound of the glass fiber in the inner part of reinforcement material occurred in the top and bottom column faces following the first cycle of the tenth loading step (
R = 1%). At a load of 303.8 kN, with a positive loading after step 10, the specimen started fracturing after the simultaneous movement of the reinforcement and the concrete at the edge of the bottom column face, some of which were ~50 mm wide, resulting in eventual debonding.
The maximum load capacity of the SC-S-GV specimen was a positive load of 422 kN, with a lateral drift of 19.22 mm (
R = 1.37%;
Table 9,
Figure 11). It should be noted that the concrete and the reinforcement behaved together with complete hardening. The sprayed FRP system for the RC column was therefore an effective reinforcement technique that could markedly increase the shear strength.
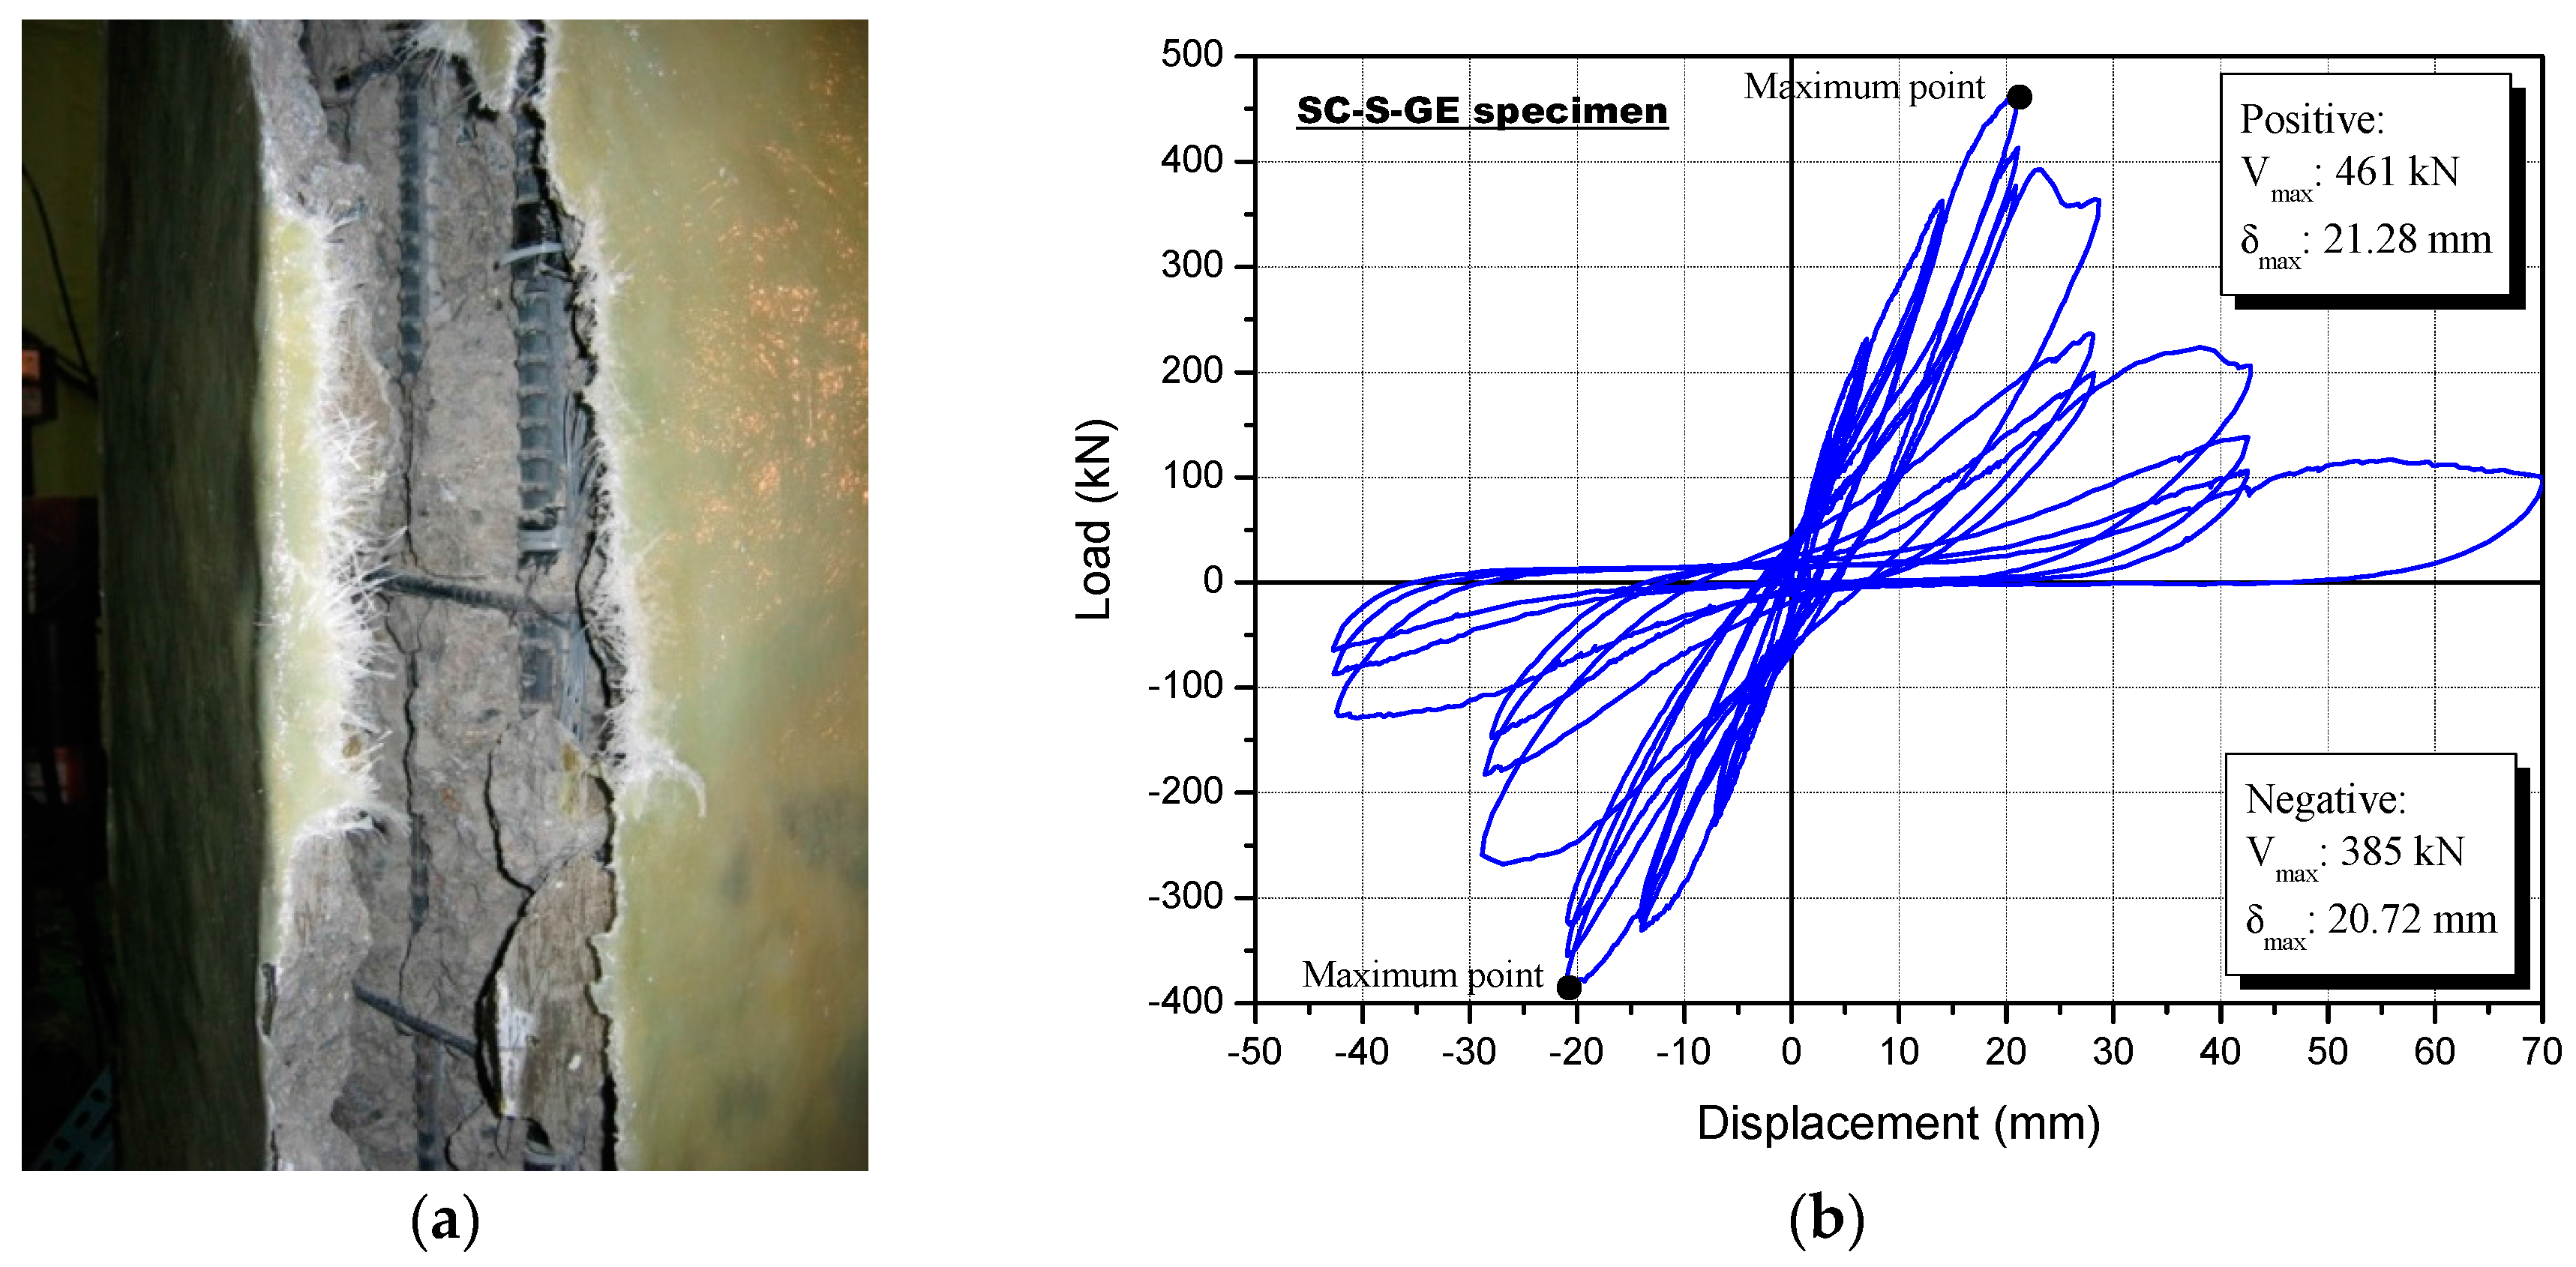
4.3. Sprayed FRP-Strengthened Specimen Using Glass Fiber and Epoxy Resin (SC-S-GE)
The SC-S-GE specimen was strengthened using the sprayed FRP with glass fiber and epoxy resin. Surface cracks were not seen because of the externally sprayed glass fiber and epoxy resin.
Figure 12a shows the failure mode of the SC-S-GE specimen following the cyclic loading test, and
Figure 12b shows the lateral load-displacement curve. The lateral strength of the SC-S-GE specimen did not increase at the 34th positive loading cycle (12th loading step,
R = 1.54%) with a maximum load of 461 kN.
Similar to the SC-S-GV specimen, a fracturing sound of the glass fiber in the inner part of the reinforcement material occurred in the top and bottom column faces following the first negative loading cycle of the 10th loading step (R = 1%). At a load of 323.4 kN, with a negative loading after step 10, the specimen started fracturing at the edge in the middle of the column. When the applied displacement reached 23 mm, after the 12th positive loading step (R = 1.54%), larger fractures were observed, some of which were ~70 mm wide, and the fractures spread to the lower and upper ends of the column specimen.
The concrete and the reinforcement, with complete hardening after spraying, behaved together in the SC-S-GE column test specimen, as shown in
Figure 12a, resulting in eventual fracture of both at the 14th step (
R = 3%).
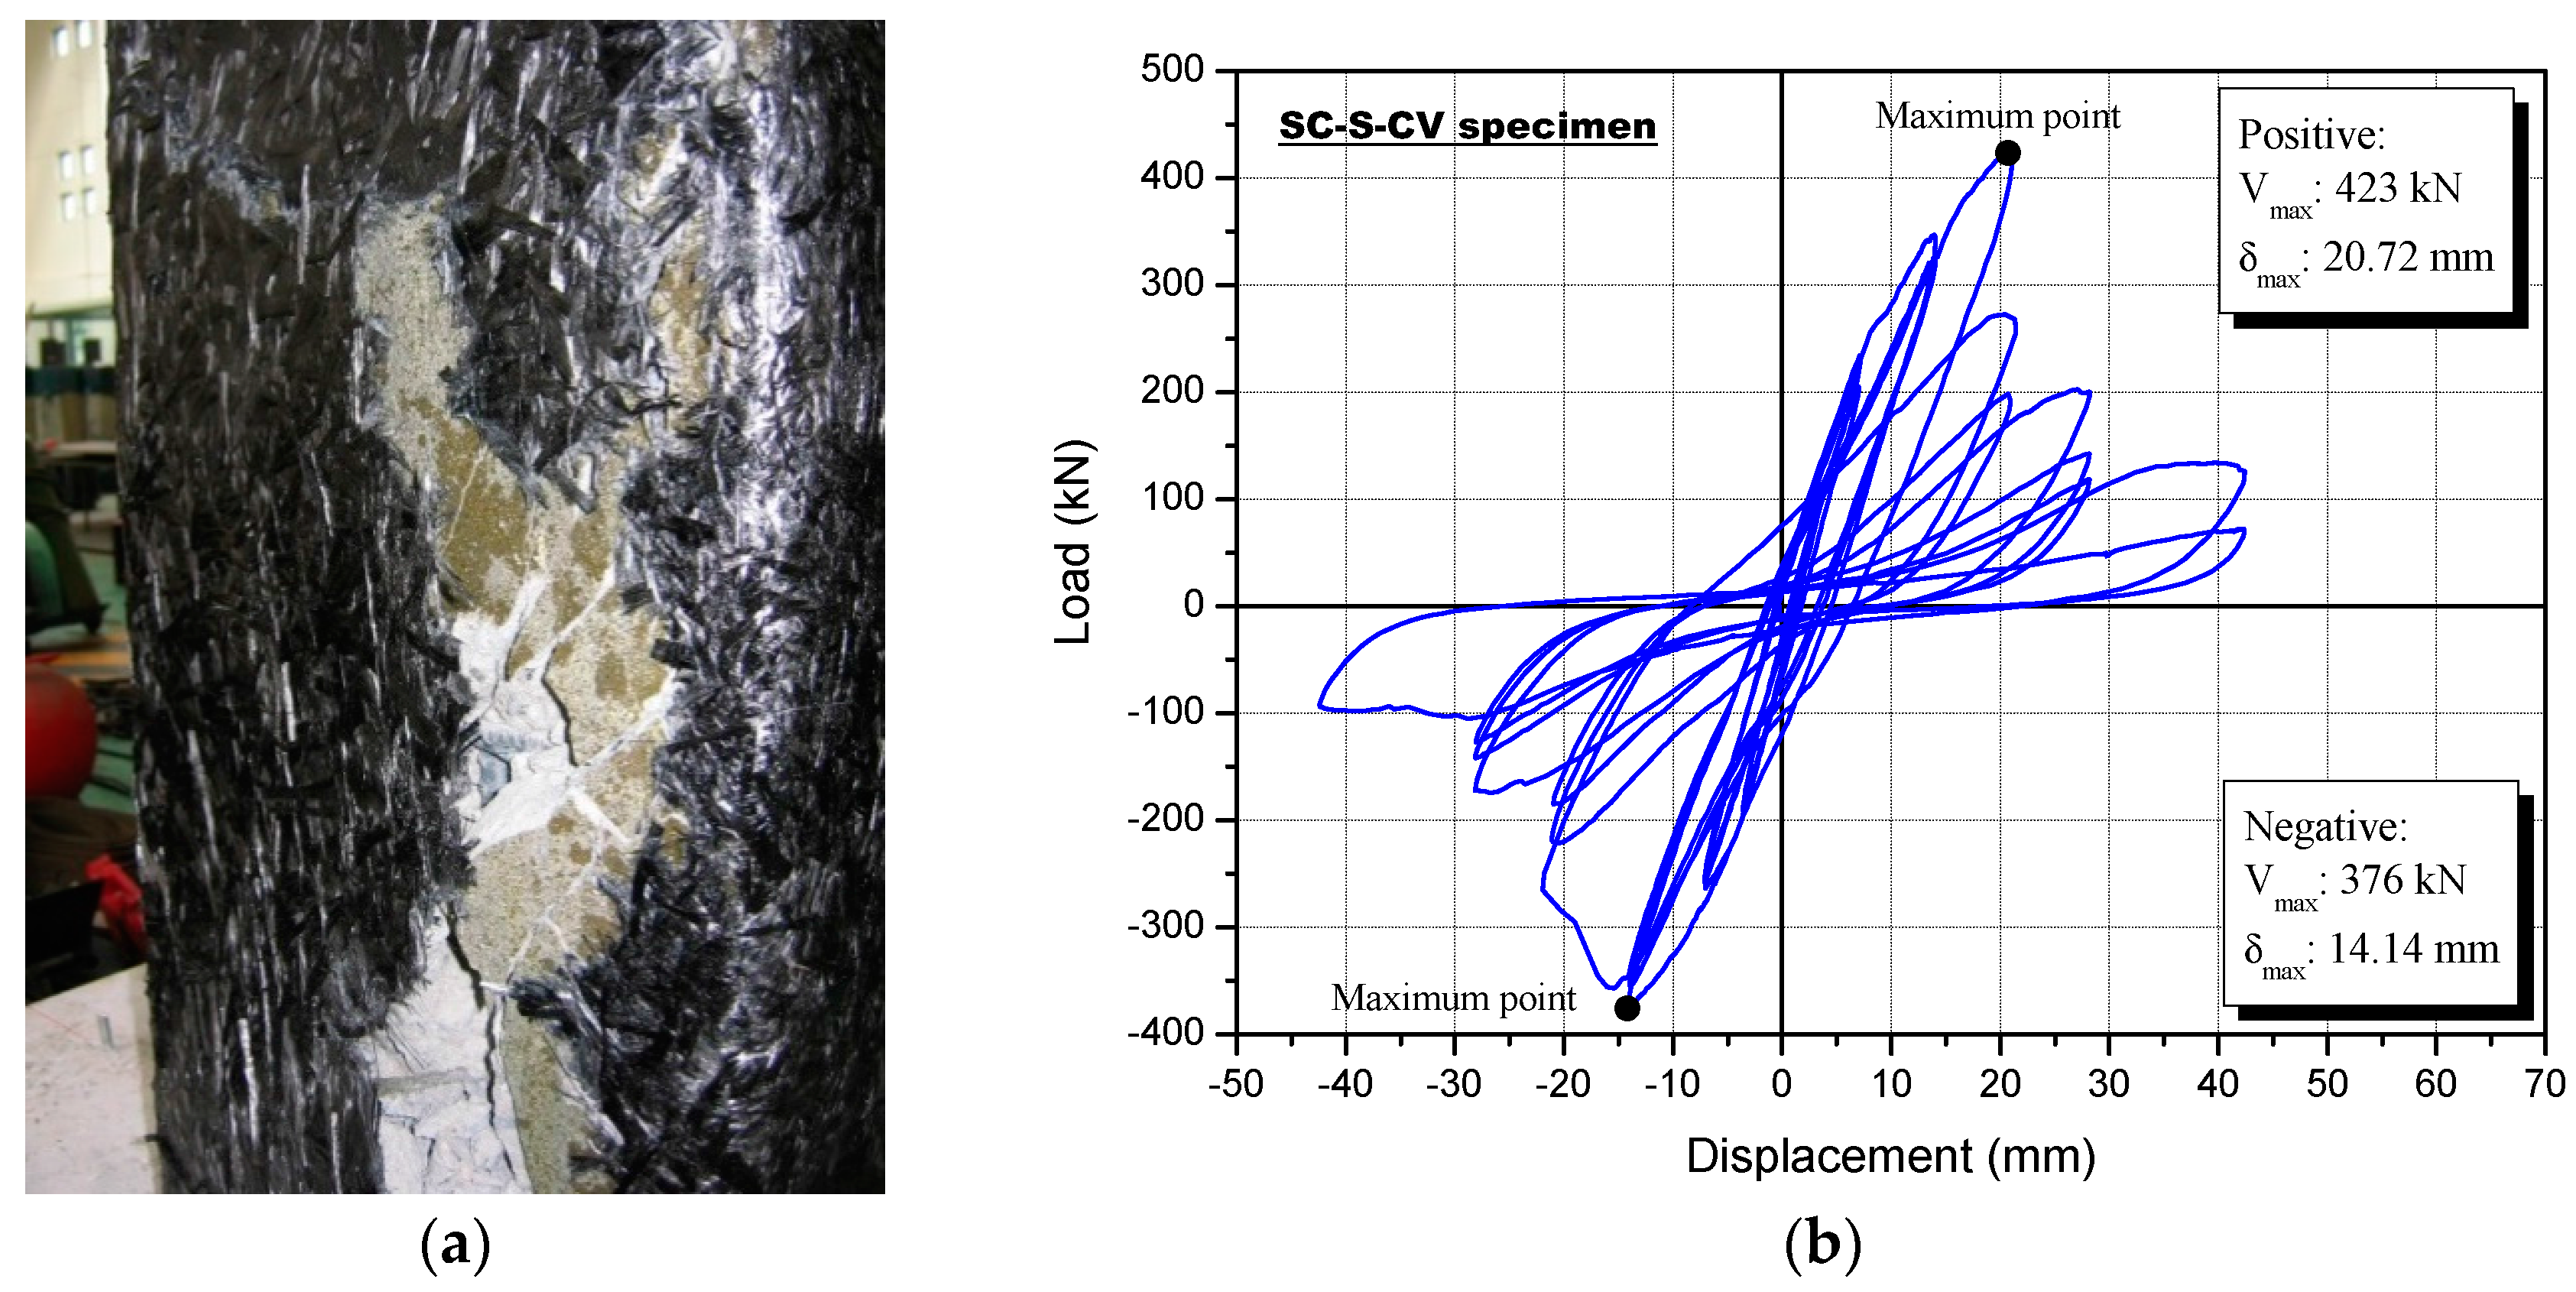
4.4. Sprayed FRP-Strengthened Specimen Using Carbon Fiber and Vinyl Resin (SC-S-CV)
Figure 13 shows the failure mode after the cyclic loading test, as well as the lateral load-displacement curve for the SC-S-CV specimen. The SC-S-CV specimen was reinforced using carbon fiber and vinyl ester resin. Surface cracks were not seen because of the sprayed materials; first, a fracturing sound of the carbon fiber occurred in the top and bottom column faces at the first cycle of the ninth loading step (
R = 0.49%) with a load of 274 kN.
At a load of 390 kN, with a positive loading after step 11, the specimen started fracturing at the edge of the bottom column faces. After the 12th positive loading step (R = 1.54%), larger fractures were observed and they spread to the middle of the column, showing simultaneous movement of the reinforcement and the concrete. Finally, at step 14, the reinforcement fractured and completely debonded at the edge of the lower end of the column specimen. The lateral strength of the SC-S-CV specimen did not increase at the 34th positive loading cycle (12th loading step, R = 1.54%) with a maximum load of 423 kN.
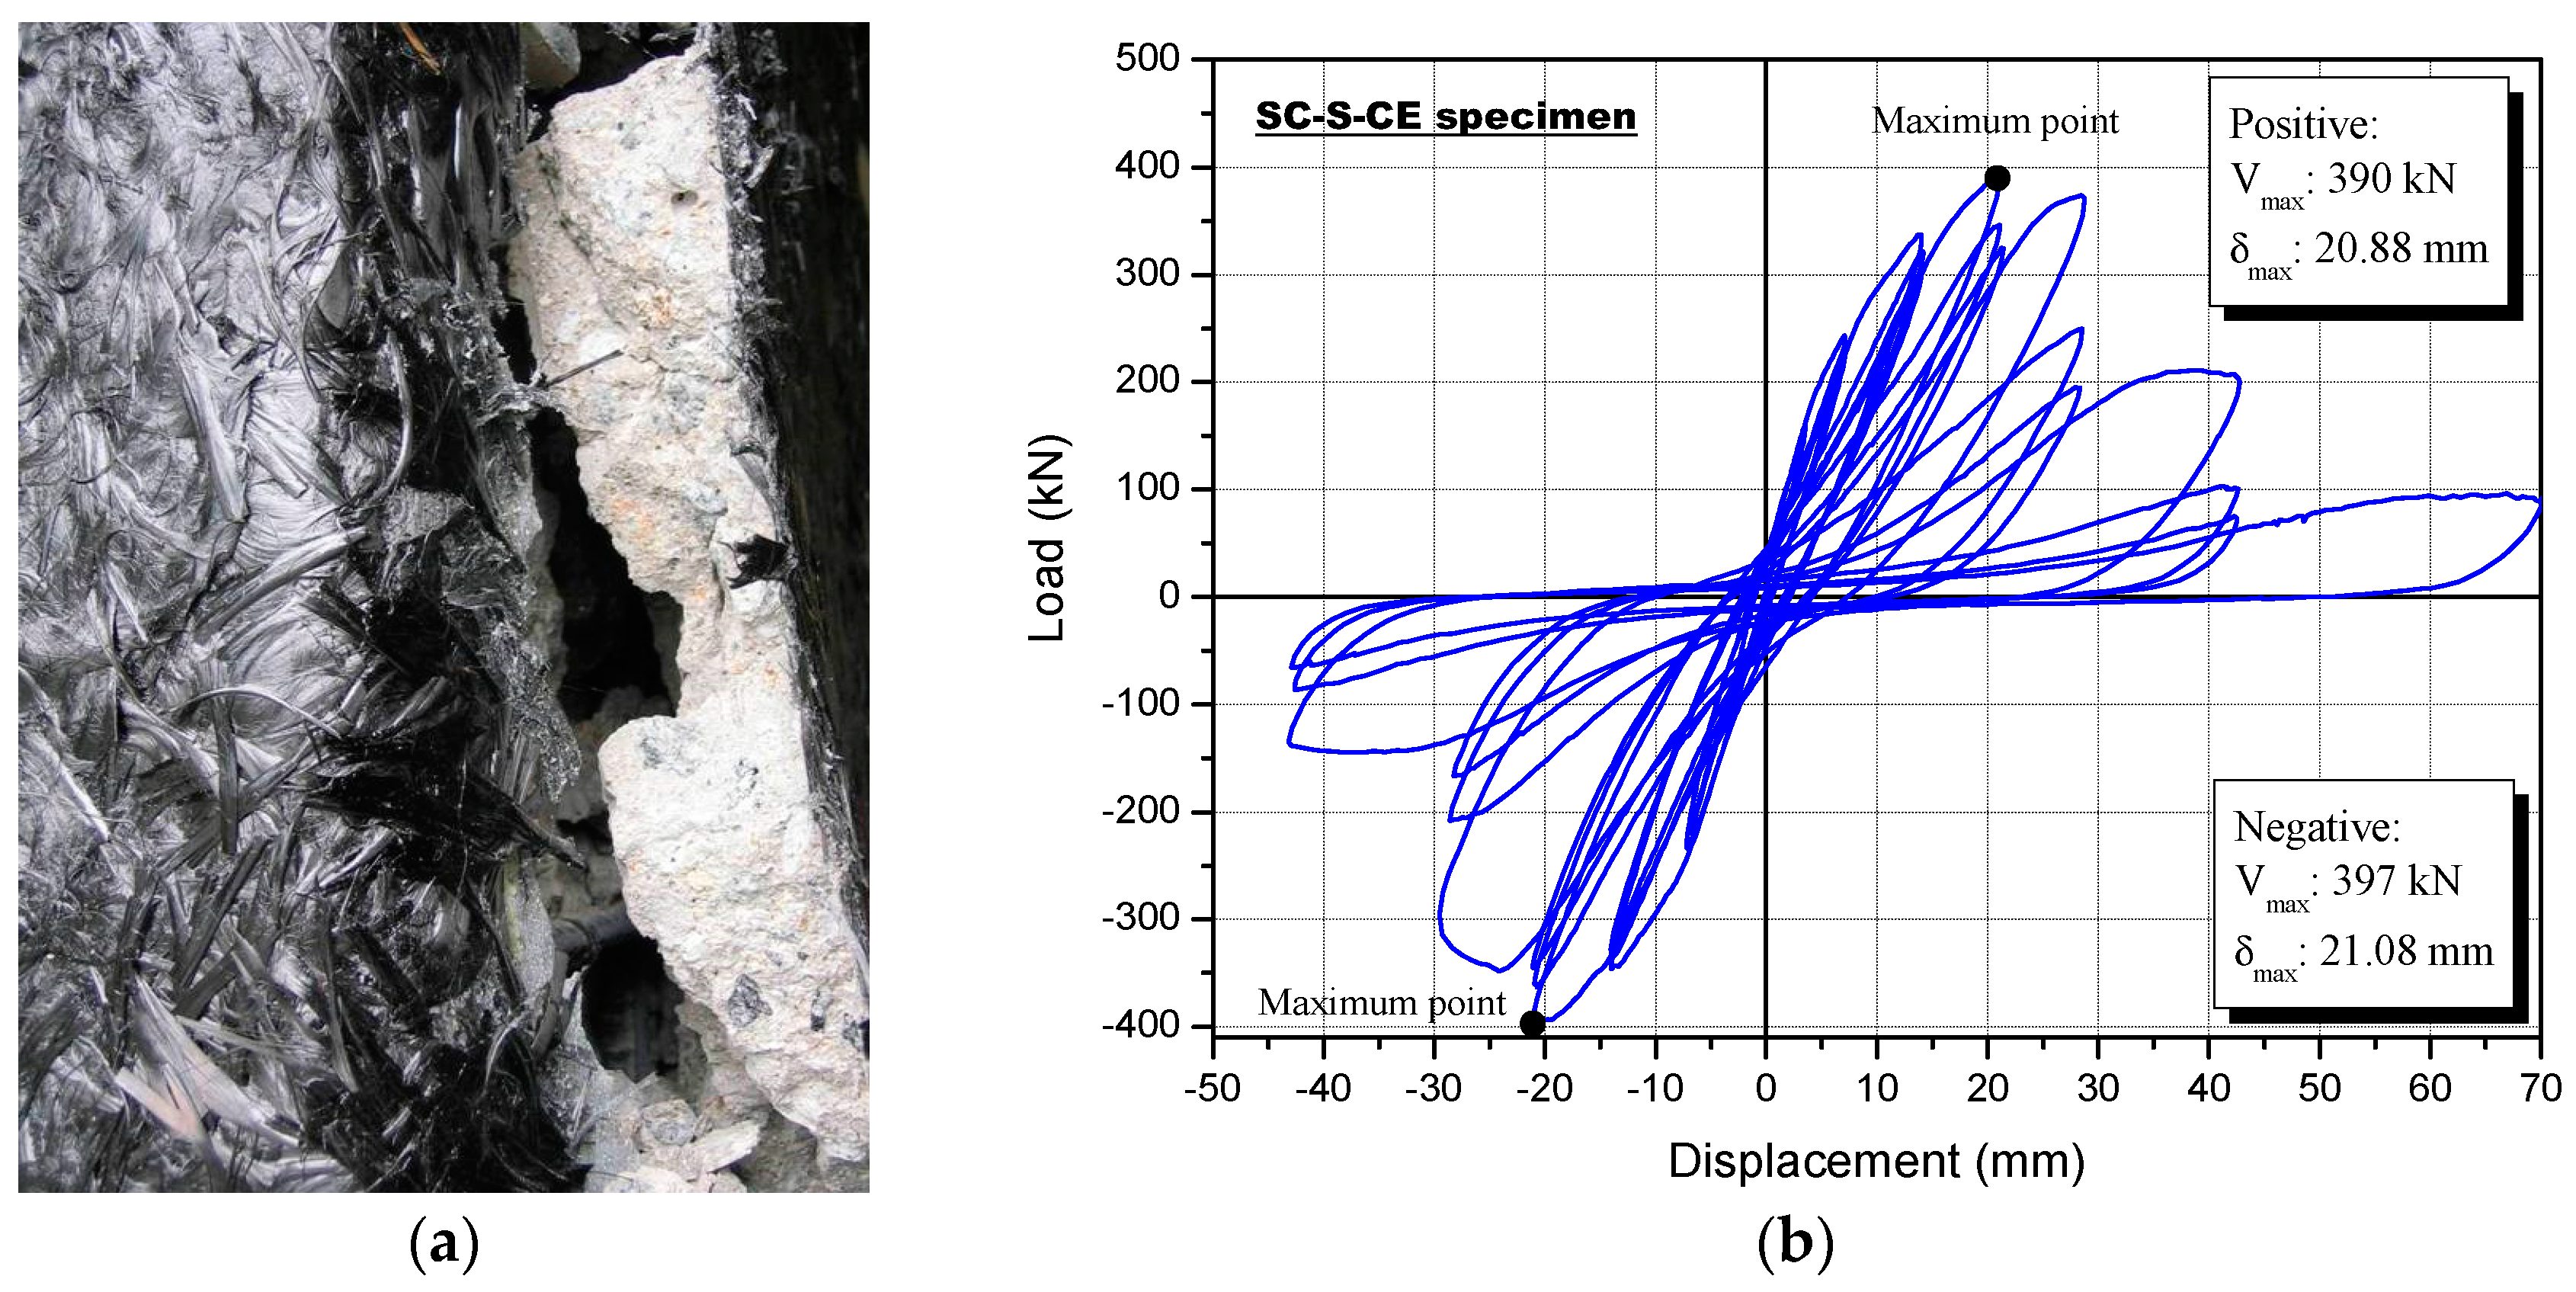
4.5. Sprayed FRP-Strengthened Specimen Using Carbon Fiber and Epoxy Resin (SC-S-CE)
The SC-S-CE specimen was strengthened using the sprayed FRP with carbon fiber and epoxy resin. Surface cracks were not seen because of the externally sprayed carbon fiber and epoxy resin.
Figure 14 shows the failure mode following the cyclic loading test, as well as the lateral load-displacement curve. The lateral strength of the SC-S-CE specimen did not increase at the 34th negative loading cycle (12th loading step,
R = 1.54%) with a load of 397 kN, which showed the maximum load.
A fracturing sound of the glass fiber in the inner part of the reinforcement material occurred in the top and bottom column faces at the first negative loading cycle of the 10th loading step (R = 1%) with a load of 333.2 kN.
After the load reached 333.2 kN, the specimen started fracturing at the edge of the middle of the column. When the applied displacement reached 28 mm, after the 12th positive loading step (R = 2%), larger fractures were observed, some of which were ~90 mm wide, and the fractures spread to the lower and upper ends of the column specimen.
Similar to the other three strengthened specimens described above, the concrete and the reinforcement, with complete hardening after spraying, behaved together in the SC-S-CE column specimen, as shown in
Figure 14a, resulting in eventual fracture of both at the 15th step (
R = 5%).
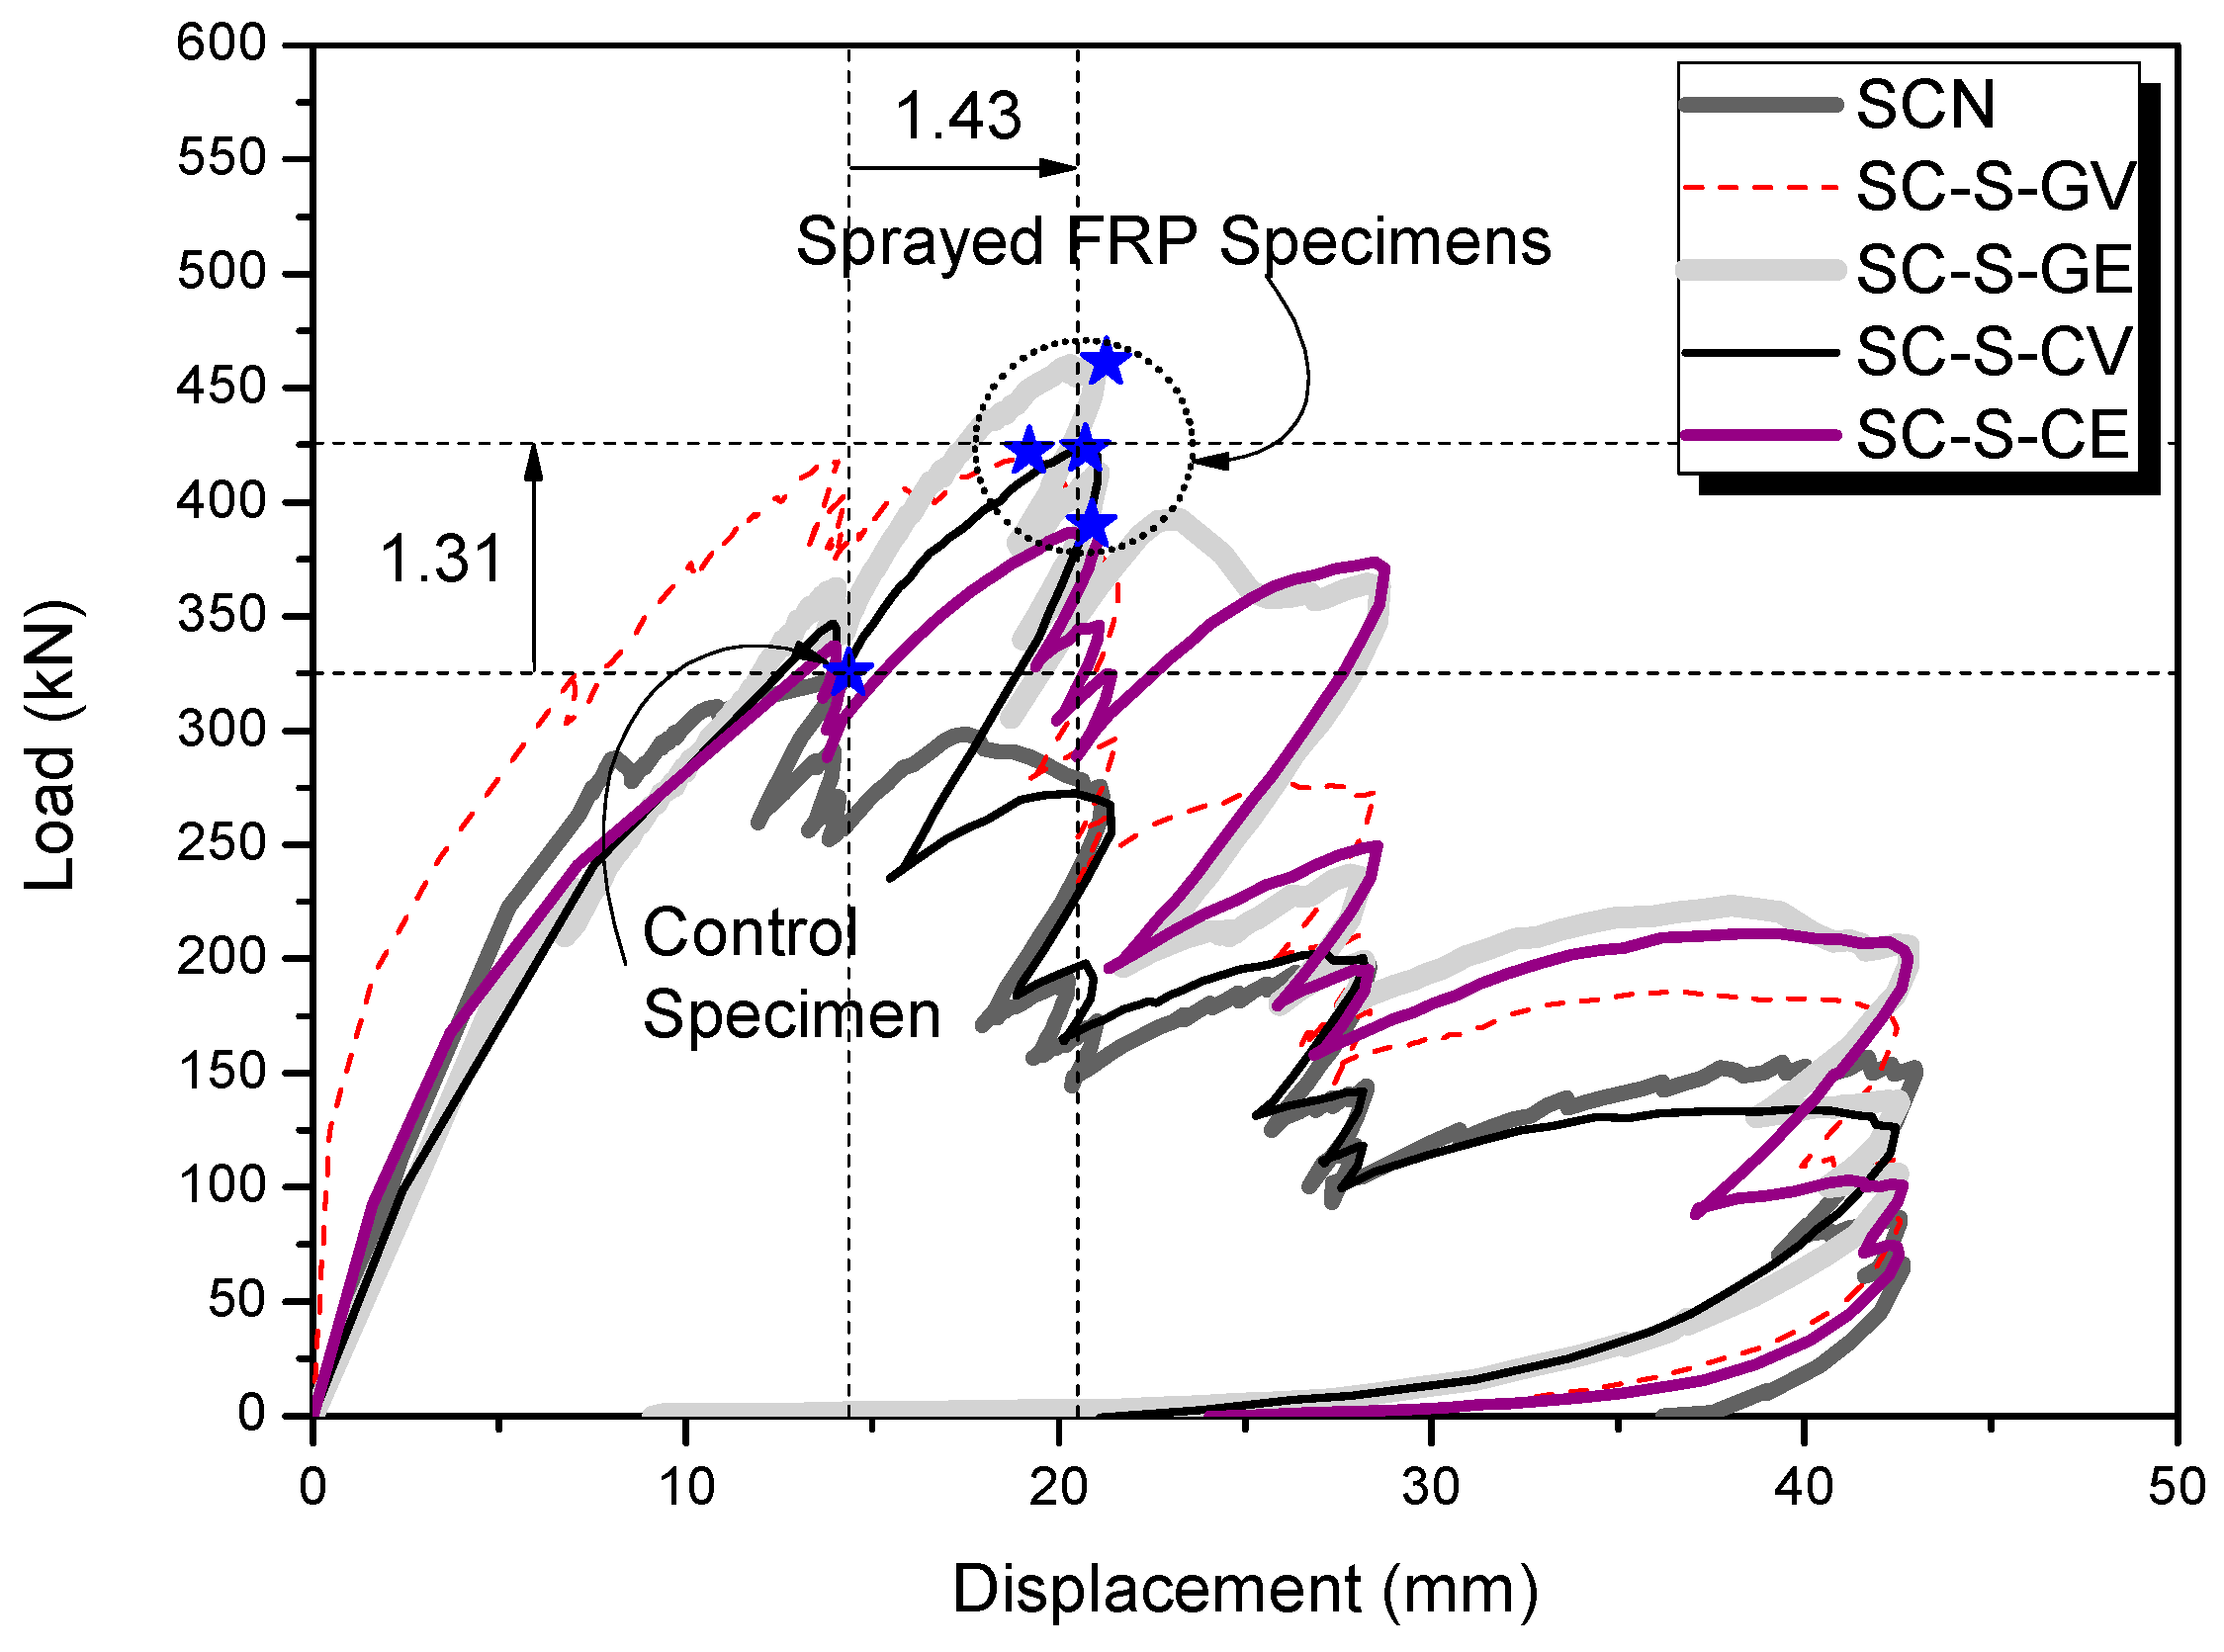
4.6. Strength and Deformation
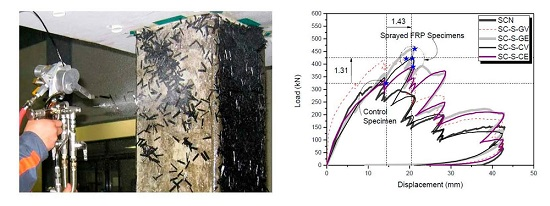
Figure 15 shows positive envelope curves of the lateral load-displacement relationship up to
R = 3% for the sprayed FRP-strengthened specimens (SC-S-GV, SC-S-GE, SC-S-CV, and SC-S-CE) with the non-strengthened control SC-N specimen for comparison with the strengthened specimens.
Table 10 lists maximum strength and deformation capacities. The larger of the maximum positive and negative load values were used here (see
Figure 10,
Figure 11,
Figure 12,
Figure 13 and
Figure 14). The strength ratio (SR) is defined as the ratio of maximum load
Vmax of specimens strengthened with the sprayed FRP to that of the SC-N control specimen, and the displacement ratio (DR) indicates the ratio of displacement at the maximum point δ
max of the specimens strengthened with the sprayed FRP to that of the SC-N control specimen.
The maximum shear strength of specimens SC-S-GV was 422 kN, that of SC-S-GE was 461 kN, that of SC-S-CV was 423 kN, and that of SC-S-CE was 397 kN; these represent an increase of a factor of ~1.22 to 1.42 (
i.e., 22%–42% larger) relative to the SC-N control specimen, where the maximum shear strength was 325 kN. Also, as illustrated in
Figure 15, the specimens strengthened using the sprayed FRP exhibited a reinforcement effect, in terms of shear strength, on average 1.31 times greater than the control specimen. The displacement at the maximum strength point (δ
max) of the four specimens strengthened using the sprayed FRP ranged from ~19.22 to 21.28 mm; this indicates a reinforcement effect (
i.e., deformation) on average 1.43 times larger than the SC-N control specimen (
Figure 15).
The results regarding the strength and deformation capacities mentioned above show that the sprayed FRP technique for RC columns controlled by shear was an effective retrofitting technique to provide both increased strength and deformation, which is a useful approach for existing low- to medium-rise RC buildings that were not designed and built to seismic specifications. Adequate strength and deformation can reduce the inelastic earthquake response in terms of hysteretic energy dissipation [
33,
34].
5. Applicability of Shear Strengthening Design Equations for the FRP Sheet to Sprayed FRP
In Japan, the current standard equations for calculating the maximum shear strength capacity according to the shear strengthening effects of the reinforcement materials (FRP sheet) include an equation proposed by the JBDPA [
35] (Equation (2)), and one specified by the Architectural Institute of Japan (AIJ) [
36] (Equation (3)), revised using the shear capacity equation for the truss-arch mechanism on the basis of the effective strain of the FRP sheet based on a regression analysis of existing experimental data. For practical use of FRP sheets according to Equation (3), especially, the AIJ proposed a coefficient of shear strength reduction of α = 0.67, based on a regression analysis of existing experimental data.
Both Equations (2) and (3) were modified by converting a parameter showing shear reinforcing bars, when the FRP sheet reinforcement was considered, in the existing equations to calculate the ultimate shear strength of the columns.
where
Pt = tensile reinforcement ratio (percent)
fck = compressive strength of concrete (N/mm2)
M/Q = shear span length; default value = ho/2
ho = clear height
d = effective depth of the column
Psw = shear reinforcement ratio of shear reinforcing bars
σsw = yield strength of the shear reinforcing bars (N/mm2)
α = coefficient of shear strength reduction
Pfw = shear reinforcement ratio of FRP sheets
σsw = tensile strength of FRP sheets (N/mm2)
σ0 = axial stress in the column (N/mm2)
b = column width (mm)
j = distance between the centroids of the tension and compression forces
where
distance between the centroids of the main reinforcing bars
= compressive inner angle of concrete in truss mechanism
υ: effective coefficient of compressive strength of concrete ()
Kang [
37] conducted a comparison study of theoretical values computed from existing equations, expressed in Equations (2) and (3), and experimental test values of column specimens reinforced using FRP sheets. The results indicated that the equation proposed by the JBDPA [
35] having a coefficient of strength reduction of α = 1.0 was the most reliable with an average comparison correlation of 0.85 (standard deviation of 0.09), compared with the AIJ equation calculated using a coefficient of strength reduction of α = 0.67.
This study proposes coefficients of shear strength reduction (α), using Equations (4) and (5) of the sprayed FRP strengthening technique based on a comparison between theoretical values calculated from the two existing equations and experimental test results of the column specimens strengthened using the sprayed FRP.
where
= coefficient of shear strength reduction based on Equation (2), specified by the JBDPA [
35].
= experimental test results of the column specimens strengthened using sprayed FRP (
Table 9).
where
= coefficient of shear strength reduction based on Equation (3), modified by the AIJ [
36], using the arch-truss mechanism equation for calculating shear strength capacity.
To use Equations (4) and (5) with sprayed FRP, the properties of the mixture of chopped fibers and resins was taken into account using the value of reinforcement design thickness (
) for
and the reinforcement strength obtained from the material test (
) for
(
Table 3), respectively. When the shear strengthening capacity of sprayed FRP was computed under these conditions without considering the coefficient of shear strength reduction, the shear capacity could not be estimated appropriately because the computation is based on the assumption that the sprayed FRP behaves in tandem with the member.
Because the actual behavior of sprayed FRP results in fracturing and debonding failure at the region of maximum load, there is a need for a coefficient of shear strength reduction of the design strength for sprayed FRP, just as there is for the existing FRP sheet strengthening method [
35,
36,
38]. Thus, the experimental values of
Table 10 and the computed values from Equations (2) and (3) were compared to propose a coefficient of shear strength reduction (α
1 and α
2) for sprayed FRP, as shown in Equations (4) and (5).
Table 11 lists coefficients of shear strength reduction (α
1) calculated using Equation (4)—which was derived using Equation (2), proposed by the JBDPA [
35]—and those (
) calculated using Equation (5), which was derived based on Equation (3), proposed by the AIJ [
36]. As indicated in
Table 11, the coefficients of strength reduction (α
1) for the sprayed FRP system in Equation (4) (JBDPA) were distributed in the range of 0.93–2.25, and the average value was 1.51. The coefficients of strength reduction (α
2) in Equation (5) (AIJ) had a lower limit value of 0.35, an upper limit value of 0.48, and an average value of 0.41.
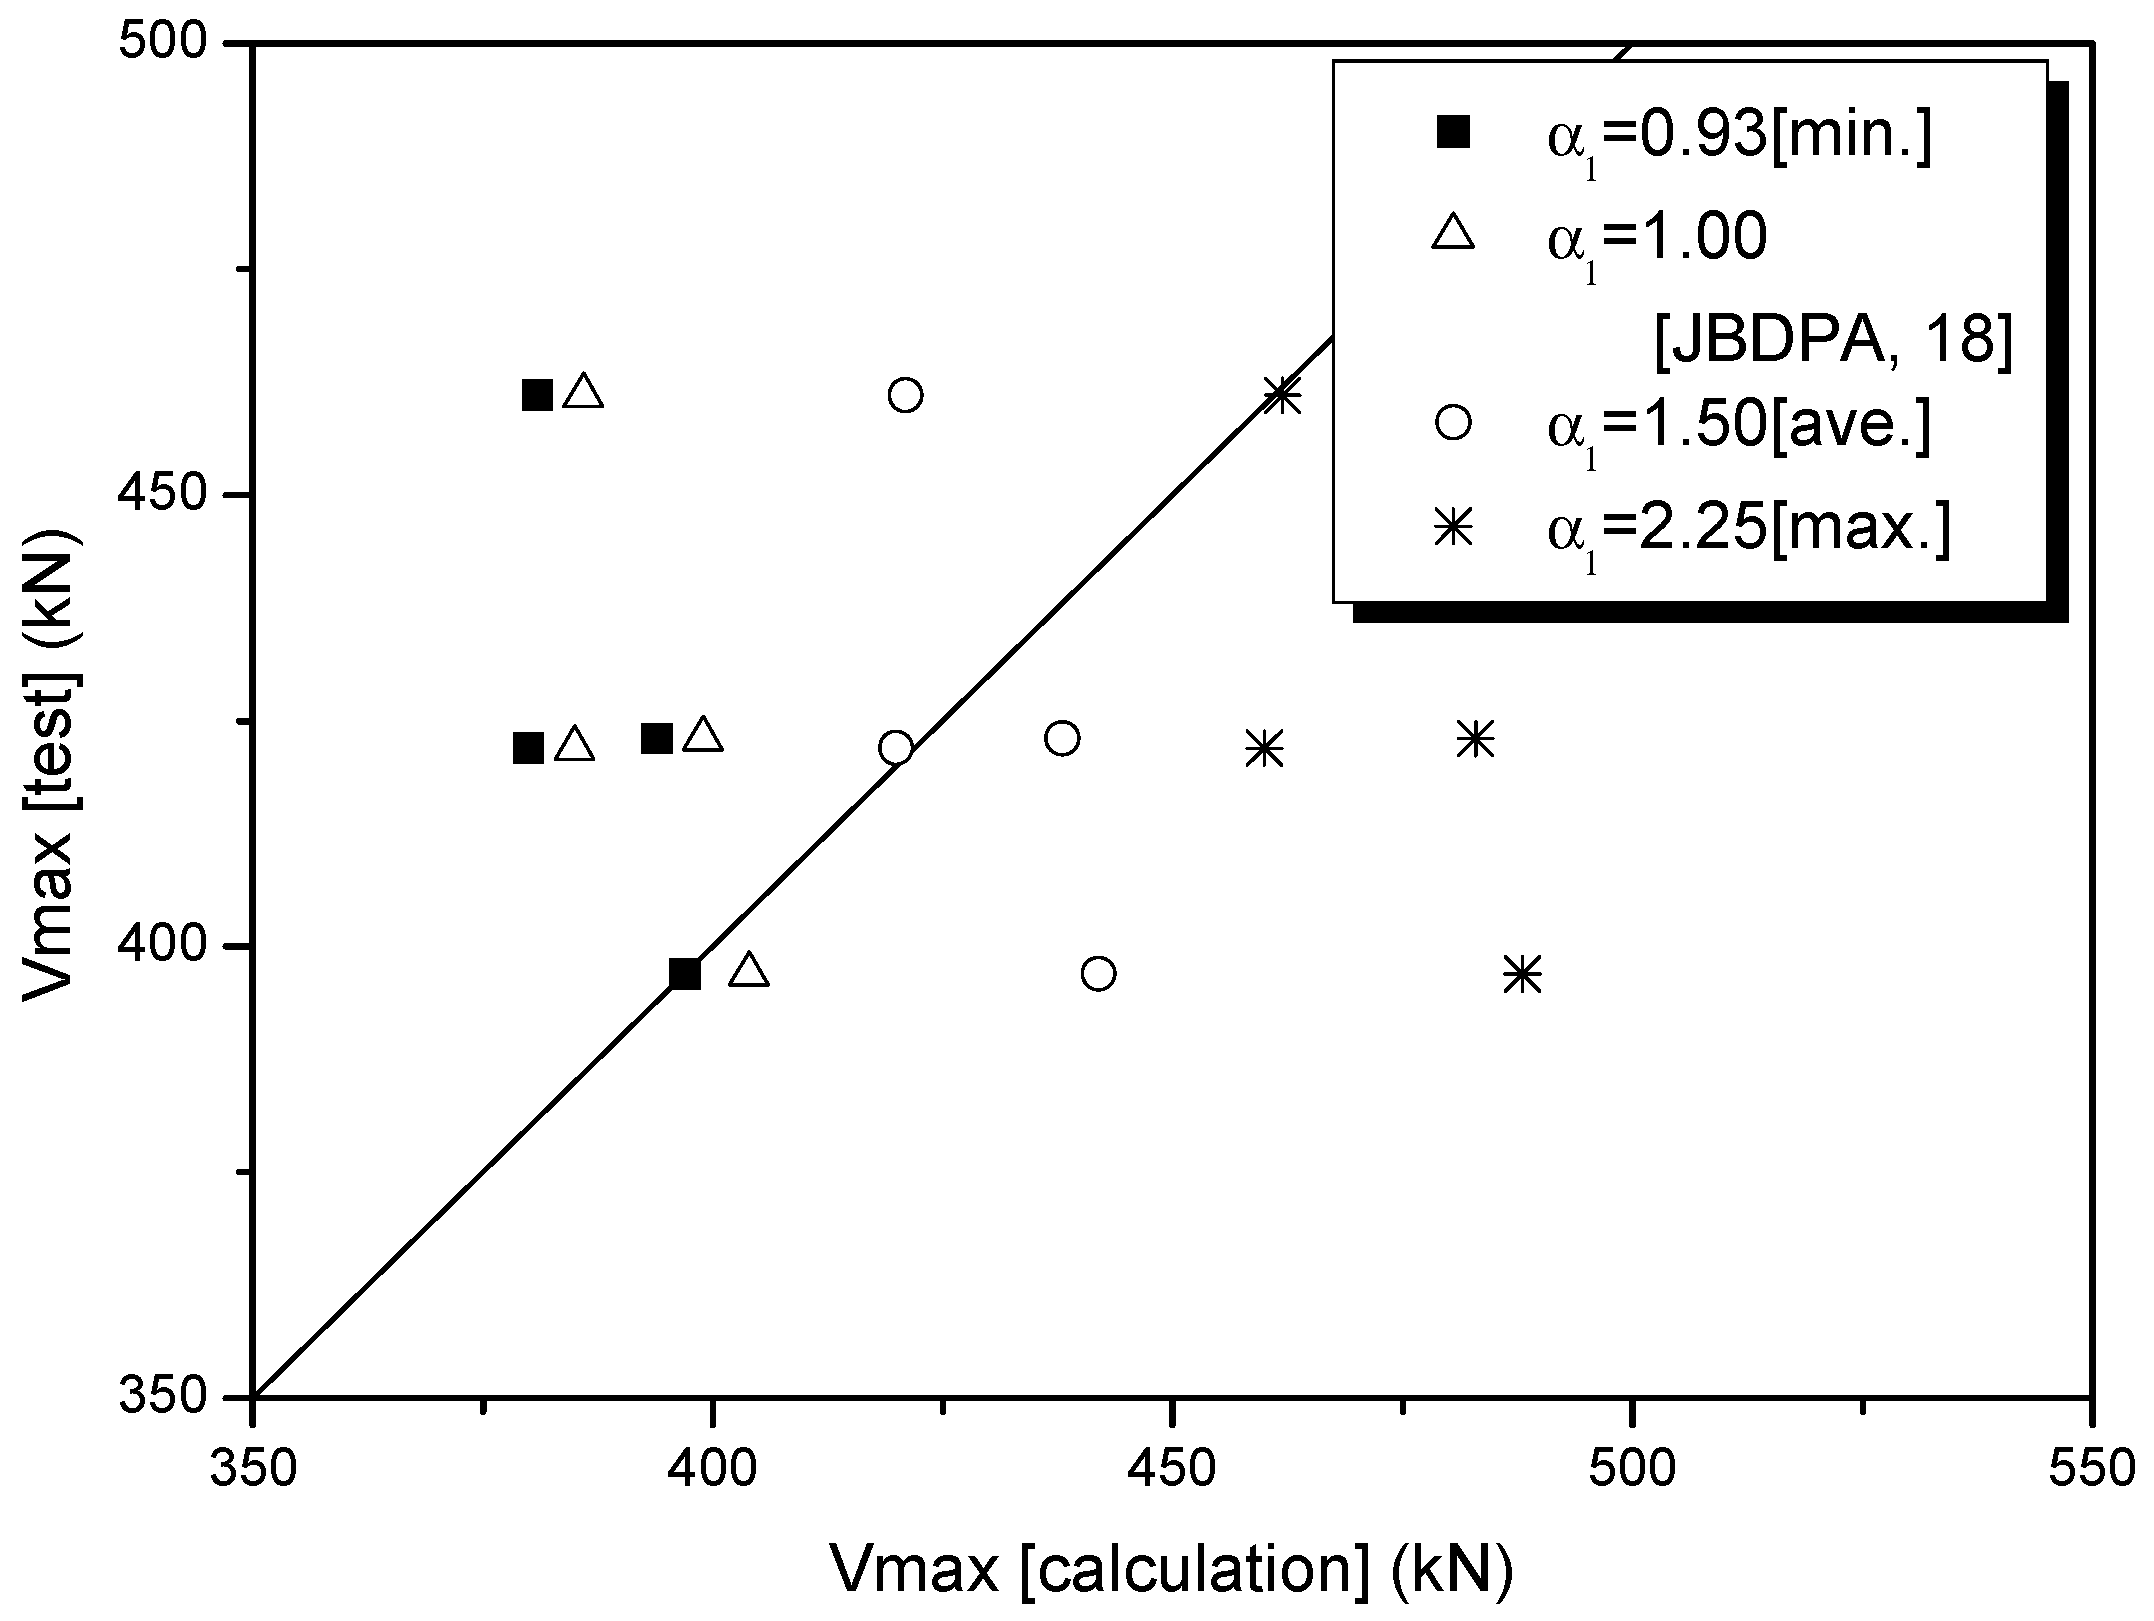
Table 12 and
Figure 16 show the relationship between the test values of
Vmax (test) and the theoretical values of
Vmax (calculation), which were computed by applying each of the values for α
1 (JBDPA), the proposed coefficient of shear strength reduction in
Table 11: α
1 = 1.51 (average α
1 value); the minimum value of α
1 = 0.93, and the maximum value of α
1 = 2.25, together with α
1 = 1.0, as proposed by Kang [
37].
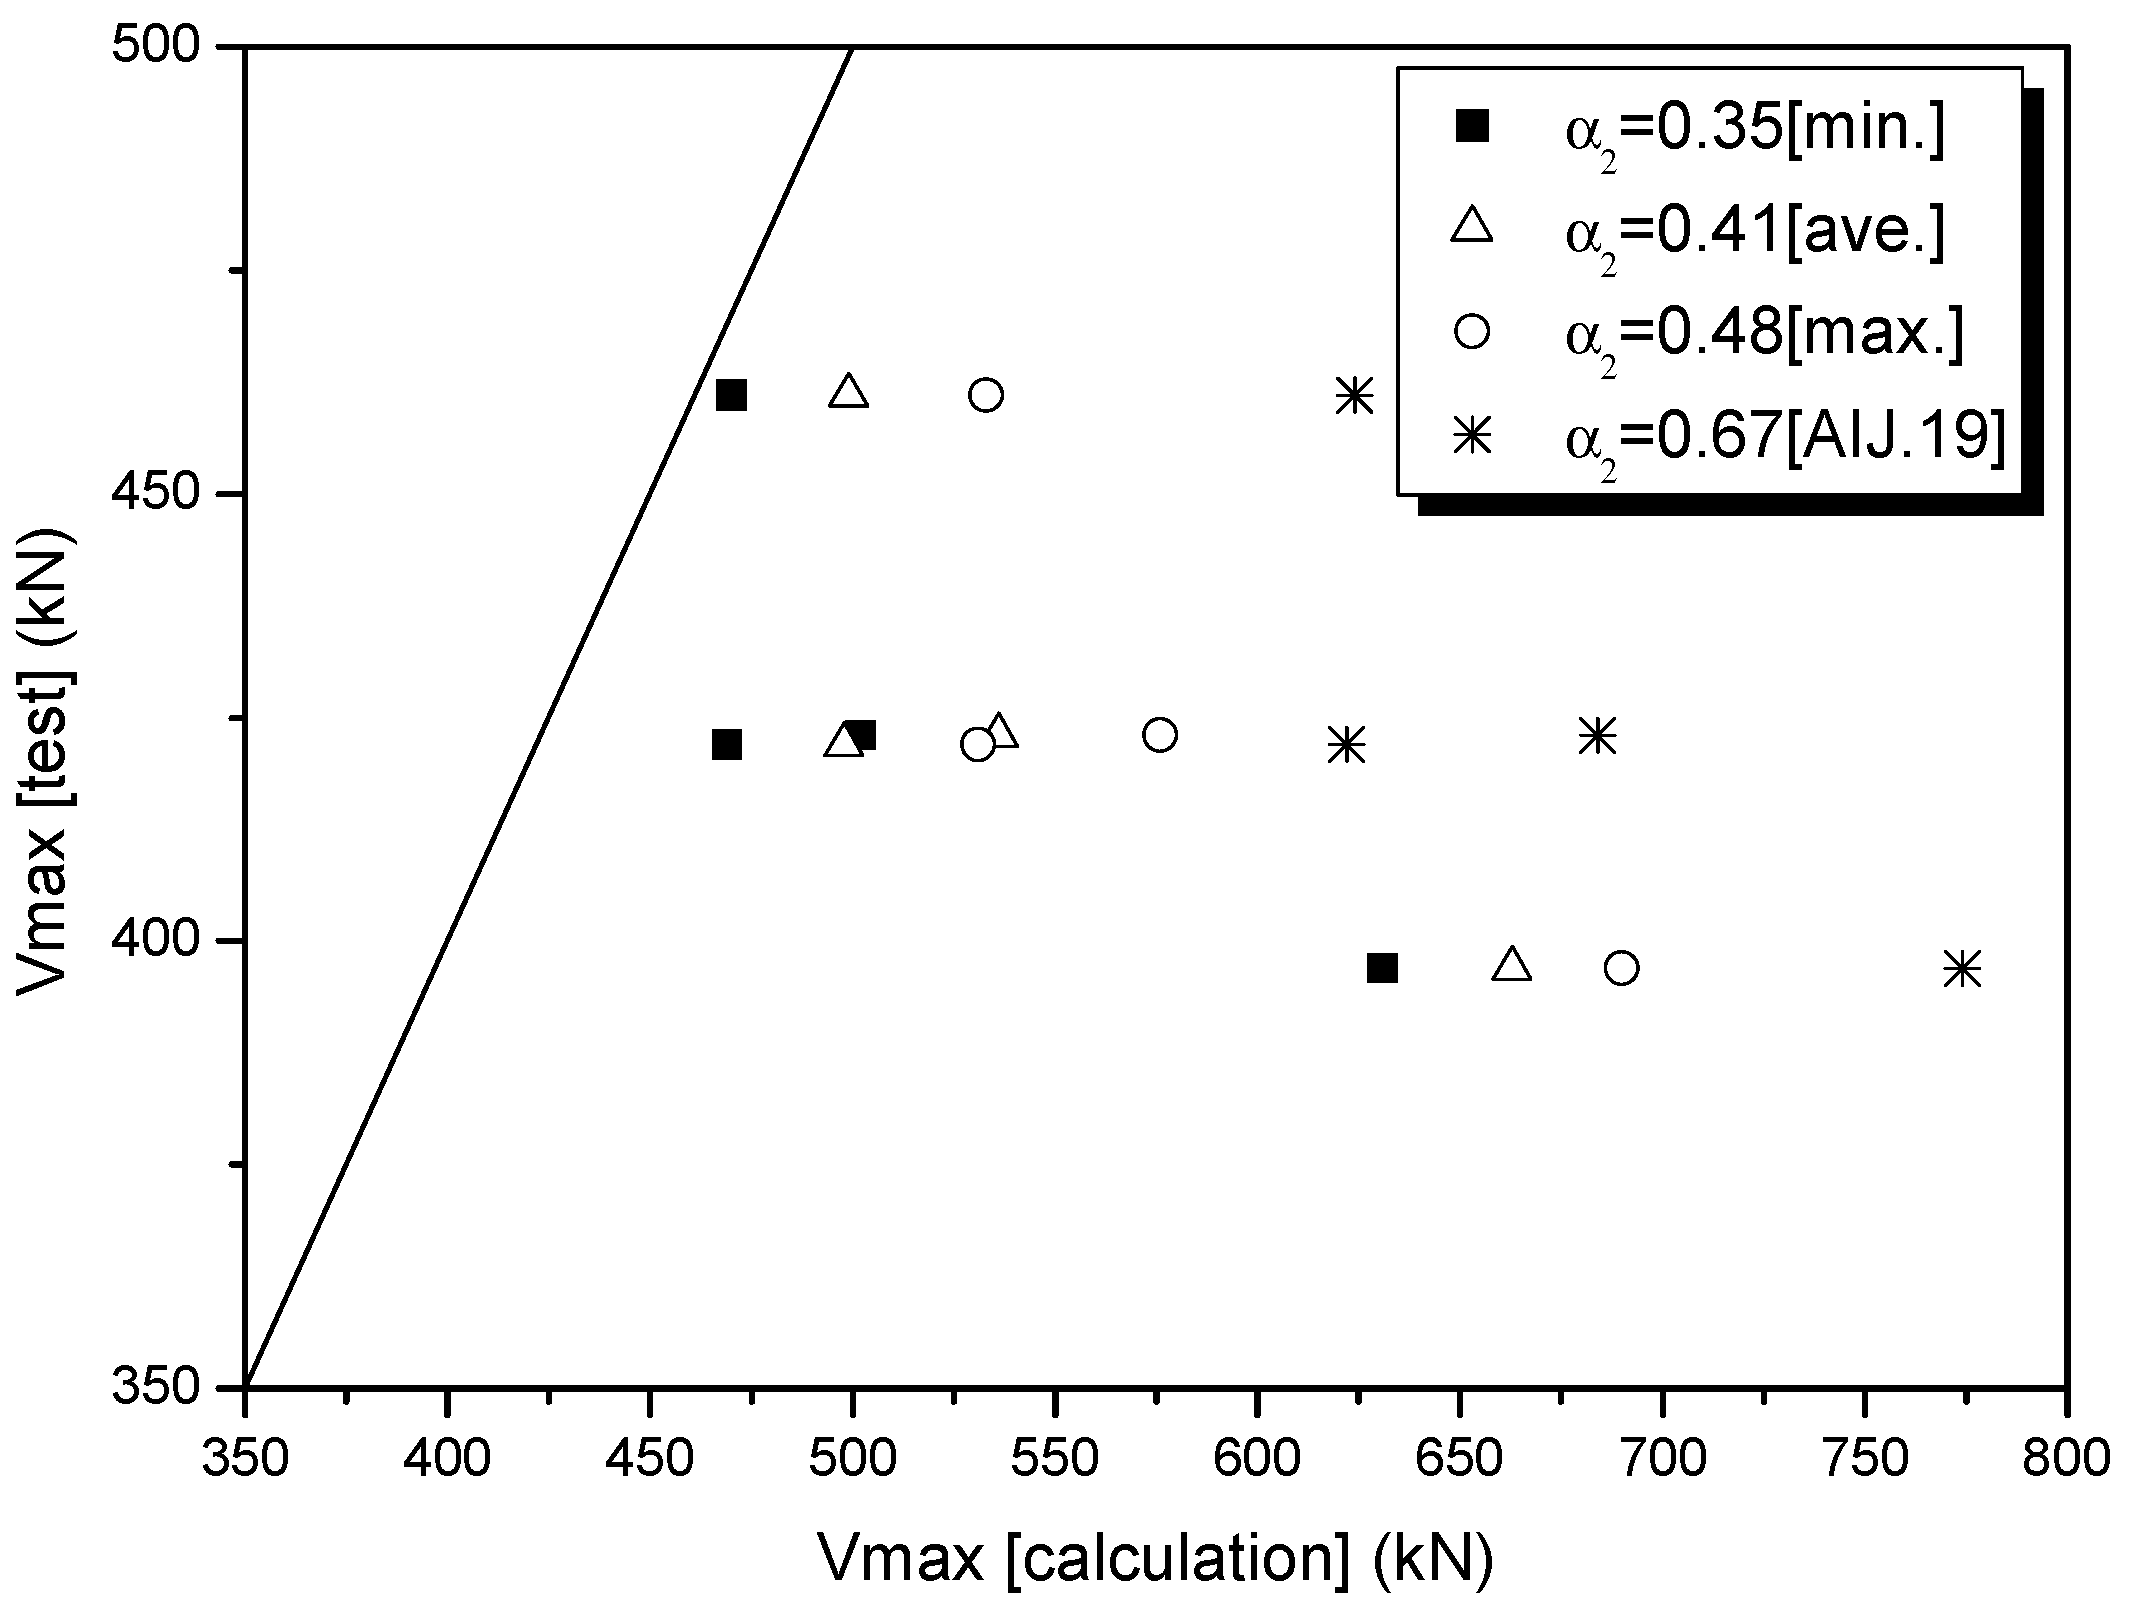
Table 13 and
Figure 17 show the relationship between the test values of
Vmax (test) and the theoretical values of
Vmax (calculation), which were computed by applying each of the values for α
2 (AIJ), the proposed coefficient of shear strength reduction in
Table 11: α
2 = 0.41 (average α
2 value); the minimum value of α
2 = 0.35, and the maximum value of α
2 = 0.48, together with α
2 = 0.67, as proposed by the AIJ [
36].
Test results using the sprayed FRP technique against shear failure in columns indicated that the coefficient of shear strength reduction (α
2) in the existing equation specified by the AIJ [
36] tended to over-estimate the value of
Vmax (test) compared with α
1 (JBDPA) [
35]. Considering the safety of seismic capacity for the shear strengthening of columns, in the sprayed FRP retrofitting method, the shear strength equation calculated using α
1 = 0.93 (specified by the JBDPA) is the most practical theoretical equation.


