Article

Production and Characterization of Xanthan Gum from Low-Quality Dates of Different Cultivars as a Fermentation Substrate

by
Reem A. Altwijri
,
Abdellatif A. Mohamed
,
Suleiman A. Althawab
,
Hany M. Yehia
,
Abdulrahman Alahmed
and
Shahzad Hussain
*
Department of Food Science and Nutrition, King Saud University, Riyadh 11451, Saudi Arabia
*
Author to whom correspondence should be addressed.
Polymers 2026, 18(17), 2074; https://doi.org/10.3390/polym18172074
Submission received: 13 July 2026 / Revised: 20 August 2026 / Accepted: 25 August 2026 / Published: 26 August 2026
(This article belongs to the Section Circular and Green Sustainable Polymer Science)

Abstract

Approximately 5–33% of the dates growing in Saudi Arabia are downgraded to low-quality fruit that either goes to waste or is used to make animal feed, which is considered a potential feedstock abundant in sugar. By a thorough comparative study, this study evaluated the up-cycling of low-quality Saudi dates (Wannana, Shagra, Sabbaka, Barhi, Saqai, Khalas and Sukkari) as fermentation substrates for xanthan gum production by Xanthomonas campestris. Pure glucose, pure sucrose, and a commercial standard were used as a baseline. The sole carbon source was date juice (≈12.5–17 °Brix) in a batch aerobic fermentation conducted at the standard conditions of temperature (30 °C), speed 180 rpm, and time (120 h). The xanthan gum was quantified and tested for its properties like functional groups (FTIR), color, thermal behavior (TGA and DSC), and rheology in the form of both steady- and dynamic-shear rheology. Xanthan gum was produced in the range 5.60–7.77 g L−1 by the date-based substrates with Barhi (7.77 g L−1) and Saqai (7.58 g L−1) surpassing those of the glucose (6.68 g L−1) and sucrose (6.23 g L−1) controls. FTIR spectra of date-derived gums were almost identical to that of the commercial standard, indicating that their functional groups and the primary structure were very similar. In addition, the date-derived powders were darker and yellower (L* 61.09, 71.00; whiteness index 54.92, 63.34) than the commercial gum (L* 84.71; whiteness index 78.19). This is likely attributed to the presence of residue date pigmentation and products of Maillard and caramelization. Thermogravimetric analyses revealed that the breakdown of materials occurred in two stages, of which the char residue of the date-derived gums was much higher for those degraded at 500 °C (48.93, 54.05%) versus that of the commercial reference (33.49%), which is to be interpreted as a better ability of the former to resist thermal degradation. All solutions acted as pseudoplastic, shear-thinning liquids (flow behavior index n < 1); the consistency coefficient (K) rose with concentration and fell with temperature. The activation energy varied between 9.98 kJ mol−1 (commercial) and 29.39 kJ mol−1 (Saqai). Overall, low-quality Saudi dates can be considered a technically and economically viable, sustainable, and low-cost carbon substrate suitable for upcycling to produce xanthan gum, which is safe for use as a food additive.

1. Introduction

Upcycling, a concept increasingly used in the food business, denotes the process of transforming byproducts or waste materials into new goods of superior value, rather than recycling them into materials of equivalent or worse quality [1]. The primary distinction between upcycling and recycling resides in their capacity to enhance value. Recycling emphasizes the transformation of waste into raw materials or products of equivalent or lower value. This is more advantageous than conventional materials, as it not only minimizes waste but also creates new market opportunities, particularly in sectors such as food production, where waste can be transformed into high-value materials or functional products [2].
Originating in the Arabian Peninsula, the date palm (Phoenix dactylifera L.) is the oldest tree cultivated, with a history of consumption spanning over 7000 years. It is a member of the Arecaceae (Palmae) family [3]. Dates are the principal fruit grown in the Kingdom of Saudi Arabia. Dates contain carbohydrates (glucose, fructose, and sucrose) [4,5] as well as other components such as minerals, proteins, fats, and vitamins, all of which are necessary components of a well-balanced diet [6,7]. Dates have traditionally been an essential component of the bulk of Middle Eastern diets [8].
Date production is vital to the economies of numerous countries, especially in the Middle East and North Africa. However, not all dates produced are of outstanding quality for direct consumption. Approximately 50% of cultivated dates produced in Iran are deemed low-quality and are typically utilized as animal feed or dumped as garbage, resulting in significant environmental and economic repercussions [9], while another study reported that low-quality dates waste accounts for 10–15% of the total production [10]. El-Habbab et al. [11] reported losses of 5–33% across different varieties of Saudi dates (Khalas, Shishi, Sukkary, Segae, Shagra, Berhi, and Ajweh) in various regions of Saudi Arabia.
Recently, natural polysaccharides have gained popularity among companies and consumers for their biodegradability, nontoxicity, and biocompatibility compared to synthetic or chemical polymers [12]. Microbially derived polysaccharides are safe, biodegradable, and environmentally benign. They also maintain their activity in the presence of extremes in pH, salinity, and temperature [13]. There have also been reports of genetically altered microorganisms being used to produce novel goods with unique features [14].
Industrial production of microbial polysaccharides such as pullulan, curdlan, scleroglucan, dextran, and xanthan occurs under controlled bio-fermentation conditions for commercial use [15,16,17,18,19]. Xanthan gum, a microbial polysaccharide produced by Xanthomonas campestris thru fermentation, is a key biopolymer used in the food industry due to its thickening and stabilizing abilities [20,21,22,23]. This polymer exhibits unique gel and viscous solution formation during fermentation [24]. The high molecular weight, rheological properties, and water-solubility of xanthan gum make it useful in various industries, including food, pharmaceutical, cosmetic, and petroleum and oil [23,25,26].
Traditionally, xanthan gum manufacturing relies on glucose or sucrose as substrates, which will drastically increase its manufacturing cost [21]. The excessive use of xanthan gum in the food industry, combined with growing pressure to lower production costs, has sparked interest in alternative, low-cost substrates, including agricultural waste. In this context, low-quality dates, which can be wealthy in sugars, constitute a valuable resource for xanthan gum manufacturing through microbial fermentation [22].
Therefore, the problem of overuse of low-quality dates can be solved by upcycling. This is the process of turning waste materials into higher-value products. In the case of low-quality dates, it is used as a fermentation substrate for gum production. Therefore, it creates a sustainable and economically viable alternative to conventional substrates [26,27]. This upcycling method aligns with global sustainability goals, reduces the environmental impact of agricultural waste and provides a cost-effective method of Xanthan gum production [28]. The aim of this research is to explore the potential of upcycling low-quality Saudi dates into xanthan gum. The specific objectives of the current work were to explore the use of low-quality dates as a cost-effective substrate whilst systematically correlating the composition of the substrate with yield, physiochemical properties and rheological nature of the resultant polymer to compare it with commercial xanthan gum. This will help to reduce waste and produce commercially valuable products. The production and characterization of locally produced xanthan gum from food waste will open the door to its commercial production and application in the local and international food, pharmaceutical, petroleum, and other sectors.

2. Materials and Methods

2.1. Materials

This research utilized low-quality dates from seven selected varieties (Wannana, Shagra, Sabbaka, Barhi, Saqai, Khalas and Sukkari) as substrates (as carbon sources) for xanthan gum production. The low-grade raw dates were collected from a local farm in Al-Qassim. The low-quality dates, which are typically discarded or used as animal feed due to their poor quality, are ideal candidates for upcycling in this fermentation study. Xanthomonas campestris (MTCC, 2286) obtained from Microbial type Culture Collection and Gene Bank of Institute of Microbial Technology, Chandigarh, India was used to ferment the substrate for the xanthan gum production. Pure sucrose and glucose were also used as control substrates.

2.2. Substrate Preparation, Microorganism and Culture Media

After being sorted, the dates were pitted and the fleshes were washed and ground into a slurry using of a mechanical grinder. The date juice was prepared by adding water to the date paste at a ratio of (3:1, v/w). The date paste–water mixture was gently boiled for 15 min with continuous stirring. About 2.5 L of date juice were obtained from 1 kg of date. The soluble solids content (°Brix) of the date juice was recorded between 12 and 18 °Brix, which was then used to adjust the sugar concentration in the production media. It was determined at 25 °C using a handheld refractometer (Erma, Tokyo, Model No. 50010).
The preparation of the inoculum was performed by the transfer of the microorganism from the stock solution to the Yeast Mold agar plates (YM agar) and its subsequent incubation for 48 h at 30 °C. A loopful of cells from the (YM) plates was then transferred to a 250 mL conical flask containing 100 mL of the sterile YM medium and incubated for 24 h at 30 °C and 180 rpm. This was ultimately used as the inoculum. Fermentation was carried out in 500 mL Erlenmeyer flasks, each of which contained 250 mL of the sterile production medium. The medium was inoculated with 5% (v/v) of the X. campestris culture.
The medium used for the growth and maintenance (YM agar) contained (g/L): glucose, 46.6; peptone, 5; yeast extract, 3; and agar, 17 (pH 7). Bacterial cells in agar slants were incubated for 48 h at 30 °C and then stored at 4 °C for further use. The medium used for xanthan gum production contained (g/L): sugar,12 g (either adjusted from date juice or sucrose/glucose); KH2PO4, 5; MgSO4, 0.2; (NH4)2SO4, 2.7; citric acid, 2; H3BO3, 0.006, ZnCl2, 0.006; FeCl3, 0.0024 and CaCO3, 0.02. The pH was measured at 20 °C using a Corning Model5 pH meter (Corning Scientific Instruments, New York, NY, USA) and adjusted to 7 by the addition of NaOH (1 M). The solutions were sterilized for 20 min at 121 °C.

2.3. Xanthan Gum Production

A modified method followed by Salah et al. [29] was used to optimize the fermentation procedures. Xanthan was produced (3 independent batches) using batch aerobic fermentation on an orbital shaker at 30 °C and 180 rpm for 120 h. Once the fermentation was complete, the culture broth was subjected to a series of purification steps to isolate the xanthan gum. The fermentation broth was centrifuged at 10,000 rpm for 20 min to remove microbial cells and other solid impurities. The clear supernatant containing the xanthan gum was mixed with absolute ethanol at a 1:2 ratio (supernatant to ethanol) to precipitate the xanthan gum. The mixture was then left to stand for several hours to allow complete precipitation. The precipitated xanthan gum was filtered and washed with additional ethanol to remove residual impurities. The produced xanthan gum was air-dried at 40 °C, and the dried product was ground into a fine powder and stored in airtight jars for further analysis [30].

2.4. Characterization of Xanthan Gum

2.4.1. Extraction Yield

The yield of the gums was calculated as the dry weight of the gum powder relative to the volume of the substrate and expressed as g/L.

2.4.2. Fourier-Transform Infrared Spectroscopy (FTIR)

The FTIR spectrum of the gums was generated using a Bruker ATR–FTIR Spectrometer. The spectra were obtained between 600 and 4000 cm−1. The data was plotted as wavelength vs transmittance% using Sigmaplot 10.0 software.

2.4.3. Color Analysis

Color was measured using a SATAKE color grader (NCGA, Higashi-Hiroshima, Japan), using the D65 color source. Color values like L*(Lightness), a* (Redness) and b* (Yellowness) of gum samples were determined. L* = 0 or 100 indicate black and white respectively; a* the axis of chromaticity between green (−) to red (+), and b* the axis between blue (−) to yellow (+).

2.4.4. Differential Scanning Calorimeter (DSC) Conformational Changes

Thermal analysis was carried out using differential scanning Calorimeter (Q 2000, TA instruments, New Castle, DE, USA). The enthalpies associated with conformational changes were determined for different xanthan gum powders during heating ramp of 10 °C/min from 25 to 225 °C.

2.4.5. Thermal Stability of Gum Powders

Thermal stability of the gum powders (5–10 mg) was analyzed using a thermogravimetric analysis (TGA) (TA Instruments, New Castle, DE, USA) using 30 °C heating rate in the temperature range between 30 and 500 °C using the method followed by [31].

2.4.6. Rheological Measurements

Steady Shear Rheology
Hydrocolloid solutions at different concentrations (0.25, 0.50, 0.75, and 1%) were prepared by adding the powdered gum in distilled water and then vigorously stirring at 60–80 °C. The solutions were stirred for 2–3 h to ensure complete solubilization. Volume adjustment was made after cooling the solutions to room temperature. The gum solutions were subjected to steady shear behaviors (shear rate vs. shear stress) at different concentrations and temperatures (20, 30, 40 °C) at varying shear rates from 1 to 100/s.
Equation (1) was used to fit the data obtained from all the measurements to the power law model.
τ = k Υ n
where τ = shear stress (10 dyn/cm2), k = consistency coefficient (Pa sn), γ = shear rate (s−1), and n = flow behavior index (dimensionless).
Equation (2) was used to determine the temperature dependency of the samples. The viscosity data obtained at different temperatures was fitted in Equation (2) according to the method followed by Mohamed et al. [32].
lnK = lnK0 + (Ea/R)(1/T)
R = Universal gas constant (8.314 J mol−1 K−1)
T = absolute temperature (K)
K (Pa sn) = power law consistency index representing the consistency or apparent viscosity of the xanthan solutions
K0 (Pa sn) = is the frequency factor at a reference temperature (20, 30 and 40 °C), and is obtained from the intercept of the Arrhenius plot
Ea = Energy of activation
Dynamic Rheology
The dynamic rheological testing was performed using a Dynamic Hybrid Rheometer (DHR) (TA Instruments, New Castile, PA, USA). Frequency sweep testing was done at an angular frequency ranging from 0.1 to 50 rad/s and a strain of 5%. The energy contained in the material and recovered from each cycle was measured by the storage dynamic modulus (G′), whereas the energy lost (dissipated) every cycle of sinusoidal deformation was calculated as the loss modulus (G″). Tan δ defines the ratio of energy stored to lost energy for each cycle.

2.4.7. Statistical Analysis

The Data was collected in triplicate and reported in the tables as means ± sd. The data was analyzed using the one-way analysis of variance (ANOVA) technique. The Duncan’s Multiple Range (DMR) test at p ≤ 0.05 was employed to compare means using SPSS (PASW® Statistics 18) software.

3. Results and Discussion

3.1. Composition of the Date Juice Substrates

The soluble-solids content and sugar profile of the date juices prepared from the seven cultivars are summarized in Table 1. The total soluble solids ranged from 12.5 °Brix for Khalas to 17.0 °Brix for Sukkari. This wide range reflects cultivar-dependent differences in ripening stage, moisture content, and flesh-to-water extraction behavior during juice preparation. Despite this spread in °Brix, the fermentable-sugar content of the juices was relatively uniform. Glucose and fructose together account for the bulk of the dissolved carbohydrates in every cultivar. Glucose contents ranged from 5.00% (Sukkari) to 8.84% (Wannana), while fructose contents varied between 4.69% (Sukkari) and 8.83% (Sabbaka).
However, the near-equimolar distribution of glucose and fructose in six of the seven cultivars (Barhi, Saqai, Wannana, Sabbaka, Shagra and Khalas), coupled with negligible sucrose (0.00–0.12%), is considerable. This ≈ 1:1 glucose-to-fructose ratio is the fingerprint of invert sugar and indicates that the sucrose present natural in the fruit had been completely hydrolysed into its constituent monosaccharides by endogenous invertase during the advanced (tamr) stage of ripening [6,8]. Sukkari was the exception; it kept 6.91% sucrose alongside lower glucose (5.00%) and fructose (4.69%) fractions, a compositional signature consistent with the soft, semi-dry character of this cultivar, in which sucrose inversion is less complete.
From a fermentation standpoint, this composition is highly favorable. X. campestris preferentially and rapidly assimilates glucose, and to a lesser extent fructose, for growth and xanthan biosynthesis. Therefore, the predominance of readily fermentable monosaccharides in the date juices minimizes the need for prior hydrolysis and renders these substrates directly usable as carbon sources [22,29]. On the other hand, with regard to simple sugars, date juice is also a natural reservoir of minerals, nitrogenous compounds, and vitamins [6,7]. It can act as a supplementary growth factor during fermentation. Collectively, these findings confirm that low-quality dates, irrespective of cultivar, furnish a sugar-rich medium well suited to microbial xanthan production.

3.2. Production Yield and Composition of the Recovered Solids

The raw yeild representing the total solids including protein residues, ash and mositure, polymer obtained from the different substrates after 120 h of fermentation are presented in Table 2. The range of ash content was from 12.60 ± 0.13 to 16.51 ± 0.85%, while protein content varied from 0.68 ± 0.06 to 1.54% for all lab-grown samples. With respect to commercial xanthan gum (7.52 ± 0.77% ash and 0.17 ± 0.03% protein), these higher contents indicate that small quantities of inorganic and non-polysaccharide components could not be completely eliminated after recovery. It has been theorized that residual ionic species may alter xanthan chain conformation and thus affect rheological properties, while relatively low protein levels are unlikely to play a significant role [33]. The rehogical data presented in later sections also suggest that samples with higher ash value reprented relatively low consistancy coefficients. However, as individual minerals and protein fractions were not characterized, these specific effects on rheological properties cannot be determined unequivocally.
Yields from the date-based media ranged from 5.60 g L−1 (Khalas) to 7.77 g L−1 (Barhi). The substrates were ranked as follows: Barhi > Saqai (7.58) > Sukkari (7.25) > Sabbaka (7.22) > Shagra (6.97) > Wannana (6.45) > Khalas (5.60). It is noted that five of the seven date cultivars matched or surpassed the pure-sugar controls, glucose (6.68 g L−1) and sucrose (6.23 g L−1). Specifically, Barhi and Saqai out-yield both reference substrates by a clear margin. This finding demonstrates that a low-value waste stream can rival, and even exceed, the refined sugars conventionally used for industrial xanthan production.
The competitive performance of the date media is attributable to their compositional richness. Whereas glucose and sucrose supply carbon alone, date juice concurrently provides fermentable monosaccharides together with minerals, free amino nitrogen, and vitamins that act as growth promoters for X. campestris. All these processes support denser biomass and more efficient exopolysaccharide biosynthesis [6,26]. The highest-yielding cultivars, Barhi and Saqai, were also among those with the greatest combined glucose-plus-fructose content, which is consistent with the well-established dependence of xanthan productivity on the availability of readily assimilable carbon [14,34].
Since the sugar concentration of date juices was standardized in the media, the comparatively low yield from Khalas juice (5.60 g L−1) may be due to the consequence of intrinsic inhibition caused by the presence of nitrogenous compounds, minerals, and other minor nutrients, which may affect bacterial growth and xanthan biosynthesis. The yields recorded in our study are in broad agreement with, and in several instances exceed, those previously reported for xanthan gum produced from date syrup and date by-products [9,22,29]. At the same time, they are comparable with values obtained from other agro-industrial substrates such as grape and olive pomace, kitchen waste, and confectionery wastewater [28,35,36,37]. These results confirm that low-quality Saudi dates constitute an efficient and economically attractive substrate for xanthan gum fermentation. Since the concentration of residual sugars (glucose, fructose, sucrose) after the fermentation were not determined, the reported xanthan values are indicative of product yield rather than conversion efficiency. This is the limitation of the current research; therefore, future studies should assess sugar consumption to more accurately gauge substrate utilization.

3.3. Color Analysis of Xanthan Gum Powders

The color parameters (L*, a*, b*), total color difference (ΔE), and whiteness index (WI) of the xanthan powders are reported in Table 3. A statistically significant variation was observed between the gums fermented on date juice and the pure sugar and commercial references. The commercial standard was the brightest and most neutral sample (L* 84.71, a* −0.02, b* 15.55) and possessed the highest whiteness index (WI 78.19), followed by the sucrose-derived gum (L* 82.81, WI 69.17). By contrast, all date-derived powders were appreciably darker (L* 61.09–71.00), more reddish (a* 4.00–7.86) and more yellow (b* 19.13–25.44), with correspondingly lower whiteness indices (WI 54.92–63.34) and large total color differences (ΔE 17.37–25.00) relative to the reference.
Among the date cultivars, Sukkari yielded the lightest powder (L* 71.00), whereas Shagra (L* 61.09) and Saqai (L* 62.30) produced the darkest. Khalas exhibited the most intense chromaticity, recording the highest a* (7.86) and b* (25.44) values and the most saturated red-yellow hue. The pronounced yellow-brown coloration of the date-based gums may be attributable to two factors: first, the co-precipitation of native date pigments (carotenoids, polyphenols, and their oxidation products) that are extracted into the juice and carried through fermentation into the recovered biopolymer. Second, the formation of colored Maillard and caramelisation products generated from the abundant reducing sugars during the boiling step of juice preparation and subsequent processing [6,10]. The comparatively whiter sucrose-derived gum supports this interpretation, since sucrose is a non-reducing disaccharide and is therefore far less prone to Maillard browning than the reducing-sugar-rich date juices or the glucose control (L* 69.93). The other factors that relate to potential binding of substrate-derived pigments with xanthan polymer matrix could also contribute. Since pigment–polymer interactions and measurements of trace metal ions were not assessed in this study, it is unclear how much these factors contribute to the final color. Overall, more studies with adequate control experiments including pigment removal before fermentation and elemental analysis are needed to clarify the relative roles of these mechanisms in color development.
It should be emphasized that this coloration is a purely aesthetic and purification-related attribute and does not reflect any change in the chemical identity of the polymer. Comparable pigment carry-over has been reported for xanthan gum synthesized on other colored agro-industrial substrates, where the depth of color is governed largely by the extent of downstream purification [37,38]. For applications demanding a white product, the colour of the date-derived gums could be readily reduced by an additional decolourisation step, like activated-carbon treatment or repeated ethanol washing, without compromising the functional properties established in the following sections.

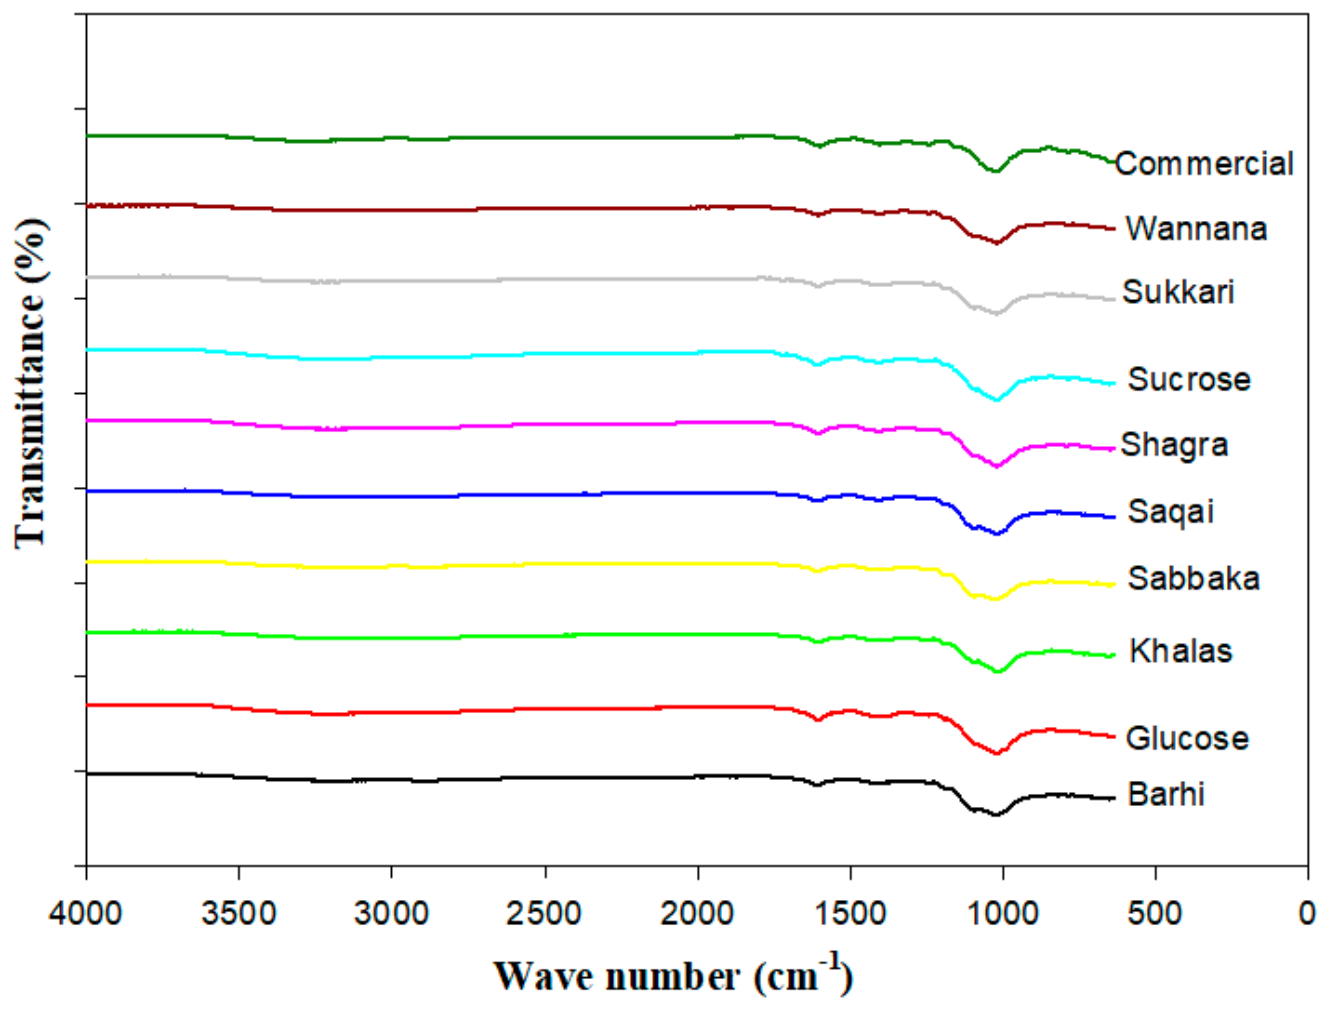
3.4. Fourier Transform Infrared Spectroscopy (FTIR) Analysis

The Fourier-transform infrared (FTIR) spectroscopic evaluation of xanthan gum powders produced from different substrates of date cultivars, pure sugars (glucose and sucrose) and the commercial standard are presented in Table 4 and Figure 1. It can be observed that all the samples had very similar spectral patterns, which completely confirms the existence of the functional groups specific to xanthan gum macromolecules. The spectra have shown the absorption bands at 782–789 cm−1 (related to vibrations of pyranose ring), 1014–1019 cm−1 (associated with C–O–C, C–O stretching attributed to glycosidic bonds), 1240–1405 cm−1 (characteristic symmetric stretching of COO moieties along with C–H bending and C-O vibrations), 1600–1604 cm−1 (asymmetric stretch for COO- groups), 1714–1715 cm−1 (C=O stretching of acetyl or pyruvate functional groups), 2866–2901 cm−1 (C-H stretching vibrations of methylene groups), and 3192–3234 cm−1 (O-H stretch vibration associated with hydroxyl groups). Importantly, this particular pattern of spectral features is fully consistent with the previously established FTIR profile characteristic for xanthan gum as extensively reported in the existing literature [39,40].
A closer examination of the specific spectral bands reveals that, within the region 3192–3234 cm−1, a very broad and clear absorption band is mainly due to overlapping O–H stretching vibrations. These particular vibrations are primarily attributed to the presence of numerous hydroxyl groups along with the networks of intermolecular and intramolecular hydrogen bonding that are inherent in xanthan polysaccharide matrix [41]. In addition, the distinct absorption band observed at 2866–2901 cm−1 corresponds to symmetric stretching vibrations of aliphatic C–H bonds (probably in connection with the methyl and methylene groups present in both the main structural backbone of xanthan biopolymer and side chains branched from it) [41,42]. A very strong and well-defined absorption band at exactly 1714–1715 cm−1 is assigned to the stretch vibration of carbonyl (C=O) groups present in all samples. These particular groups originate directly from the acetyl and pyruvate ester substituents and have a critical effect on the rheological behavior of the xanthan gum [43]. The band found between 1600 and 1604 cm−1 corresponds directly to the asymmetric stretching vibration of carboxylate (COO) groups from glucuronic acid residues, which correspondingly confirm the inherent anionic character of gum macromolecule structure. The moderately broad absorption region between the wavenumbers of 1240 and 1405 cm−1 is associated with a complex mixture of symmetric COO stretching, C–H bending vibrations, and C–O stretching vibrations linked to the acetyl groups found on the polymer [43,44]. In addition, the absorption band observed at 1014–1019 cm−1 was reasonably connected with the C–O–C stretching vibrations of glycosidic linkages and pyranose rings, representing a spectroscopic integrity of the polysaccharide backbone [45]. Also, the extremely characteristic and distinct absorption band appearing at the lower frequency region of 782–789 cm−1 corresponds directly to the complex vibrational modes from the pyranose ring deep in the highly specific spectral fingerprint area, further providing strong and clear additional evidence of the presence of the characteristic molecular structure for synthetized xanthan gum [35,44].
Certainly, the observations from this spectroscopic examination are the uniformity of all FTIR spectra obtained from our entire experimental sample set. Regardless of whether the xanthan gum biopolymer was biosynthetically produced using a diverse range of date cultivars (namely, Sukkari, Barhi, Saqai, Wannana, Sabbaka, Shagra and Khalas) or produced from simple sugars like glucose and sucrose or even a direct comparison to an industrial standardized xanthan gum, the intrinsic characteristic absorption bands always appeared at very similar and highly reproducible wavenumbers with only minor (<±1–4 cm−1) significant spectral shifts. Therefore, one can confidently conclude that distinct date cultivars’ diverse extracts are able to produce xanthan gum which has the same basic chemical structure as the commercially available xanthan gum produced by using highly purified industrial sugars and other common commercial sources. These detailed and very encouraging analytical results ultimately emphasize the extraordinary biological stability, as well as robustness, of the microbial xanthan biosynthetic pathway, hence providing strong empirical support for future utilization of date juice obtained from various cultivars as an efficient, sustainable, inexpensive and risk-free alternative carbon source for the large-scale industrial production of xanthan gum without endangering its vital molecular compositional or functional properties.

3.5. Thermogravimetric Analysis of the Xanthan Samples

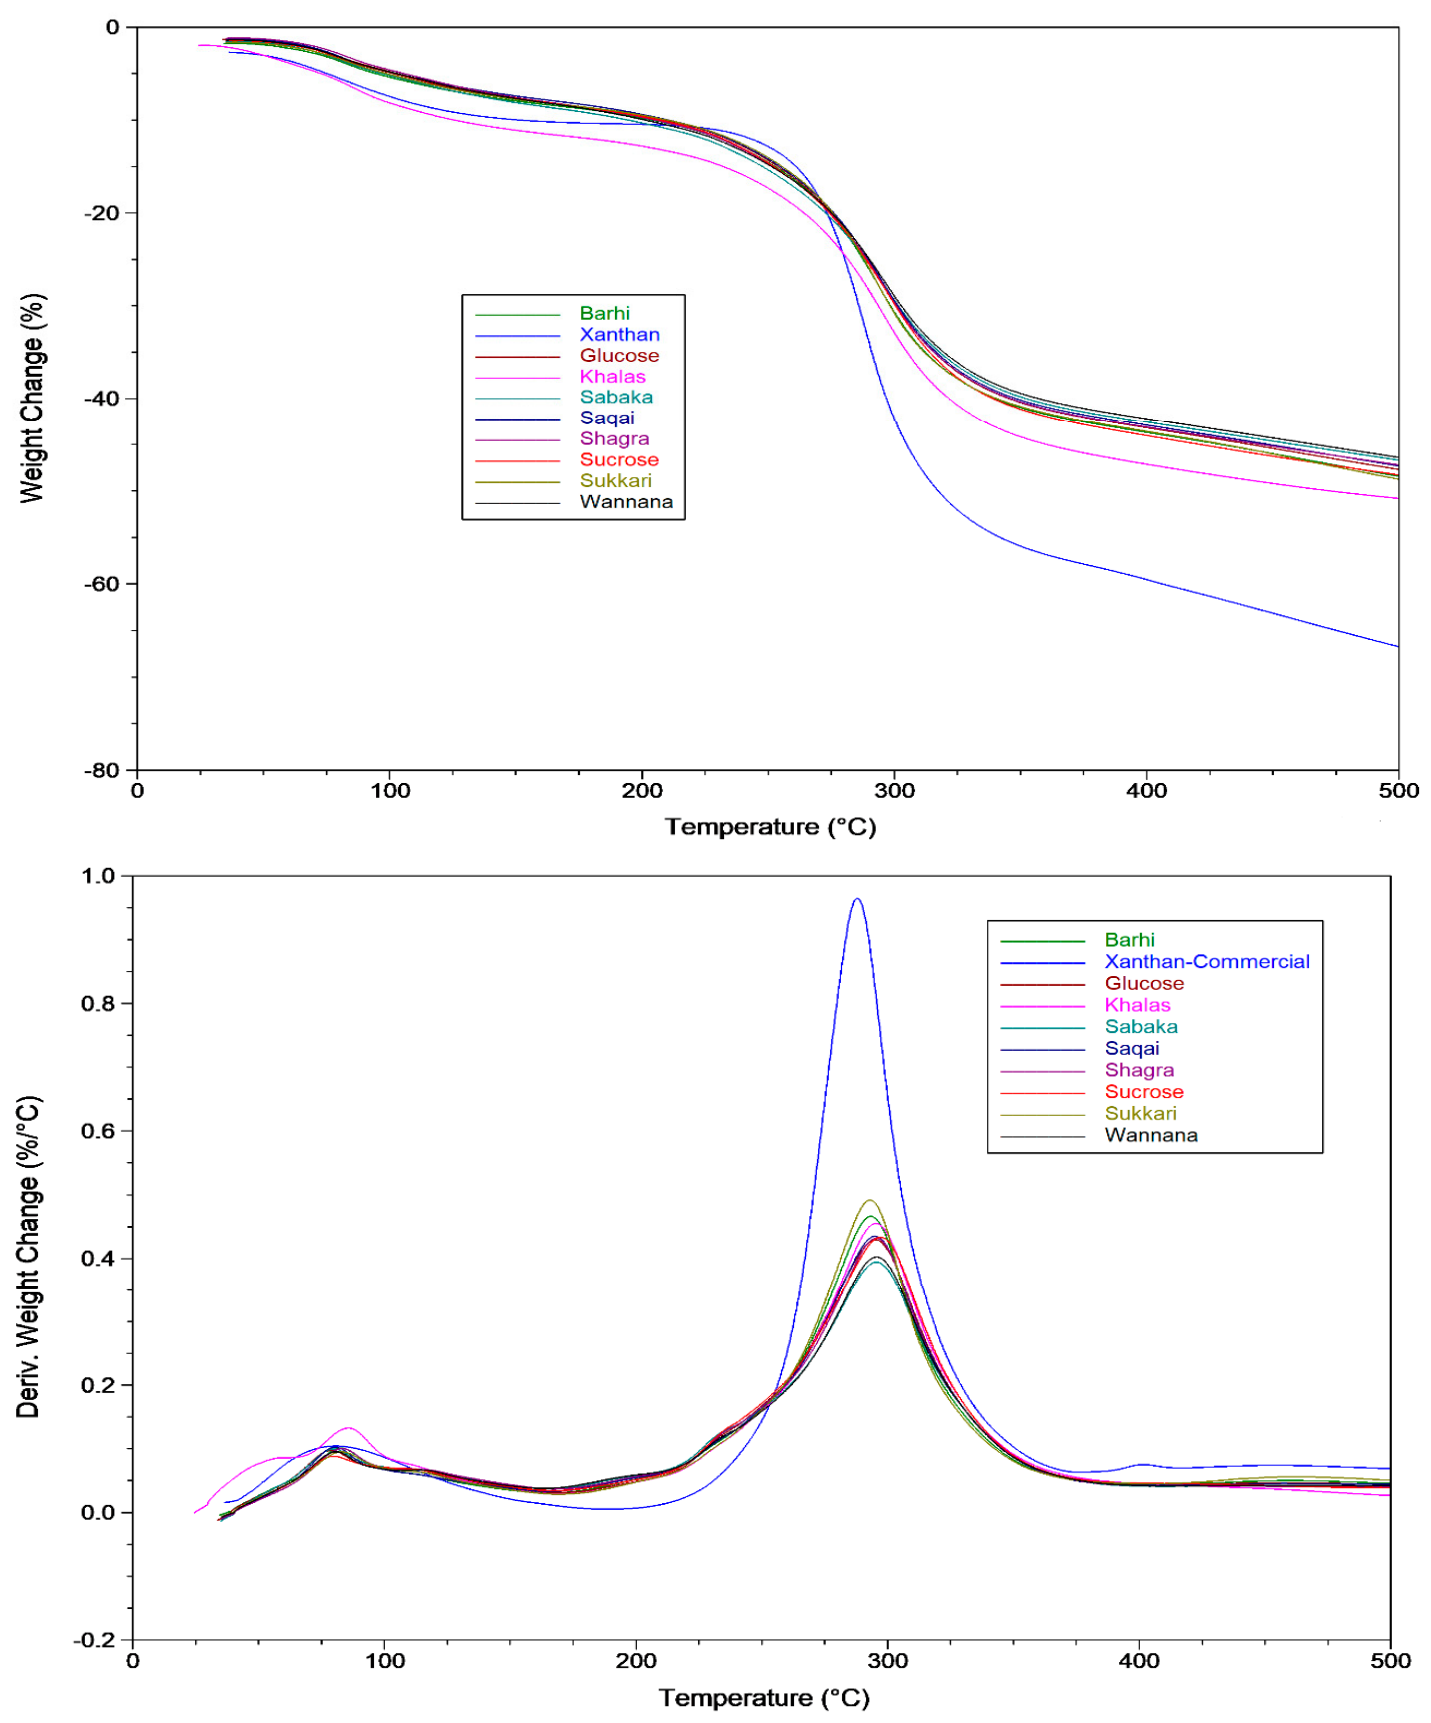
It is evident from the TGA data (Table 5, Figure 2) that all the samples including commercial xanthan followed two stage degradation patterns. All the date-based substrates yielded xanthan gum with a similar pattern of thermal stability. The degradation pattern followed by samples in the current study is the same as that reported by previous studies on xanthan [46,47,48]. Stage 1 (35–170 °C) corresponds to moisture evaporating with low mass loss between 7.61 and 11.17% for Barhi/Wannana and Khalas samples, respectively. The DTG maximum was recorded between 76.04 and 83.02 °C among different samples for the peak 1. The weight loss during stage 1 is related to the evaporation of water molecules (physically adsorbed or bound). The relatively low moisture evaporation from the samples could be linked to the presence of abundant hydroxyl and carboxyl groups making hydrogen bonds with the water molecules and disallowing them to be freely released during the first stage [46,49,50].
The second stage (160–408 °C), corresponding to the DTG peaks between 288.36 and 297.90 °C, showed that the major thermal decomposition of the polymer occurred during this temperature range. Second-stage weight loss (29.08–33.92%) varied little between date-derived samples, showing that the fermentation substrate had a minor effect on decomposition mechanisms. This second stage decomposition is linked with the cleavage of glycosidic linkages, depolymerization of the backbones, decomposition of the acetyl and pyruvate substitutes and finally decarboxylation of the glucuronic residues under the nitrogen environment with the final residue of carbonaceous structures [46,49,51]. The weight loss during the second decomposition was highest in commercial samples (42.89%). The xanthan samples produced from different date varieties presented the higher levels of residues (48.93–54.05%) at 500 °C, presenting a greater thermal resistance under nitrogen. The higher residues in such samples indicate that they possess almost double the quantity of ashes and proteins compared to the commercial sample, as presented in Table 2. The observations were further supported with DTG curves. Date-derived xanthan displayed broader peaks around 293–297 °C (characteristic of gradual, orderly degradation), while the commercial xanthan gum sample represented a sharp peak (288 °C) suggestive of quick decomposition. In sum, xanthan gums derived from date juice showed a thermal stability considerably higher than that from commercial xanthan, suggesting their potential of utilization in high temperature processing, e.g, extrusion, baking and spray drying where thermal stability of hydrocolloids is preferred.

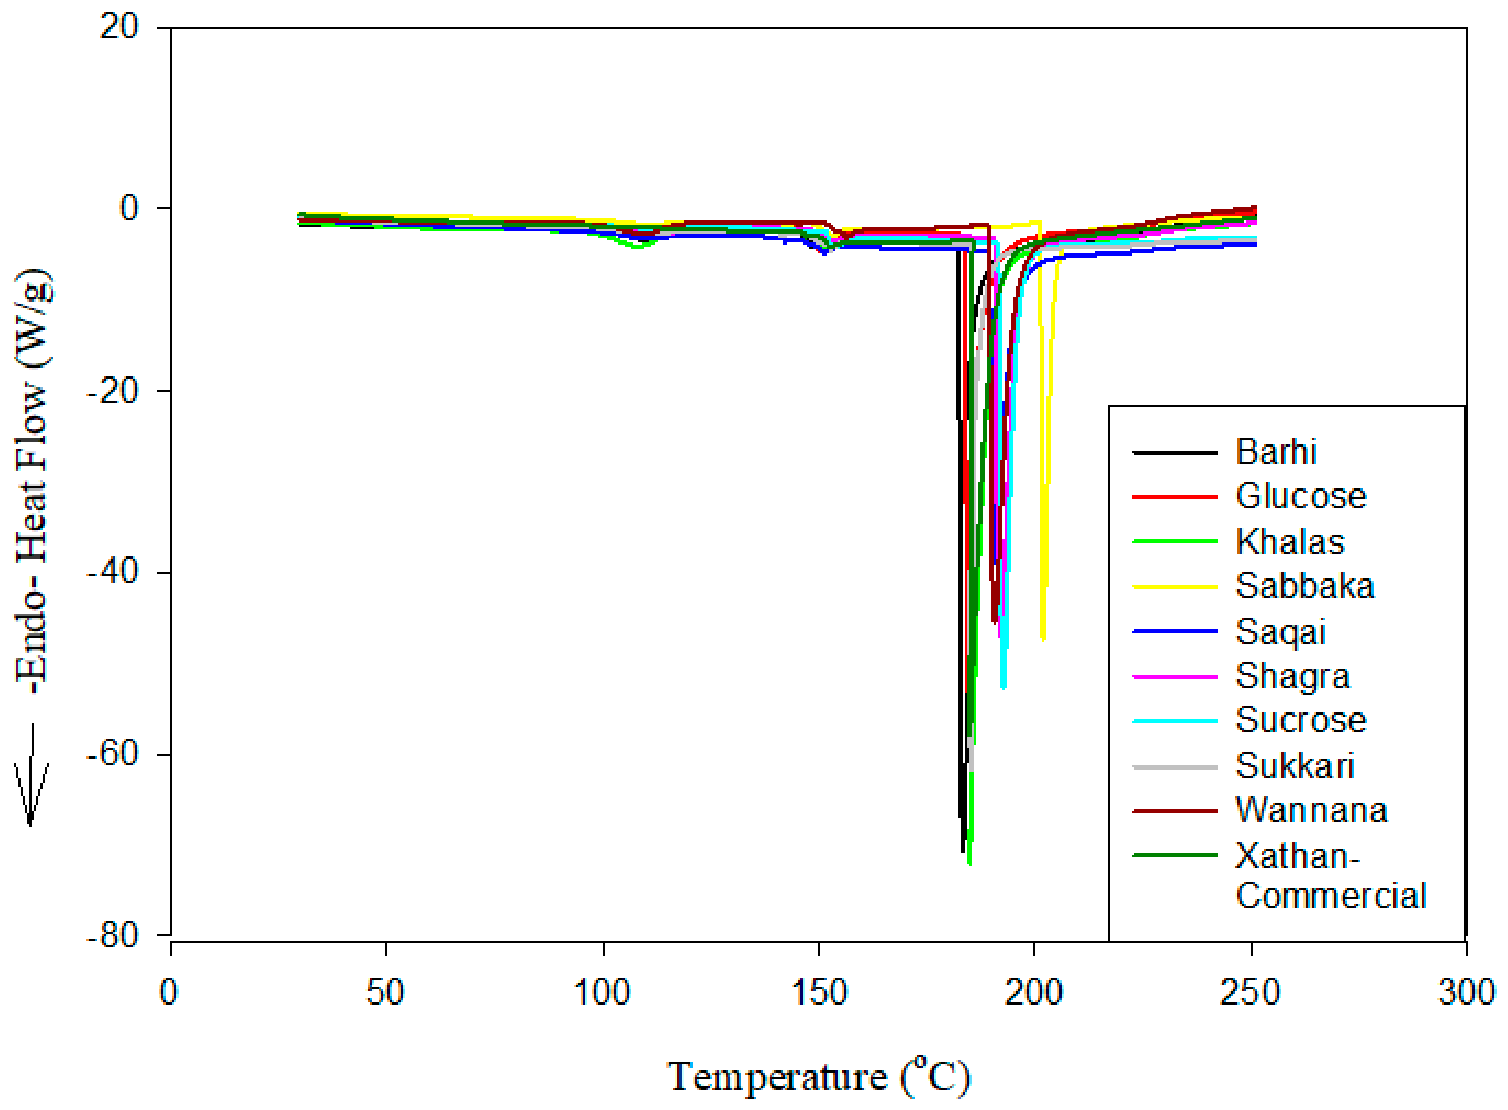
3.6. Differential Scanning Colorimeter (DSC) Analysis

The data pertaining to the DSC characterization of different xanthan samples is presented in Table 6 and Figure 3. It is evident from the results that dried xanthan samples have shown three endothermic and 1 glass transition event between the studied temperature range (30–250 °C). The peaks were identified as moisture evaporation, glass transition, enthalpic relaxation and melting. The DSC thermograms of the xanthan gum produced in the laboratory were significantly different to that of commercial. The initial endothermic peaks representing moisture loss were endothermic corresponding to the moisture present in the samples. The first peak in the thermal analysis of the lab sample was seen at 62.82–65.88 °C. The results also indicate that relatively low values (0.65–1.92 J/g) were required to remove the associated moisture content from the samples. The peak observed for the commercial samples was relatively late and in the middle of two peaks as represented by lab grown samples. The second larger peak maxed around 108.25–111.97 °C (ΔH 6.55–10.99 J/g) is indicative that strongly bonded water exists throughout the polymer network formed during synthesis. The commercial sample exhibits no such secondary peak and a corresponding low-enthalpy event happened at 78.41 °C, with ΔH 1.55 J g−1. Zohuriaan and Shokrolahi [47] reported the endothermic event in pure xanthan gum around 81 °C, while [52] recorded the event at 76.4 °C in commercial samples. The study by Fenin et al. [53] reported the peak at 108 °C for natural, non-modified xanthan samples. This difference occurs because prolonged industrial processing removes impurities, compounds that help retain water. Xanthan produced in the lab may contain residual salts or fermentation components, which are probably still present because of incomplete purification that enhances water binding through ionic and hydrogen interactions. The values of glass transition (Tg) were between 137.28 and 145.26 °C, with maximum in commercial xanthan (145.26 °C), followed by Wannana (144.96 °C). Tg is the polymer stability marker that represents its transition from a glassy to a rubbery state [54]. A higher Tg indicates less mobility and stronger intermolecular attraction while a lower Tg indicates plasticization [55]. The consensus small ΔCp values (0.020–0.073 J g−1 °C−1) corroborate that this transition was exclusive to the amorphous xanthan fraction, with no major structural rearrangement.
A minor enthalpic relaxation peak was observed immediately after the glass transition in all samples. The peak transition was recorded between 148.03 and 155.57 °C, which gave a range of enthalpy values from 2.46 to 5.68 J/g for this thermal event, which is reported as the systematic process representing the progressive recovery of structural imperfections in non-equilibrium amorphous polymer prior to reaching thermal equilibrium following glass transition (Hodge, 1994 [56]). The pronounced difference in the magnitude of relaxation enthalpy that was observed for the Sukkari xanthan samples indicates a much larger extent of complex molecular rearrangement during the heating period, whereas conversely, the low enthalpy values recorded for Barhi suggest a more thermodynamically relaxed molecular structure before initial thermal analysis. The reported differences in enthalpic relaxation for the variety of samples tested could be due to fundamental differences between the overall molecular weight, drying history, spatial orientation of polymer chains, and the primary hydrogen bonding network established during the fermentation and purification steps. Another observation is made at around a peak temperature of 182–198 °C, which represents an endothermic phenomenon but certainly not a melting point since Xanthan is a high-molecular-weight polysaccharide with much intra-and intermolecular hydrogen bonding, and does not have a sharp melting point like low-molecular-weight crystalline materials. It better represents a combination of physical transformations and the early product degradation processes, such as volatile loss in the form of vaporization, disruption of hydrogen bonds, and initial chain scission. This interpretation is further substantiated by the TGA results. Initial mass loss began at around 160 °C with the main degradation step occurring at around 287–297 °C, as shown by its maximum rate of loss. That latter event is the main thermal decomposition of the xanthan gum matrix and corresponds to an advanced depolymerization of polymer-chains. Accordingly, the DSC and TGA results correlate with each other as complementary: the endothermic event of DSC between 182 and 198 °C illustrates a process of complex thermal change in conjunction with initial degradation stages while TGA peaks at 287–297 °C represent the main degradation process.

3.6.1. Steady Shear Rheology

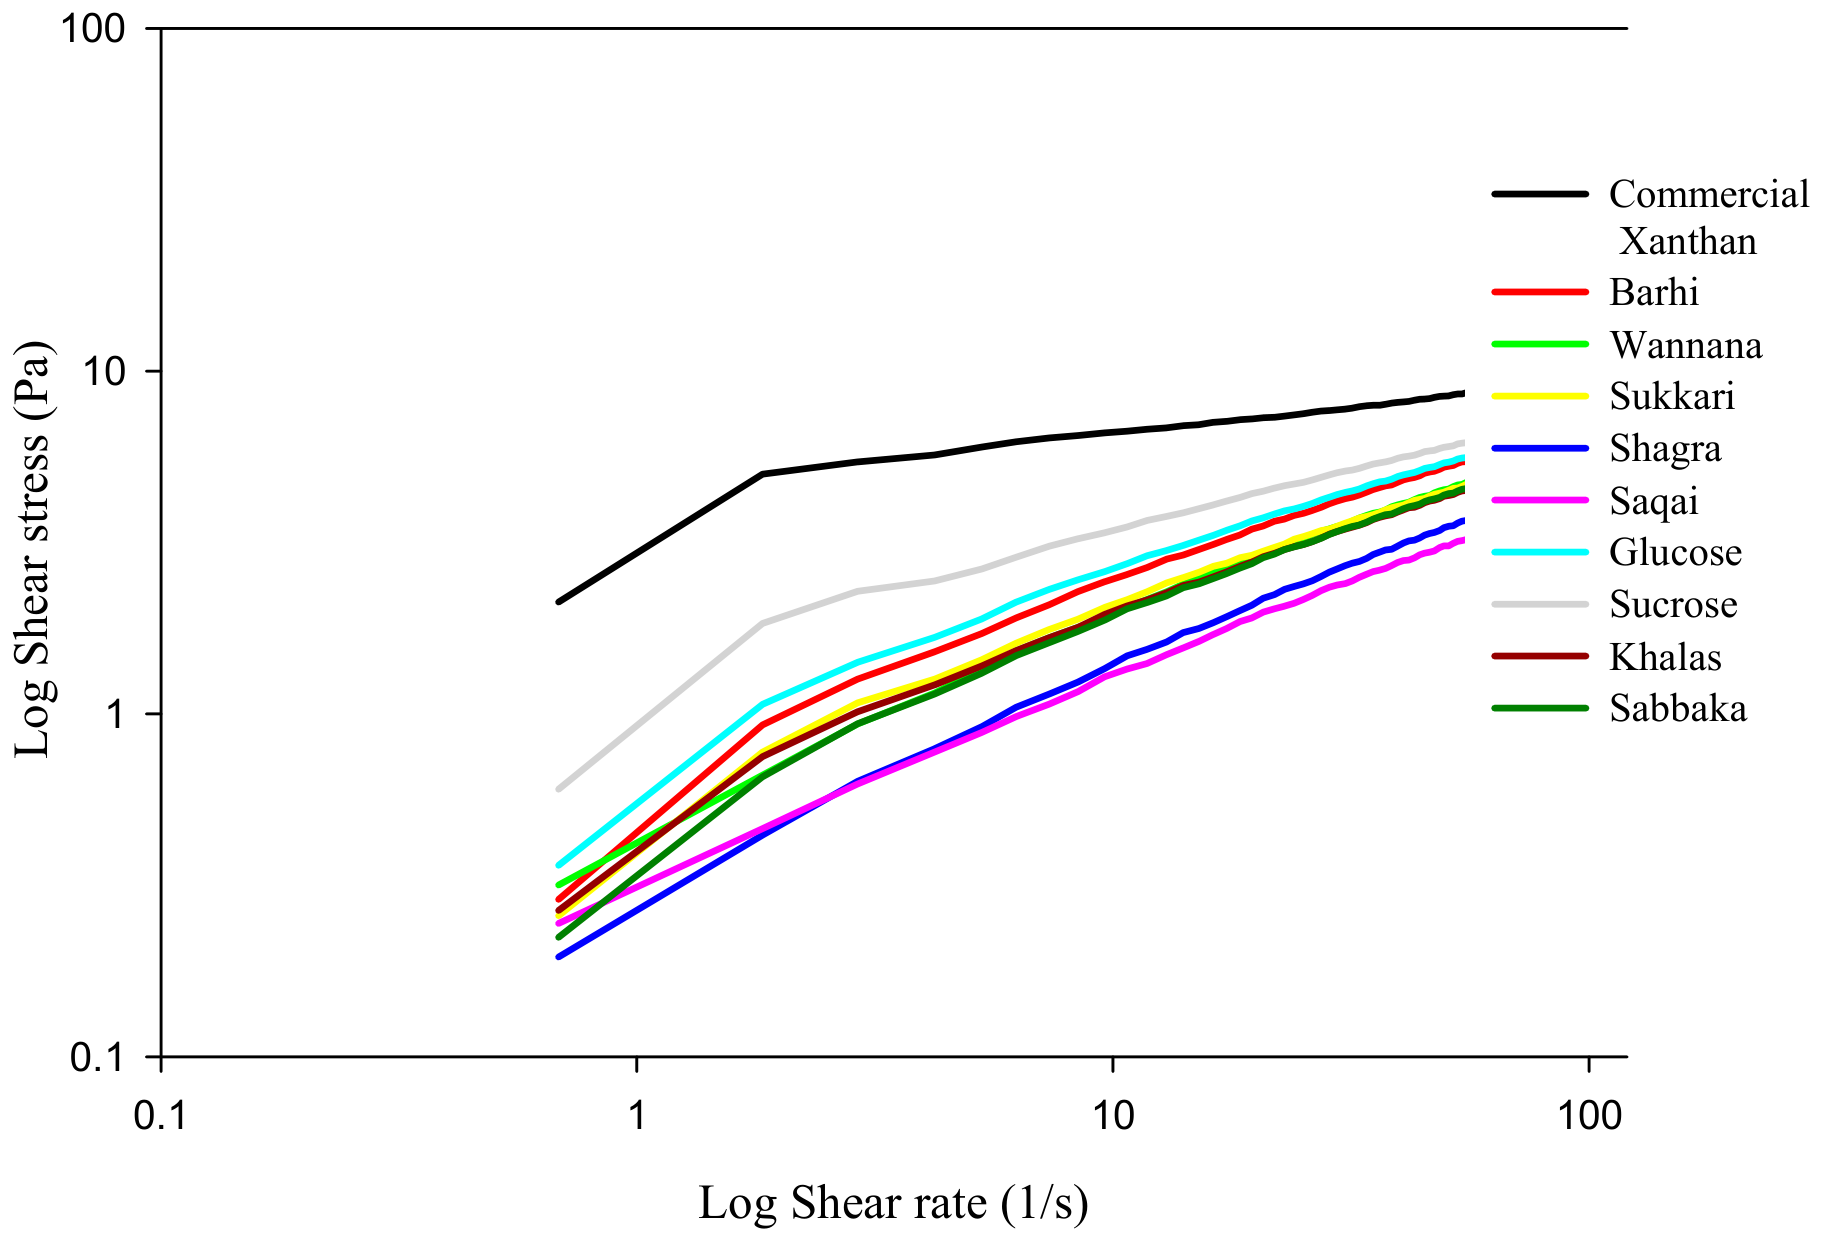
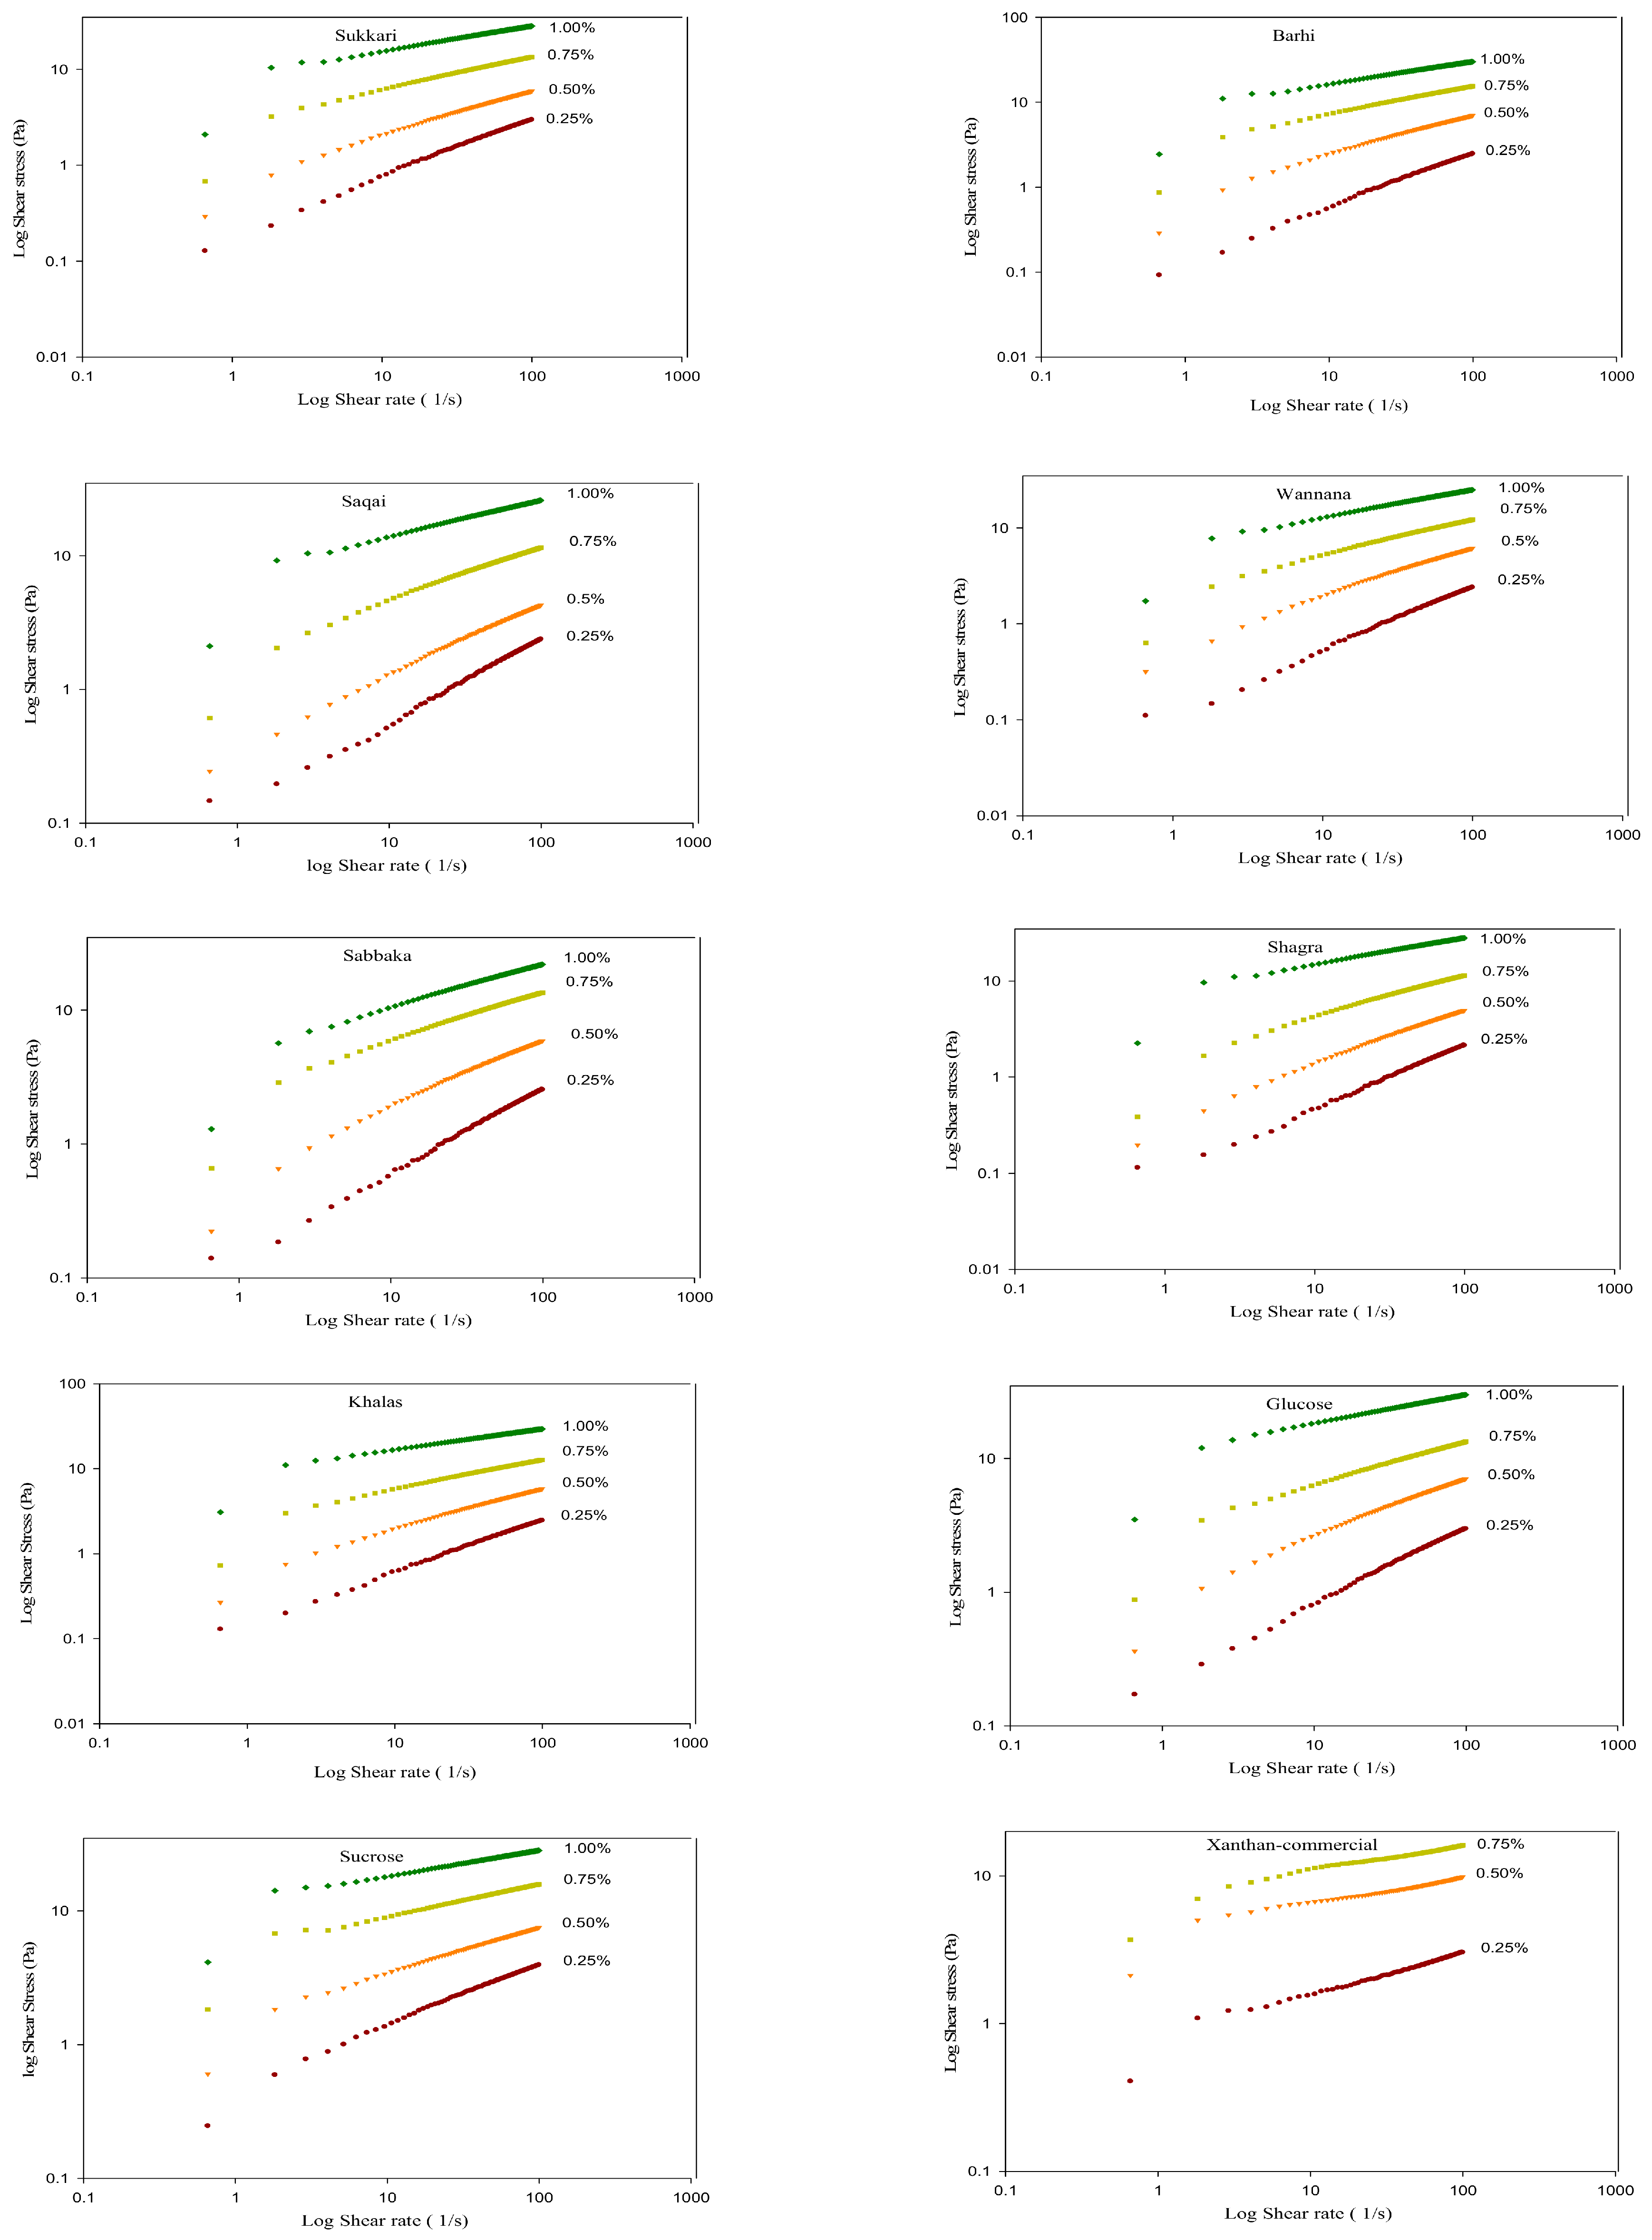
Steady shear rheological behavior of the different xanthan samples was determined at different concentrations and temperatures. The data was fitted to the power law model τ = Kγn, where the K value represents the consistency index/apparent viscosity (Pa·sn) while flow behaviors index (deviation from the Newtonian flow) is denoted by n. The values of R2 presented in Table 7 explain that the model was best-fit for all of the study samples, concentrations and temperatures. The power law model is used successfully by researchers to explain the flow behavior of different systems involving xanthan gum [42,57,58]. The shear stress–shear rate curves shown in Figure 4 and Figure 5 provide further support to the power law analysis. All the curves showed a nonlinear upward trend, which is typical for pseudoplastic materials, with the continuous increase in the shear stress with the shear rate and gradual decrease in the rate of increase. With the increase in XG concentrations, the curves became steeper and the values of shear stress were significantly higher, which corresponded to the increases in K. Commercial xanthan always caused the highest shear stresses, but all the xanthan samples obtained in the laboratory showed similar rheological behaviors, with differences mainly due to the fermentation substrate.
Effect of Gum Concentration on Consistency Index
One of the most prominent trends observed was a substantial increase in the consistency index (K) with increasing xanthan gum concentration (Figure 4 and Figure 5). The K values of the xanthan gums produced in the laboratory at 20 °C increased from 0.10–0.52 Pa·sn at 0.25% to 4.96–11.34 Pa·sn at 1.0%, a nearly 20- to 50-fold increase depending on the substrate. Similarly, the viscosity of glucose xanthan increased from 0.24 to 11.01 Pa·sn and sucrose xanthan increased from 0.52 to 11.34 Pa·sn in the same concentration range. The highest consistency was observed for commercial xanthan gum up to 0.75%, which increased from 0.78 Pa·sn at 0.25% to 7.37 Pa·sn at 0.75%. However, measurements at 1.0% were not possible because of the very high viscosity of the commercial xanthan gum sample. The progressive overlap and the entanglement of the xanthan gum are reported to be responsible for the increase in the consistency coefficient and decrease in the flow behavior index (shear thinning) of the xanthan solutions with increasing concentration [59]. At low polymer concentrations xanthan molecules are quite isolated and move independently. With increasing concentration intermolecular associations, hydrogen bonding and chain entanglements increase, resulting in a stronger three-dimensional network resisting deformation during shear. Alam, Malakar, Pant, Dar and Nanda [58] reported that xanthan gum possesses excellent thickening efficiency and better shear thinning behavior at low concentrations when compared with guar gum. Increasing gum concentrations in the formulations increased both apparent viscosities and the consistency coefficient (K) [60].
Effect of Temperature on Consistency Coefficient and Flow Behavior Index
Temperature had a reverse effect on solution consistency (Table 7). In all samples, increasing temperature from 20 °C to 40 °C resulted in a consistent decrease in K values. For example, Sukkari xanthan (1%) was reduced from 8.17 to 5.32 Pa·sn, Khalas xanthan from 9.47 to 5.69 Pa·sn, glucose-based xanthan from 11.01 to 7.95 Pa·sn and sucrose-based xanthan from 11.34 to 8.62 Pa·sn. Commercial xanthan showed a gradual reduction from 7.37 to 6.30 Pa·sn at 0.75% concentration. The decrease in consistency with the increase in temperature is attributed to the thermal degradation of intermolecular forces in the xanthan gum network [61]. An increase in temperature increases the mobility of molecules, which influences the hydrogen bond, chain flexibility and flow resistance [62]. Although the moderate reduction in K happened with the increase in the temperatures, the stability of xanthan gum is solid enough to make it a suitable candidate for foods with moderate heat processing.
The flow behavior index (n) was found to be less than 1 for all the samples at all the experimental conditions confirming that all the xanthan gum solutions behaved as non-Newtonian pseudoplastic (shear-thinning) fluids. Across a wide range of hydrocolloids, xanthan gum exhibits significant shear thinning behavior [42,63,64]. The n values for 0.25% concentration were in the range of 0.29 to 0.70 while for 1.0% concentration n values decreased to a range of 0.20 to 0.32 depending on the substrate. All formulations have a flow behavior index (n) < 1.0, indicating a shear thinning behavior. The decrease in n with increasing concentration indicates that xanthan gum solutions were more shear-thinning as polymer concentration increased. For example, Sukkari xanthan n value decreased from 0.58 at 0.25% to 0.27 at 1.0%, Barhi xanthan from 0.61 to 0.27, glucose-derived xanthan from 0.56 to 0.22 and sucrose-derived xanthan from 0.44 to 0.20 in the same concentration range. The gum concentration directly impacts its flow behavior index, keeping it within the non-Newtonian shear thinning range [60,65]. It is reported that shear-thinning behavior of the hydrocolloid gums is highly desirable in food systems as it provides high viscosity under stationary conditions for product stability, but a decrease in viscosity during pumping, mixing, swallowing or filling operations eases the processing [62,66,67]. Concentration decreased n, but flow behavior index slightly increased with the increase in temperature. For example, the n value of Khalas xanthan increased from 0.25 at 20 °C to 0.31 at 40 °C, glucose-derived xanthan increased from 0.22 to 0.25 and sucrose-derived xanthan increased from 0.20 to 0.23. The slight increase indicates that the xanthan gum solutions were less shear-thinning at elevated temperatures, as the higher thermal energy causes partial breakdown of intermolecular associations before shear is applied.
Effect of Substrates
The difference in the fermentation media substrates also affected the rheological properties of the xanthan gum. Xanthan gum produced from the date cultivars like Barhi, Khalas, Shagra and Sukkari had higher consistency indices. On the other hand, Sabbaka represented the lower k values when compared at higher concentrations. Although traditionally glucose and sucrose are used as the carbon sources to produce xanthan gum for industrial production, many researchers have identified other potential sources, e.g., olive pomace, grape pomace, Melaleuca alternifolia, cheese whey, milk permeate, sugarcane bagasse, and date juice, and have harvested xanthan gum with acceptable rheological properties [36,37,38]. The xanthan produced in the current study from different date substrates had similar rheological behavior as those produced with commercial substrates like glucose and sucrose. This could be a potential benefit of utilizing the low-cost raw materials for sustainable production of xanthan gum using biotechnology. The relative differences observed among the xanthan from the different substrates could be attributed to the polymer chain length, purification, molecular weight and pyruvate and acetyl substitution in the polymer network.

3.6.2. Dynamic Rheology

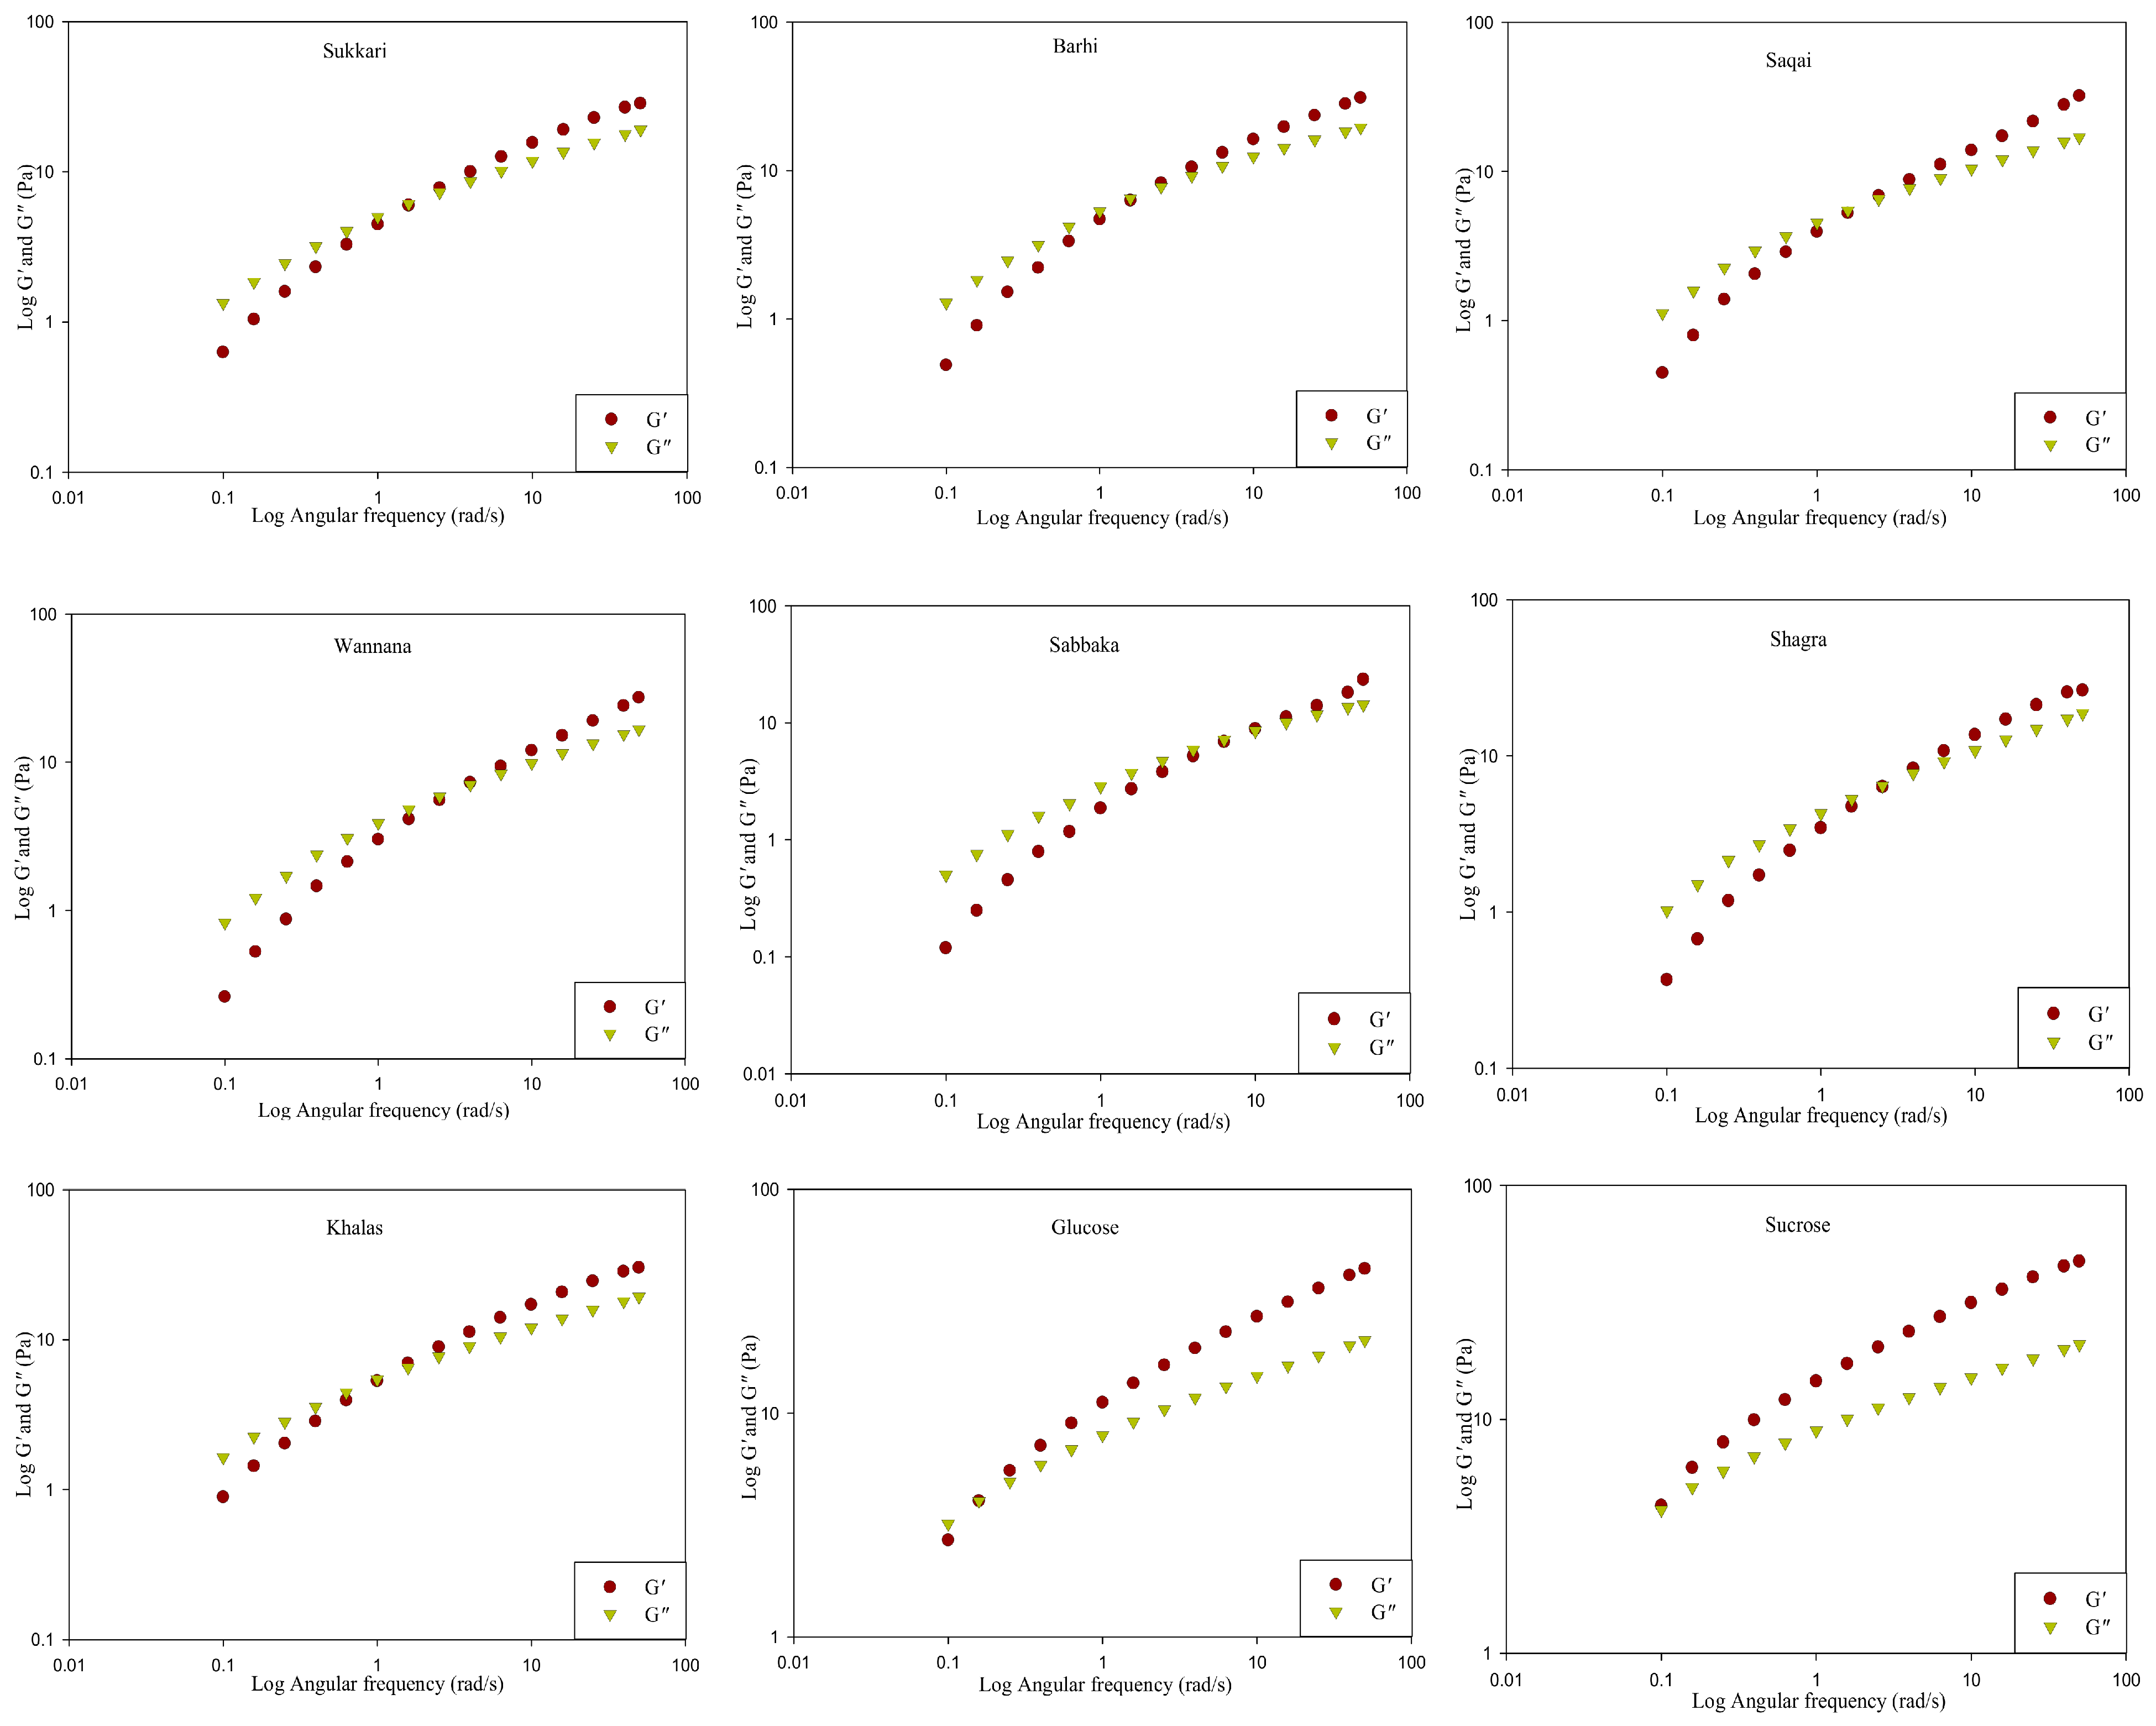
The data presented in Figure 6 reflects the dynamic viscoelastic behavior of the 1% xanthan solutions in a constant strain (5%) in the linear viscoelastic region. The frequency sweep test was performed from 0.01 rad/s to 50 rad/s at 25 °C. As the data indicates, the overall slope of storage modulus (G′) was higher than loss modulus (G″). The value of G″ was higher than that of G′ at low frequency and the phenomenon reversed at higher frequency ranges, with crossover happening in almost all the studied lab-grown xanthan samples. For the regions at a lower frequency before the crossover point, the samples had viscous-like behavior (G″/G′), while higher frequency regions (after crossover) resulted in G′/G”, indicative of solutions solid/gel-like behavior. The studies on commercial xanthan gums represented more elastic properties (G ′/G″) with no crossovers [68,69,70]. On the other hand, the crossover in produced samples is likely due to variations in molecular weight distribution and substitution patterns when compared to commercial xanthan gum. These factors can result in differences in the chain flexibility, inter- and intramolecular association, and network formation, which consequently create an effect on viscoelastic response. The overall frequency sweep results confirm that the rheological properties of xanthan gum obtained from different date cultivars are similar to the properties of xanthan produced using conventional glucose and sucrose media. The modulus values showed slight quantitative differences but all the samples were characterized by a predominantly elastic response with stable viscoelastic networks. The findings suggest that date juice may be used as an alternative carbon source for xanthan gum biosynthesis without affecting the basic rheological functionality of xanthan gum. The produced xanthan can be used for thickening, suspension stabilization and texture enhancing in food systems.

3.7. Activation Energy of the Xanthan Gum Samples

The Arrhenius mathematical model successfully characterized the relationship of temperature dependence of the consistency coefficient (K) for the 0.25% w/v solutions (From Table 7) of the xanthan gum produced from different substrates. This model yielded R2 values in an excellent fitting region of 0.97–0.99. In addition, these consistently high R2 values confirm that the complex rheology of each of the xanthan gum samples was strictly consistent with the Arrhenius-type temperature dependence for the studied range of temperatures (20, 30 and 40 °C).
It was observed that Ea values differed from 9.98 to 29.39 kJ/mol among different samples (Table 8). Fluid dynamics and polymer science explain that the activation energy is an essential metric that provides reliable insight into a fluid’s viscoelasticity response to variation in temperature. The elevated Ea values characteristically denote that viscosity drops off sharply with rising thermal gradients while conversely lower Ea values are indicative of a pronounced structural durability/resilience towards temperature-driven changes in viscosity [71]. It is evident from the table that the xanthan from Saqai date syrup medium specifically demonstrated the highest value (29.39 kJ/mol) for activation energy followed by samples derived from Shagra (26.45 kJ/mol), Sabbaka (26.44 kJ/mol) and finally the standard glucose control medium (26.44 kJ/mol). The noticeably larger Ea parameters therefore strongly imply that the xanthan gums in this study had a distinctly greater degree of temperature sensitivity and set up a physical scenario where the fragile intermolecular forces and intricate physical entanglements within the three-dimensional polymer network were much more readily disrupted as ambient temperatures systematically increased. By contrast, lower (21.40 kJ/mol) and much lower (19.53 kJ/mol) thermodynamic values were related to xanthan gums produced from Sukkari and Barhi substrates while intermediate tier of activation energies was recorded for the xanthan gums produced from Khalas, Wannana and standard Sucrose medium (23.90, 23.67 and 23.58 kJ/ mol, respectively). These results strongly indicate that the xanthan gums successfully generated from these two latter substrates were able to retain their intrinsic viscosity better and more consistently under thermal processing, and thus had a distinctly higher degree of intrinsic thermal stability compared to the previously mentioned higher-Ea samples. The activation energies of around 14.7–15 KJ/mol for xanthan gum solutions were also reported by several other researchers [71,72,73,74].
A lower activation energy is an indication of a more stable macromolecular polymer network exhibiting less thermal dependence on dynamic viscosity, which is generally considered to be one of the most important desirable properties for food products that need to undergo continuous thermal processing processes or hot filling processing. The commercial xanthan gum exhibited the lowest activation energy of only 9.98 kJ/mol. This lower Ea value is very representative of better thermal stability. This very stable rheological behavior is perfectly reasonable and consistent, because commercial xanthan gum production is usually conducted in tightly controlled, highly optimized industrial-scale fermenter environments. As a result, these industrial products may inherently have a better structural integrity, in addition to specific ratios of acetyl or pyruvate side-chain substitutions which consequently work together towards the attainment of the improved temperature-induced viscosity loss [31].
Additionally, the pre-exponential factor (K0) showed higher variations across the variety of samples analyzed. The xanthan gums produced specifically in a laboratory displayed natural logarithmic ln(K0) values that ranged from −14.055 to −9.926, corresponding mathematically to absolute K0 values between 7.89 × 10⁻⁷ and 4.90 ×10⁻⁵ Pa·sI. Conversely, the K0 for the commercial xanthan gum was approximately and significantly much higher in magnitude (1.32 × 10⁻² Pa·sn). The large numerical differences reflect directly the structural differences residing in their very inherent intrinsic rheological properties of the individual xanthan molecules themselves, and additionally they contribute to determining how specifically varied carbon sources employed during biological fermentation have a significant quantifiable impact upon both polymer nano architecture as well as macroscopic flow behavior. Previous studies have demonstrated that the choice of fermentation substrate can alter the molecular weight, chain conformation and degree of substitution of functional side-chains, ultimately affecting the viscosity and temperature-dependent behavior of the xanthan [14,34,72].

4. Conclusions

This study demonstrated that low-quality dates from seven Saudi cultivars can be successfully upcycled into food-grade xanthan gum through fermentation with Xanthomonas campestris. Date juice proved to be a compositionally rich, monosaccharide-dominated substrate that delivered gum yields of 5.60–7.77 g L−1. The Barhi and Saqai cultivars out-yield both the glucose and sucrose controls. FTIR analysis confirmed that the primary structure of the date-derived gums was identical to that of the commercial standard. At the same time, thermogravimetric analysis revealed superior thermal stability, evidenced by higher char residues at 500 °C. The date-based powders were darker than the commercial reference due to residual pigments and Maillard products, which is considered a limitation readily addressable by a simple decolorization step. Nevertheless, their rheological behavior was fully comparable, exhibiting pseudoplastic, shear-thinning characteristics and the concentration- and temperature-dependence expected of high-quality xanthan gum.
Taken together, these findings establish low-quality Saudi dates as a technically robust and cost-effective alternative to conventional refined-sugar substrates. It offers a viable route to valorize date-processing waste while supporting local, circular-economy production of a commercially important biopolymer for the food, pharmaceutical, and allied industries. Future work should focus on optimizing the fermentation parameters and the downstream purification at pilot scale, and on quantifying the acetyl and pyruvate substitution levels that underpin the functional differences observed among the cultivars.

Author Contributions

Conceptualization, R.A.A. and S.H.; data curation, R.A.A. and S.A.A.; formal analysis, H.M.Y. and S.H.; funding acquisition, S.H.; methodology, R.A.A. and A.A.; project administration, A.A. and S.A.A.; resources, A.A.M. and A.A.; supervision, A.A.M. and S.H.; writing—original draft, R.A.A. and S.H.; writing—review and editing, S.A.A. and S.H. All authors have read and agreed to the published version of the manuscript.

Funding

This research was funded by the Ongoing Research Funding Program, (ORF-2026-1073), King Saud University, Riyadh, Saudi Arabia.

Institutional Review Board Statement

Not applicable.

Data Availability Statement

The publication includes the original contributions made in the study. For any additional inquiries, please contact the corresponding author.

Acknowledgments

The authors appreciate the support from the Ongoing Research Funding Program, (ORF-2026-1073), King Saud University, Riyadh, Saudi Arabia.

Conflicts of Interest

The authors declare no conflicts of interest.

References

  1. Pasqualone, A.; Laddomada, B.; Boukid, F.; Angelis, D.D.; Summo, C. Use of almond skins to improve nutritional and functional properties of biscuits: An example of upcycling. Foods 2020, 9, 1705. [Google Scholar] [CrossRef] [Scilit] [PubMed]
  2. Cucagna, M.E.; Goldsmith, P.D. Value adding in the agri-food value chain. Int. Food Agribus. Manag. Rev. 2018, 21, 293–316. [Google Scholar] [CrossRef] [Scilit]
  3. El-Juhany, L.I. Degradation of date palm trees and date production in Arab countries: Causes and potential rehabilitation. Aust. J. Basic Appl. Sci. 2010, 4, 3998–4010. [Google Scholar]
  4. Alahyane, A.; Harrak, H.; Elateri, I.; Ayour, J.; Ait-Oubahou, A.; Benichou, M.; Abderrazik, M. Evaluation of some nutritional quality criteria of seventeen Moroccan dates varieties and clones, fruits of date palm (Phoenix dactylifera L.). Braz. J. Biol. 2021, 82, e236471. [Google Scholar] [CrossRef] [Scilit] [PubMed]
  5. Assirey, E.A. The chemical composition, total phenolic and antioxidant content of four date palm saudi cultivars. J. Taibah Univ. Sci. 2021, 15, 282–287. [Google Scholar] [CrossRef] [Scilit]
  6. Perveen, K.; Bokahri, N.A. Comparative analysis of chemical, mineral and in-vitro antibacterial activity of different varieties of date fruits from Saudi Arabia. Saudi J. Biol. Sci. 2020, 27, 1886–1891. [Google Scholar] [CrossRef] [Scilit] [PubMed]
  7. Ogungbenle, H. Chemical and fatty acid compositions of date palm fruit (Phoenix dactylifera L.) flour. Bangladesh J. Sci. Ind. Res. 2011, 46, 255–258. [Google Scholar]
  8. Siddiq, M.; Greiby, I. Overview of date fruit production, postharvest handling, processing, and nutrition. In Dates: Postharvest Science, Processing Technology and Health Benefits; Wiley-Blackwell: Hoboken, NJ, USA, 2013; pp. 1–28. [Google Scholar]
  9. Moshaf, S.; Hamidi-Esfahani, Z.; Azizi, M. Optimization of conditions for xanthan gum production from waste date in submerged fermantation. Int. J. Nutr. Food Eng. 2011, 5, 549–552. [Google Scholar]
  10. Shi, L.; de Souza, T.S.P.; Ahmadi, F.; Imran, A.; Dunshea, F.R.; Barrow, C.; Suleria, H.A.R. Valorization of date fruit (Phoenix dactylifera L.) processing waste and by-products: A review. Appl. Sci. 2023, 13, 12315. [Google Scholar] [CrossRef] [Scilit]
  11. El-Habbab, M.S.; Al-Mulhim, F.; Al-Eid, S.; Abo El-Saad, M.; Aljassas, F.; Sallam, A.; Ghazzawy, H. Assessment of post-harvest loss and waste for date palms in the Kingdom of Saudi Arabia. Int. J. Environ. Agric. Res. 2017, 3, 1–11. [Google Scholar] [CrossRef] [Scilit]
  12. Benalaya, I.; Alves, G.; Lopes, J.; Silva, L.R. A review of natural polysaccharides: Sources, characteristics, properties, food, and pharmaceutical applications. Int. J. Mol. Sci. 2024, 25, 1322. [Google Scholar] [CrossRef] [Scilit] [PubMed]
  13. Jindal, N.; Khattar, J.S. Microbial polysaccharides in food industry. In Biopolymers for Food Design; Elsevier: Amsterdam, The Netherlands, 2018; pp. 95–123. [Google Scholar]
  14. Rosalam, S.; England, R. Review of xanthan gum production from unmodified starches by Xanthomonas comprestris sp. Enzym. Microb. Technol. 2006, 39, 197–207. [Google Scholar] [CrossRef] [Scilit]
  15. Ahmed, S.; Soundararajan, A. Pullulan: Processing, Properties, and Applications; CRC Press: Boca Raton, FL, USA, 2020. [Google Scholar]
  16. Aquinas, N.; Bhat M, R.; Selvaraj, S. A review presenting production, characterization, and applications of biopolymer curdlan in food and pharmaceutical sectors. Polym. Bull. 2022, 79, 6905–6927. [Google Scholar] [CrossRef] [Scilit]
  17. Castillo, N.A.; Valdez, A.L.; Fariña, J.I. Microbial production of scleroglucan and downstream processing. Front. Microbiol. 2015, 6, 1106. [Google Scholar] [CrossRef] [Scilit] [PubMed]
  18. Díaz-Montes, E. Dextran: Sources, structures, and properties. Polysaccharides 2021, 2, 554–565. [Google Scholar] [CrossRef] [Scilit]
  19. Dey, R.; Chatterji, B.P. Sources and methods of manufacturing xanthan by fermentation of various carbon sources. Biotechnol. Prog. 2023, 39, e3379. [Google Scholar] [CrossRef] [Scilit] [PubMed]
  20. Asase, R.V.; Glukhareva, T.V. Production and application of xanthan gum—Prospects in the dairy and plant-based milk food industry: A review. Food Sci. Biotechnol. 2024, 33, 749–767. [Google Scholar] [CrossRef] [Scilit] [PubMed]
  21. Bhat, I.; Wani, S.; Mir, S.; Masoodi, F. Advances in xanthan gum production, modifications and its applications. Biocatal. Agric. Biotechnol. 2022, 42, 102328. [Google Scholar] [CrossRef] [Scilit]
  22. Moosavi-Nasab, M.; Shekaripour, F.; Alipoor, M. Use of date syrup as agricultural waste for xanthan production by Xanthomonas campestris. Iran Agric. Res. 2010, 27, 89–98. [Google Scholar] [CrossRef] [Scilit]
  23. Pettitt, D.J. Xanthan gum. In Food Hydrocolloids; CRC Press: Boca Raton, FL, USA, 2020; pp. 127–149. [Google Scholar]
  24. Morris, G.A.; Harding, S.E. Production of polysaccharides. In Biotechnology in Agriculture and Food Processing: Opportunities and Challenges; Taylor & Francis Group, CRC Press: Boca Raton, FL, USA, 2014; pp. 355–386. [Google Scholar]
  25. Sworn, G. Xanthan gum. In Handbook of Hydrocolloids; Elsevier: Amsterdam, The Netherlands, 2021; pp. 833–853. [Google Scholar]
  26. Habibi, H.; Khosravi-Darani, K. Effective variables on production and structure of xanthan gum and its food applications: A review. Biocatal. Agric. Biotechnol. 2017, 10, 130–140. [Google Scholar] [CrossRef] [Scilit]
  27. Mehta, K.; Shukla, A.; Saraf, M. Articulating the exuberant intricacies of bacterial exopolysaccharides to purge environmental pollutants. Heliyon 2021, 7, e08446. [Google Scholar] [CrossRef] [Scilit] [PubMed]
  28. Bajić, B.; Dodić, J.; Rončević, Z.; Grahovac, J.; Dodić, S.; Vučurović, D.; Tadijan, I. Biosynthesis of xanthan gum on wastewater from confectionary industry. Analecta Tech. Szeged. 2014, 8, 13–17. [Google Scholar] [CrossRef] [Scilit]
  29. Salah, R.B.; Chaari, K.; Besbes, S.; Blecker, C.; Attia, H. Production of xanthan gum from Xanthomonas campestris NRRL B-1459 by fermentation of date juice palm by-products (Phoenix dactylifera L.). J. Food Process Eng. 2011, 34, 457–474. [Google Scholar] [CrossRef] [Scilit]
  30. Khosravi-Darani, K.; Reyhani, F.S.; Nejad, B.; Farhadi, G.B.N. Bench scale production of xanthan from date extract by Xanthomonas campestris in submerged fermentation using central composite design. Afr. J. Biotechnol. 2011, 10, 13520–13527. [Google Scholar] [CrossRef] [Scilit]
  31. Valenta, T.; Lapčíková, B.; Lapčík, L. Determination of kinetic and thermodynamic parameters of food hydrocolloids/water interactions by means of thermal analysis and viscometry. Colloids Surf. A Physicochem. Eng. Asp. 2018, 555, 270–279. [Google Scholar] [CrossRef] [Scilit]
  32. Mohamed, A.; Hussain, S.; Alamri, M.S.; Ibraheem, M.A.; Qasem, A.A.A.; Ababtain, I.A. Physicochemical Properties of Starch Binary Mixtures with Cordia and Ziziphus Gums. Processes 2022, 10, 180. [Google Scholar] [CrossRef] [Scilit]
  33. Dzionek, A.; Wojcieszyńska, D.; Guzik, U. Use of xanthan gum for whole cell immobilization and its impact in bioremediation-a review. Bioresour. Technol. 2022, 351, 126918. [Google Scholar] [CrossRef] [Scilit] [PubMed]
  34. Garcıa-Ochoa, F.; Santos, V.; Casas, J.; Gómez, E. Xanthan gum: Production, recovery, and properties. Biotechnol. Adv. 2000, 18, 549–579. [Google Scholar] [CrossRef] [Scilit] [PubMed]
  35. Li, P.; Li, T.; Zeng, Y.; Li, X.; Jiang, X.; Wang, Y.; Xie, T.; Zhang, Y. Biosynthesis of xanthan gum by Xanthomonas campestris LRELP-1 using kitchen waste as the sole substrate. Carbohydr. Polym. 2016, 151, 684–691. [Google Scholar] [CrossRef] [Scilit] [PubMed]
  36. Şen, E.; Demirci, A.S.; Palabiyik, I. Xanthan gum characterization and production kinetics from pomace of Vitis vinifera. J. Food Process. Preserv. 2022, 46, e17098. [Google Scholar] [CrossRef] [Scilit]
  37. Crugeira, P.J.L.; Almeida, H.H.; Marcet, I.; Rendueles, M.; Pires, M.G.; Rafael, H.M.; Rodrigues, A.I.G.; Santamaria-Echart, A.; Barreiro, M. Biosynthesis of antioxidant xanthan gum by Xanthomonas campestris using substrates added with moist olive pomace. Food Bioprod. Process. 2023, 141, 210–218. [Google Scholar] [CrossRef] [Scilit]
  38. Li, Z.-X.; Chen, J.-Y.; Wu, Y.; Huang, Z.-Y.; Wu, S.-T.; Chen, Y.; Gao, J.; Hu, Y.; Huang, C. Effect of downstream processing on the structure and rheological properties of xanthan gum generated by fermentation of Melaleuca alternifolia residue hydrolysate. Food Hydrocoll. 2022, 132, 107838. [Google Scholar] [CrossRef] [Scilit]
  39. Sethi, S.; Saruchi; Kaith, B.S.; Kaur, M.; Sharma, N.; Kumar, V. Cross-linked xanthan gum–starch hydrogels as promising materials for controlled drug delivery. Cellulose 2020, 27, 4565–4589. [Google Scholar] [CrossRef] [Scilit]
  40. Gilani, S.; Najafpour, G.; Heydarzadeh, H.; Zare, H. Kinetic models for xanthan gum production using Xanthomonas campestris from molasses. Chem. Ind. Chem. Eng. Q. 2011, 17, 179–187. [Google Scholar] [CrossRef] [Scilit]
  41. Asase, R.; Seredovich, D.; Selezneva, I.; Glukhareva, T. Xanthan gum production using Xanthomonas campestris B6720: Fermentation process and application in fermented soymilk. BIO Web Conf. 2024, 121, 01005. [Google Scholar] [CrossRef] [Scilit]
  42. Wang, Z.; Wu, J.; Zhu, L.; Zhan, X. Characterization of xanthan gum produced from glycerol by a mutant strain Xanthomonas campestris CCTCC M2015714. Carbohydr. Polym. 2017, 157, 521–526. [Google Scholar] [CrossRef] [Scilit] [PubMed]
  43. Hu, X.; Wang, K.; Yu, M.; He, P.; Qiao, H.; Zhang, H.; Wang, Z. Characterization and antioxidant activity of a low-molecular-weight xanthan gum. Biomolecules 2019, 9, 730. [Google Scholar] [CrossRef] [Scilit] [PubMed]
  44. Kang, Y.; Li, P.; Zeng, X.; Chen, X.; Xie, Y.; Zeng, Y.; Zhang, Y.; Xie, T. Biosynthesis, structure and antioxidant activities of xanthan gum from Xanthomonas campestris with additional furfural. Carbohydr. Polym. 2019, 216, 369–375. [Google Scholar] [CrossRef] [Scilit] [PubMed]
  45. Yuan, S.; Liang, J.; Zhang, Y.; Han, H.; Jiang, T.; Liu, Y.; Zhang, Y.; Wang, W.; Dong, X. Evidence from thermal aging indicating that the synergistic effect of glyoxal and sodium sulfite improved the thermal stability of conformational modified xanthan gum. Polymers 2022, 14, 243. [Google Scholar] [CrossRef] [Scilit] [PubMed]
  46. Moreira, K.C.; Dalmaschio, C.J.; Soares, E.J.; Nascimento, A. Thermal degradation and rheological behavior of xanthan gum: Kinetics, mechanism, and aging effects. ChemistrySelect 2025, 10, e00855. [Google Scholar] [CrossRef] [Scilit]
  47. Zohuriaan, M.; Shokrolahi, F. Thermal studies on natural and modified gums. Polym. Test. 2004, 23, 575–579. [Google Scholar] [CrossRef] [Scilit]
  48. Nejadmansouri, M.; Shad, E.; Razmjooei, M.; Safdarianghomsheh, R.; Delvigne, F.; Khalesi, M. Production of xanthan gum using immobilized Xanthomonas campestris cells: Effects of support type. Biochem. Eng. J. 2020, 157, 107554. [Google Scholar] [CrossRef] [Scilit]
  49. Bulbul, V.; Bhushette, P.R.; Zambare, R.S.; Deshmukh, R.; Annapure, U.S. Effect of cold plasma treatment on Xanthan gum properties. Polym. Test. 2019, 79, 106056. [Google Scholar] [CrossRef] [Scilit]
  50. Kang, J.; Yue, H.; Li, X.; He, C.; Li, Q.; Cheng, L.; Zhang, J.; Liu, Y.; Wang, S.; Guo, Q. Structural, rheological and functional properties of ultrasonic treated xanthan gums. Int. J. Biol. Macromol. 2023, 246, 125650. [Google Scholar] [CrossRef] [Scilit] [PubMed]
  51. Sorze, A.; Bösing, J.; Hirschmüller, S.; Dorigato, A. Investigation of Flame and Thermal Degradation Behavior of Xanthan-and Gelatin-Based Composites Used as Topsoil Covers in Forestry. Molecules 2025, 30, 3324. [Google Scholar] [CrossRef] [Scilit] [PubMed]
  52. da Silva, J.A.; Cardoso, L.G.; de Jesus Assis, D.; Gomes, G.V.P.; Oliveira, M.B.P.P.; de Souza, C.O.; Druzian, J.I. Xanthan gum production by Xanthomonas campestris pv. campestris IBSBF 1866 and 1867 from lignocellulosic agroindustrial wastes. Appl. Biochem. Biotechnol. 2018, 186, 750–763. [Google Scholar] [CrossRef] [Scilit] [PubMed]
  53. Fenin, V.; Kachawa, V.S.; Jain, C.P. Optimization of Colon Specific Drug Delivery System for Ornidazole using Modified Gum. Int. J. Pharm. Sci. Drug Res. 2021, 13, 176–182. [Google Scholar] [CrossRef] [Scilit]
  54. Roos, Y.H.; Drusch, S. Phase Transitions in Foods; Academic Press: New York, NY, USA, 2015. [Google Scholar]
  55. Levine, H.; Slade, L. Glass transitions in foods. In Physical Chemistry of Foods; CRC Press: Boca Raton, FL, USA, 1992; pp. 83–221. [Google Scholar]
  56. Hodge, I.M. Enthalpy relaxation and recovery in amorphous materials. J. Non-Cryst. Solids 1994, 169, 211–266. [Google Scholar] [CrossRef] [Scilit]
  57. Ahmed, R.; Mushtaq, A.; Khan, R.M.; Hashmi, S.; Ali, Z.U. Effect of Xanthan Gum Content on the Rheological Behaviour of Mayonnaise: Xanthan Gum Effects on Mayonnaise. Pak. J. Sci. Ind. Res. Ser. A Phys. Sci. 2024, 67, 1–10. [Google Scholar] [CrossRef] [Scilit]
  58. Alam, M.; Malakar, S.; Pant, K.; Dar, B.; Nanda, V. Comparative studies on the rheological characteristics, functional attributes, and baking stability of xanthan and guar gum formulated honey gel matrix. Food Sci. Technol. Int. 2025, 31, 490–505. [Google Scholar] [CrossRef] [Scilit] [PubMed]
  59. Zhang, J.; Tai, X.; Liu, H.; Ma, X.; Gao, X.; Luo, Y. Effect of xanthan gum on stability and rheological behavior of O/W emulsion. J. Dispers. Sci. Technol. 2025, 46, 2189–2197. [Google Scholar] [CrossRef] [Scilit]
  60. Karim, N.; Shishir, M.R.I.; Karim, M.S.; Khan, S.; Marappan, G.; Hashim, S.B.; Aalim, H.; Arslan, M.; Zhihua, L.; Zhai, X. Impact of Xanthan Gum on Emulsion-Based 3D Printed Foods: Mechanisms, Rheology, and Printability. Food Rev. Int. 2026, 42, 4873–4903. [Google Scholar] [CrossRef] [Scilit]
  61. Qaiser, A.A.; Nazar, R.; Anjum, M.; Saeed, A.; Zeeshan, M.; Tahir, B.; Muzaffar, M.; Jameel, N. Effects of composition, temperature and shear rate on chocolate milk rheology: An empirical modeling approach incorporating yield behavior. Int. J. Food Eng. 2021, 17, 561–569. [Google Scholar] [CrossRef] [Scilit]
  62. Fan, H.; Sun, L.; Liu, X.; Wen, Y.; Li, H.; Wang, J.; Sun, B. Modulation of viscosity, swallowability, and stability of starch-based thickener: The effect of konjac gum and xanthan gum. Food Res. Int. 2025, 223, 117844. [Google Scholar] [CrossRef] [Scilit] [PubMed]
  63. Lipkin, E.M.; Rogus-Pulia, N.M.; Nicosia, M.A.; Hartel, R.W. Hydrocolloid Effects on Shear and Extensional Rheology. Dysphagia 2026, 1–12. [Google Scholar] [CrossRef] [Scilit] [PubMed]
  64. Pelletier, E.; Viebke, C.; Meadows, J.; Williams, P. A rheological study of the order–disorder conformational transition of xanthan gum. Biopolym. Orig. Res. Biomol. 2001, 59, 339–346. [Google Scholar] [CrossRef] [Scilit]
  65. Charoensri, P.; Kijroongrojana, K.; Sukkwai, S. Comparison among the use of hydrocolloids to obtain texture-modified Riceberry rice porridge fortified with bio-calcium and fish protein hydrolysate from salmon (Salmo salar) frame for elderly with Dysphagia. Asia-Pac. J. Sci. Technol. 2026, 31, APST-31-02-12. [Google Scholar] [CrossRef] [Scilit]
  66. Li, Y.; Tian, W.; Chen, J.; Cao, R.; Cao, Y.; Xiao, J. Structural design of dysphagia-oriented double emulsions via internal-external phase coordination to modulate texture, rheology, and oral lubrication. Food Res. Int. 2026, 233, 118852. [Google Scholar] [CrossRef] [Scilit] [PubMed]
  67. Lan, Y.-C.; Lai, L.-S. Pasting and rheological properties of water caltrop starch as affected by the addition of konjac glucomannan, guar gum and xanthan gum. Food Hydrocoll. 2023, 136, 108245. [Google Scholar] [CrossRef] [Scilit]
  68. Kurt, A.; Atalar, I. Steady and dynamic shear rheology of aqueous solutions of quince seed gum combinations with locust bean or xanthan gums. Int. J. Biol. Macromol. 2024, 274, 133409. [Google Scholar] [CrossRef] [Scilit] [PubMed]
  69. Sara, H.; Yahoum, M.M.; Lefnaoui, S.; Abdelkader, H.; Moulai-Mostefa, N. New alkylated xanthan gum as amphiphilic derivatives: Synthesis, physicochemical and rheological studies. J. Mol. Struct. 2020, 1207, 127768. [Google Scholar] [CrossRef] [Scilit]
  70. Yahoum, M.M.; Moulai-Mostefa, N.; Le Cerf, D. Synthesis, physicochemical, structural and rheological characterizations of carboxymethyl xanthan derivatives. Carbohydr. Polym. 2016, 154, 267–275. [Google Scholar] [CrossRef] [Scilit] [PubMed]
  71. Xu, L.; Xu, G.; Liu, T.; Chen, Y.; Gong, H. The comparison of rheological properties of aqueous welan gum and xanthan gum solutions. Carbohydr. Polym. 2013, 92, 516–522. [Google Scholar] [CrossRef] [Scilit] [PubMed]
  72. Brunchi, C.-E.; Bercea, M.; Morariu, S.; Dascalu, M. Some properties of xanthan gum in aqueous solutions: Effect of temperature and pH. J. Polym. Res. 2016, 23, 123. [Google Scholar] [CrossRef] [Scilit]
  73. Banerjee, P.; Mukherjee, I.; Bhattacharya, S.; Datta, S.; Moulik, S.P.; Sarkar, D. Sorption of water vapor, hydration, and viscosity of carboxymethylhydroxypropyl guar, diutan, and xanthan gums, and their molecular association with and without salts (NaCl, CaCl2, HCOOK, CH3COONa, (NH4)2SO4 and MgSO4) in aqueous solution. Langmuir 2009, 25, 11647–11656. [Google Scholar] [CrossRef] [Scilit] [PubMed]
  74. Nsengiyumva, E.M.; Heitz, M.P.; Alexandridis, P. Thermal hysteresis phenomena in aqueous xanthan gum solutions. Food Hydrocoll. 2023, 144, 108973. [Google Scholar] [CrossRef] [Scilit]
Figure 1. FTIR spectra of the xanthan gum powder.
Polymers 18 02074 g001
Figure 2. TGA and dTGA curves of different xanthan samples.
Polymers 18 02074 g002
Figure 3. DSC thermograms of different xanthan samples 3.7. Rheological behavior of xanthan gum samples.
Polymers 18 02074 g003
Figure 4. Steady shear rheological behavior of xanthan gum (0.5% solutions at 20 °C) produced from different date cultivars.
Polymers 18 02074 g004
Figure 5. Shear rate vs. shear stress curves of xanthan gum samples as a function of concentration at 20 °C.
Polymers 18 02074 g005
Figure 6. Frequency sweep dependency of storage (G′) and loss modulus (G″) of xanthan gum solution (1%) at 25 °C.
Polymers 18 02074 g006
Table 1. Composition of date juices used as a substrate for xanthan gum production.
SubstrateBrix°Fructose %Glucose %Sucrose %
Sukkari174.695.006.91
Barhi16.58.808.830.00
Saqai168.248.630.06
Wannana168.518.840.00
Sabbaka168.838.820.00
Shagra147.918.020.12
Khalas12.58.058.690.03
Table 2. Composition and yield of xanthan gum.
SubstrateRaw Yield/Total Solids (g/L)Calculated Polymer Yield (g/L)Moisture (%)Ash (%)Protein (%)
Sukkari7.255.627.98 ± 0.29 c13.57 ± 0.10 cd0.88 ± 0.15 cd
Barhi7.776.108.17 ± 0.20 c12.60 ± 0.13 d0.70 ± 0.12 de
Saqai7.585.817.61 ± 0.28 c14.44 ± 0.18 bc1.36 ± 0.08 ab
Wannana6.454.867.61 ± 0.44 c15.59 ± 0.15 ab1.46 ± 0.11 a
Sabbaka7.225.338.08 ± 0.46 c16.51 ± 0.85 a1.54 ± 0.06 a
Shagra6.975.227.69 ± 0.46 c16.31 ± 0.73 a1.08 ± 0.14 bc
Khalas5.604.1711.24 ± 0.31 a13.58 ± 0.29 cd0.68 ± 0.06 de
Glucose6.684.9310.91 ± 0.39 ab14.91 ± 0.55 abc0.39 ± 0.02 ef
Sucrose6.234.777.90 ± 0.29 c15.09 ± 0.51 abc0.45 ± 0.09 ef
Commercial--10.37 ± 0.08 b7.52 ± 0.77 e0.17 ± 0.03 f
Means carrying different letters in a column are significantly different (p ≤ 5) from each other.
Table 3. Color parameters of xanthan gum samples from different substrates.
L*A*B*ΔEWI
Sukkari71.00 ± 0.60 c5.65 ± 0.07 d21.71 ± 0.28 c17.7463.34
Barhi67.81 ± 0.13 d4.00 ± 0.09 f19.13 ± 0.25 d24.8562.34
Saqai62.30 ± 1.66 fg6.95 ± 0.44 b23.71 ± 0.80 b23.2654.92
Wannana63.05 ± 0.54 ef5.31 ± 0.24 d22.15 ± 0.56 c22.5356.59
Sabbaka63.93 ± 1.07 e5.63 ± 0.26 d22.21 ± 0.33 c25.0057.27
Shagra61.09 ± 0.47 h6.10 ± 0.10 c21.04 ± 0.24 c21.5755.35
Khalas67.23 ± 1.40 d7.86 ± 0.28 a25.44 ± 1.61 a17.3757.77
Glucose69.93 ± 0.82 c4.81 ± 0.15 e25.04 ± 0.33 a10.3260.58
Sucrose82.81 ± 0.58 b1.77 ± 0.10 g25.53 ± 1.02 a16.0669.17
Commercial84.71 ± 0.40 a−0.02 ± 0.02 h15.55 ± 0.28 e18.2178.19
Means carrying different letters in a column are significantly different (p ≤ 5) from each other.
Table 4. FTIR spectra bands position.
-C-OC-O-C, C-O-COO-, C-H, C-OCOO-C=O-CH-OH
Sugar Ring VibrationC–O–C and C–O StretchingCOO Symmetric Stretching,
C–H Bending,
C–O Stretching
COO ASYMMETRIC StretchingVibration of the Carbonyl (C=O)Axial DEFORMATION
of -CH2
Axial
Deformation
of -OH
Sukkari78410181401-12421603171428773220
Barhi78310181403-12411603171428883197
Saqai78510171404-12401603171428753193
Wannana78310181405-12401603171428663232
Sabbaka78410191404-12411604171429013192
Shagra78810161402-12381600171428973200
Khalas78910141403-12391603171528973198
Glucose78310161402-12411602171528763234
Sucrose78210171403-12401602171528803213
Xanthan-Commercial78210191403-12401600171428823234
Table 5. Thermal degradation parameters of the xanthan gum samples.
Decomposition Stage 1Decomposition Stage 2
Temp. Range (°C)DTG Maximum (°C)%wt LossTemp. Range (°C)DTG Maximum (°C)%wt LossTotal Weight Loss (1 and 2)Residue at 500 °C
Sukkari35–169.4181.13 ± 0.34 b7.98 ± 0.29 c169.41–389.05293.46 ± 0.33 d29.94 ± 0.25 ef37.93 ± 0.34 f51.51 ± 0.34 c
Barhi35–164.3881.53 ± 0.06 b8.17 ± 0.20 c164.38–393.99294.86 ± 1.02 c30.07 ± 0.23 de38.25 ± 0.03 ef52.15 ± 0.55 bc
Saqai35–166.2479.07 ± 0.67 de7.61 ± 0.28 c166.24–407.76294.18 ± 0.34 cd30.95 ± 0.37 cd38.56 ± 0.12 e49.79 ± 0.67 d
Wannana35–160.7278.46 ± 1.08 e7.61 ± 0.44 c160.72–397.09295.29 ± 0.69 c33.92 ± 0.47 c41.53 ± 0.14 b54.05 ± 0.30 a
Sabbaka35–165.0380.01 ± 0.07 cd8.08 ± 0.46 c165.03–399.34296.67 ± 0.89 ab29.08 ± 0.84 fg37.16 ± 0.57 g53.64 ± 0.53 a
Shagra35–164.4180.82 ± 0.06 bc7.69 ± 0.46 c164.41–395.15294.84 ± 0.43 c30.33 ± 0.70 cde38.02 ± 0.09 f52.76 ± 0.09 b
Khalas35–167.8383.02 ± 0.71 a11.24 ± 0.31 a167.76–396.24295.47 ± 0.14 bc28.72 ± 0.30 g39.95 ± 0.09 c48.93 ± 0.17 e
Glucose35–172.5982.87 ± 0.34 a10.91 ± 0.39 ab172.59–391.31296.70 ± 0.34 ab27.26 ± 0.41 h38.17 ± 0.10 ef50.09 ± 0.24 d
Sucrose35–164.2576.04 ± 0.12 f7.90 ± 0.29 c164.24–396.28297.90 ± 0.66 a31.18 ± 0.31 c39.08 ± 0.05 d52.18 ± 0.40 bc
Commercial35–190.7478.94 ± 0.28 e10.37 ± 0.08 b190.74–380.60288.36 ± 0.78 e42.89 ± 0.32 a53.26 ± 0.27 a33.49 ± 0.26 f
Means carrying different letters in a column are significantly different (p ≤ 5) from each other.
Table 6. DSC parameters of the xanthan gum samples.
Peak 1 (Loss of Free Water)Peak 2 (Loss of Bound Water)Glass TransitionPeak 3 (Enthalpic Relaxation)Peak 4 (Degradation)
Xanthan Gum SamplesTp (°C)∆H (J/g)Tp (°C)∆H (J/g)Tg (Midpoint) (°C)∆CpTp (°C)∆ H (J/g)Td (°C)d H (J/g)
Sukkari65.29 ± 0.86 b1.05 ± 0.08 cd111.97 ± 1.43 a8.56 ± 1.11 d139.16 ± 2.14 bcd0.040 ± 0.005 cd153.51 ± 0.68 ab5.68 ± 0.48 a184.05 ± 1.32 def157.73 ± 2.72 d
Barhi62.96 ± 0.38 c0.98 ± 0.02 cd110.48 ± 0.61 abc9.01 ± 0.63 cd137.28 ± 0.70 d0.020 ± 0.003 f148.78 ± 0.88 de2.46 ± 0.15 e185.67 ± 0.62 cdef136.47 ± 3.30 f
Saqai63.19 ± 0.36 c1.41 ± 0.26 b109.71 ± 0.64 bcde7.76 ± 0.27 de141.37 ± 0.35 bc0.043 ± 0.006 bcd155.57 ± 1.58 a3.86 ± 0.20 cd191.47 ± 1.57 b145.26 ± 2.61 e
Wannana65.88 ± 1.27 bc1.27 ± 0.09 bc109.96 ± 0.22 bcd9.79 ± 0.45 b144.96 ± 0.31 a0.073 ± 0.005 a155.48 ± 0.90 a4.57 ± 0.31 bc187.16 ± 1.52 cd160.46 ± 2.43 cd
Sabbaka63.09 ± 0.26 c1.49 ± 0.08 b109.27 ± 0.97 cde9.32 ± 0.66 cd141.87 ± 1.97 b0.031 ± 0.002 e152.02 ± 1.10 bc4.87 ± 0.71 ab198.86 ± 1.25 a134.65 ± 4.26 f
Shagra62.82 ± 0.50 c0.77 ± 0.09 de111.26 ± 0.83 ab10.99 ± 0.51 a140.57 ± 0.54 bc0.032 ± 0.002 e149.81 ± 0.51 cde4.41 ± 0.09 bc188.85 ± 1.12 bc161.41 ± 4.14 cd
Khalas63.72 ± 0.12 c1.92 ± 0.15 a108.25 ± 0.51 e9.43 ± 0.75 cd139.53 ± 0.94 bcd0.046 ± 0.003 bc148.03 ± 1.36 e4.58 ± 0.35 bc182.91 ± 1.41 ef172.11 ± 2.32 b
Glucose63.26 ± 0.57 c1.27 ± 0.20 bc108.53 ± 0.89 de9.54 ± 0.58 bc140.64 ± 1.04 bc0.032 ± 0.002 e152.01 ± 1.54 bc4.62 ± 0.45 bc191.52 ± 2.87 b183.74 ± 3.84 a
Sucrose63.22 ± 0.07 c0.65 ± 0.02 e110.67 ± 1.05 abc6.55 ± 0.68 e139.07 ± 2.29 cd0.037 ± 0.002 de148.77 ± 0.88 de4.58 ± 0.65 bc185.93 ± 2.55 cde166.95 ± 2.90 bc
Commercial78.41 ± 0.55 a1.55 ± 0.19 b--145.26 ± 0.80 a0.050 ± 0.006 b150.71 ± 1.07 cd3.03 ± 0.34 de182.19 ± 1.67 f140.79 ± 1.93 ef
Tp, peak temperature; ∆H, enthalpy change; Td, degradation temperature; d H, enthalpy change in degradation. Means carrying different letters in a column are significantly different (p ≤ 5) from each other.
Table 7. Power law model parameters of different xanthan gums.
20 °C30 °C40 °C
KnR2KnR2KnR2
0.25%
Sukkari0.210.580.9910.150.610.9900.120.650.994
Barhi0.150.610.9920.110.640.9940.090.670.994
Saqai0.130.620.9890.100.650.9930.060.700.993
Wannana0.130.640.9930.090.670.9940.070.710.995
Sabbaka0.140.630.9940.100.660.9900.070.710.990
Shagra0.100.660.9940.070.690.9910.050.730.995
Khalas0.150.600.9930.120.630.9890.080.670.994
Glucose0.240.560.9870.170.590.9940.120.640.995
Sucrose0.520.440.9920.400.470.9950.280.520.993
Commercial0.780.290.9940.710.300.9940.600.310.992
0.5%
Sukkari0.750.450.9910.580.480.9910.450.510.992
Barhi0.900.450.9860.700.480.9940.460.530.991
Saqai0.490.510.9920.360.550.9870.260.590.990
Wannana0.680.480.9930.490.520.9890.310.580.994
Sabbaka0.660.480.9950.490.510.9900.310.580.994
Shagra0.420.540.9930.290.580.9940.180.640.993
Khalas0.690.460.9900.510.500.9900.330.550.994
Glucose1.020.420.9880.800.450.9910.550.510.992
Sucrose1.560.340.9871.281.370.9931.060.390.991
Commercial4.250.170.9924.140.180.9944.050.200.991
0.75%
Sukkari2.800.340.992.350.360.9901.860.390.991
Barhi3.380.330.9902.800.360.9882.110.390.990
Saqai1.920.390.9641.490.420.9890.980.480.992
Wannana2.260.370.9941.800.400.9931.360.440.991
Sabbaka2.610.360.9931.980.390.9951.280.460.995
Shagra1.640.420.9921.170.470.9940.740.520.993
Khalas2.610.350.9942.200.360.9911.570.410.992
Glucose2.990.330.9882.540.340.9882.090.370.994
Sucrose5.060.250.9894.710.260.9873.940.280.995
Commercial7.370.200.9936.830.210.9846.300.230.995
1%
Sukkari8.170.270.9826.730.290.9945.320.320.994
Barhi8.650.270.9837.010.290.9915.360.330.993
Saqai7.310.280.9916.090.300.9944.830.320.992
Wannana6.440.290.9935.270.310.9894.040.350.990
Sabbaka4.960.320.9864.170.340.9923.080.380.989
Shagra7.770.280.9906.490.290.9904.810.340.988
Khalas9.470.250.9837.110.290.9885.690.310.99
Glucose11.010.220.9749.580.230.9837.950.250.98
Sucrose11.340.200.96310.640.210.9848.620.230.98
Commercial---------
K = (Pa·s) indices are obtained by fitting the data to power law τ = Kγ·n and n = flow behavior index (dimensionless). This table was used for Arrhenius equation.
Table 8. Activation energy parameters of xanthan gum solutions (0.25%) produced from different substrates.
VarietiesRegression EquationEa (KJ/mol)ln(K0)K0 (Pa sn)R2
SukkarilnK = −10.356 + 2573.806(1/T)21.4−10.3563.18 × 10−50.994
BarhilnK = −9.926 + 2349.249(1/T)19.53−9.9264.90 × 10−50.994
SaqailnK = −14.055 + 3535.166(1/T)29.39−14.0557.89 × 10−70.995
WannanalnK = −11.766 + 2846.504(1/T)23.67−11.7667.77 × 10−60.993
SabbakalnK = −12.806 + 3179.613(1/T)26.44−12.8062.74 × 10−60.994
ShagralnK = −13.154 + 3181.197(1/T)26.45−13.1541.94 × 10−60.992
KhalaslnK = −11.672 + 2875.033(1/T)23.9−11.6728.54 × 10−60.974
GlucoselnK = −12.272 + 3180.460(1/T)26.44−12.2724.68 × 10−60.993
SucroselnK = −10.309 + 2835.879(1/T)23.58−10.3093.33 × 10−50.992
CommerciallnK = −4.328 + 1199.771(1/T)9.98−4.3281.32 × 10−20.974
K0 (Pa sn) = is the frequency factor at a reference temperature (20, 30 and 40 °C); Ea = activation energy (KJ/mol K−1).
Disclaimer/Publisher’s Note: The statements, opinions and data contained in all publications are solely those of the individual author(s) and contributor(s) and not of MDPI and/or the editor(s). MDPI and/or the editor(s) disclaim responsibility for any injury to people or property resulting from any ideas, methods, instructions or products referred to in the content.