After calibrating all equipment and performing the experimental procedures, the results are provided in four sections.
3.1. Data Envelopment Analysis: Efficiency and Optimal Diethanolamine Concentration
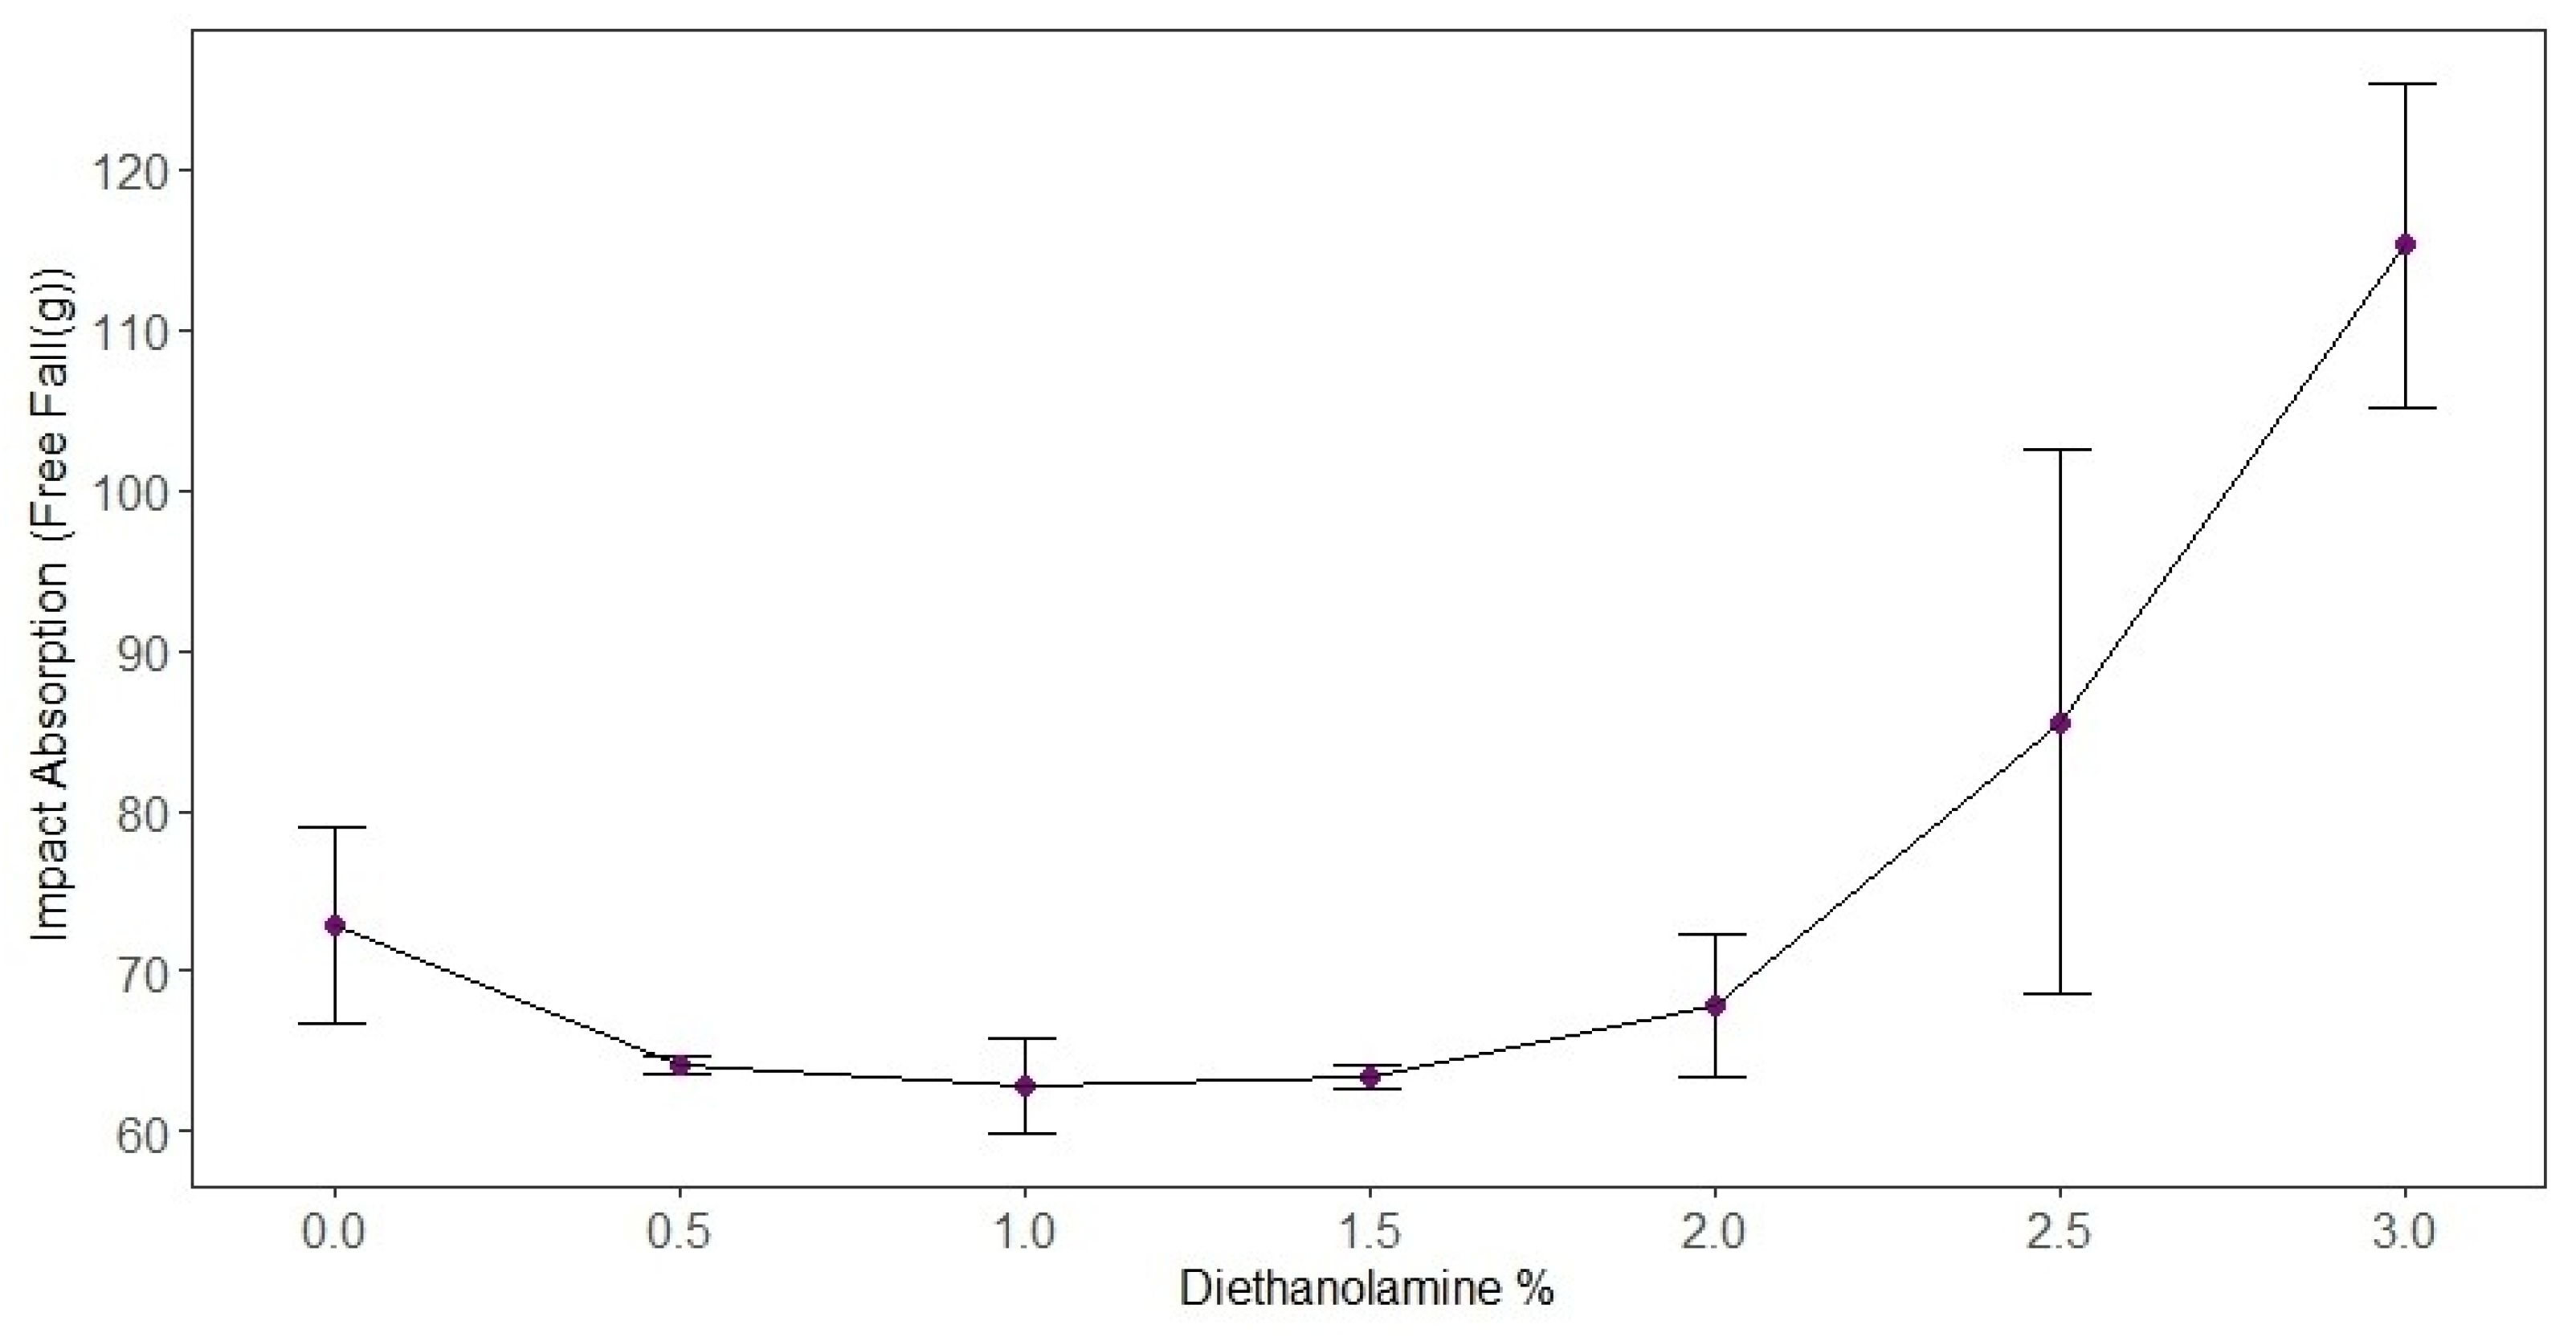
For each formulation, ten specimens (n = 10) were tested. The results from the impact tests were processed using R software version 4.3.2 (R Foundation for Statistical Computing, Vienna, Austria) (
Figure 4). Although the literature has already suggested that concentrations above 2.0 wt% are not recommended for foam applications [
26,
27,
28,
29,
30], this study investigated higher percentages, as shown in
Figure 4. This decision was made because previous studies did not evaluate impact absorption, leaving a gap that is addressed in the present research.
The physical and mechanical performance of the synthesized rigid polyurethane (PU) foams is deeply governed by a complex trade-off between chemical crosslinking, cell morphology, and apparent density distribution. Diethanolamine (DEOA) plays a crucial role as a crosslinking agent, directly affecting the kinetic balance between the blowing (gas expansion) and gelling (polymerization) reactions.
When incorporated at the optimal concentration of 1 wt%, DEOA moderately increases the viscosity of the reacting medium during the initial expansion stage. This timely increase in viscosity enhances gas retention within the cellular matrix, preventing premature gas escape and leading to a highly homogeneous structure dominated by well-defined closed cells. Morphologically, this uniform microstructure may reduce is associated with severe density gradients across the mold, which translates into a more isotropic material capable of progressive deformation. Consequently, this optimized cellular framework ikely contributes to the maximum energy dissipation efficiency observed, yielding a 13.8% reduction in transmitted peak acceleration.
Conversely, incorporating higher concentrations of DEOA (≥2 wt%) triggers a severe imbalance in the reaction kinetics. At these elevated thresholds, excessive crosslinking causes the gelling reaction to occur too rapidly, leading to premature immobilization of the polyurethane matrix. As the blowing gas continues to expand against a prematurely rigidified and stiffened polymer network, localized internal pressures build up, promoting cell wall rupture and subsequent coalescence. As evidenced by Scanning Electron Microscopy (SEM) analysis, this phenomenon results in a highly heterogeneous structure characterized by larger, collapsed, and irregular cell cavities. This severe structural degradation destroys the foam’s ability to undergo uniform progressive collapse under dynamic loading, ultimately compromising its impact absorption capacity.
From a physicochemical standpoint, the increase in diethanolamine content accelerates the formation of urea and urethane linkages due to the greater availability of hydroxyl and amine groups. At higher concentrations, these reactions occur more rapidly and less uniformly, altering the balance between blowing and gelling reactions. This imbalance may also affect local structural organization and contribute to heterogeneity within the foam. As a result, even when macroscopic density appears similar, the internal cellular structure becomes more irregular.
The results suggest that higher DEOA concentrations may favor earlier network formation and increased structural rigidity, leading to premature cell stabilization and restricted expansion. This phenomenon results in irregular, partially collapsed cells or thicker cell walls, increasing cellular anisotropy. Consequently, the foam exhibits heterogeneous mechanical behavior, with rigid domains coexisting with less structured regions. This structural variability explains the greater dispersion observed in the impact results at higher concentrations.
Figure 4 shows the average transmitted peak acceleration values and the corresponding standard deviations (error bars) for each diethanolamine concentration. Concentrations of 0.5 wt%, 1.0 wt%, and 1.5 wt% present the lowest peak acceleration values, ranging from 60 g to 70 g.
To quantitatively assess the effect of DEOA addition on impact attenuation performance, the percentage reduction in transmitted peak acceleration was calculated relative to the neat PU foam according to Equation (2), where APU represents the mean transmitted peak acceleration of the unmodified foam and ADEOA corresponds to the mean transmitted peak acceleration of the DEOA-modified formulation. This approach allows a direct comparison of the effectiveness of each formulation in reducing impact-induced acceleration and provides a quantitative measure of the improvement achieved by DEOA incorporation.
where
is the mean transmitted peak acceleration of the neat polyurethane foam and
is the mean transmitted peak acceleration of the foam containing DEOA.
Table 1 summarizes the mean transmitted peak acceleration values obtained for the polyurethane foams containing different DEOA concentrations. The formulation containing 1.0 wt % DEOA exhibited the lowest transmitted peak acceleration (62.79 g), indicating the best impact attenuation performance among all evaluated formulations. In comparison, neat PU foam presented an average transmitted peak acceleration of 72.88 g. This corresponds to a reduction of 13.84%, demonstrating the beneficial effect of DEOA addition on impact performance.
The increased variability observed at certain concentrations is attributed to microstructural heterogeneity arising from localized differences in reaction kinetics and crosslink density. Even under identical processing conditions, small variations in cellular morphology – such as cell size distribution and cell wall thickness – can influence impact response, resulting in dispersion of the measured acceleration values. Such behavior is inherent to rigid polyurethane foams and has been widely reported in the literature [
12,
23,
28].
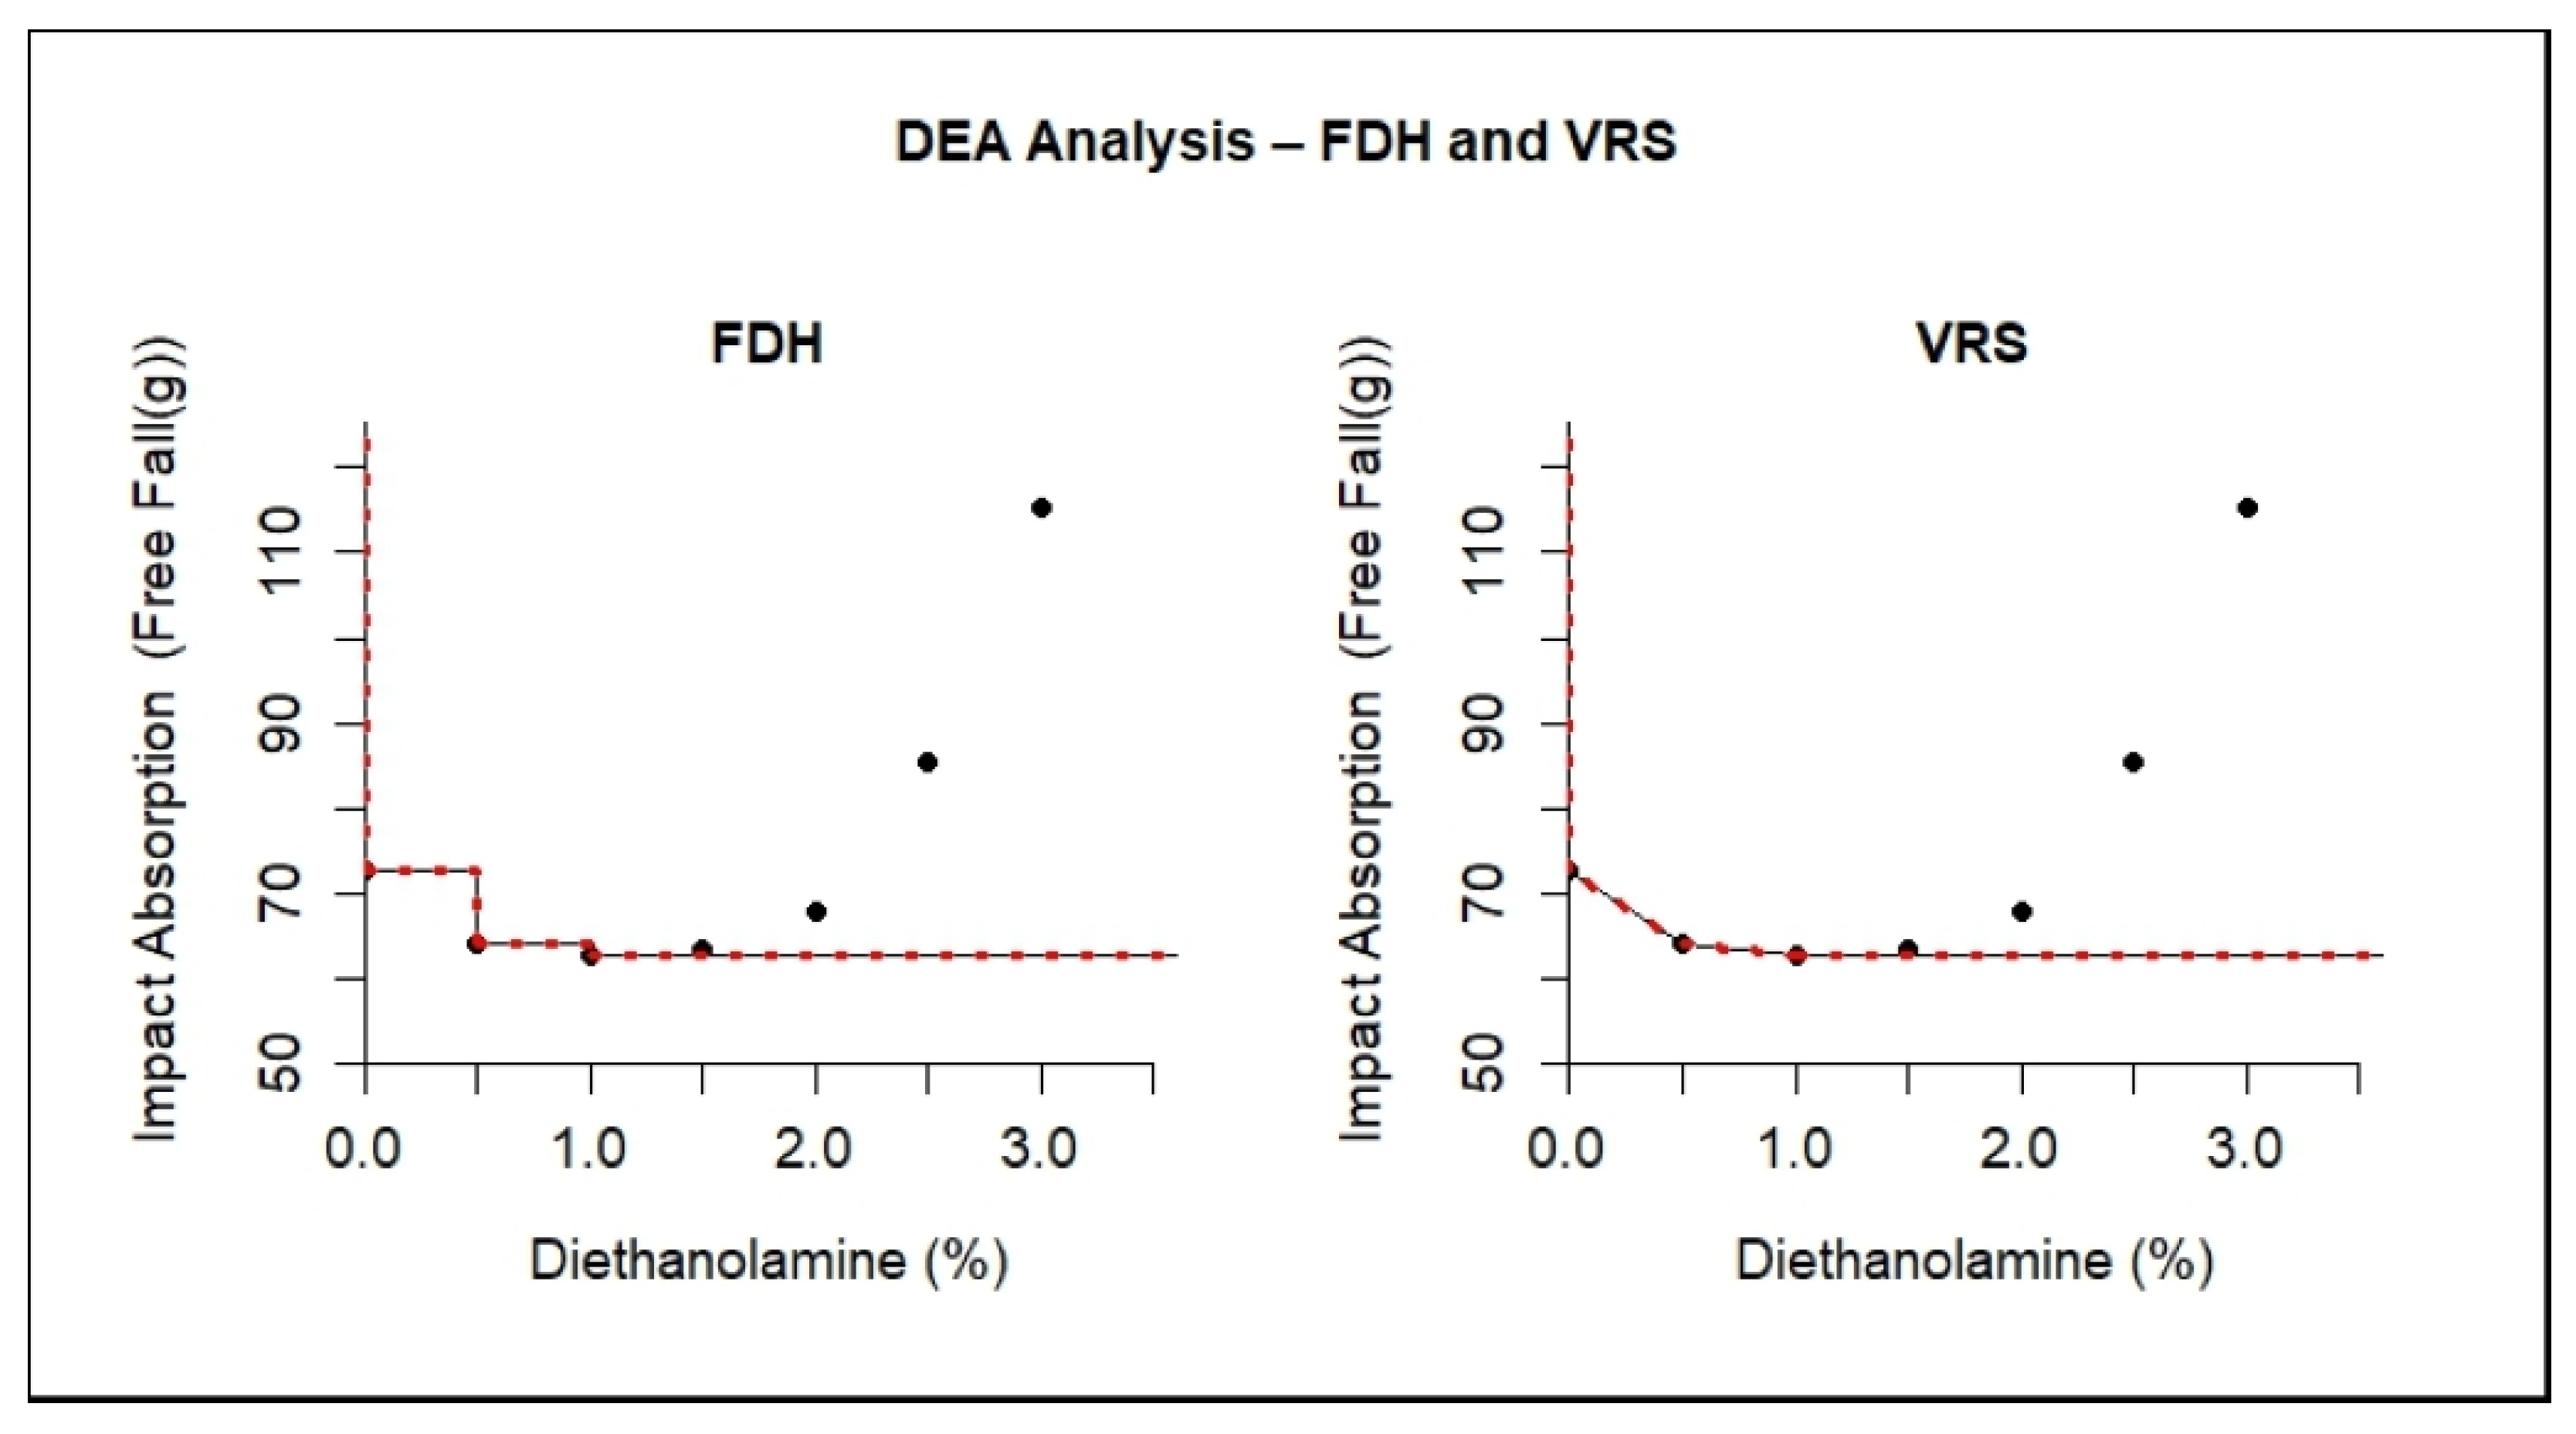
To determine which of these concentrations is most efficient, balancing diethanolamine content and impact attenuation performance, the analysis focused on identifying the optimal point that minimizes input and maximizes output.
For this purpose, two DEA (Data Envelopment Analysis) models were applied: (i) Free Disposal Hull (FDH); and (ii) Variable Returns to Scale (VRS).
The FDH model assumes that inefficient units can eliminate any amount of input without reducing output. In this case, efficient units are those in which the diethanolamine concentration is minimized without negatively affecting impact attenuation performance. It is important to note that FDH evaluates efficiency based on the dataset by identifying units closest to the efficiency frontier and using resources most effectively.
The VRS model, on the other hand, evaluates the efficiency of each unit relative to the efficiency frontier while allowing for variable returns to scale. This model is also input-oriented.
Figure 5 presents the DEA results, where the dashed red line represents the efficiency frontier, and each point corresponds to an individual formulation. Efficiency is determined by the position of each point relative to this frontier, with impact performance considered as the output parameter. Based on this analysis, the formulation containing 1.0 wt% diethanolamine was identified as the most efficient, as increasing the concentration to 1.5 wt% does not justify the additional input. Although the 0.5 wt%, 1.0 wt%, and 1.5 wt% formulations lie on the efficiency frontier. The increased variability at certain 1.0 wt%, and 1.5 wt% formulations lie on the efficiency frontier, the selection of 1.0 wt% is supported by an input-oriented criterion, as it minimizes diethanolamine content while maintaining equivalent impact performance.
These trends are reinforced by
Table 2, which summarizes the effect of DEOA concentrations on the dominant chemical reactions, the resulting structure, and the relative efficiency. Concentrations between 2 wt% and 3 wt% excessively increased foam stiffness, compromising the ability for progressive deformation during impact. On the other hand, concentrations below 0.5 wt% did not provide enough hydroxyl groups to enhance NCO conversion and stabilize the cellular morphology, resulting in inconsistent mechanical responses.
The relationships presented in
Table 2 are supported by literature reports on structure–property correlations in polyurethane foams [
1,
8,
11,
28].
Concentrations between 2 wt% and 3 wt% increased foam stiffness and compromised controlled deformation capacity, resulting in poorer energy dissipation and higher residual acceleration. This behavior is characteristic of excessively crosslinked foams, which absorb less energy through plastic deformation and tend to fracture more easily under severe impacts.
Conversely, concentrations below the efficiency threshold (0–0.5 wt%) do not provide sufficient reactive groups to improve cell uniformity and isocyanate group conversion, resulting in less compact foams with greater structural variability and inconsistent mechanical performance. Thus, DEOA acts as a property modifier, but its function is highly dependent on the optimal proportion.
The presented results are consistent with the literature [
26,
27,
28,
29,
30], which indicates that DEOA, acting as a nucleophilic agent and potential chain extender, increases urethane bond density, reduces structural defects, and provides greater homogeneity to the foams. While this behavior had already been observed for flexible foams, this study demonstrates that it also applies to rigid polyurethane foams. The use of DEOA as a reactive additive therefore improves cellular structure efficiency up to a certain limit, beyond which excessive crosslinking causes the material to lose its elastic and plastic deformation capacity, two fundamental mechanisms for impact energy absorption.
Thus, the application of DEA in conjunction with DEA-based efficiency analysis proves to be a viable methodological tool to avoid misleading interpretations based solely on individual impact values. While classical analyses might suggest contradictory trends, DEA enables the integration of multiple parameters, revealing that the key objective is not to maximize or minimize a single value, but rather to optimize the relationship between formulation and overall performance.
DEA analysis proved to be essential for integrating multiple parameters and avoiding conclusions based on isolated data. Based on the FDH and VRS analyses, it was confirmed that the formulation containing 1% DEOA is the most efficient; therefore, only this foam was selected for complementary characterizations (SEM, FTIR, and TGA/DTG), as it represents the most relevant condition for subsequent characterization in terms of impact attenuation performance.
3.2. Ftir-Atr
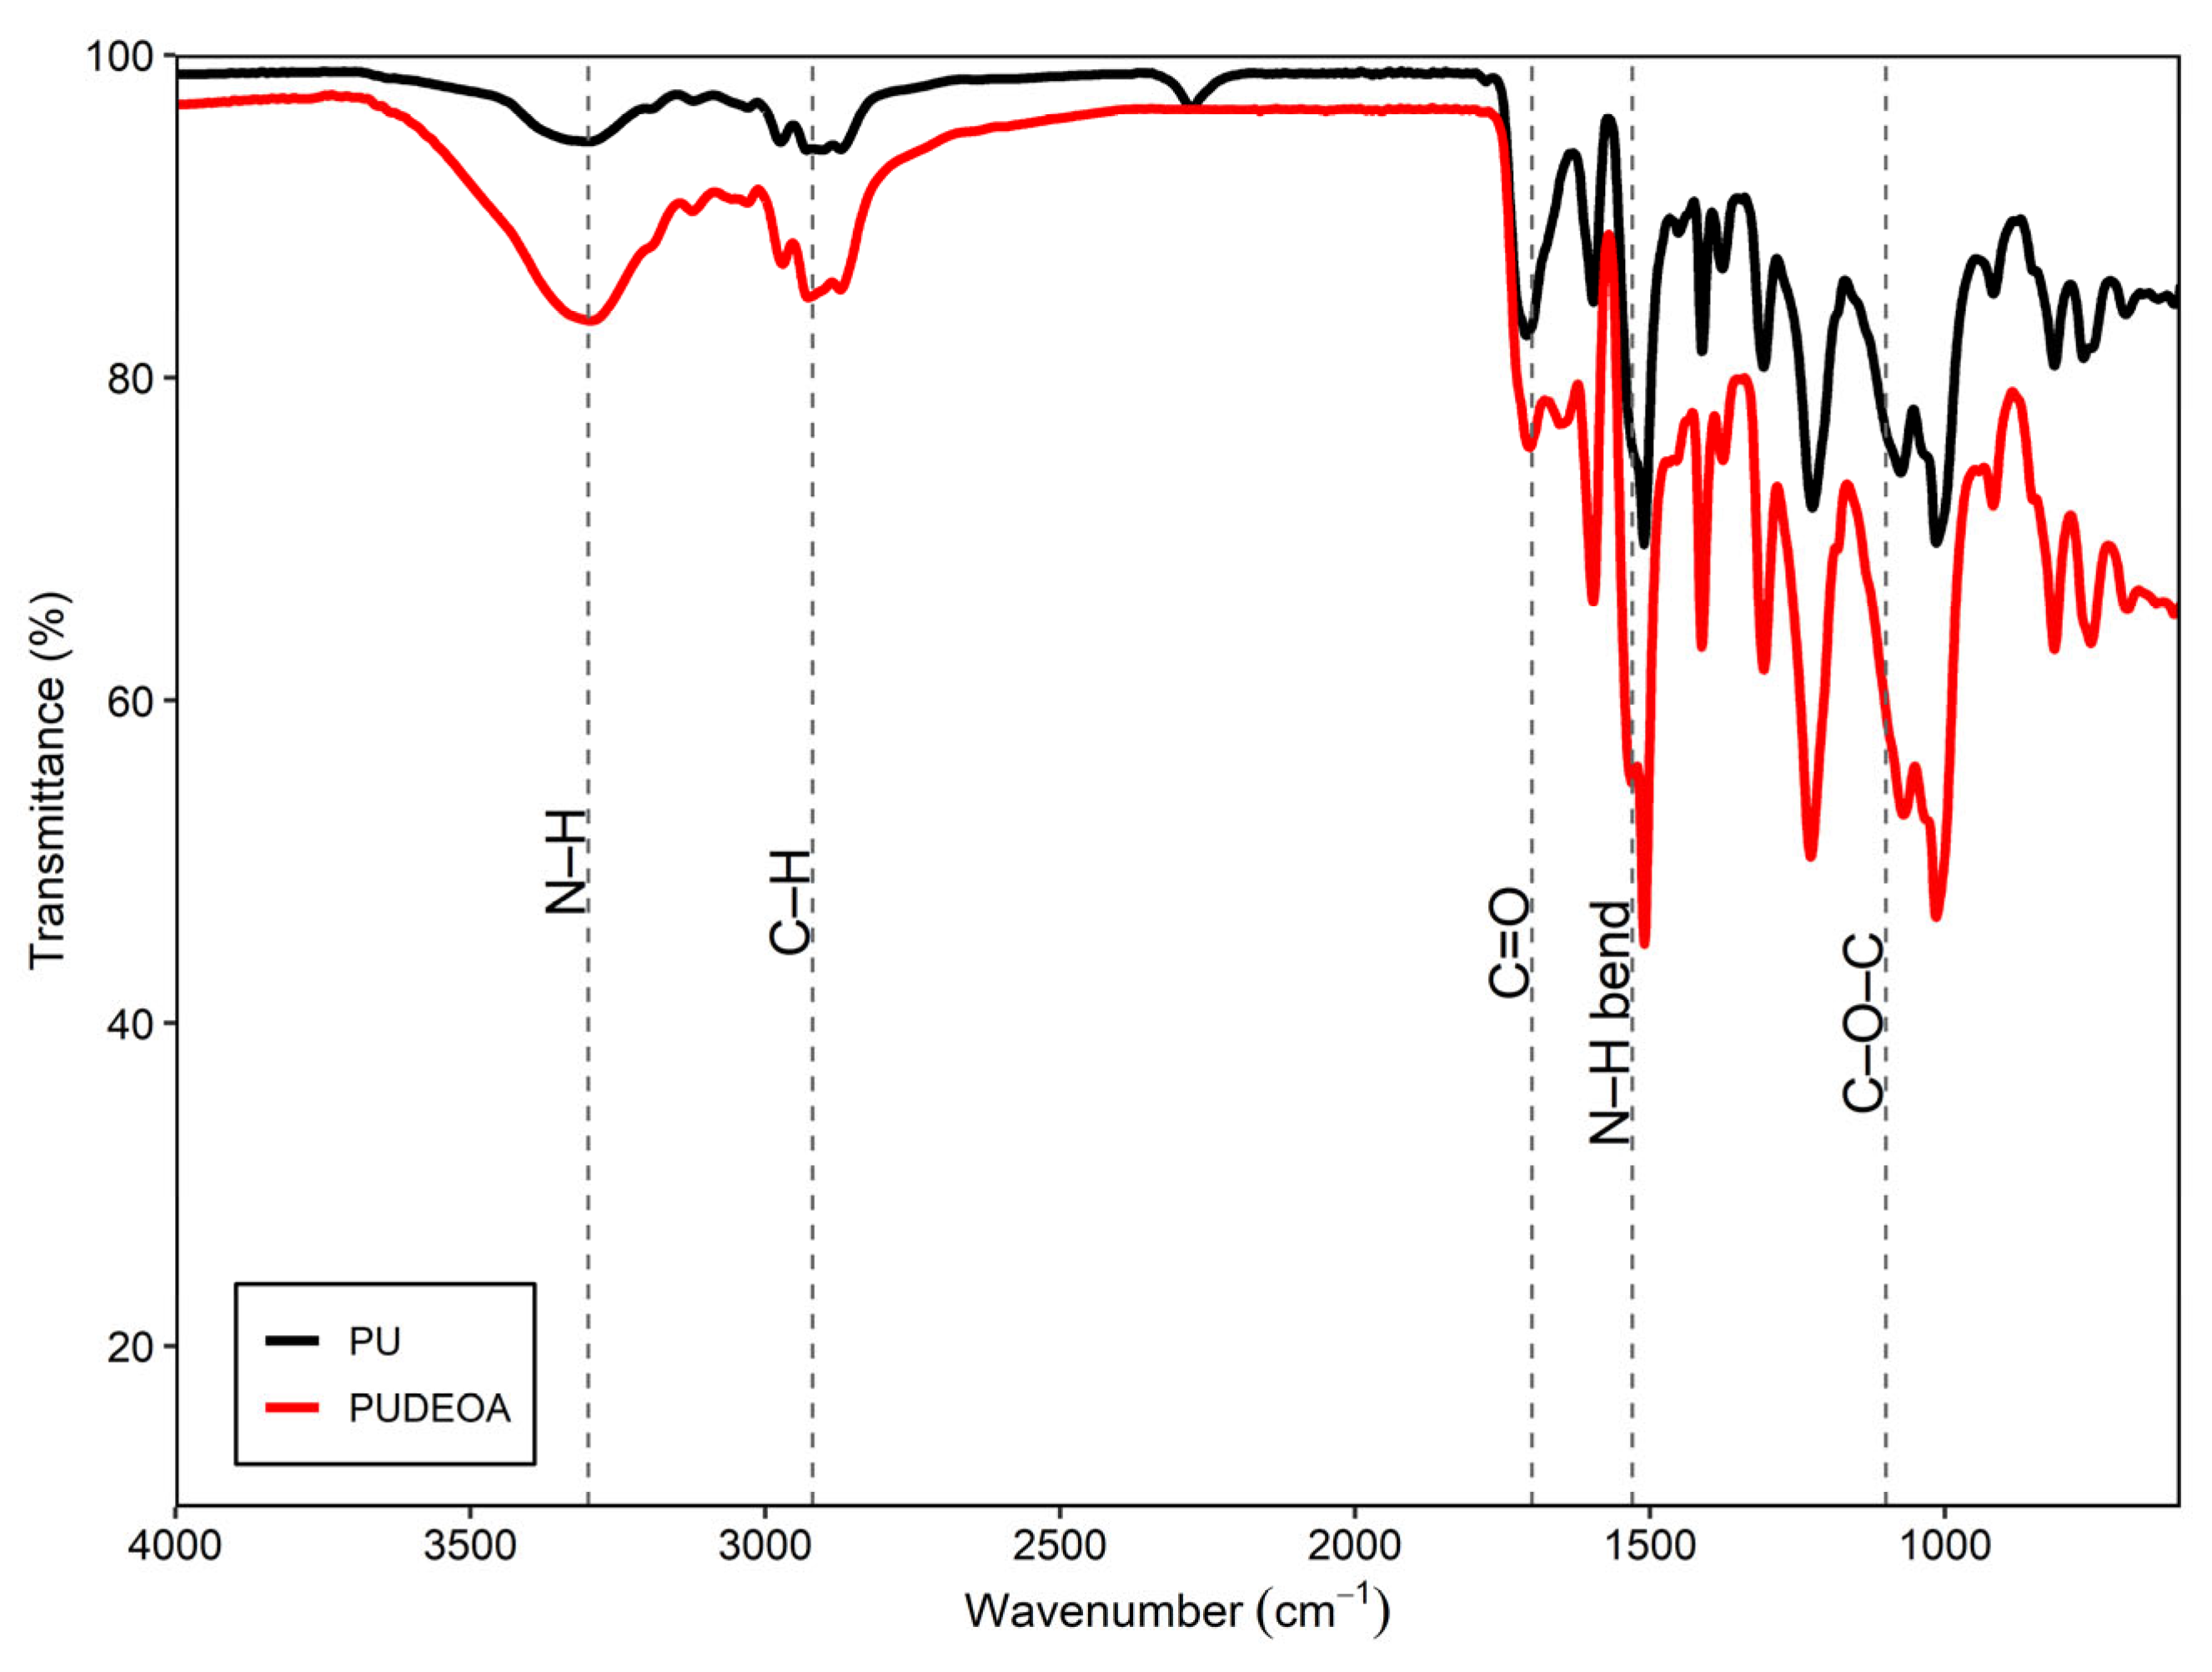
The ATR-FTIR spectra of polyurethane (PU) and polyurethane containing 1 wt% diethanolamine (PU-DEOA) are presented in
Figure 6. FTIR analysis was performed to investigate the chemical modifications promoted by DEOA incorporation and to identify possible changes in the characteristic functional groups of the polyurethane network. Attention was given to the regions associated with N–H stretching, urethane carbonyl (C=O) vibrations, C–N and C–O–C bonds, as these bands provide valuable information regarding hydrogen bonding, urethane formation, and the overall organization of the polymer structure.
Overall, both spectra exhibit the characteristic bands of rigid polyurethane foams, including N–H stretching, C=O vibrations of the urethane group, and bands associated with soft-chain segments. However, important changes are observed when 1% DEOA is incorporated, reflecting structural modifications consistent with the literature [
29,
30,
31,
32] and with the mechanical effects detected in the impact tests.
The broad band between 3200 and 3500 cm−1 arises from N–H stretching vibrations and overlaps with O–H groups engaged in hydrogen bonding. The PU-DEOA sample exhibits higher intensity in this region, suggesting an increase in hydrogen-bonded structures, likely due to additional hydroxyl groups from DEOA.
The absorption band in the range of 1700–1730 cm−1 corresponds to the C=O stretching of urethane groups. A slight reduction in intensity is observed in the PU–DEOA spectrum, suggesting modifications in the chemical environment of carbonyl groups, possibly due to the formation of secondary urethane or urea-type structures.
In the region between 1500–1300 cm−1, associated with N–H bending and C–N stretching vibrations, the PU–DEOA foam exhibits increased band definition, indicating the incorporation of nitrogen-containing groups into the polymer network.
The region between 1200–1000 cm−1, related to C–O–C stretching vibrations, shows noticeable changes in the PU–DEOA sample, suggesting alterations in the polymer backbone organization and no residual isocyanate band (~2270 cm−1) was observed, indicating effective NCO conversion.
Overall, the spectral differences suggest that the addition of 1 wt% DEOA modifies the chemical structure of the polyurethane network, possibly increasing hydrogen bonding interactions and favoring a more homogeneous distribution of urethane linkages. These changes are consistent with the improved cellular morphology and impact attenuation performance observed for this formulation.
3.3. Apparent Density Analysis
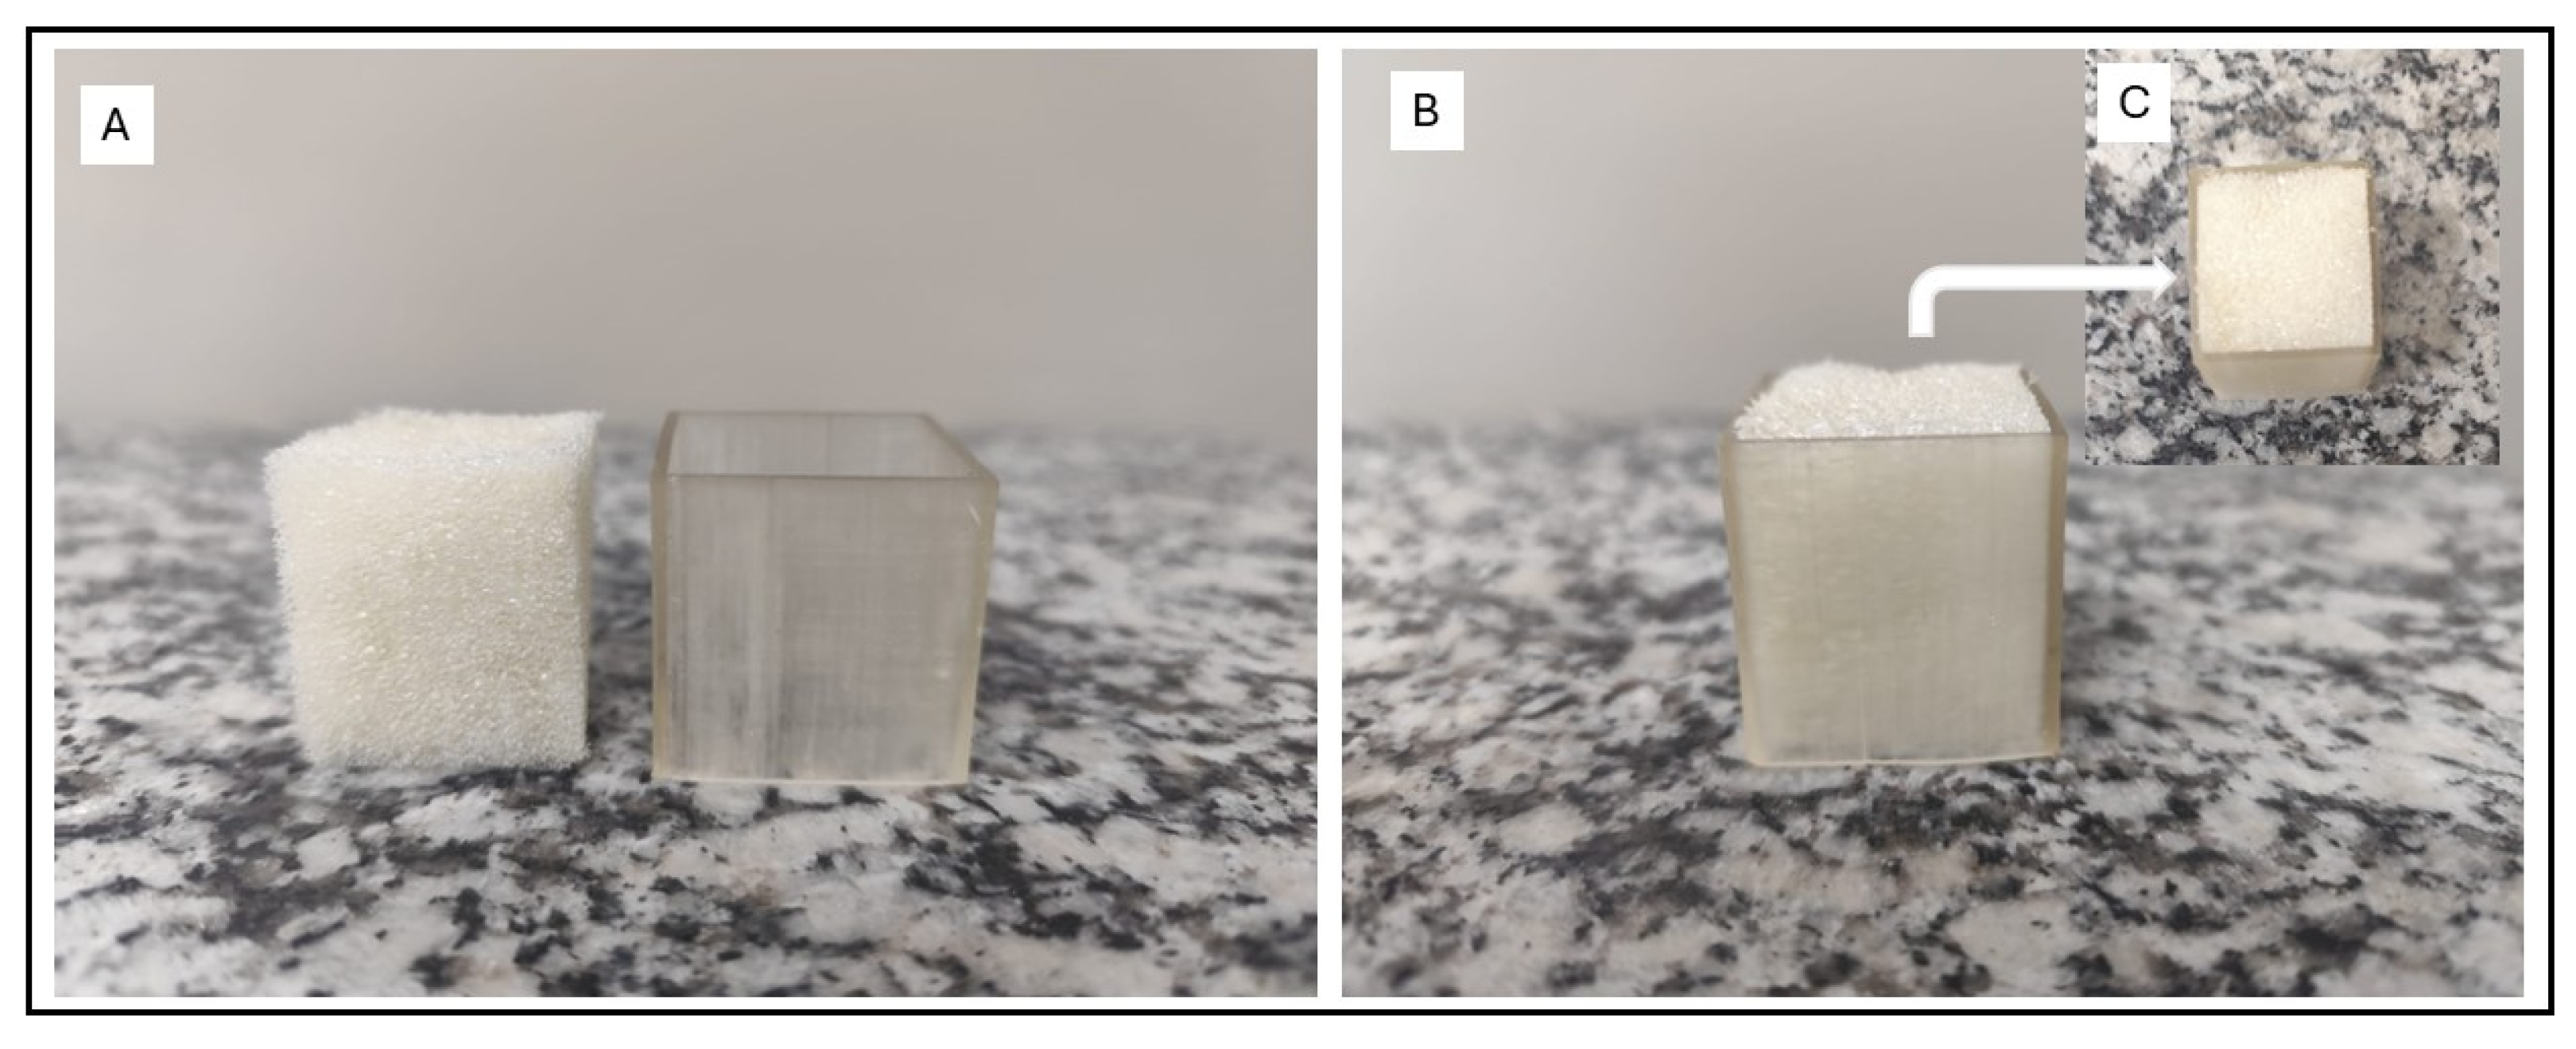
The apparent density of the polyurethane foams was evaluated using cubic specimens with a volume of 27 cm
3. The specimens were collected from different regions of the foam samples to consider possible density variations generated during the foaming process. The apparent density values obtained for the neat PU and PUDEOA foams are presented in
Table 3.
The neat PU foam exhibited an average apparent density of 0.0679 ± 0.0054 g·cm−3, whereas the foam containing 1 wt% DEOA presented a higher apparent density of 0.1008 ± 0.025 g·cm−3. Therefore, the incorporation of DEOA resulted in an increase of approximately 48% in apparent density compared with the unmodified polyurethane foam.
This result is important because the 13.8% reduction in transmitted peak acceleration occurred together with an approximately 48% increase in apparent density. Since density strongly affects the compressive and impact behavior of polyurethane foams, the improvement should not be attributed exclusively to the chemical action of DEOA. Rather, it reflects a combined density, morphology, and network effect, in which higher apparent density contributes to load-bearing capacity, while cellular organization and network structure may favor stress distribution during impact.
The increase in apparent density indicates that DEOA promoted a more compact cellular structure, with a higher polymer fraction per unit volume. Diethanolamine acts as a reactive chain extender and crosslinking agent through its hydroxyl and secondary amine groups, accelerating network formation during foaming and modifying the balance between blowing and gelling reactions. As a consequence, cell stabilization occurs earlier, restricting excessive expansion and leading to foams with higher apparent density and improved structural integrity [
29,
30].
The addition of DEOA appears to modify this expansion behavior by promoting earlier network formation and improving cell stabilization during foam growth, which is consistent with the morphological differences observed in the SEM micrographs.
The higher standard deviation observed for the PU–DEOA formulation suggests a more pronounced density gradient along the foam thickness. This behavior is associated with the different expansion conditions experienced by the material during molding, including local variations in confinement, heat transfer, and cell growth kinetics. Such gradients are commonly observed in molded polyurethane foams due to the heterogeneous expansion process.
The density increase observed after DEOA incorporation is consistent with the morphological modifications identified by SEM analysis, which revealed changes in pore distribution and cellular organization. These results indicate that DEOA modifies not only the chemical structure of the polyurethane network but also the final cellular architecture of the foam.
Thus, the performance gain should be interpreted as a trade-off between increased apparent density and improved impact attenuation. Although the relative reduction in transmitted acceleration is smaller than the relative increase in density, the optimized PU–DEOA formulation remains relevant because it combines lower transmitted acceleration with improved cellular organization under identical testing conditions.
3.4. Morphological Analysis (SEM) of Polyurethane Foams with and Without Diethanolamine
The SEM analysis was used to provide both a qualitative comparison of the cellular morphology of the selected foams and a limited quantitative assessment of selected morphological features obtained from image analysis. Accordingly, the micrographs were first interpreted qualitatively to identify differences in cell organization, pore distribution, and regional heterogeneity, while ImageJ® analysis was subsequently applied only to regions where image contrast and segmentation were sufficiently reliable. Therefore, the quantitative descriptors reported in this section should be interpreted as comparative and region-specific indicators, rather than as exhaustive morphological parameters for the entire foam structure.
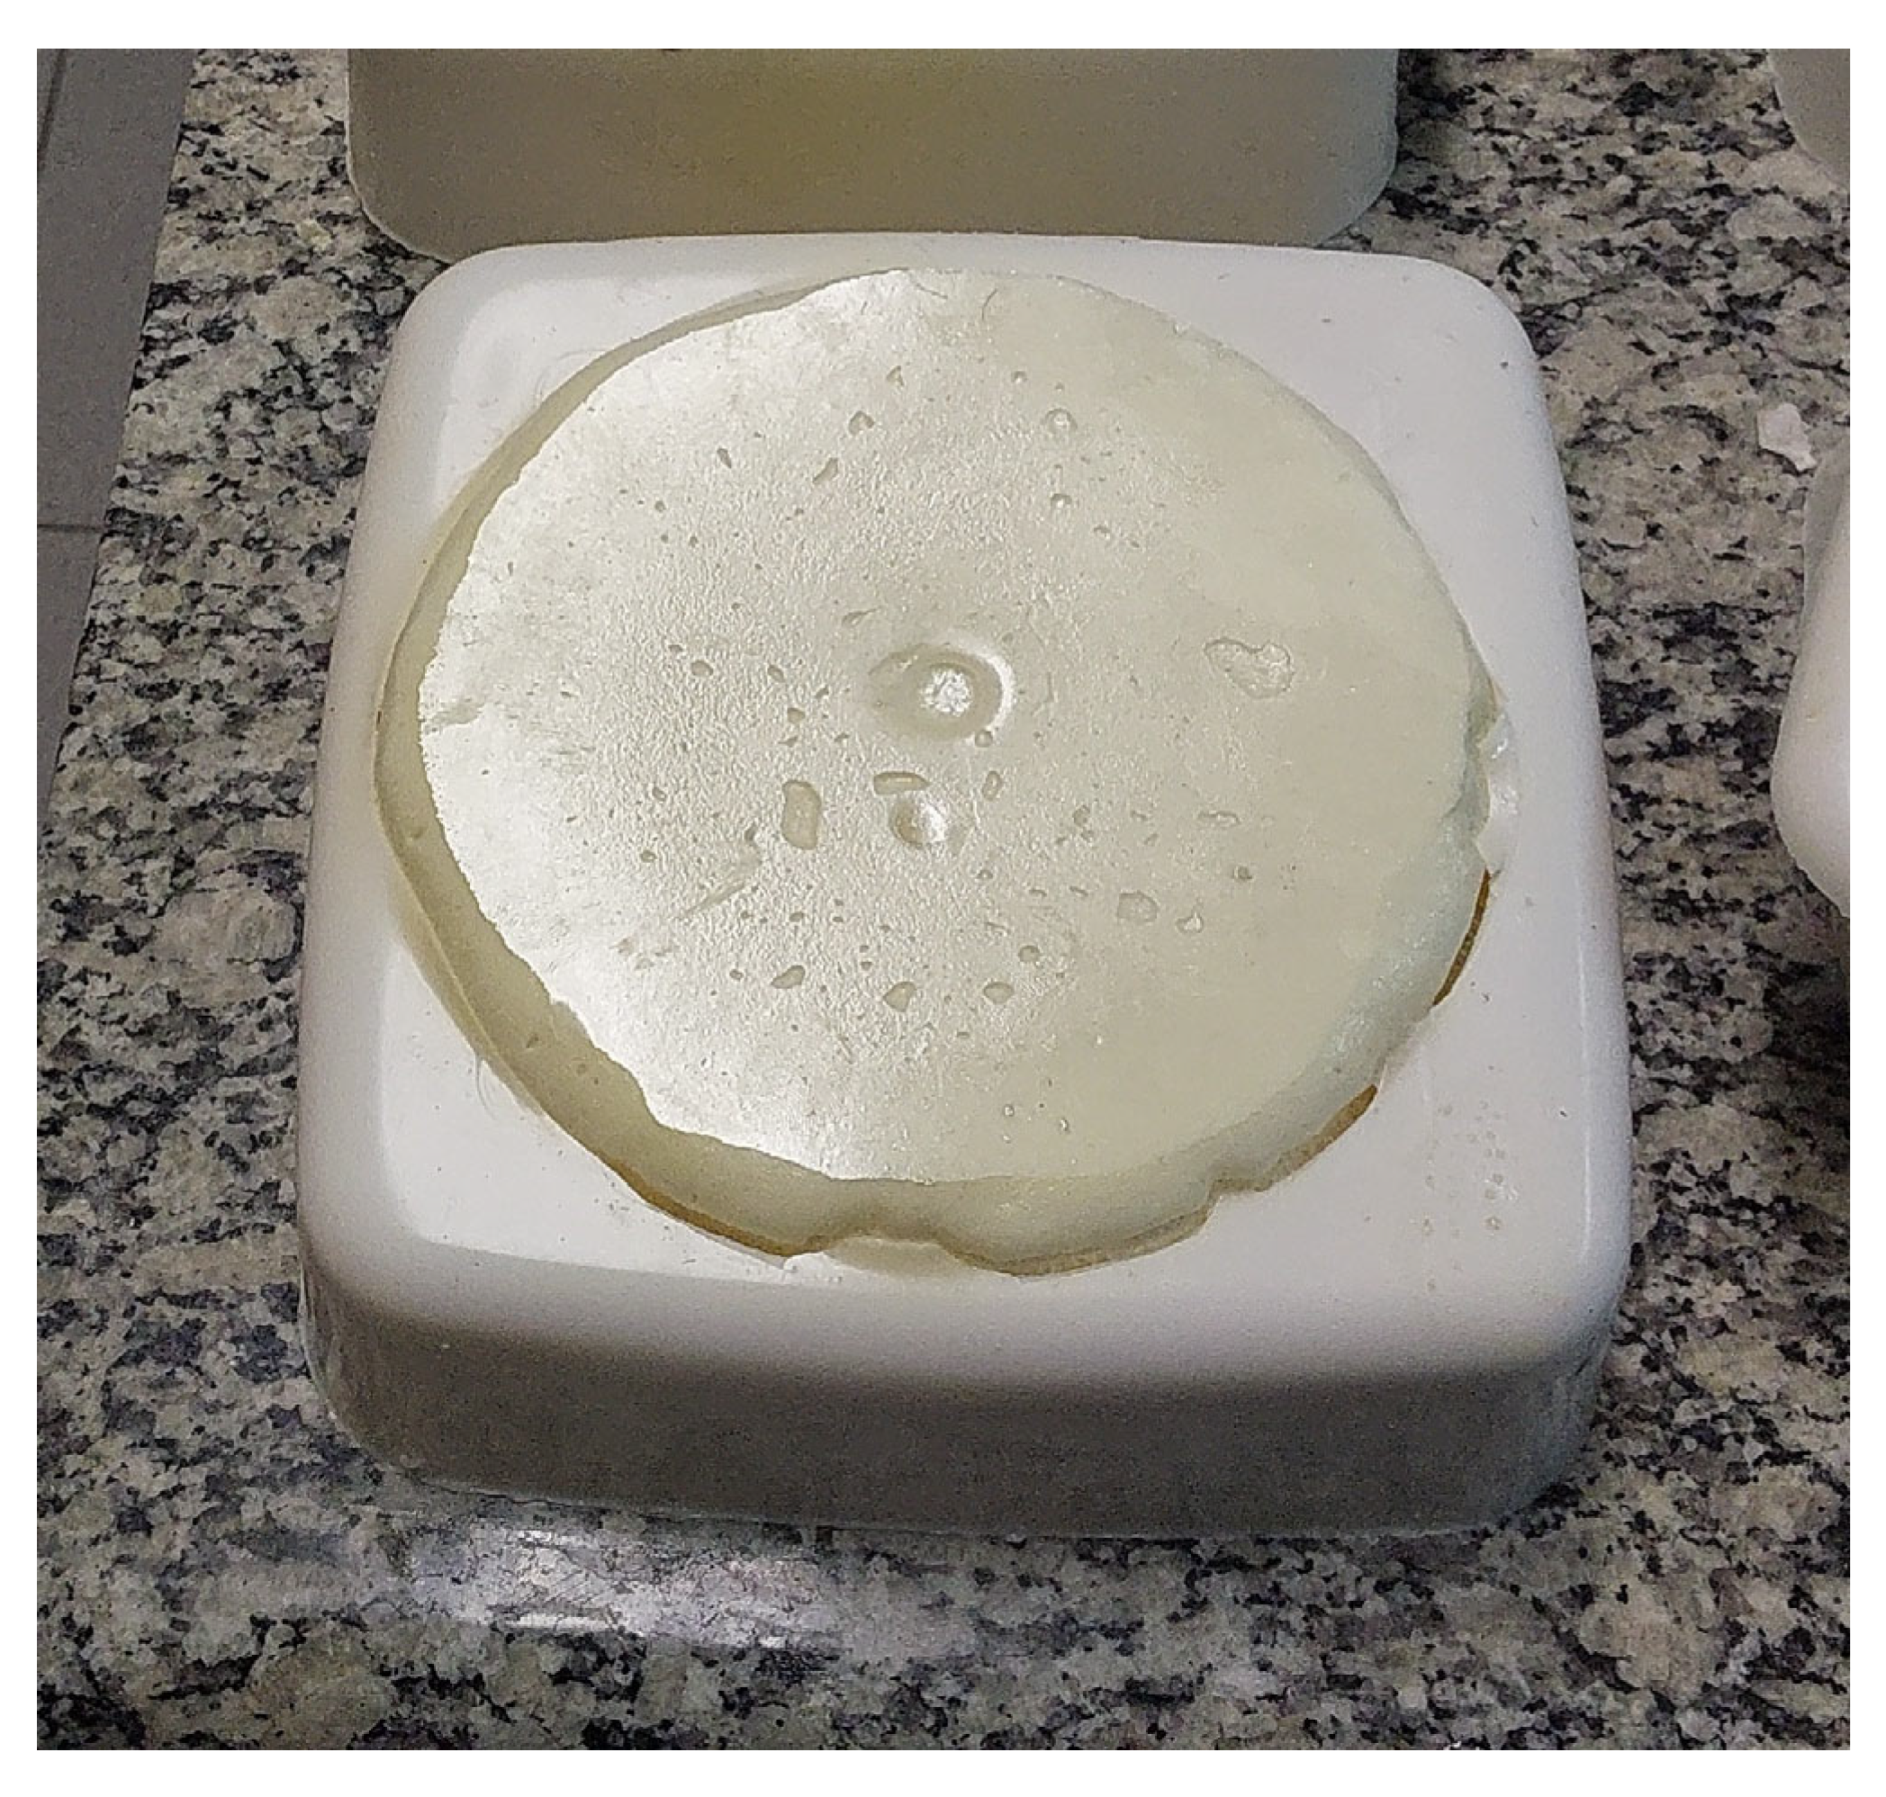
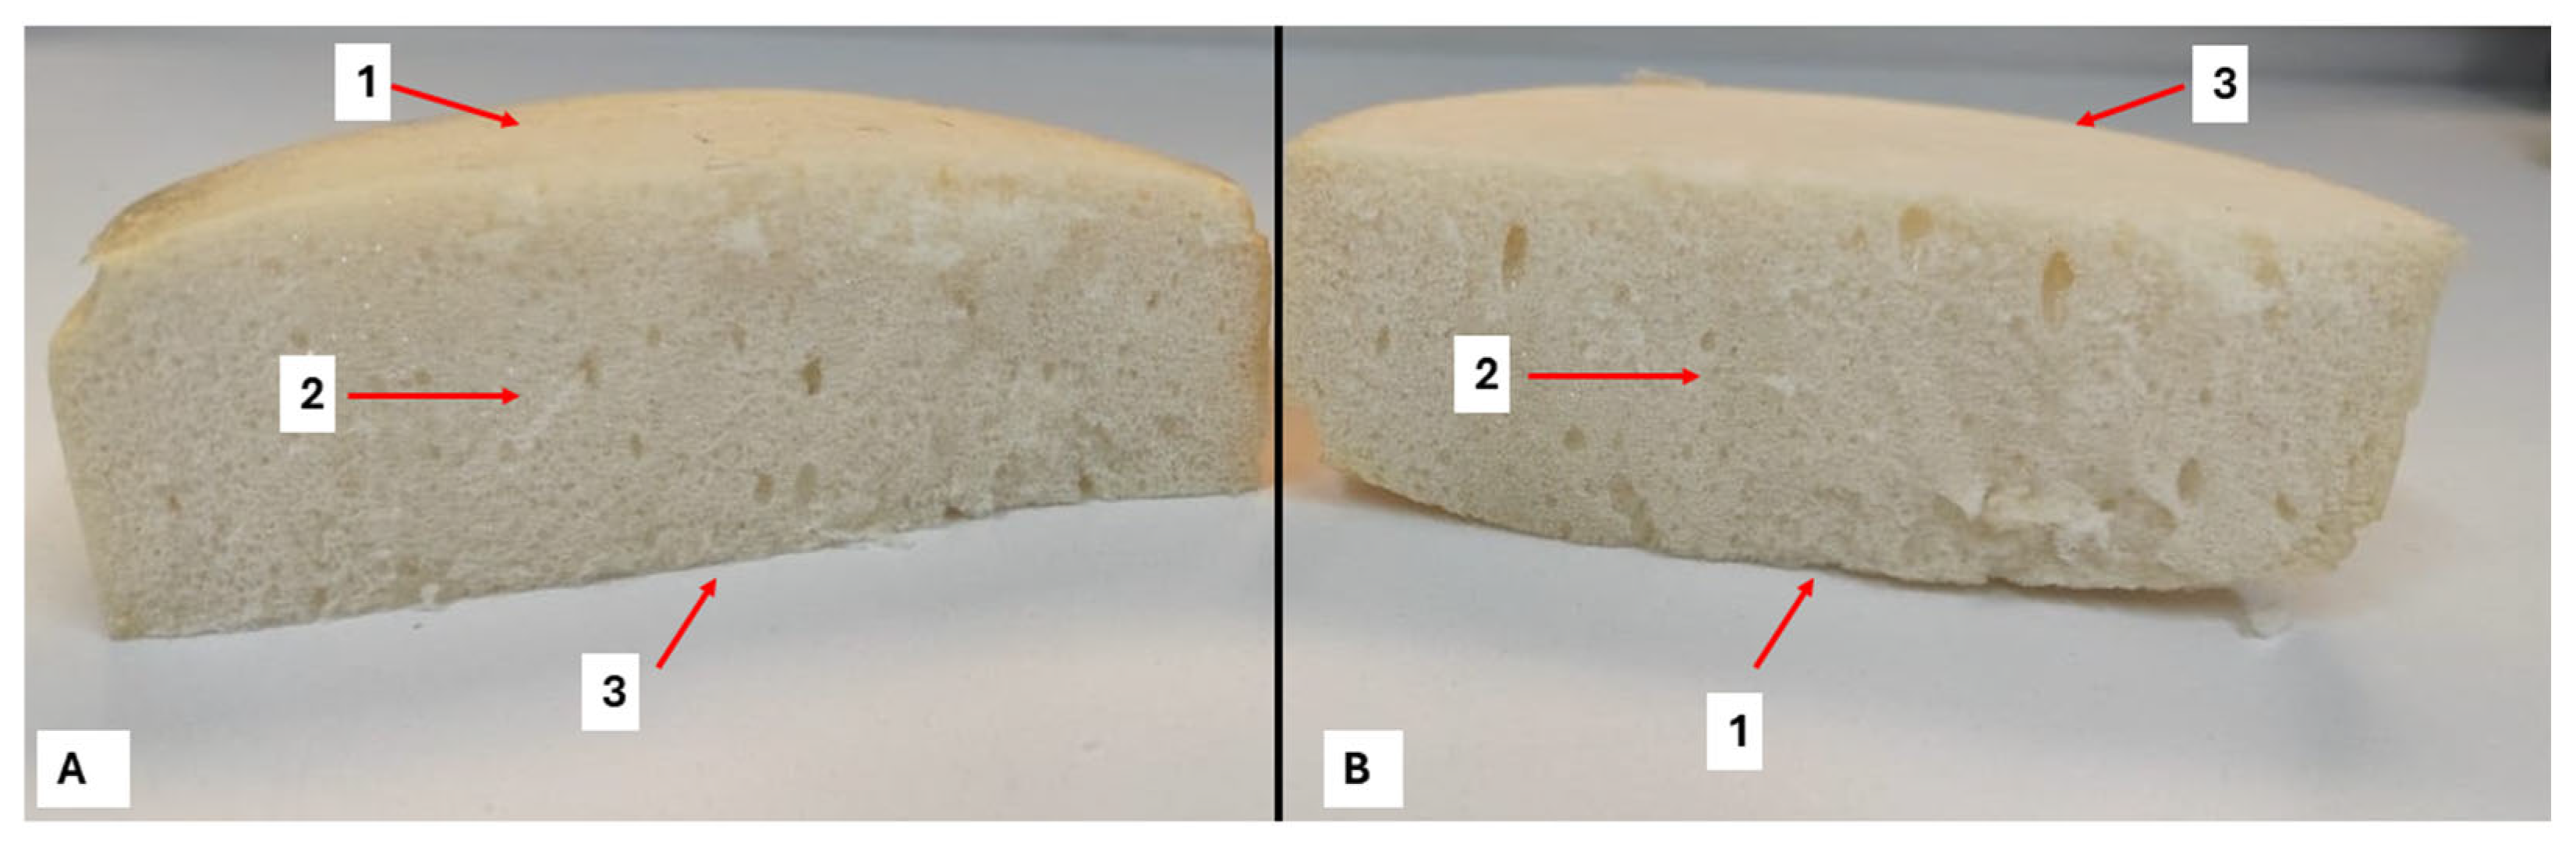
A schematic representation of the regions selected for SEM analysis is shown in
Figure 7. Micrographs were acquired from three distinct locations of the foam specimens, namely the upper surface, the internal core region, and the bottom region, to evaluate possible variations in cellular morphology along the foam structure.
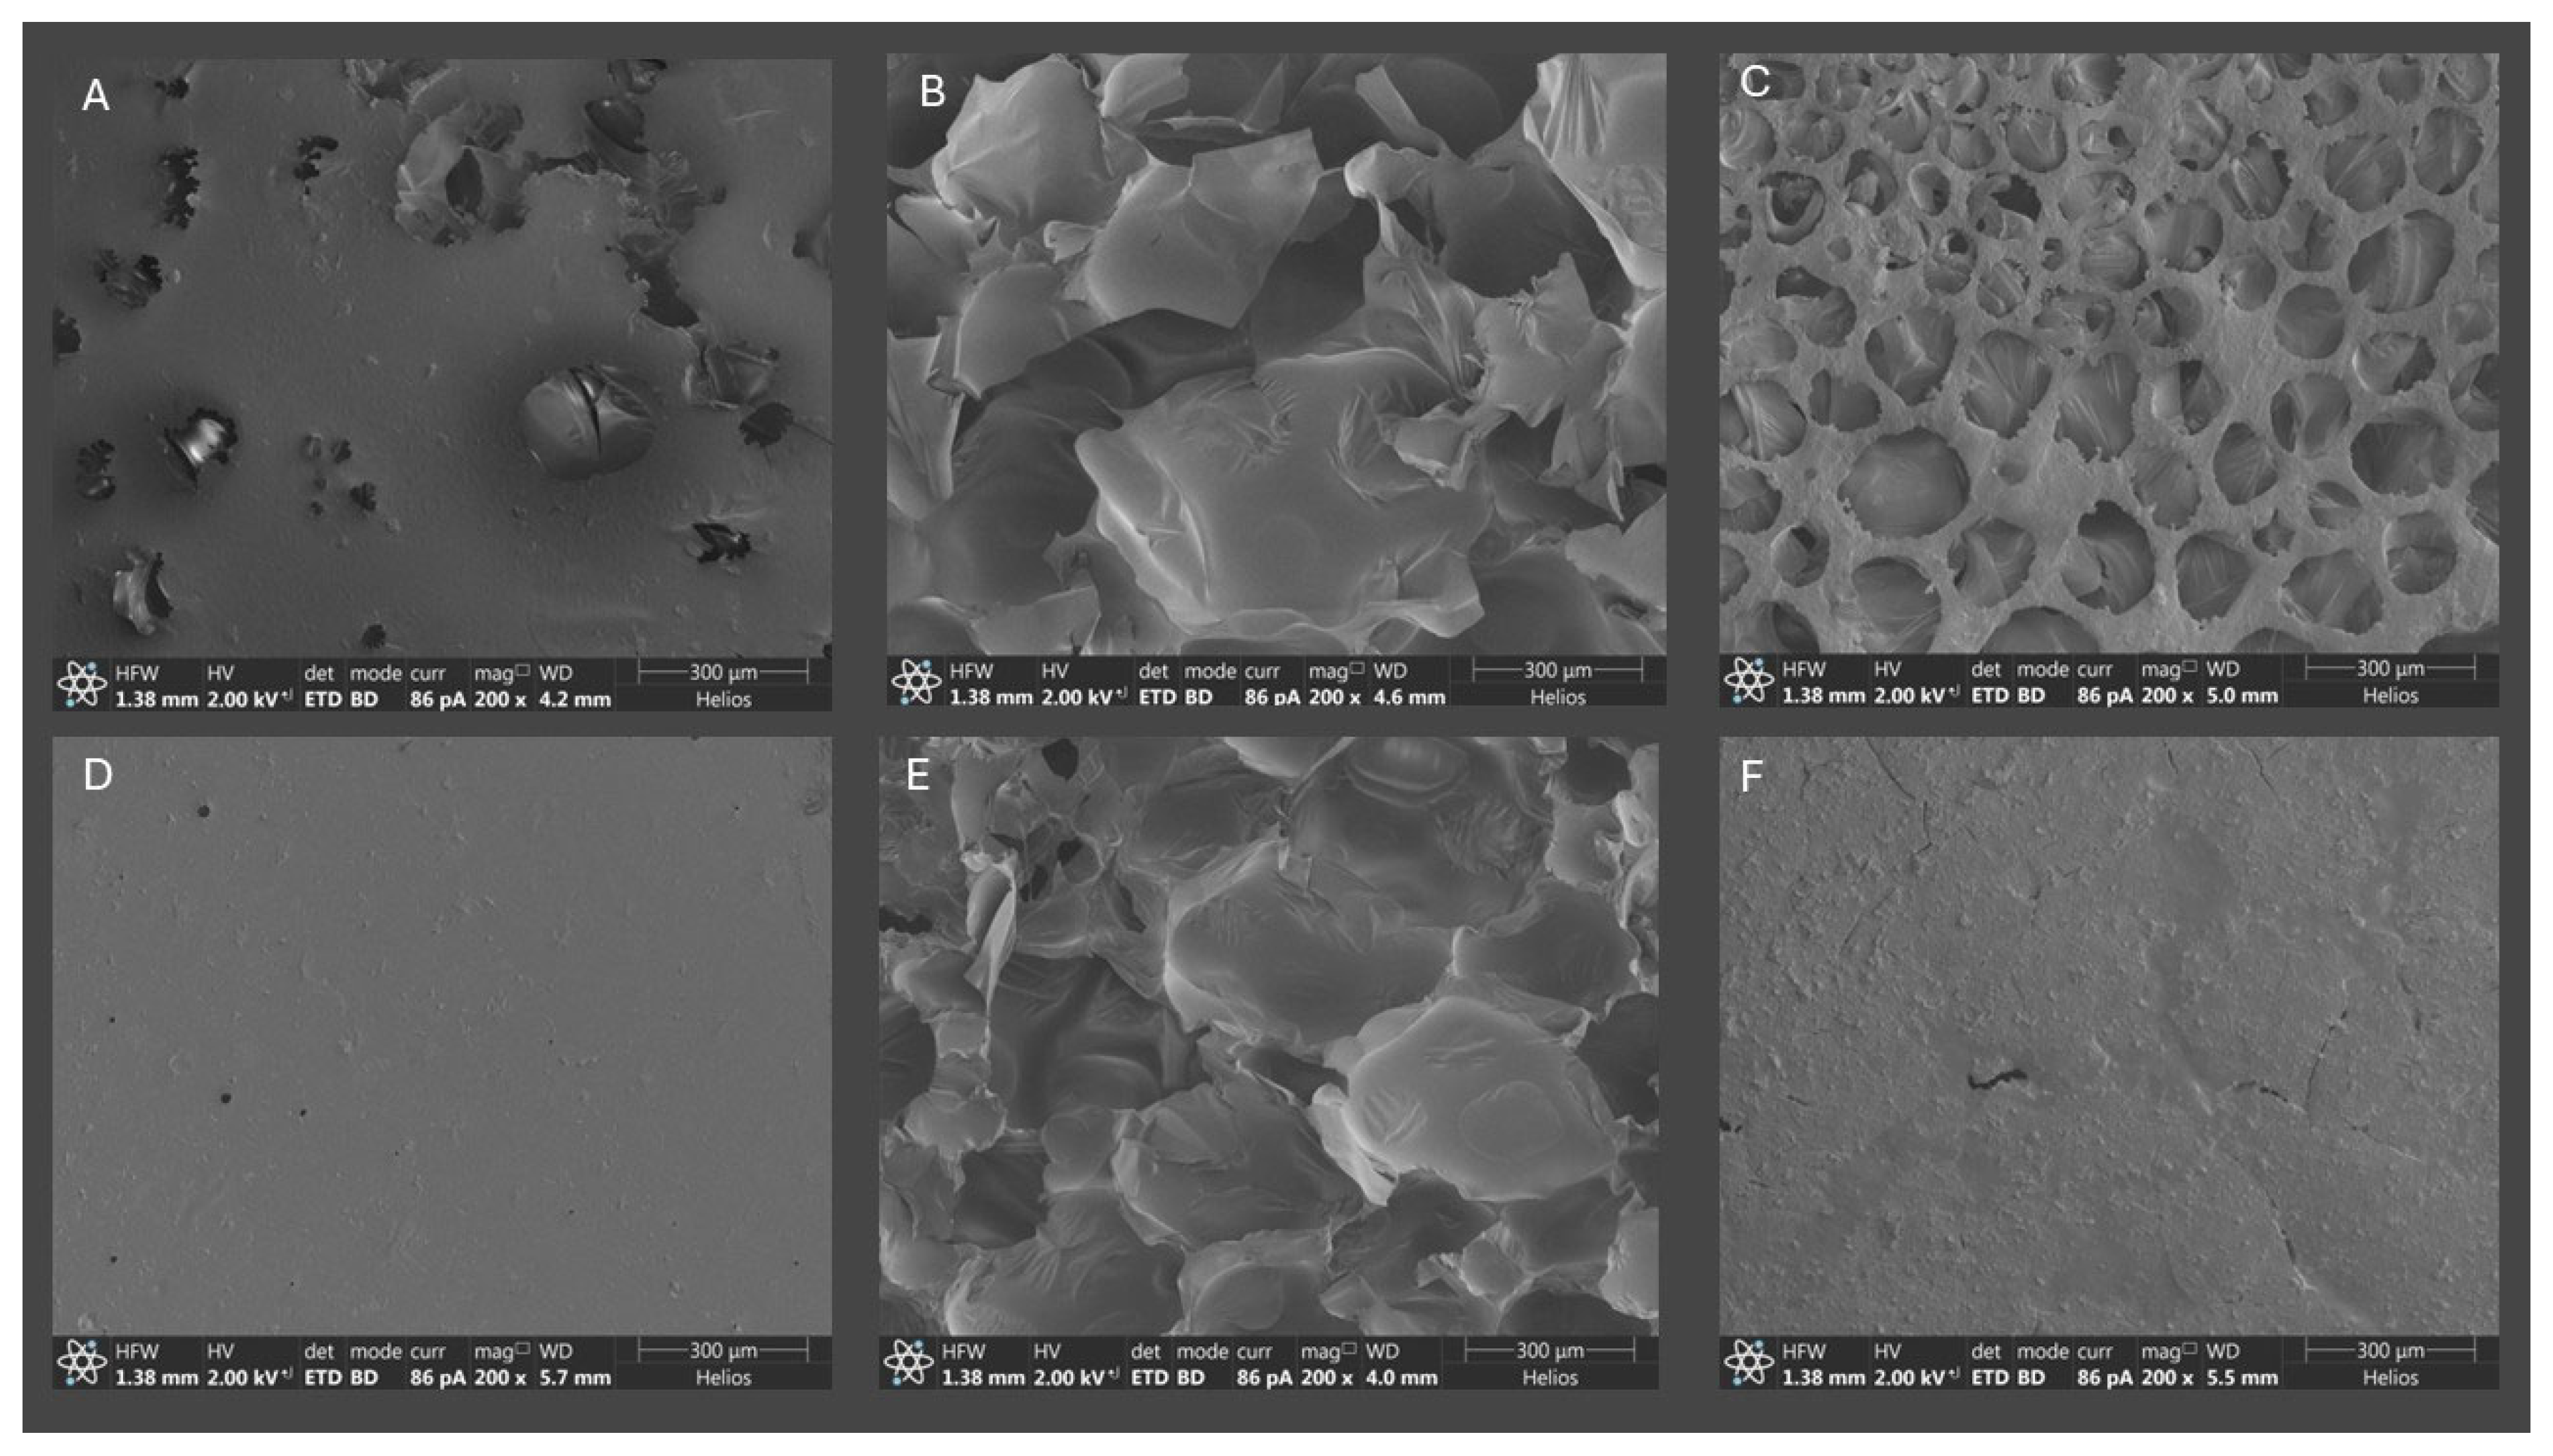
Figure 8 presents the SEM micrographs obtained for the neat polyurethane foam (PU) and the optimized formulation containing 1 wt% diethanolamine (PU–DEOA), selected according to the efficiency criterion obtained from the DEA analysis. The upper images (A–C) correspond to neat PU, whereas the lower images (D–F) represent the PU–DEOA formulation. The micrographs were obtained from the upper surface region (A, D), internal core region (B, E), and bottom region (C, F).
Figure 8 reveals the characteristic heterogeneous cellular morphology of polyurethane foams; however, significant differences are observed after DEOA incorporation. The neat PU foam exhibits greater morphological irregularity, with variations in cell size, non-uniform pore distribution, and regions with thicker cell walls. These characteristics indicate a less controlled cellular growth process during foam formation. In contrast, the PU–DEOA foam presents a more organized cellular structure, with improved pore distribution and reduced occurrence of highly irregular regions, suggesting that DEOA contributes to a more controlled cell formation and stabilization process.
To quantitatively evaluate the morphological modifications, the SEM images were analyzed using ImageJ® software. The micrographs were calibrated using the scale bar, and the pore regions were separated from the polymer matrix by threshold processing. Particle analysis was subsequently performed using the Analyze Particles function to determine the number of pores, pore area fraction, and morphological parameters. For the upper surface region, the neat PU foam presented 685 detected pores, whereas the PU–DEOA foam exhibited 50 pores. The calculated pore area fraction was approximately 0.15% for PU and 2.0% for PU–DEOA, indicating that the incorporation of DEOA altered the cellular arrangement, resulting in fewer detected cavities with different geometric characteristics.
For the bottom mold surface, the morphological differences between formulations were more evident. The neat PU foam presented 546 detected pores and a pore area fraction of approximately 17.5%, while the PU–DEOA foam showed 97 pores and approximately 5.2% pore area fraction. These results demonstrate that DEOA significantly affected the cell development process, promoting a more compact cellular morphology with modified pore distribution.
The internal core region was not quantitatively analyzed due to limitations associated with image segmentation. In this region, the presence of very thin cell walls and insufficient contrast between the polymer matrix and cellular voids prevented reliable separation of pores during threshold processing. Consequently, quantitative analysis could generate inaccurate pore identification; therefore, this region was evaluated only qualitatively.
The differences observed between the upper and lower regions confirm the presence of a cellular gradient along with the foam thickness. This behavior is associated with the different conditions experienced during molding, including confinement effects, heat transfer, and local variations in expansion kinetics. The addition of DEOA modifies this expansion behavior consistent with the increase in apparent density previously discussed.
The morphological changes identified by SEM are also consistent with the improved impact attenuation performance observed for the PU–DEOA formulation. Although the addition of DEOA reduced the pore fraction in some regions, the impact results indicate that energy absorption is not controlled only by the total amount of porosity. Instead, the stability, distribution, and deformation capability of the cellular structure are key factors governing impact response. The improved impact attenuation is likely associated with the combined effects of increased apparent density, modified cellular morphology, and changes in the polyurethane network promoted by DEOA, which may favor progressive deformation and improved stress distribution during impact loading, contributing to the reduction in transmitted peak acceleration.
Overall, the SEM analysis indicates that 1 wt% DEOA modifies the cellular architecture of polyurethane foam, promoting a better balance between structural organization and mechanical response. These morphological changes support the improved impact performance obtained for the optimized PU–DEOA formulation.
3.5. Thermogravimetric Analysis
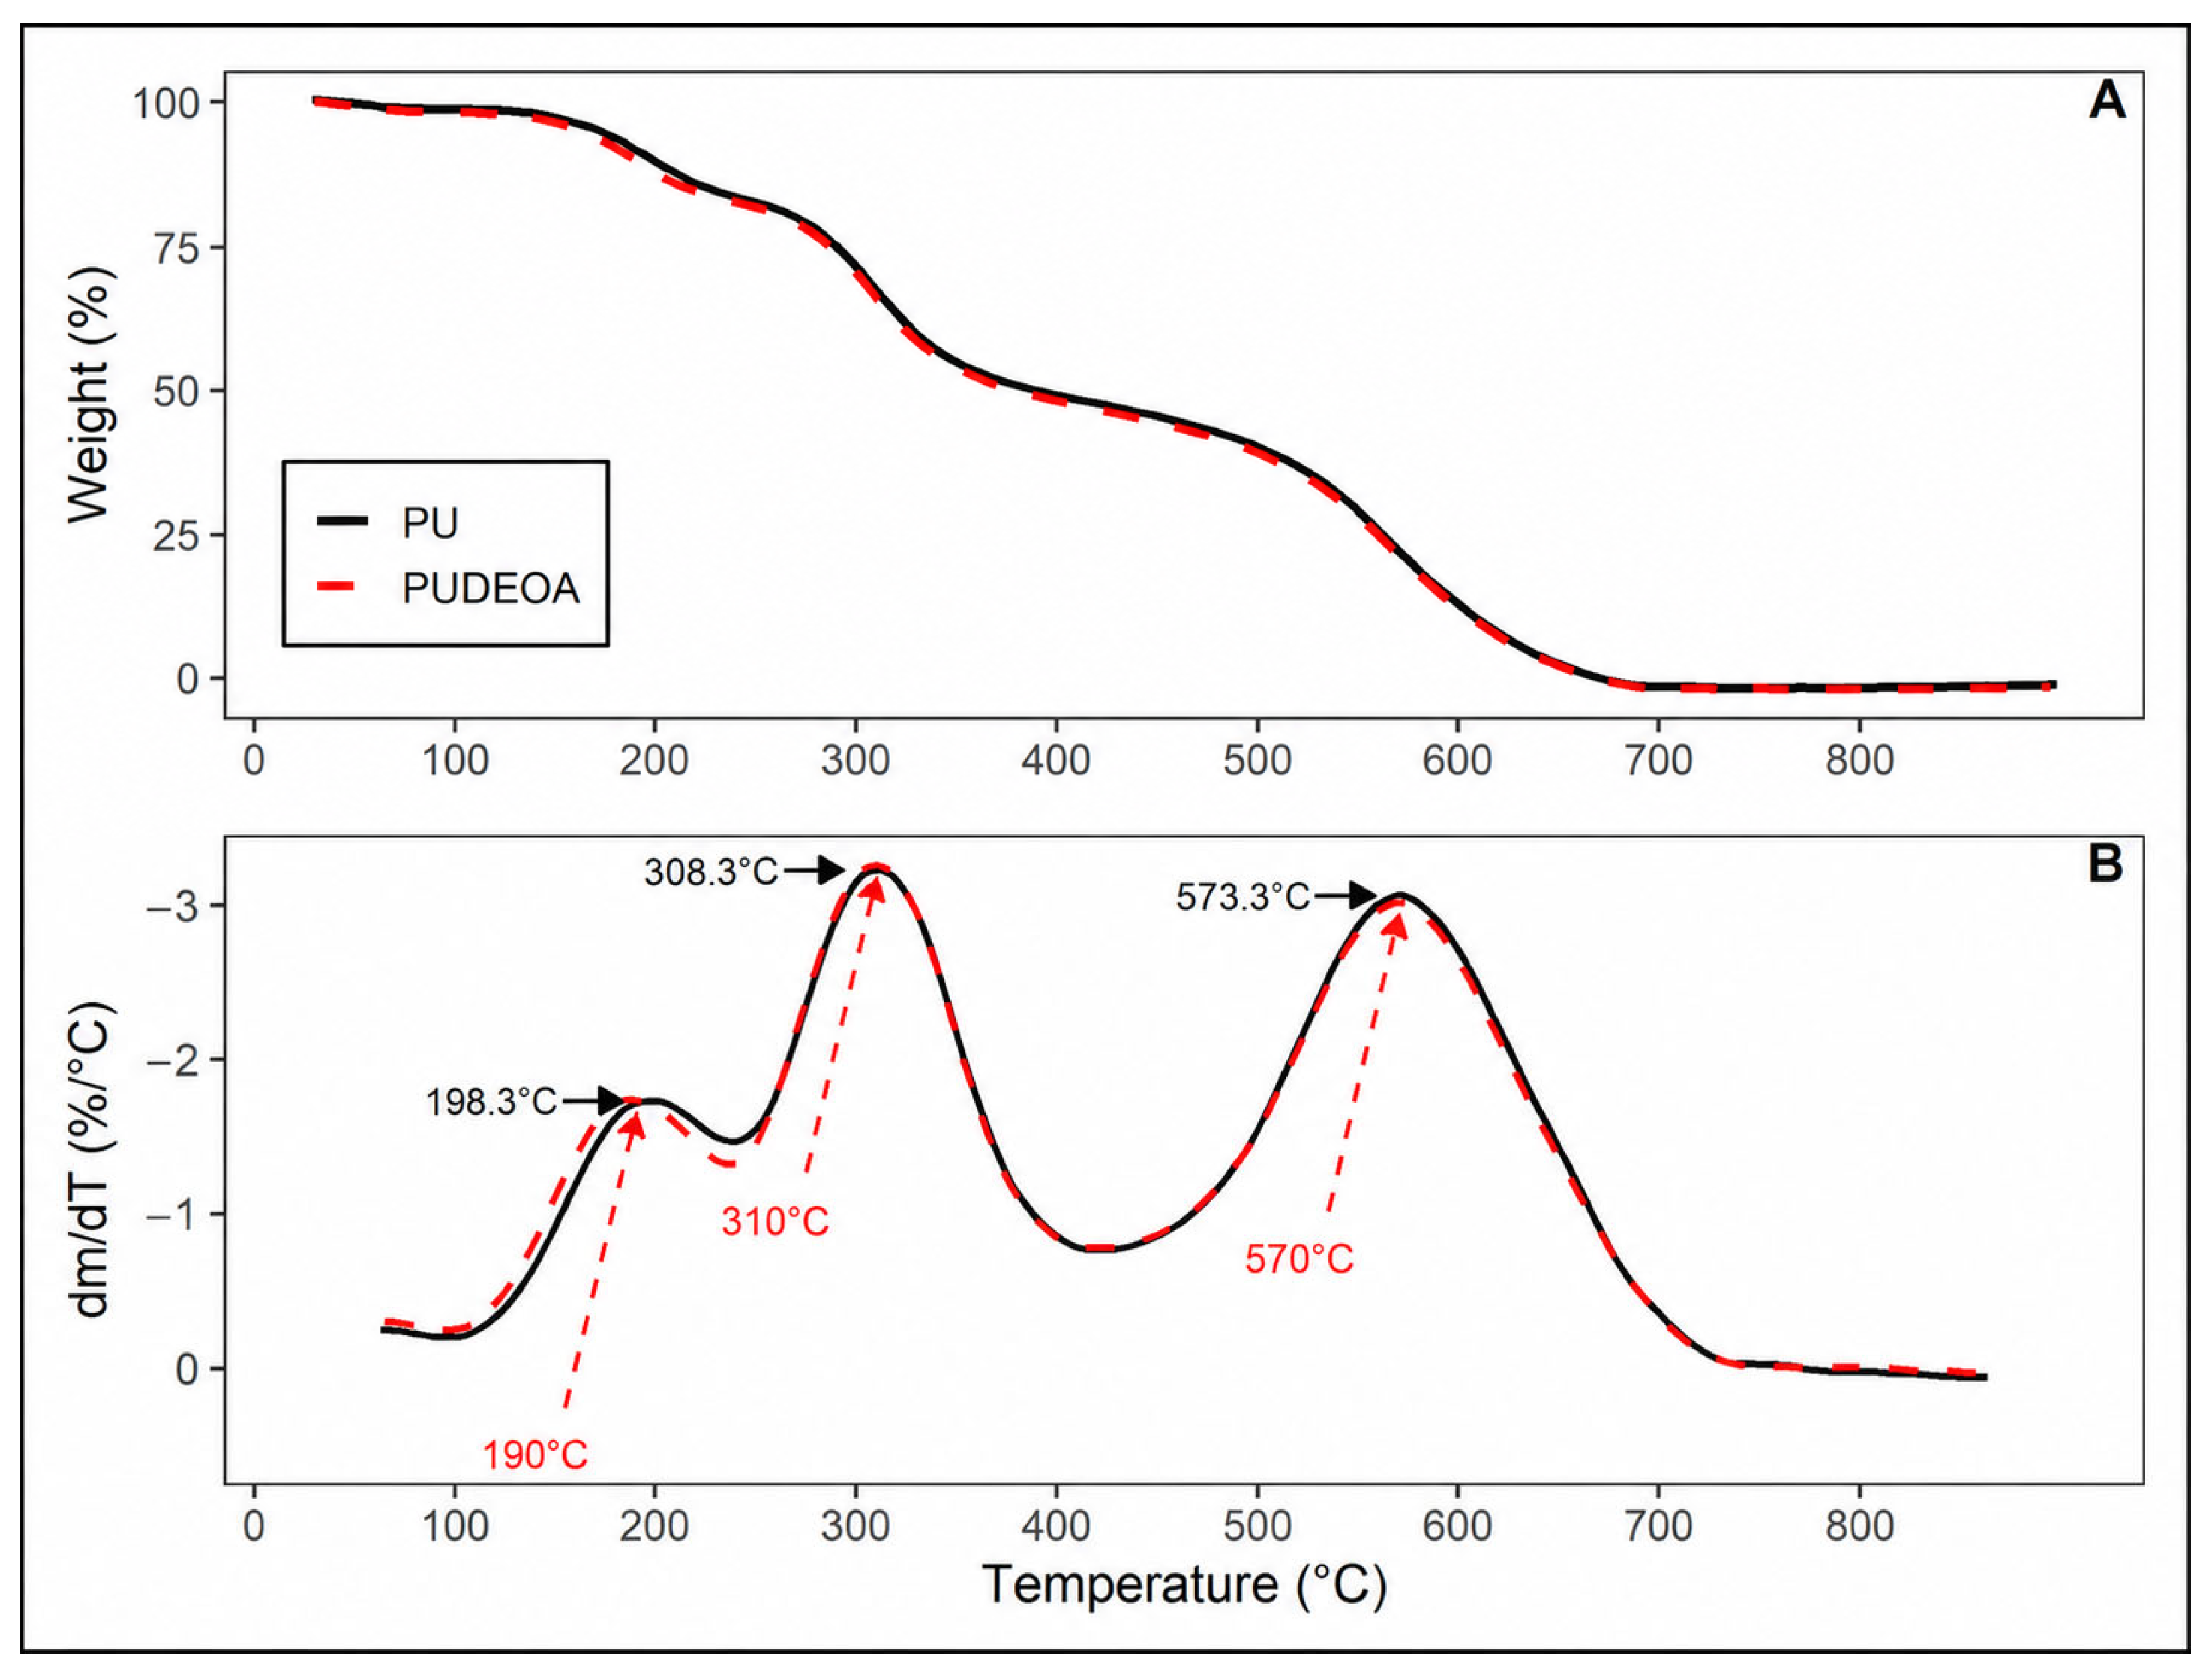
The thermogravimetric (TGA) and derivative thermogravimetric (DTG) curves of PU and PU–DEOA are presented in
Figure 9. Both materials exhibit the typical multi-stage thermal degradation behavior of polyurethane foams.
An initial mass loss below 200 °C is observed for both samples and is attributed to the evaporation of residual moisture and low-molecular-weight species. The DTG curves show a first degradation peak at approximately 198 °C for PU (≈190 °C for PU–DEOA), which is associated with the dissociation of less stable urethane structures.
The main degradation stage occurs between 250 and 400 °C, with a prominent DTG peak at around 308 °C (≈310 °C for PU–DEOA), corresponding to the breakdown of urethane linkages and hard segments. This behavior is strongly supported by the FTIR spectra, which exhibit characteristic absorption bands of urethane groups, including N–H stretching vibrations around 3300 cm−1 and C=O stretching near 1700 cm−1. The cleavage of these bonds contributes significantly to the mass loss observed in this temperature range.
Additionally, the FTIR spectra show bands in the region of 1000–1200 cm−1, attributed to C–O–C stretching vibrations of the polyol segments. The degradation of these structures contributes to the subsequent mass loss at higher temperatures.
A second major degradation peak is observed at approximately 573 °C (≈570 °C for PU–DEOA), which is related to the decomposition of the remaining polymer backbone and carbonaceous structures. The presence of bands in the 1500–1600 cm−1 region suggests more thermally stable structures, which may contribute to delayed degradation at higher temperatures.
Comparatively, neat PU exhibits slightly higher onset temperatures (Tonset), indicating marginally greater initial thermal stability. The incorporation of DEOA does not significantly alter the overall thermal stability; however, slight shifts in DTG peak temperatures suggest modifications in the degradation kinetics. These changes are consistent with the FTIR results, where variations in band intensity – particularly in the N–H and C=O regions – suggest differences in hydrogen bonding interactions and crosslink density. The presence of DEOA likely modifies the polymer network, influencing chain mobility and thermal decomposition behavior.
At higher temperatures, both samples exhibit similar degradation profiles, with negligible residual mass, indicating nearly complete decomposition of the organic material.
Table 4 summarizes the onset degradation temperatures (Tonset) and peak degradation temperatures (Tp) of the polyurethane foams. It is important to note that negative residual mass values were adjusted to zero, as they arise from baseline fluctuations inherent to TGA measurements.
Overall, the results indicate that the incorporation of 1 wt% DEOA slightly modifies the thermal degradation behavior without producing a practically significant improvement in thermal stability. These changes are therefore interpreted as complementary evidence of structural modification rather than as direct evidence of enhanced thermal resistance.




 ,
,