3.1. Characterization of Suberinic Acid Fractions
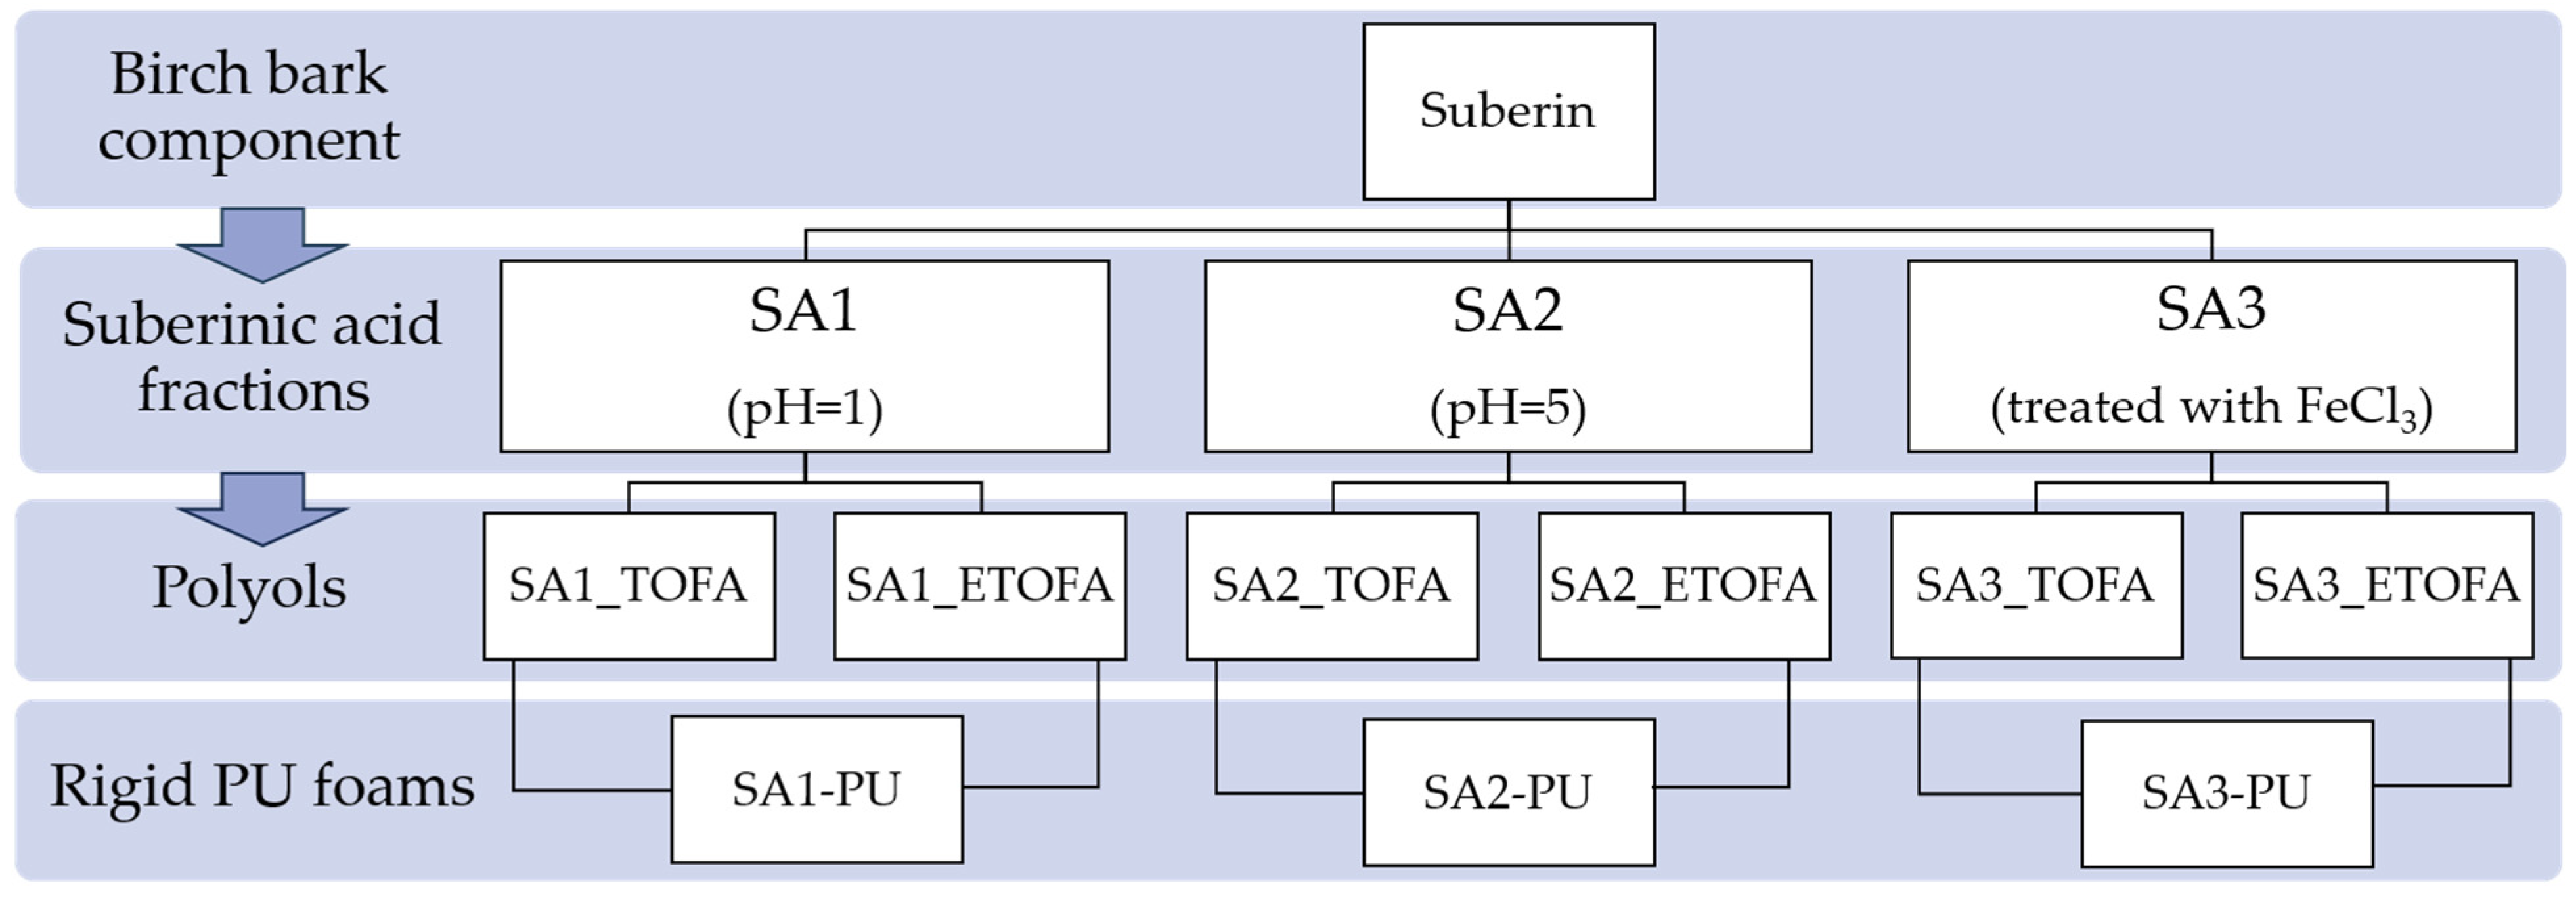
Three SA fractions were obtained under different conditions: SA1 (precipitated at pH1), SA2 (precipitated at pH5), and SA3 (treated with FeCl
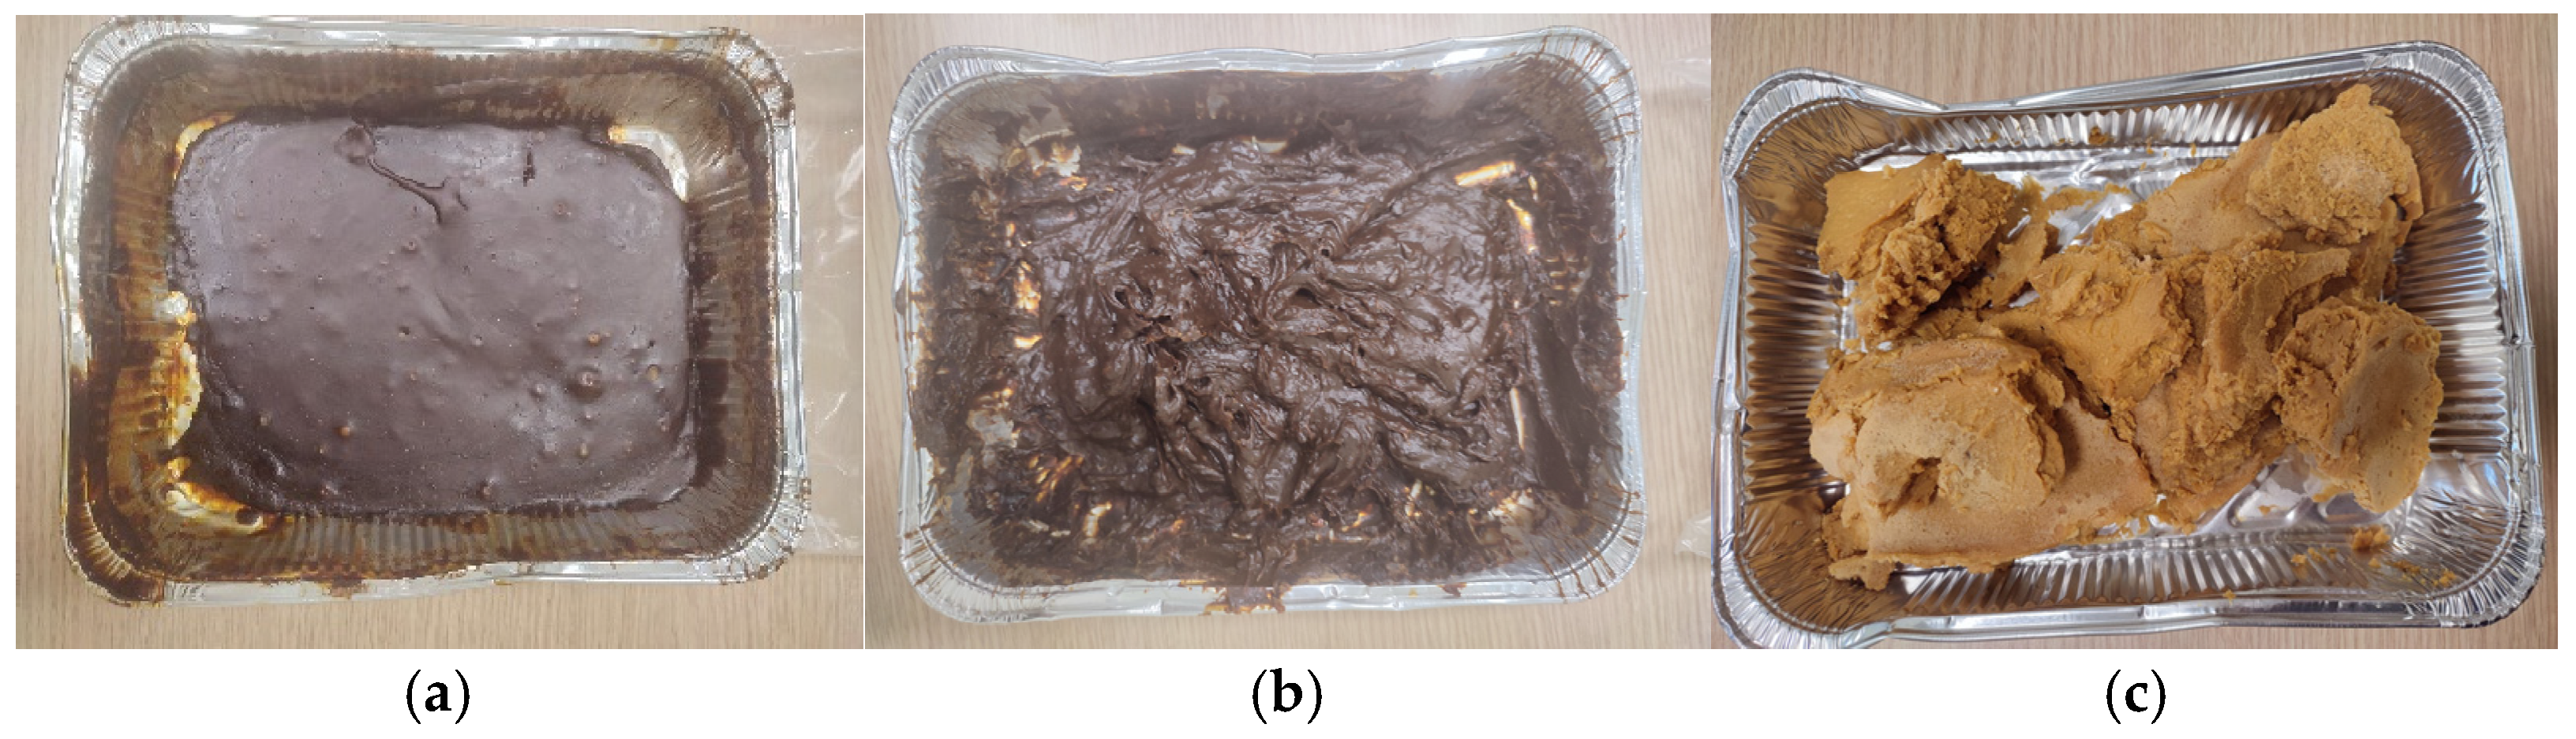
3 and precipitated at pH1). The visual appearance of the fractions is shown in
Figure 2. Distinct differences were observed between the samples. SA1 and SA2 appeared as dark brown, dense materials, whereas SA3 exhibited a lighter, yellow-brown colour and a looser, more friable structure.
To characterize the SA samples, the dry mass content, yield, H
v, and total polyphenolic compound content were determined using Py-GC/MS analysis, and the results are summarized in
Table 2.
It was hypothesized that SA fractions with higher polyphenolic content could improve the flammability resistance and/or thermal properties of PU derived from SA-based polyols. Among the samples, SA1 exhibited the highest total polyphenolic content (3.84%), whereas SA3 showed the lowest (1.12%). In the case of SA3, treatment with FeCl
3 resulted in the removal of both polyphenolic compounds and oligomeric fractions of SA. This effect is evident from the GC-MS and GPC analyses (
Table 3 and
Table 4), which reveal an increase in low-molecular-weight fractions as well as individual SA monomers. Consequently, the overall yield of SA3 was nearly two-fold lower than that of SA1. The higher acid number observed for SA3 after FeCl
3 treatment may result from the removal of higher-molecular-weight oligomeric fractions, leading to an increased proportion of lower-molecular-weight species with a higher concentration of free carboxylic groups per unit mass. However, possible chemical modifications (e.g., hydrolysis or oxidation) could also be considered.
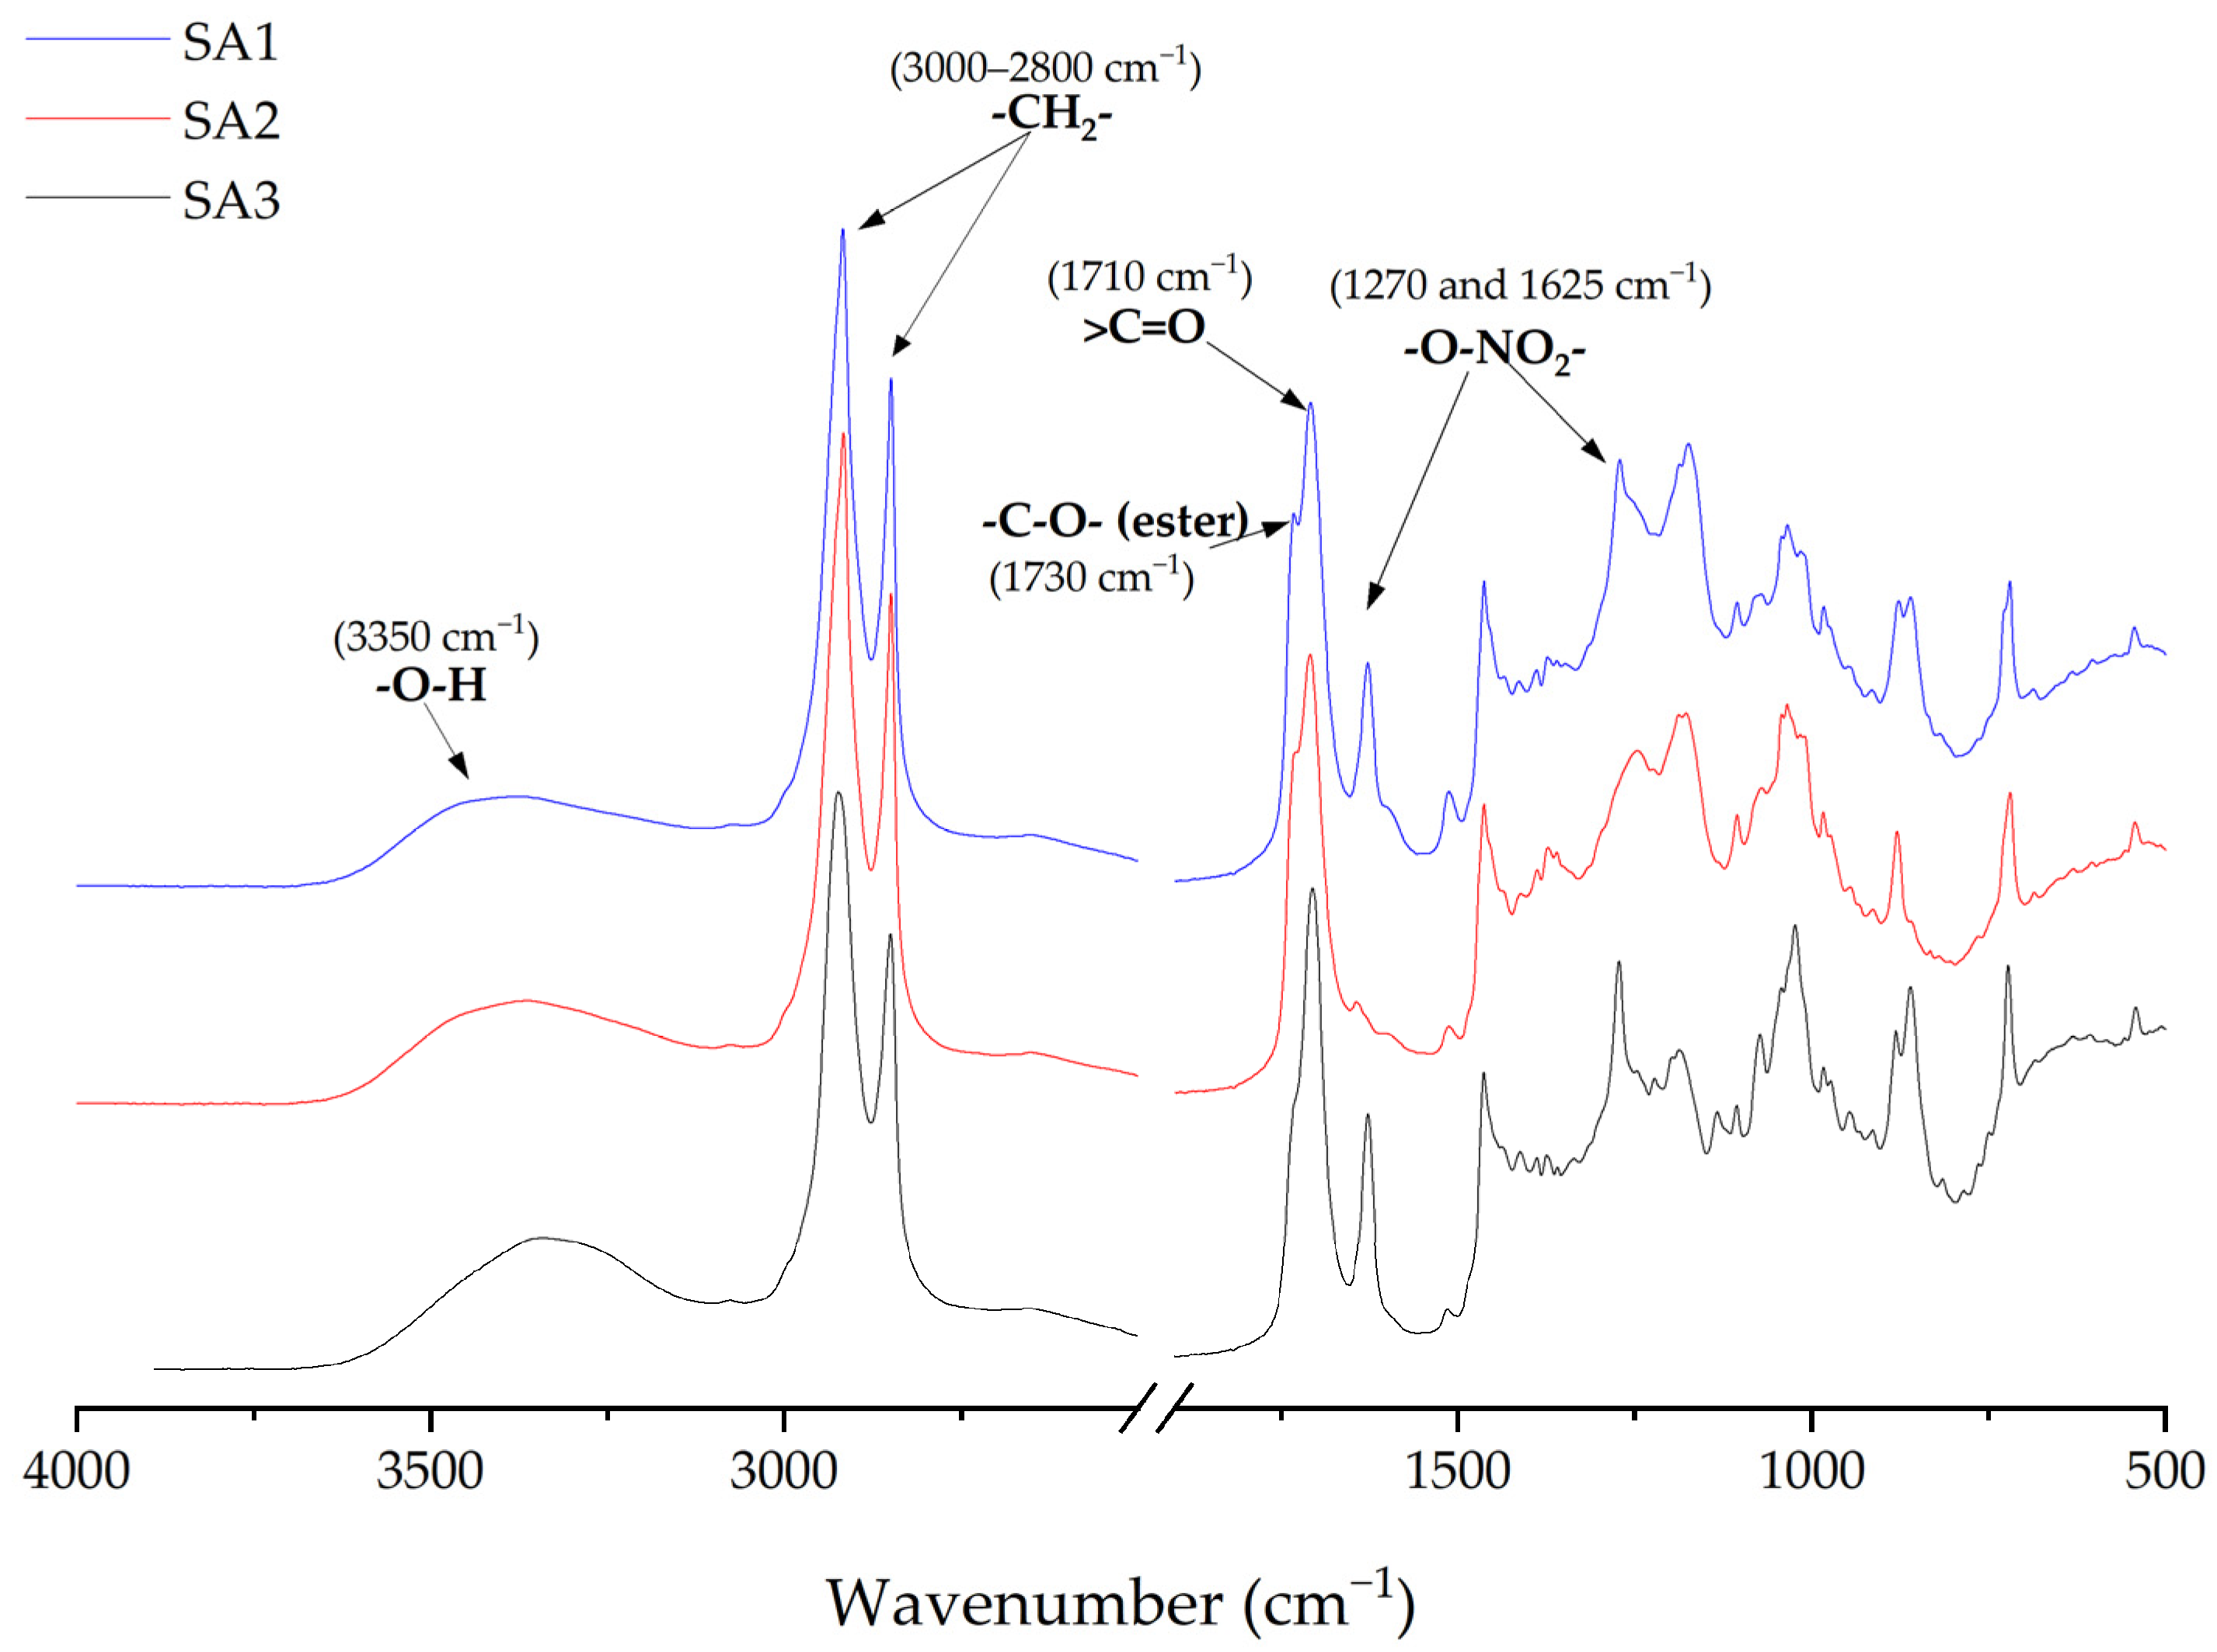
To determine the key structural groups that indicate the suitability of SA fractions as polyol precursors for rigid PU foams, FTIR analysis was performed. The spectra obtained are presented in
Figure 3.
Across all samples, a broad band near 3350 cm
−1 corresponds to O–H stretching vibrations, indicating the presence of hydroxyl and carboxylic groups, while sharp peaks at 3000 cm
−1 and 2800 cm
−1 arise from aliphatic C–H stretching. Strong absorption at ~1730 cm
−1 is attributed to ester carbonyls, whereas at 1710 cm
−1 it reflects carboxylic acid carbonyls, both of which are essential for chemical reactivity during polyol synthesis. Aromatic C=C stretching bands (1600–1510 cm
−1) confirm the presence of phenolic moieties [
37,
38], with a more pronounced peak in SA1, consistent with its higher phenolic content determined with Py-GC/MS/FID analysis. SA1 and SA3 also show residues of HNO
3, evidenced by symmetric and asymmetric –O–NO
2 stretching at 1270 cm
−1 and 1625 cm
−1, characteristic of SA fractions obtained at low pH [
39]. The FTIR spectrum of SA3 is distinguished by stronger absorption in the carboxylic-type carbonyl region (~1710 cm
−1) and a broader O–H band near 3350 cm
−1 compared with SA1 and SA2. This pattern indicates a relative enrichment in free –COOH groups rather than absolute dominance, as SA1 and SA2 exhibit more pronounced ester shoulders around 1730 cm
−1. These spectral differences align with the compositional data (GC/MS and GPC), which show that SA3 is enriched in acid-bearing fragments, whereas SA1 and SA2 contain more esterified oligomeric material. Consequently, SA3 represents the most reactive precursor for polyol synthesis, as its abundant carboxylic functionalities can be effectively converted into hydroxyl-bearing polyols.
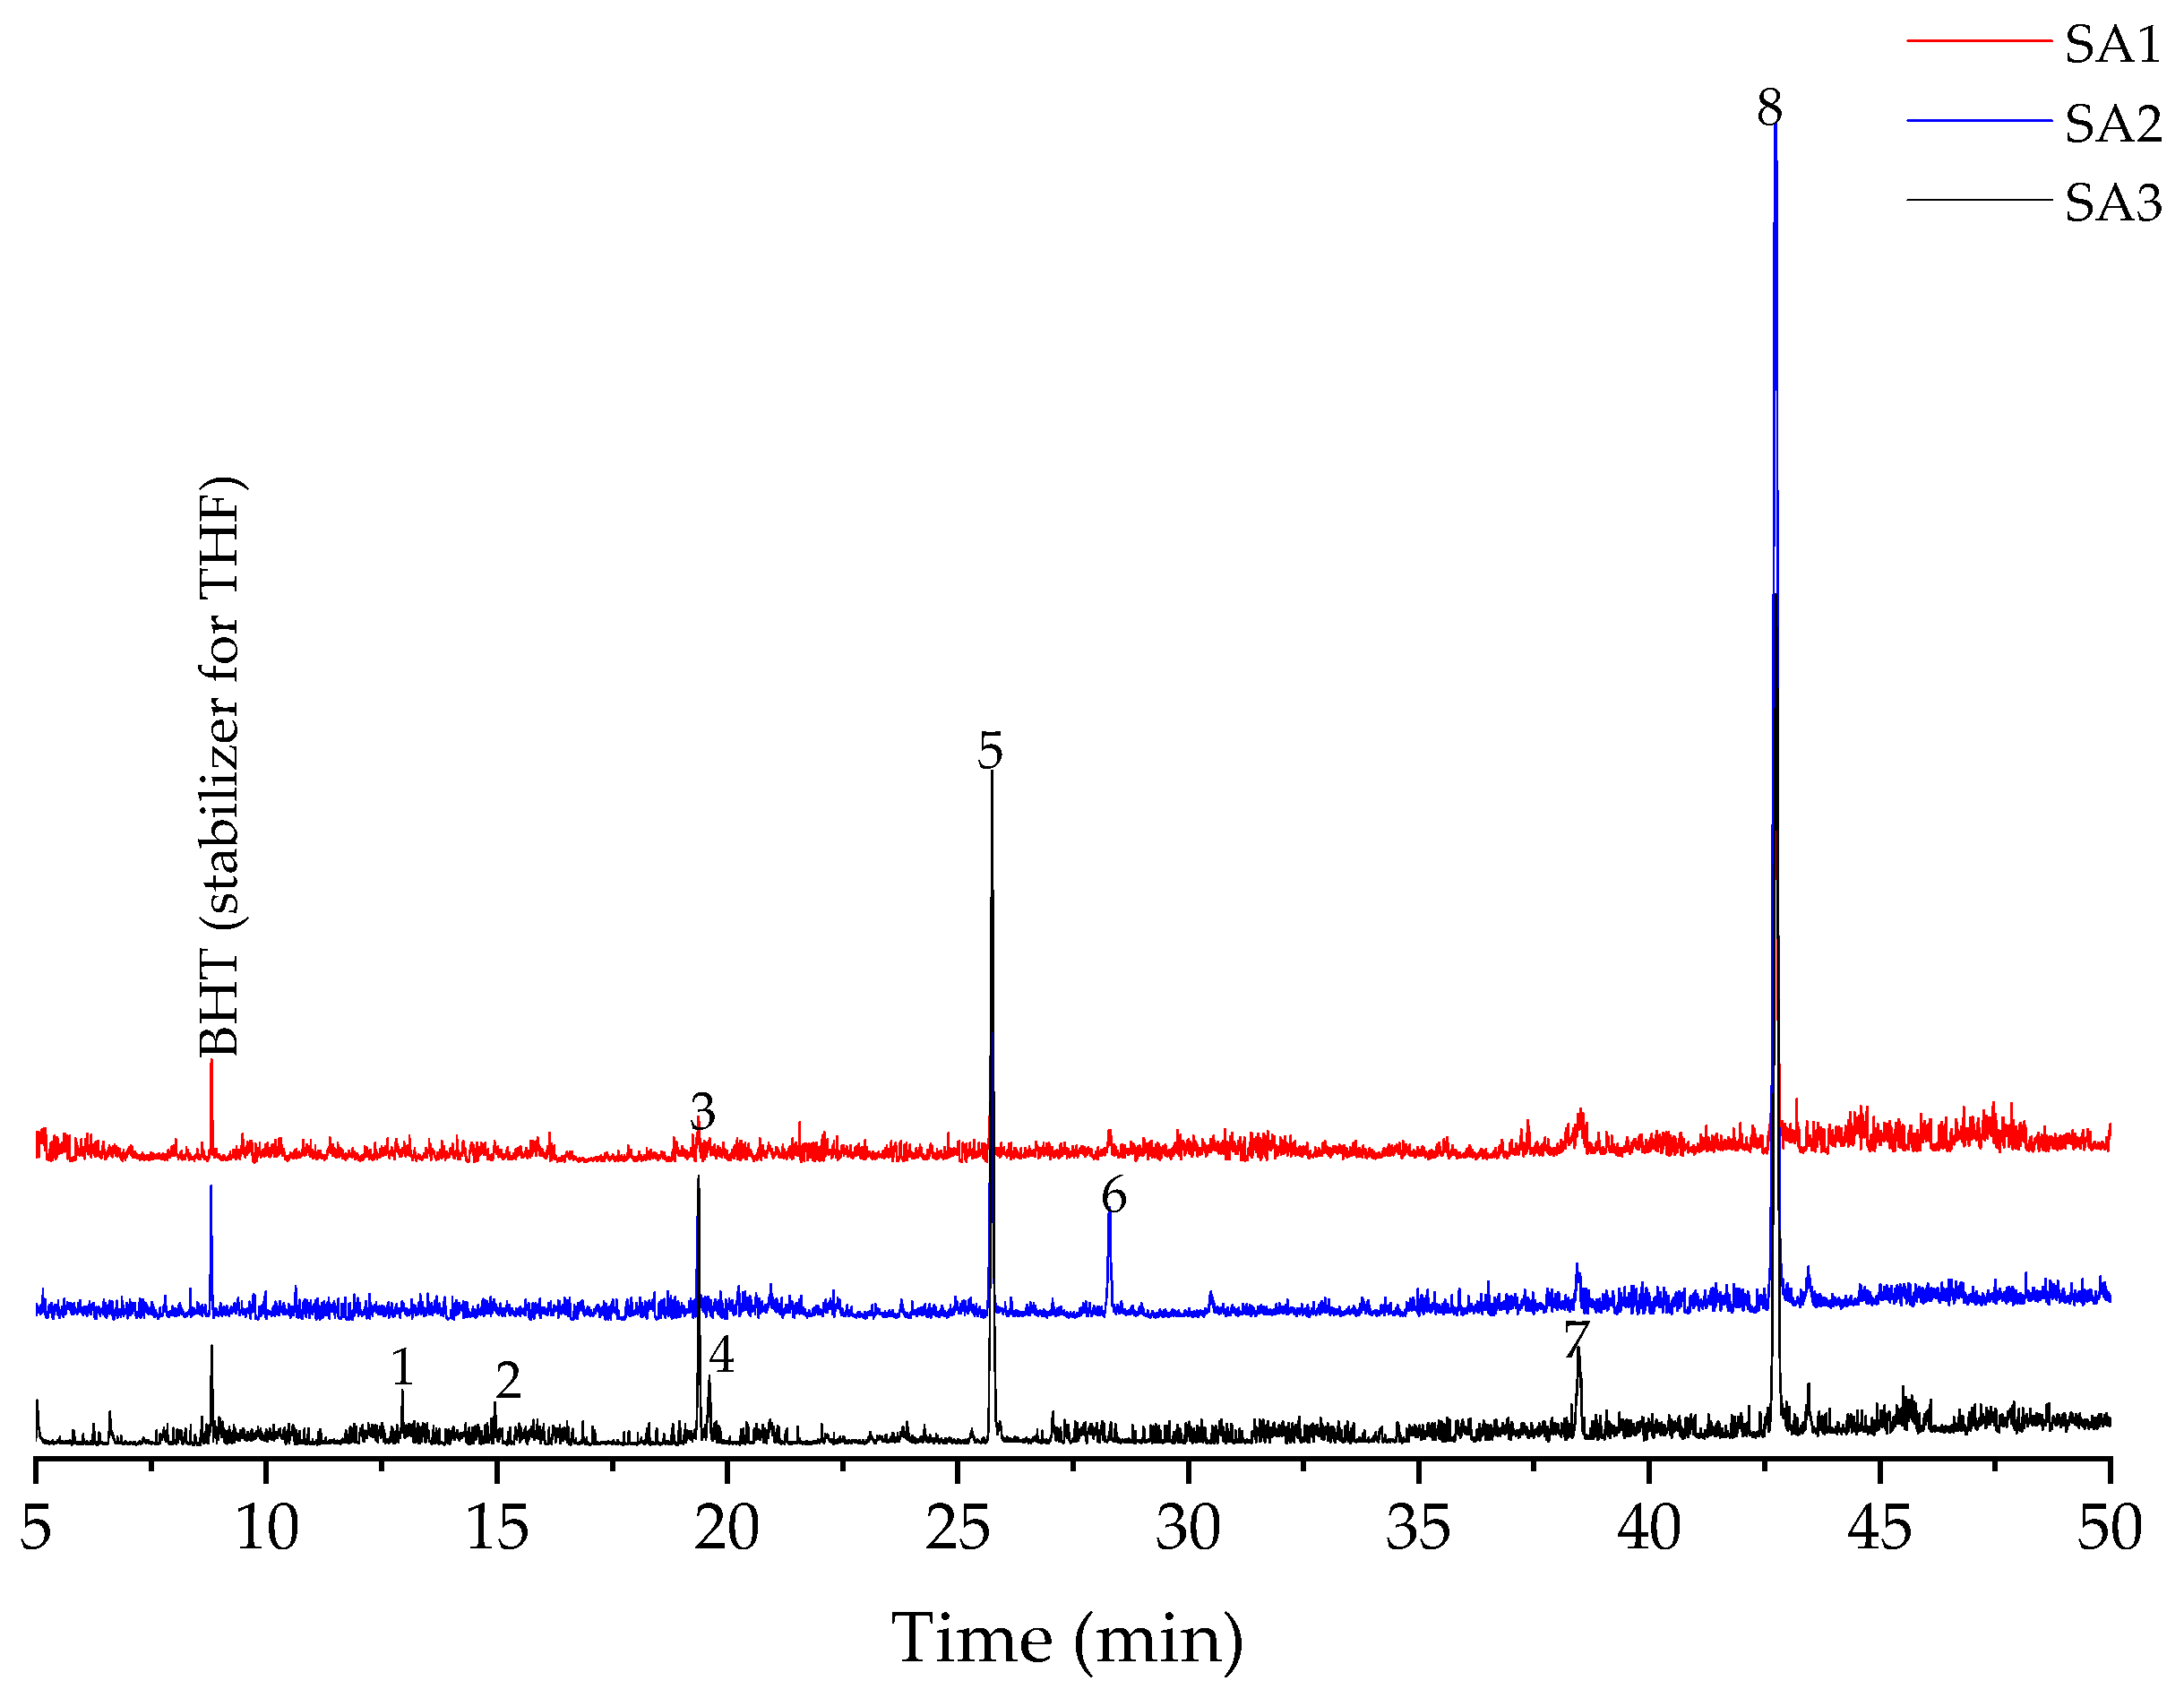
Suberin monomeric compounds were analysed by GC–MS. Quantification of individual monomers was performed based on the peak areas of the MS signals (
Figure 4). GC–MS analysis of the trimethylsilylated derivatives demonstrated that the SA mixtures remain chemically diverse, yet exhibit clear compositional differences depending on the depolymerization conditions (
Figure 4 and
Table 3).
The main groups of compounds identified in the SA fractions were as follows:
Fatty acids and their esters—predominantly hexadecanoic acid methyl ester (C16:0) and ethyl stearate (C18:0), with minor amounts of eicosenoic (C20:1) and eicosadienoic acids (C20:2) detected in some samples, indicating partial cleavage of the aliphatic polyester backbone;
Epoxy and hydroxylated fatty acids—for example, octadecanoic acid, 9,10-epoxy-18-methyl ester observed in SA3, representing more oxidized aliphatic components;
Triterpenoid extractives—betulin was the dominant compound in all samples (78–82% in SA1–SA2, 54% in SA3), whereas lupeol was only detected in SA3, indicating selective enrichment depending on the extraction pathway.
Quantitative analysis revealed that the triterpenoid fraction dominated the composition of all samples, with betulin reaching up to 82% in SA1. The proportion of aliphatic esters and free fatty acids was highest in SA3, reflecting a shift towards more extensively depolymerized suberinic structures under its preparation conditions. The absence of detectable ω-hydroxyacids, diacids, and aromatic acids suggests either their removal during processing (e.g., drying) or concentrations below the detection limit for this analytical run. Despite these omissions, the mixture still contained both reactive aliphatic components and extractive-derived triterpenoids, highlighting that SA are multifunctional systems in which the balance between fatty acid derivatives and triterpenes is strongly influenced by the depolymerization protocol.
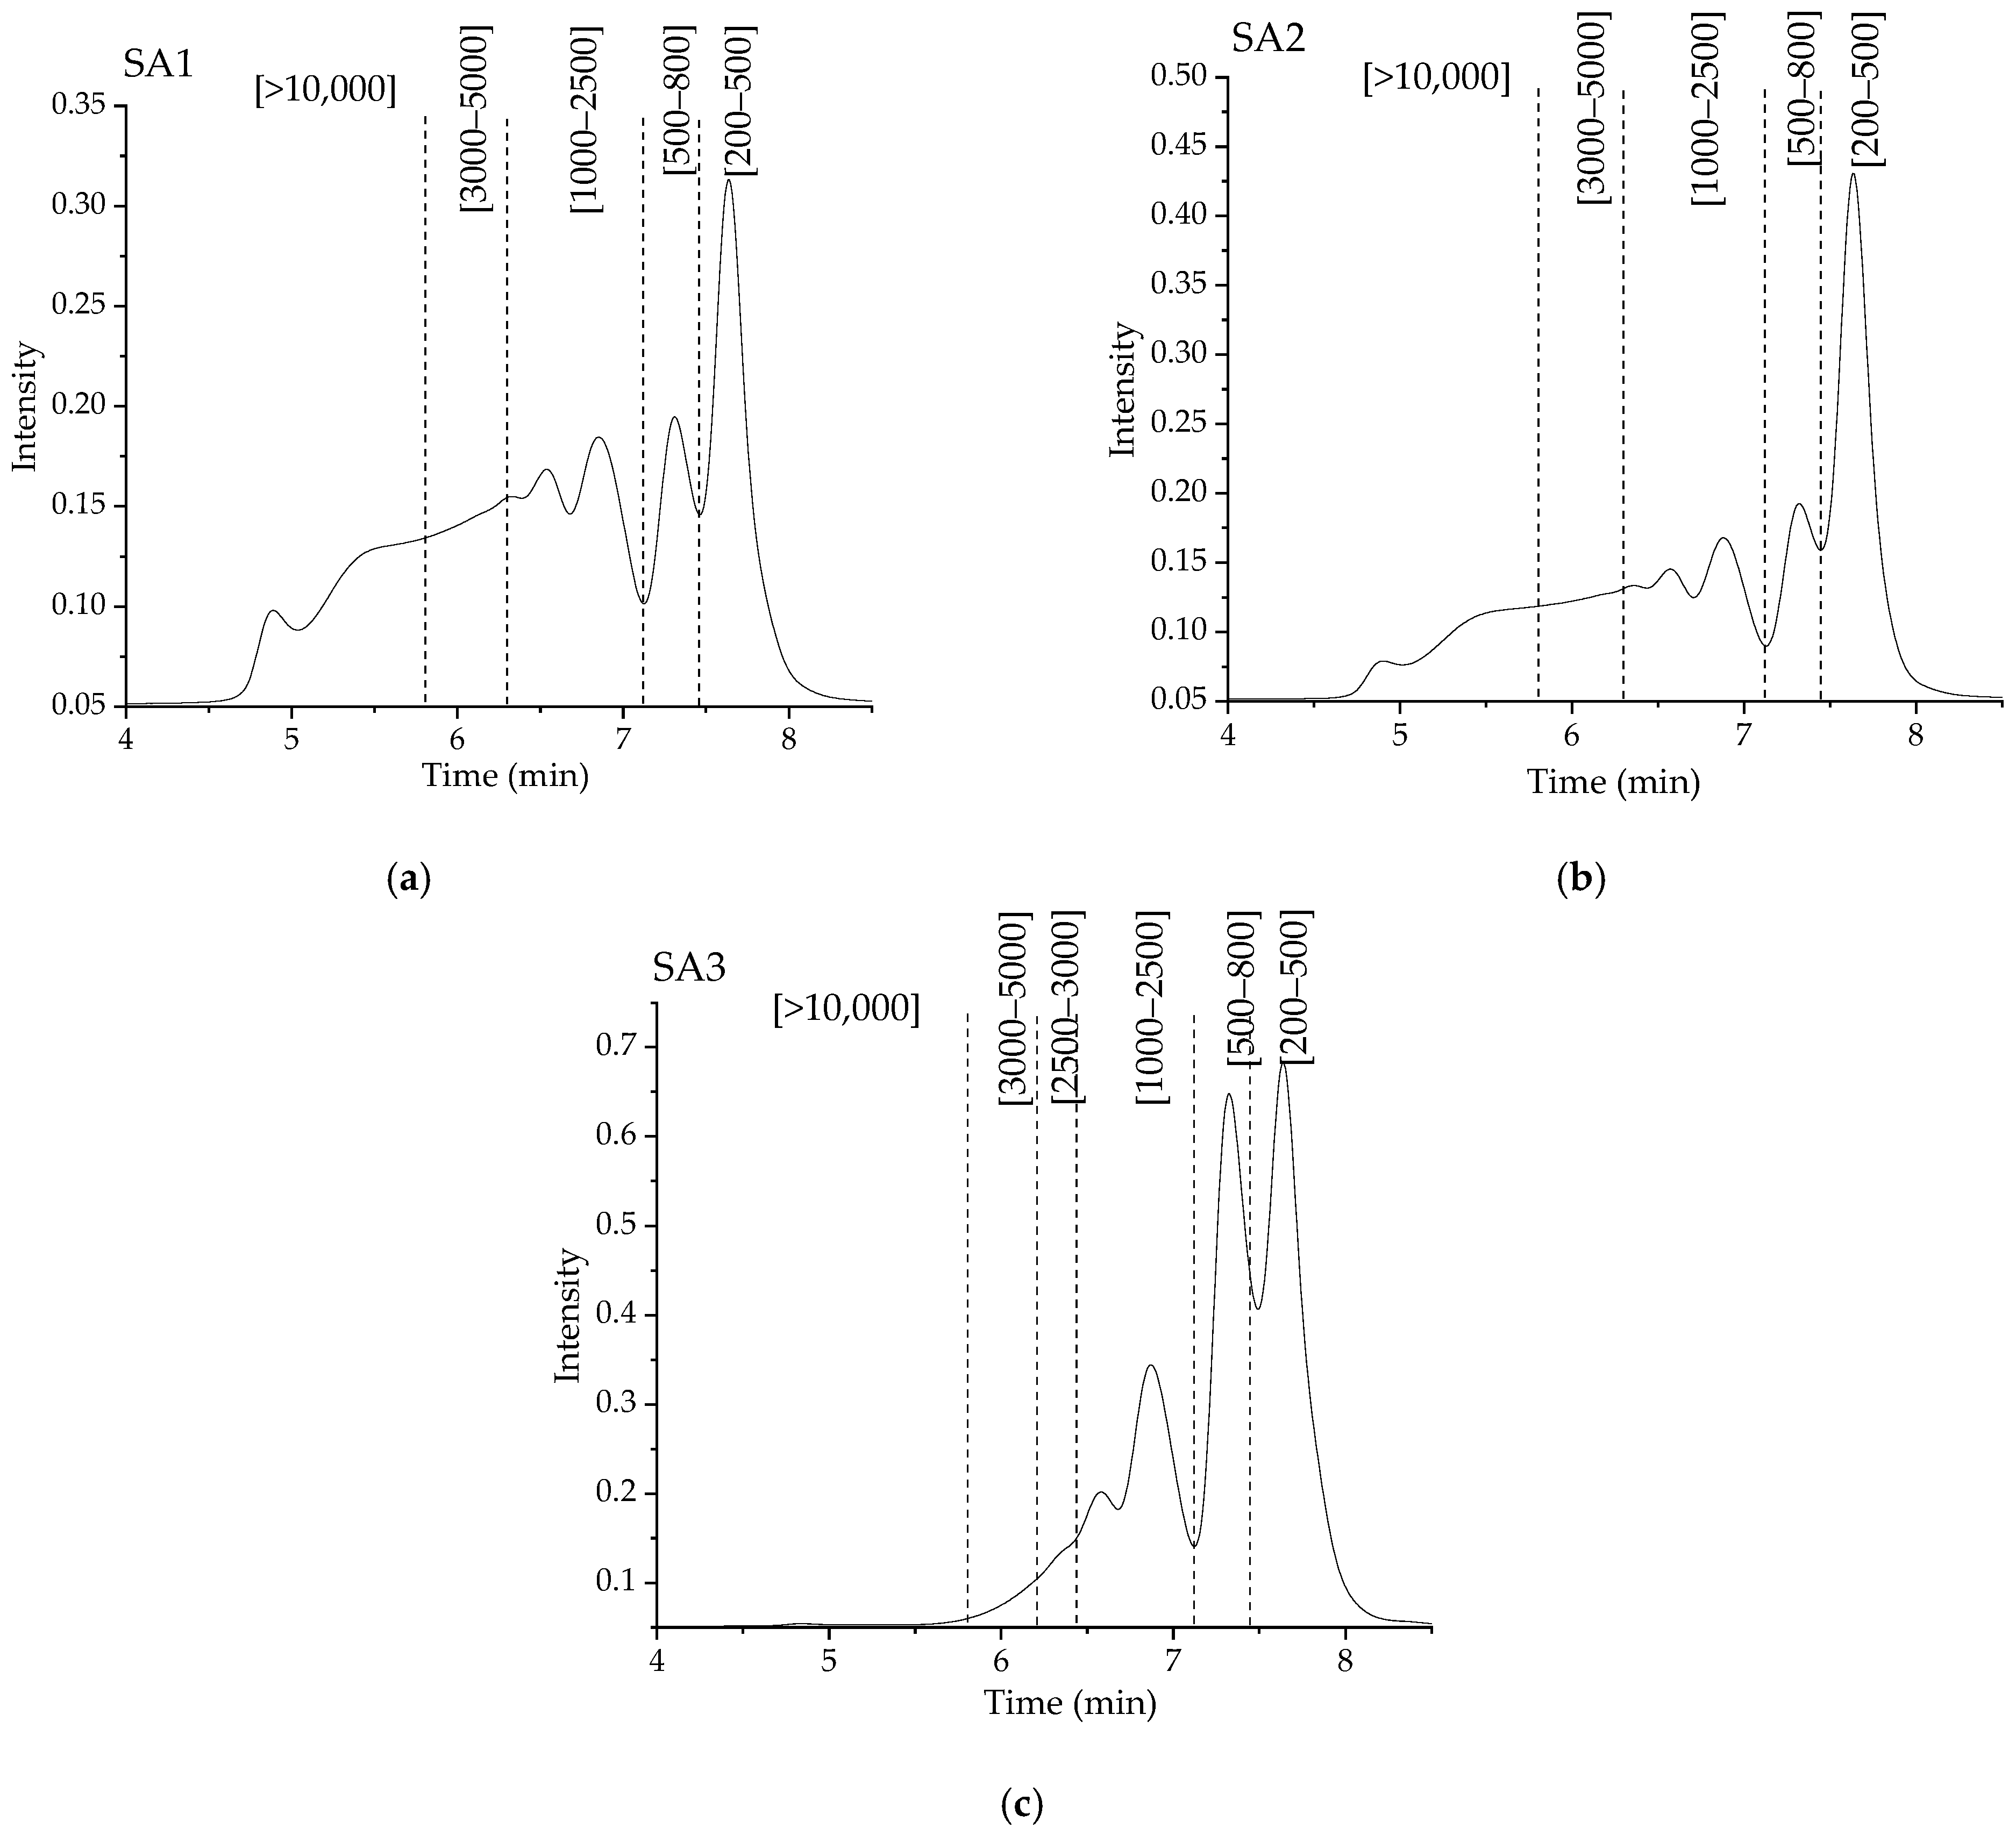
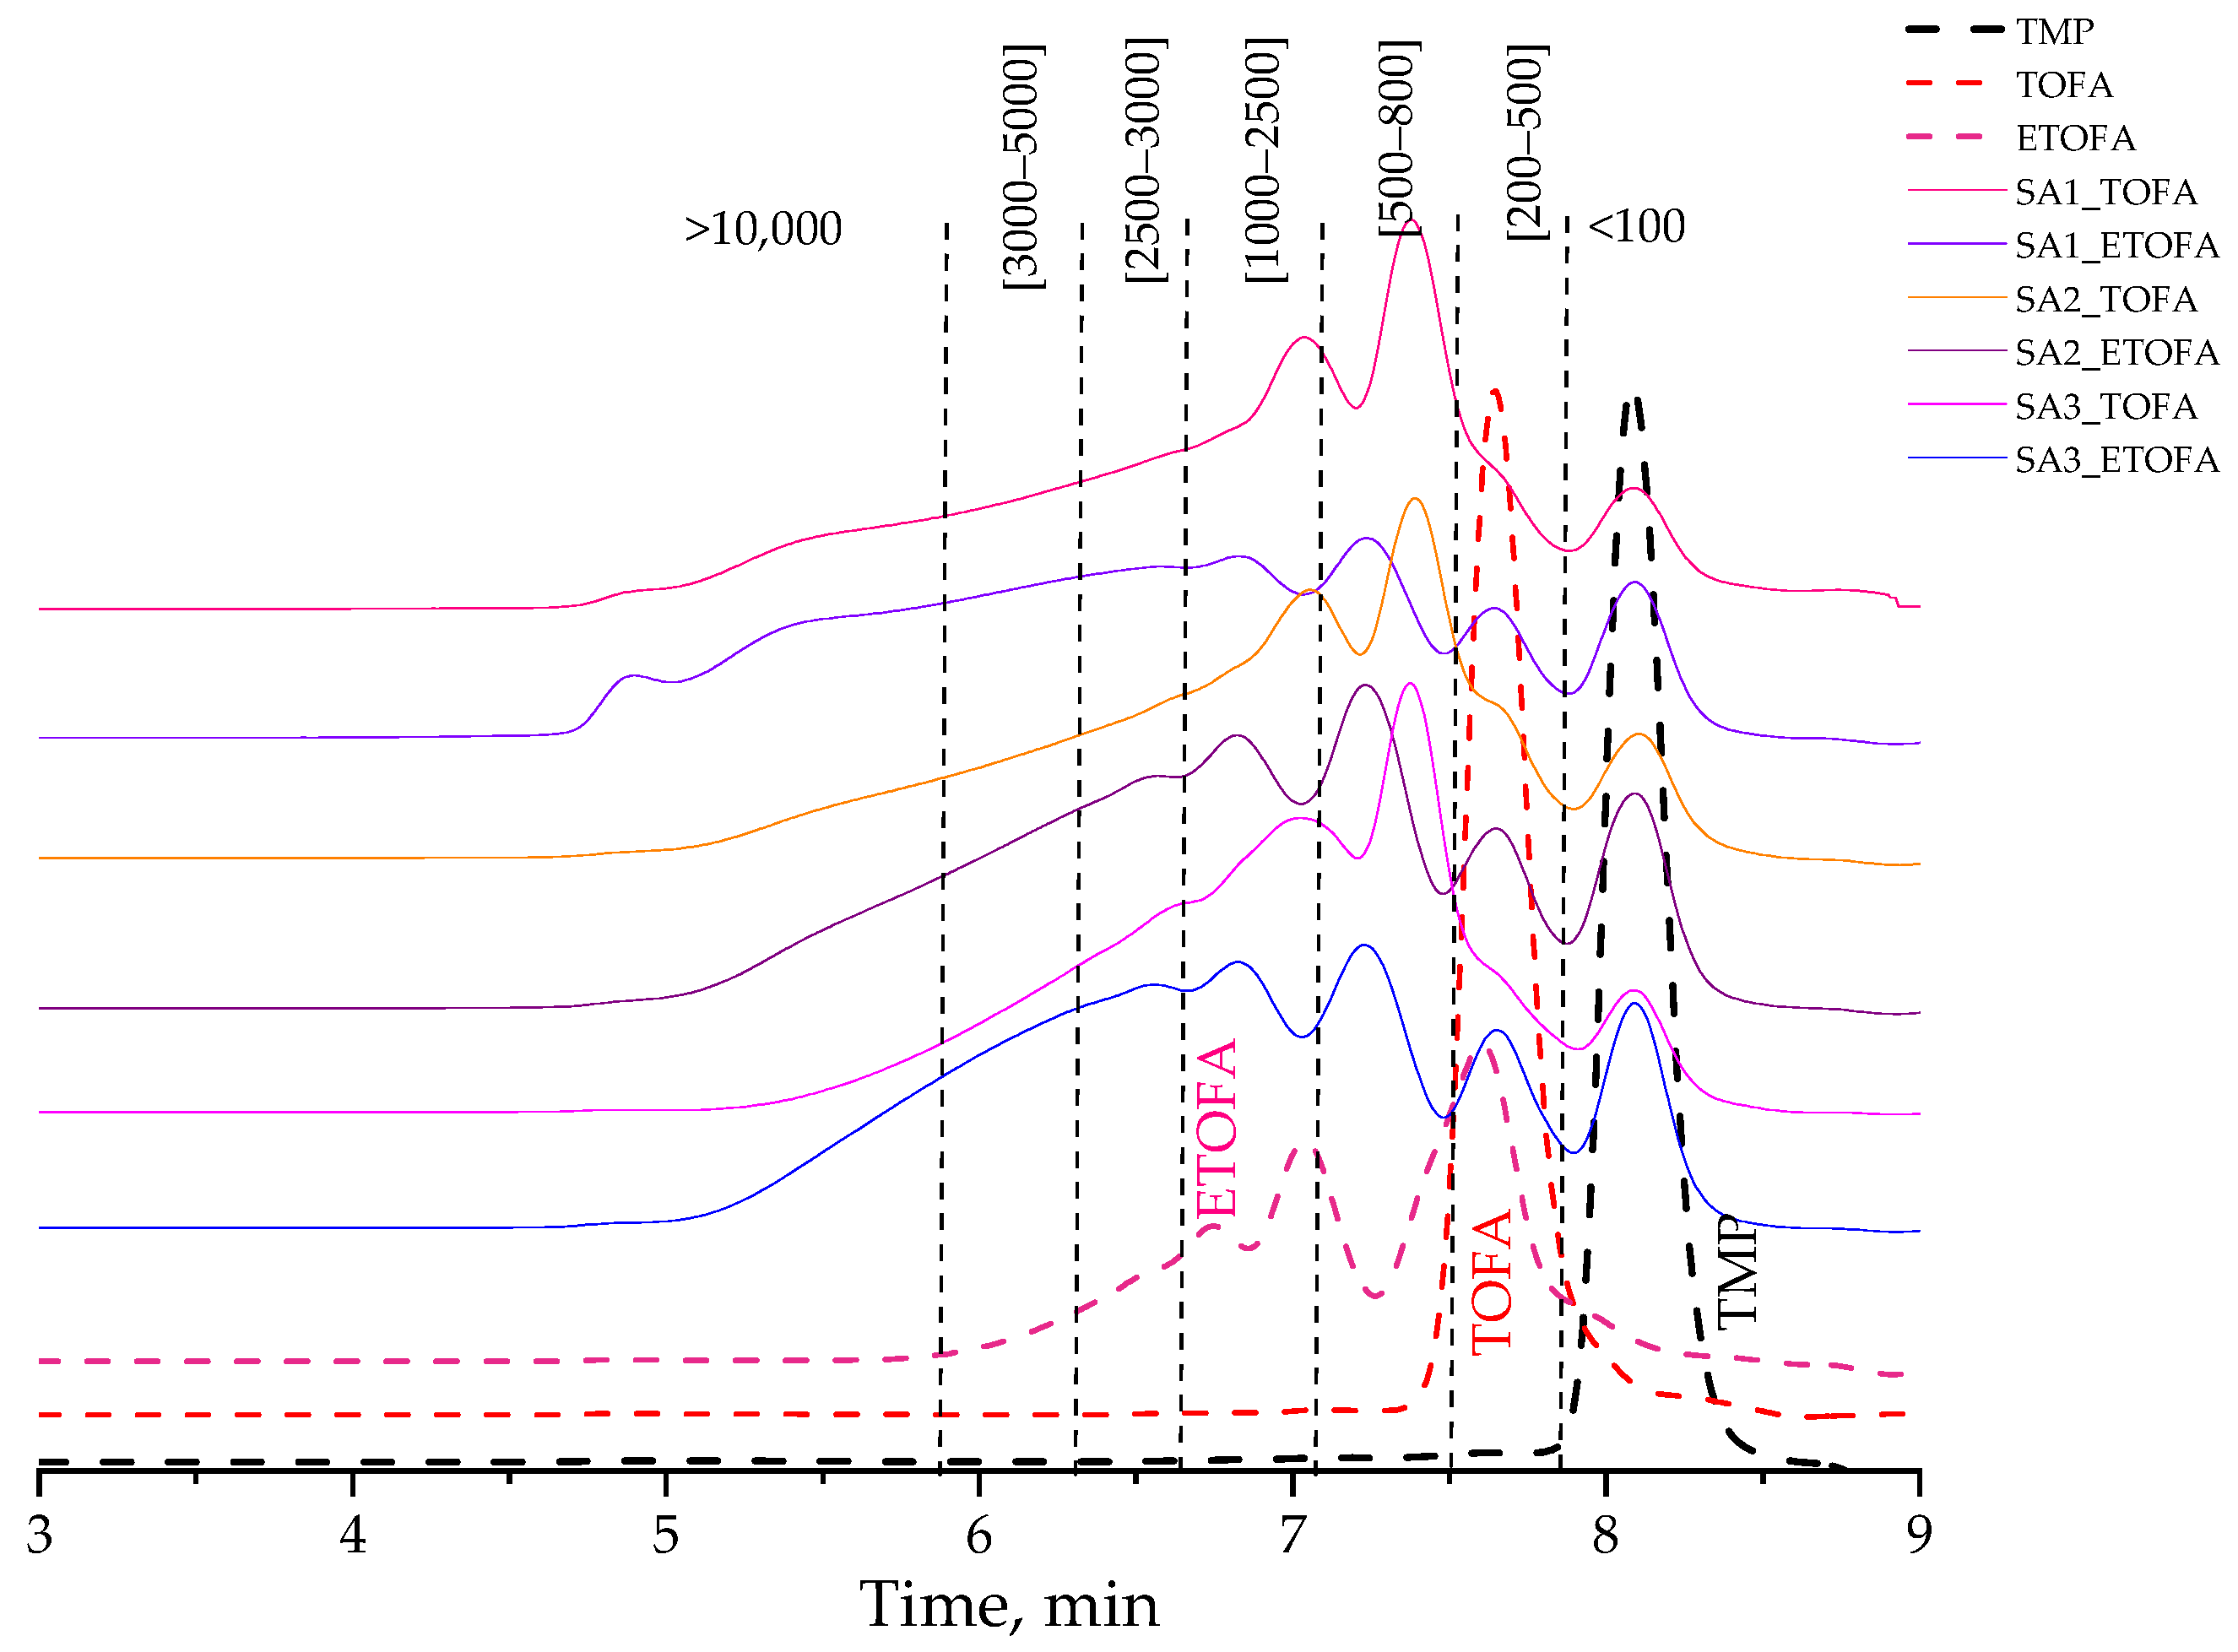
Gel permeation chromatography with a refractive index detector (GPC-RID) provided detailed insight into the molecular weight distribution of the SA fractions. The chromatograms revealed a broad, polydisperse profile, indicating the presence of both low-molar-mass monomers/oligomers and a substantial proportion of higher-molar-mass oligomeric species (
Figure 5).
For each analysed sample, deconvolution into distinct molecular weight populations was performed using the multiple peak fit function in OriginPro 2021b. The peak separation (fitting) procedure was based on the relationship between retention time and molecular weight obtained from the calibration with polystyrene standards. Polystyrene standards with molar masses of 200, 500, 850, 1000, 2500, 3000, 5000, 9000, 17,500, 20,000, and 30,000 g·mol−1 were used for calibration.
Because of structural differences between suberin-derived compounds and polystyrene standards, the obtained molecular weight values are only approximate. Therefore, the results are reported as molar mass ranges rather than absolute molar masses, since assigning exact molar masses based on polystyrene calibration would not be accurate.
The relative area (%) of each molecular weight population was calculated from the chromatographic peak areas using the calibration curve fitted with a third-order polynomial equation. The calculated values, based on polystyrene calibration, indicate that the SA fractions comprise a continuum of species ranging from <500 Da (monomeric acids and esters) to >10,000 Da, reflecting partially depolymerized oligomeric fragments (
Table 4).
The low-molecular-weight peaks (200–500 Da) observed in GPC correspond to the monomeric species identified by GC–MS (e.g., fatty acids, diacids, and hydroxy acids). In addition, GPC reveals an oligomeric fraction (>500 Da) that cannot be resolved by GC–MS, confirming that a substantial portion of the SA is present as oligomeric polyesters. SA1 and SA2 exhibit similar molecular weight distributions, with more than one-third composed of oligomeric polyesters above 2500 Da, whereas SA3 predominantly contains those in the 200–2500 Da range. The monomeric and short oligomeric fractions provide readily available functional groups (–OH, –COOH) for PU chemistry, ensuring reactivity and crosslinking potential. The broad molecular weight distribution highlights the multifunctional nature of SA, bridging the roles of small reactive monomers and larger oligomeric structures in foam formation. Overall, GPC confirms that SA are not a uniform product but rather polydisperse mixtures of monomers and oligomers, whose combined presence is expected to influence the thermal behaviour, reactivity, and flammability of the resulting PU foams.
3.3. Characterization of SA-Based Rigid PU Foams
Rigid PU foams were prepared exclusively from the synthesized SA-based polyols, following the formulations summarized in
Table 1 (
Section 2). No additional flame retardants were added, allowing the SA-based polyols’ specific contribution to flammability to be assessed.
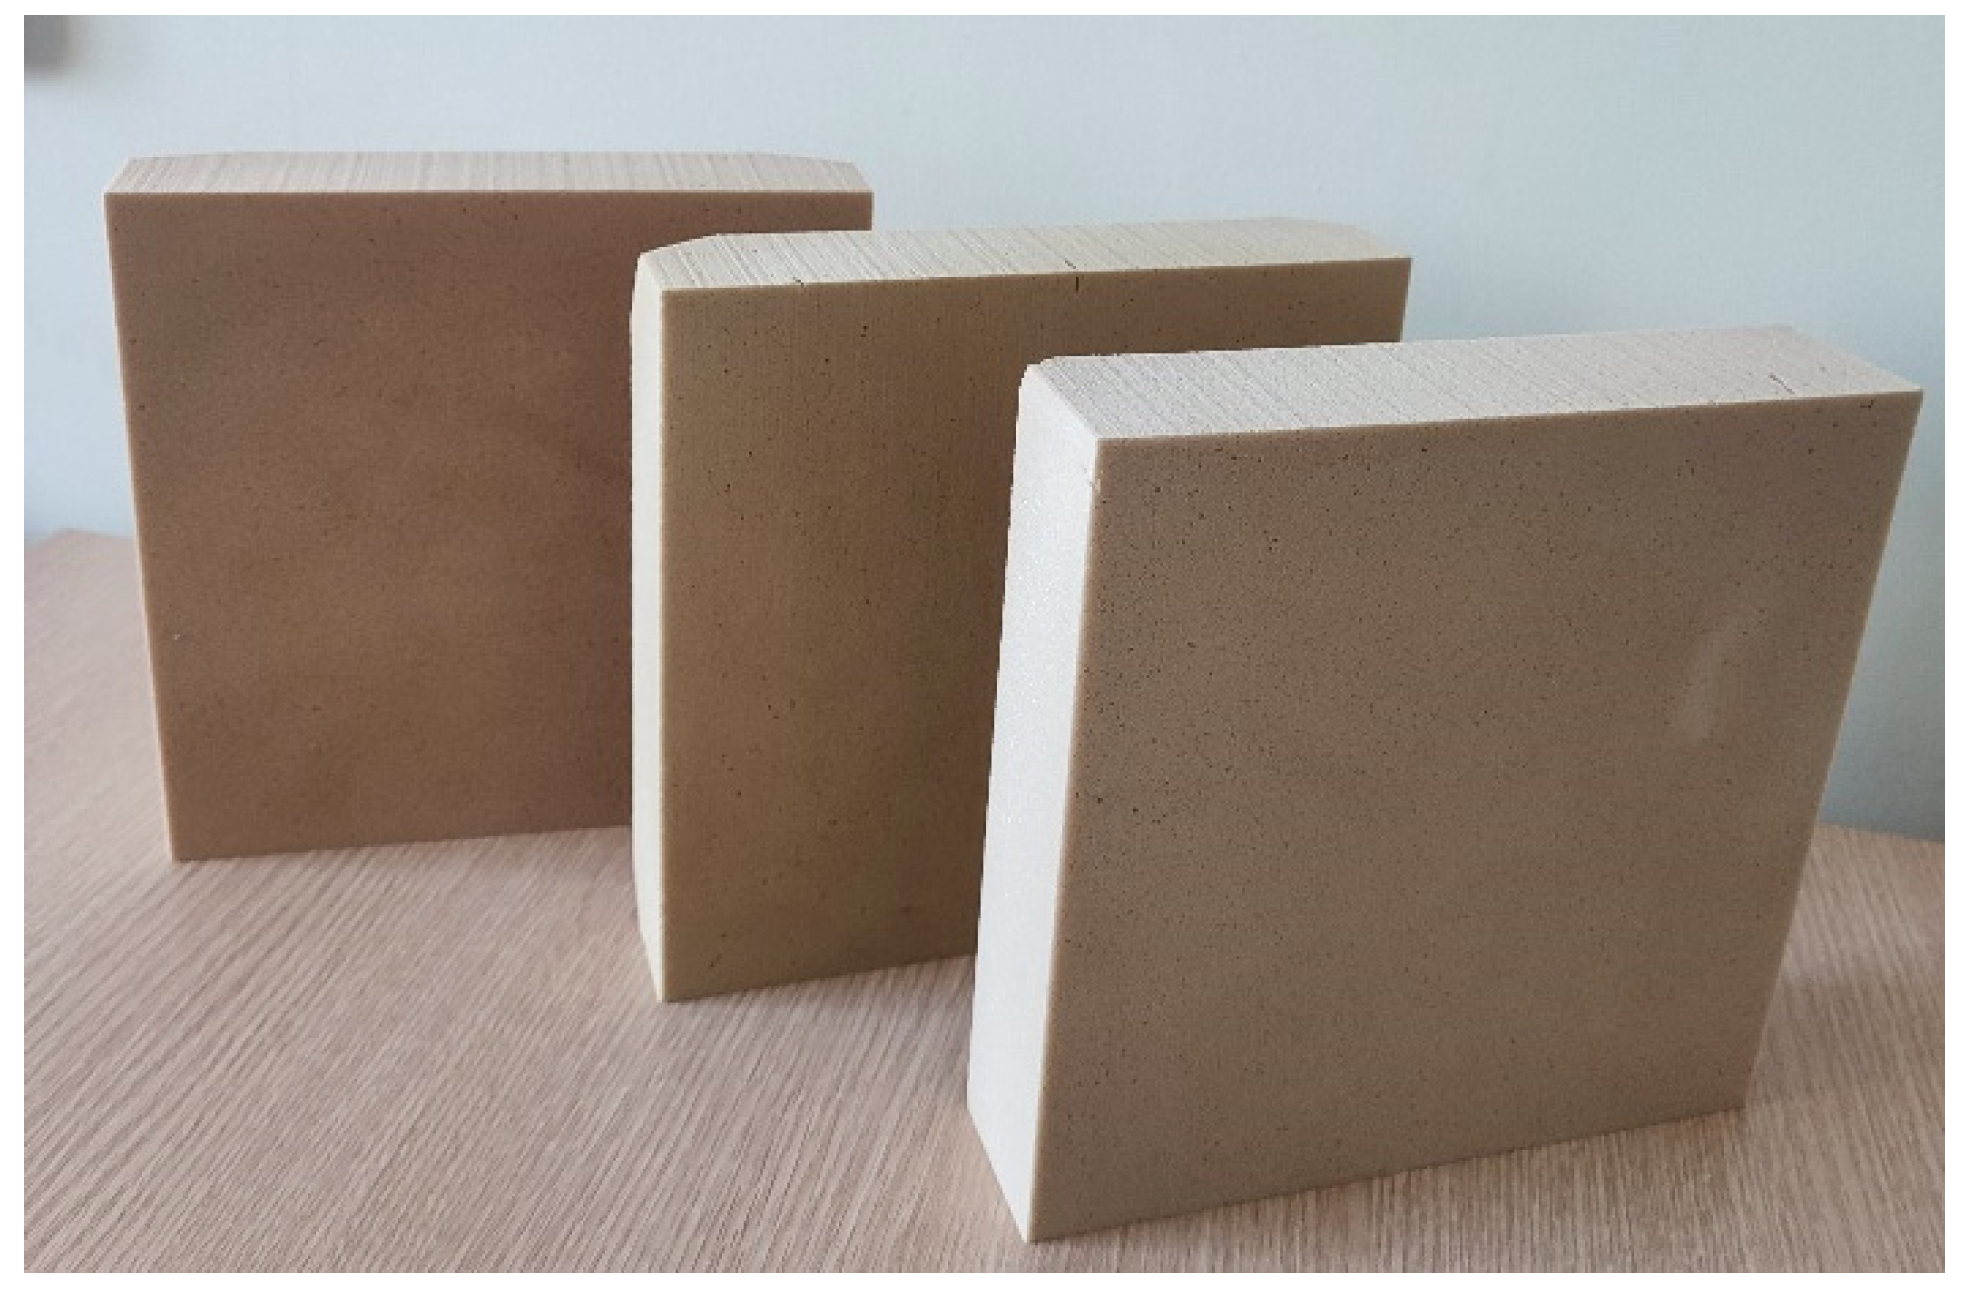
By visual inspection, the foams exhibited acceptable quality, with a uniform cellular structure free of cracks or other major defects. They were mechanically robust, maintained their shape without deformation, and showed no signs of excessive brittleness. Representative photographs of the samples are shown in
Figure 7.
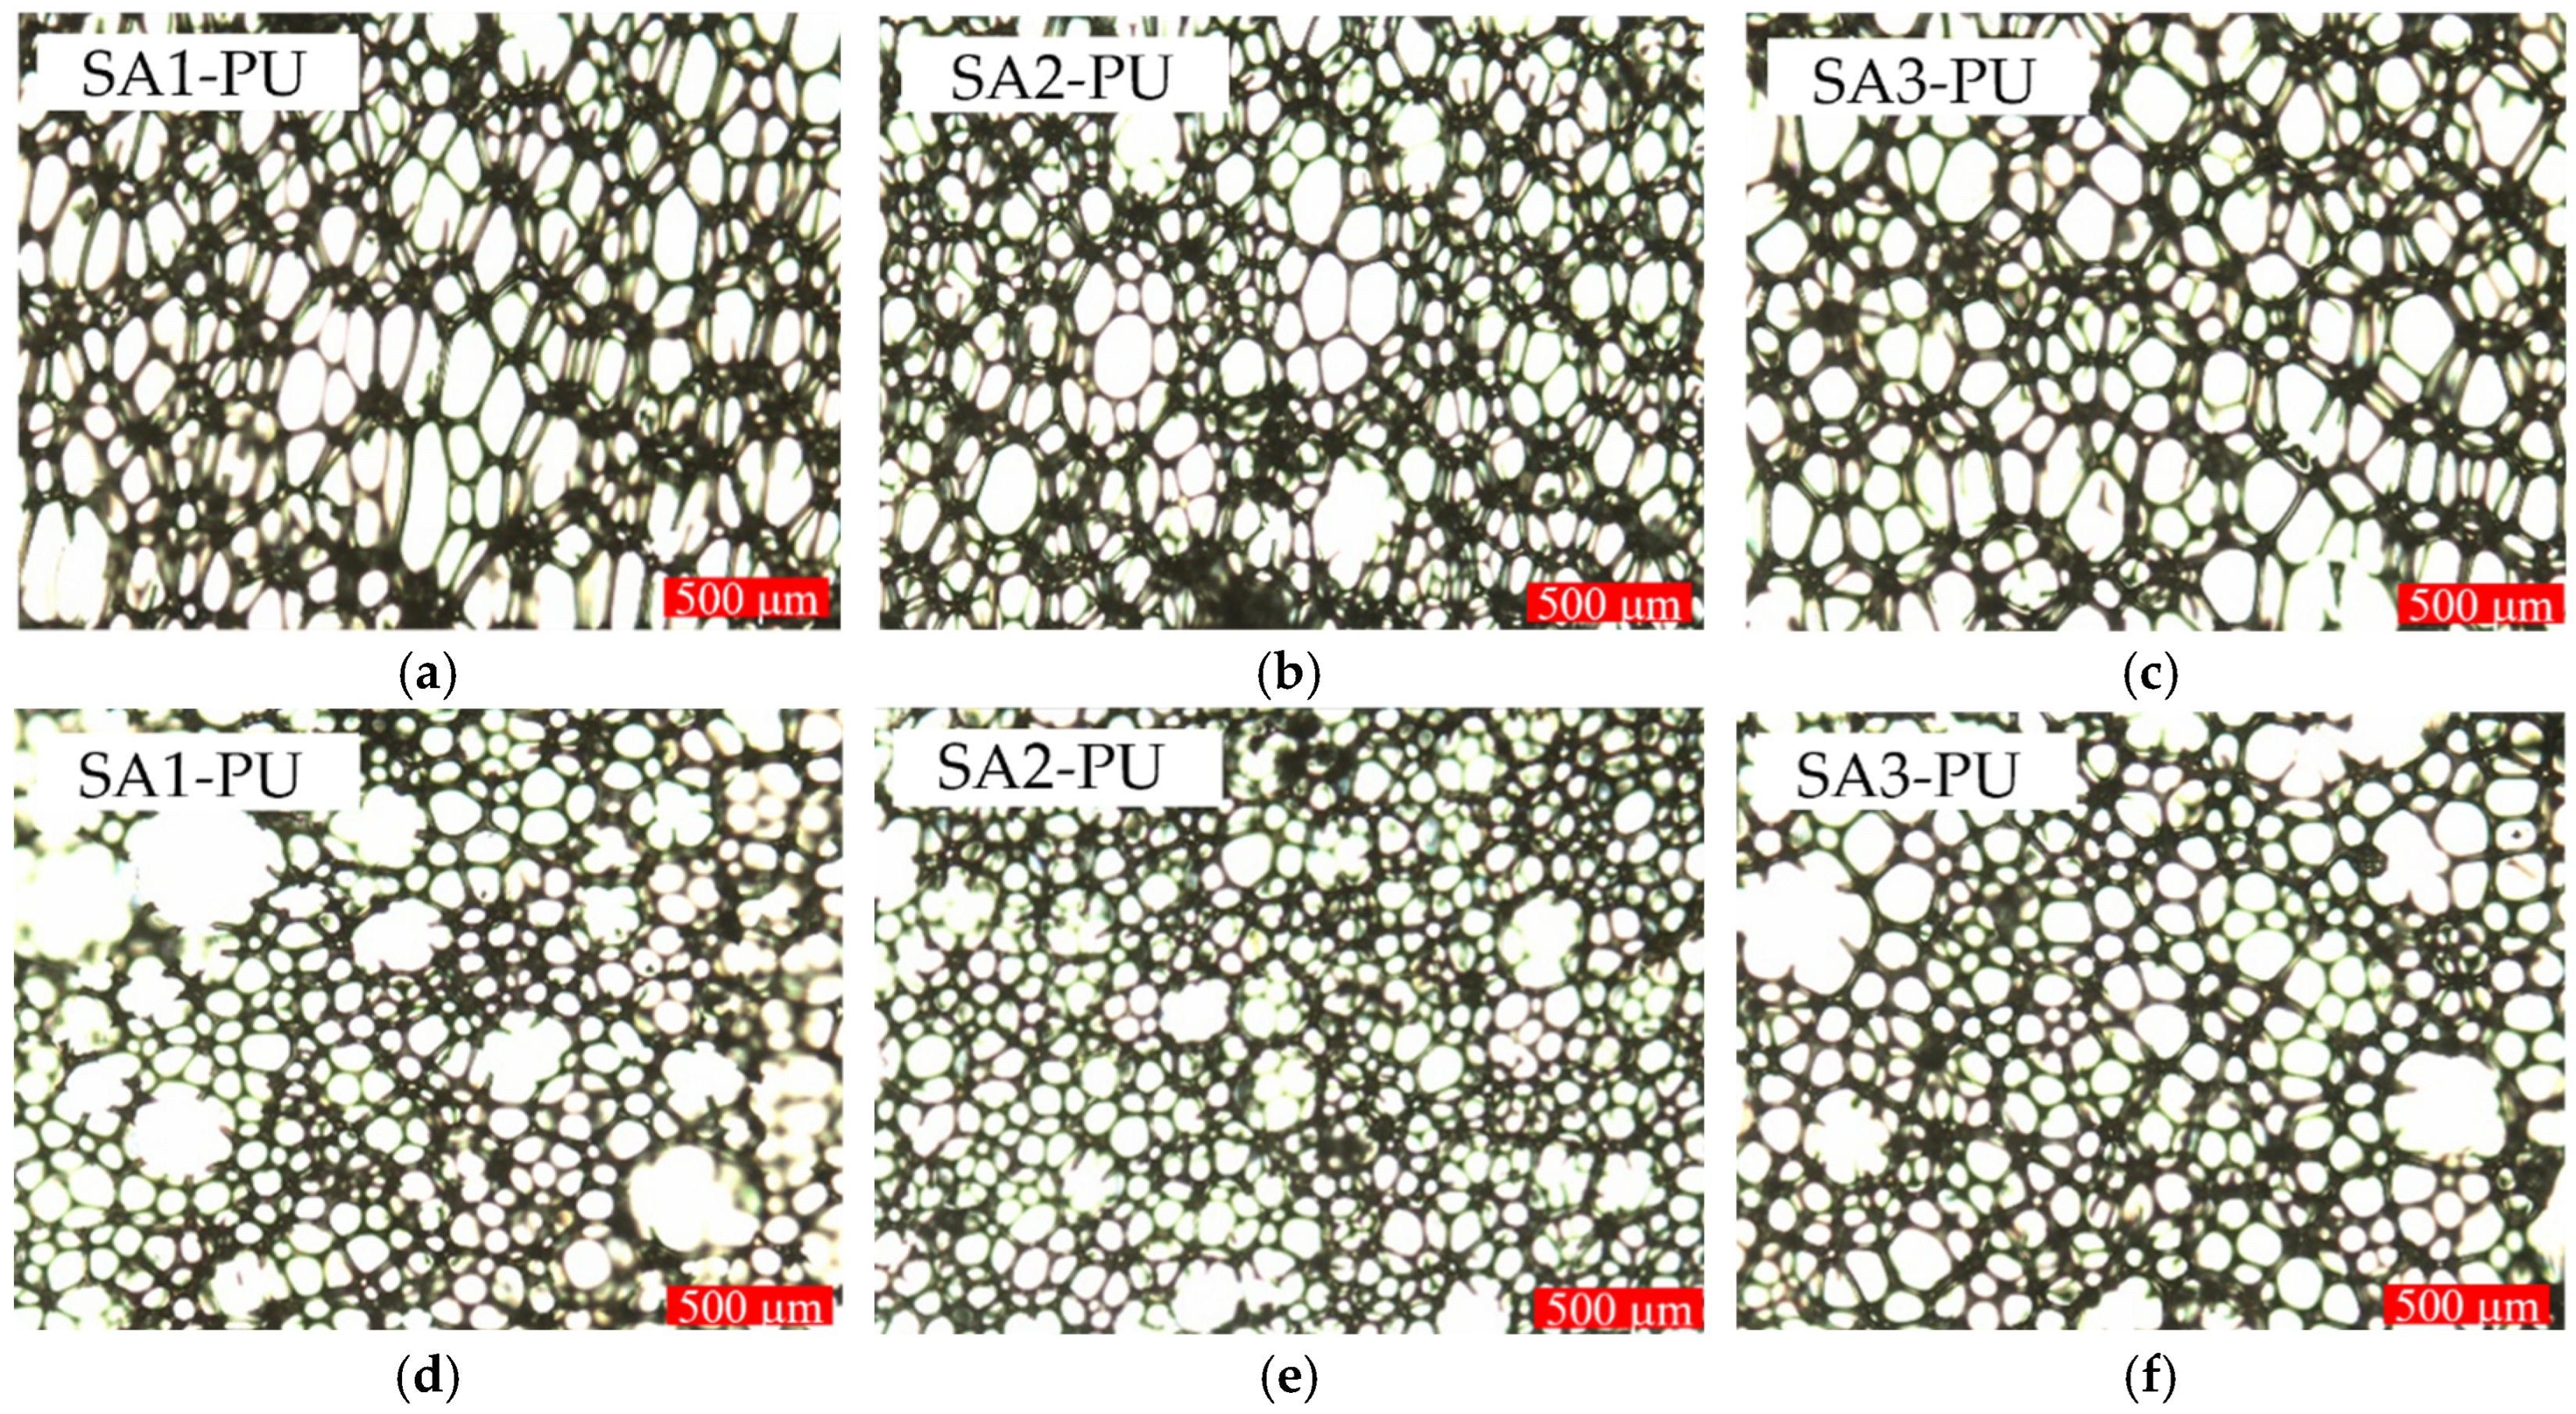
The cellular structure was further examined by optical microscopy (
Figure 8) performed in a parallel direction (a–c). All foams exhibit elongated and anisotropic cells aligned along the foaming direction, which is characteristic of rigid PU foams produced by free-rise expansion. Among the samples, SA2-PU displays the smallest and most uniform cells, whereas SA3-PU contains larger and more elongated cells with a broader cell size distribution.
Foaming parameters, shrinkage, closed-cell content, apparent density, and thermal conductivity are reported in
Table 7.
Closed-cell PU foams (closed-cell content > 93%) with apparent densities of 39–45 kg/m
3 were obtained, corresponding to the typical range of rigid PU foams used in thermal insulation of building materials [
22]. Foaming parameters, including start, gel, and rise times, were within optimal ranges, ensuring proper foam formation. SA3–PU system exhibited higher reactivity due to the lower average molecular weight and viscosity of its polyols, resulting in foams with lower apparent density. Consequently, less blowing agent would be required to achieve the same apparent density compared with the SA1–PU and SA2–PU systems. Dimensional shrinkage after 24 h was below 6%, indicating negligible deformation. The rigid PU foams contained approximately 31–34% renewable content, including ~16% SA, and if bio-based TMP were used, the total renewable material content could reach 46%.
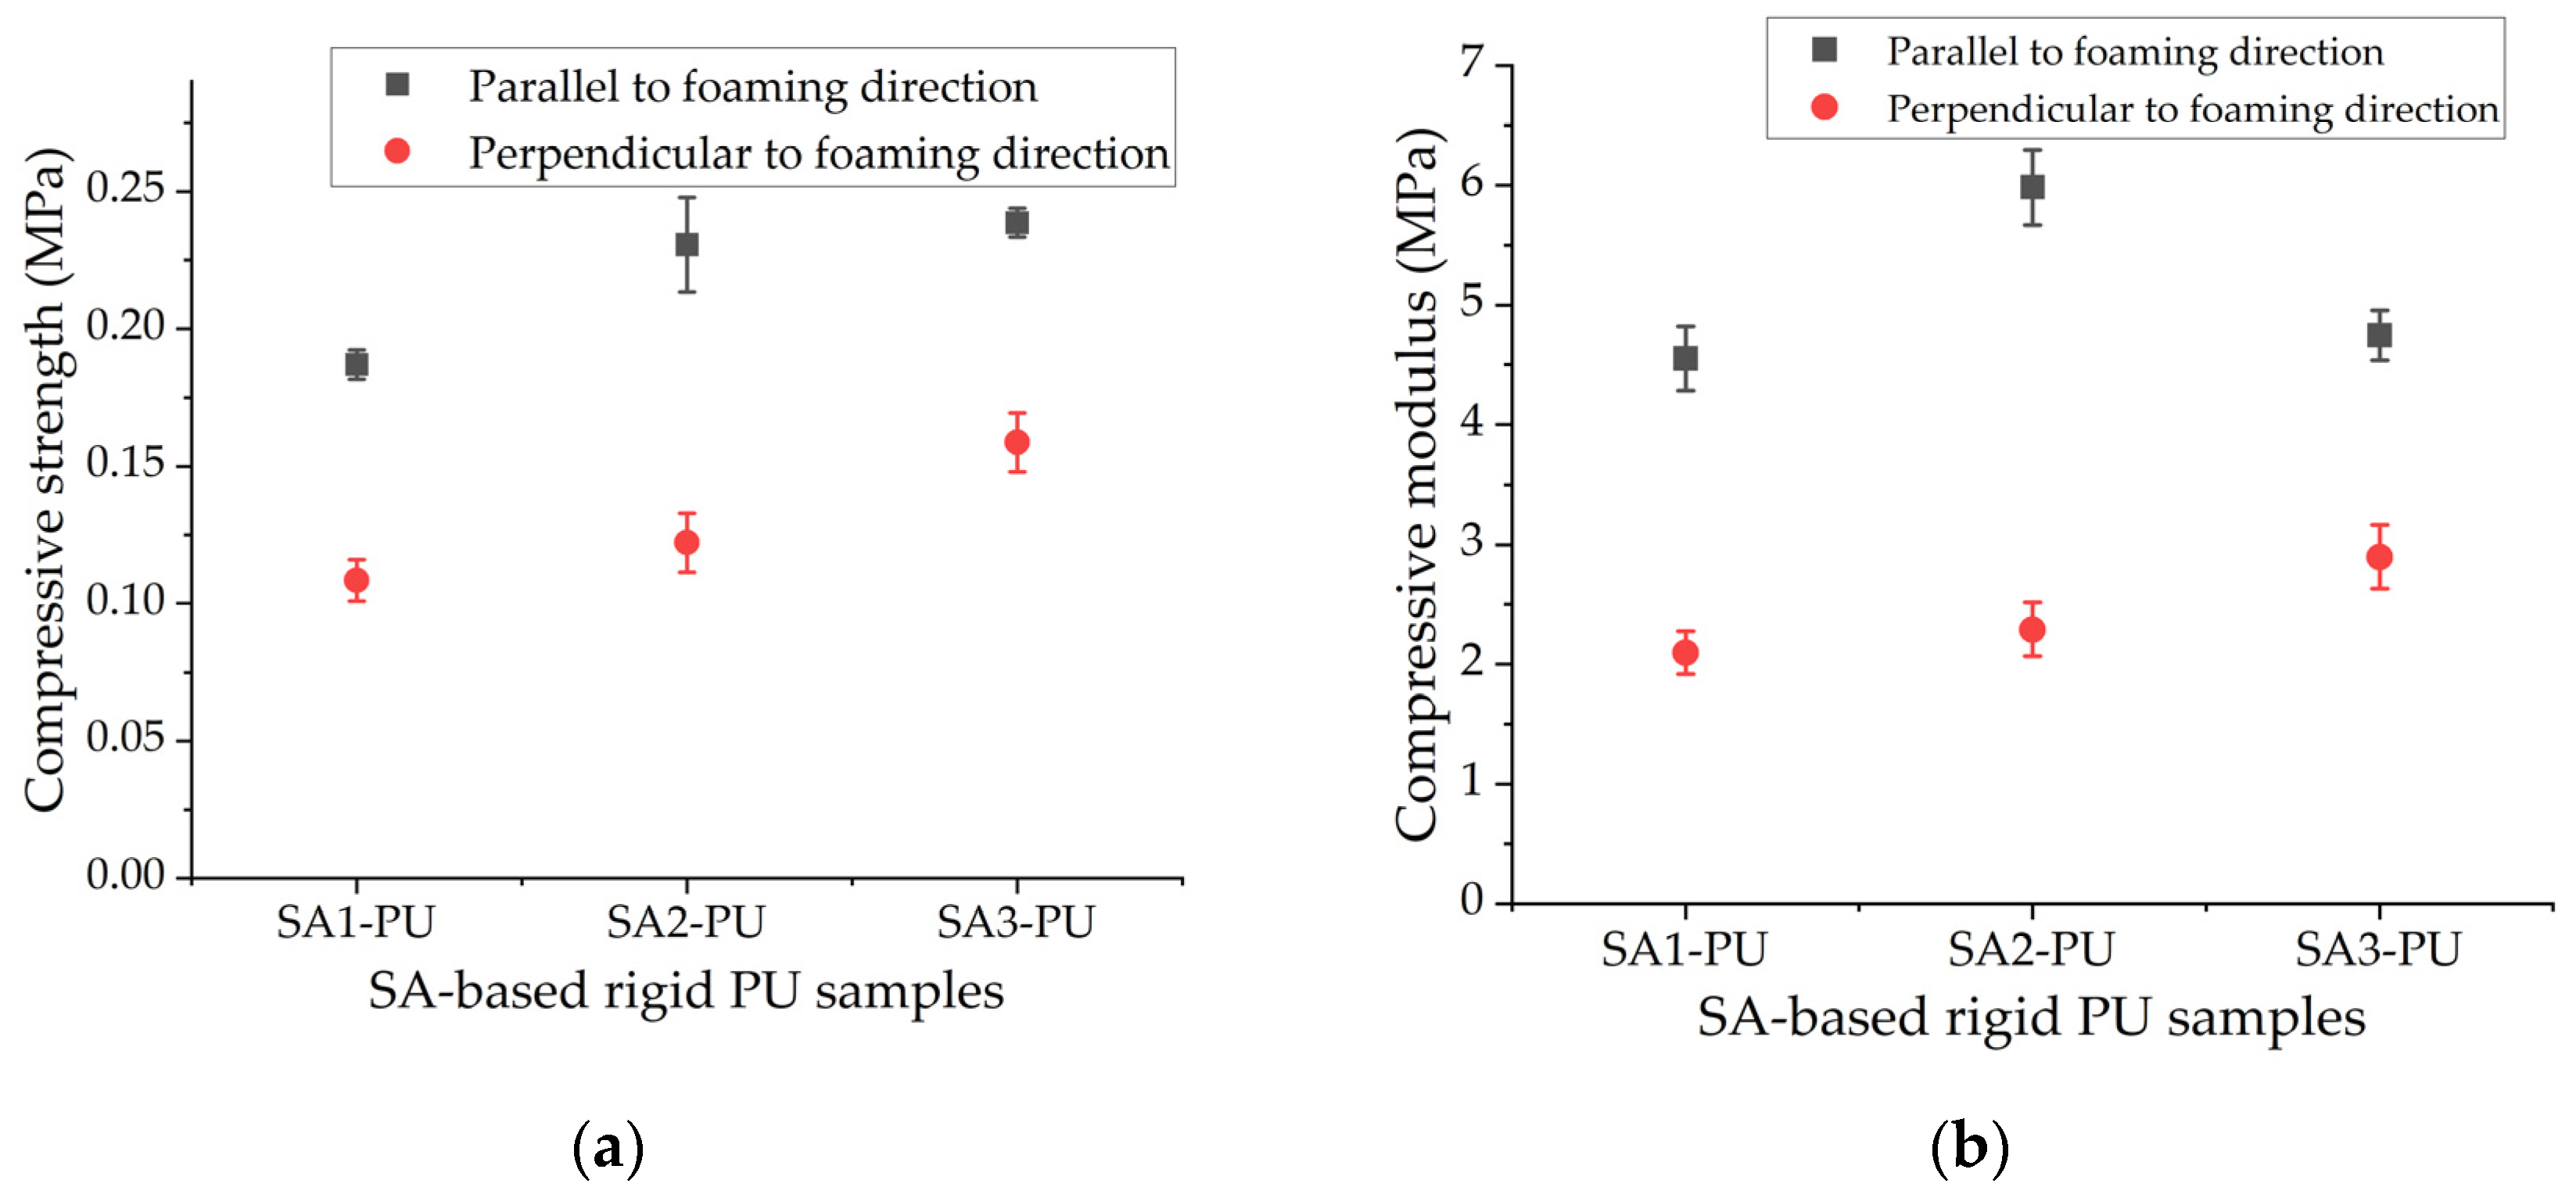
The compressive properties of the SA-based rigid PU foams were evaluated parallel and perpendicular to the foaming direction (
Figure 9). All samples exhibited pronounced anisotropy, with compressive strength and modulus measured parallel to the foaming direction being approximately 2–3 times higher perpendicular values, which is typical for closed-cell free-rise rigid PU foams due to preferential cell elongation along the rise direction. SA2-PU and SA3-PU showed comparable compressive strength within the experimental error, whereas SA1-PU exhibited slightly lower values. SA2-PU demonstrated the highest compressive modulus parallel to the foaming direction, indicating a stiffer elastic response. Although SA3-PU had the highest compressive strength, its compressive modulus was lower than that of SA2-PU, likely due to the chemical composition of the SA3 fraction and the resulting polymer network characteristics. The lower viscosity and modified functionality of the SA3-based polyols may have produced a less rigid but more homogeneous crosslinked structure, providing enhanced load-bearing capacity with lower stiffness in the elastic region. Overall, the compressive strength values (0.19–0.24 MPa) are consistent with literature data reported for rigid PU foams with similar apparent densities (40–50 kg/m
3), including bio-based polyol systems such as SA-based polyols (0.20–0.36 MPa) [
11,
42], tall oil-based polyols (0.21–0.28 MPa) [
44], and polyols derived from lignocellulosic biomass (0.22–0.42 MPa) [
45].
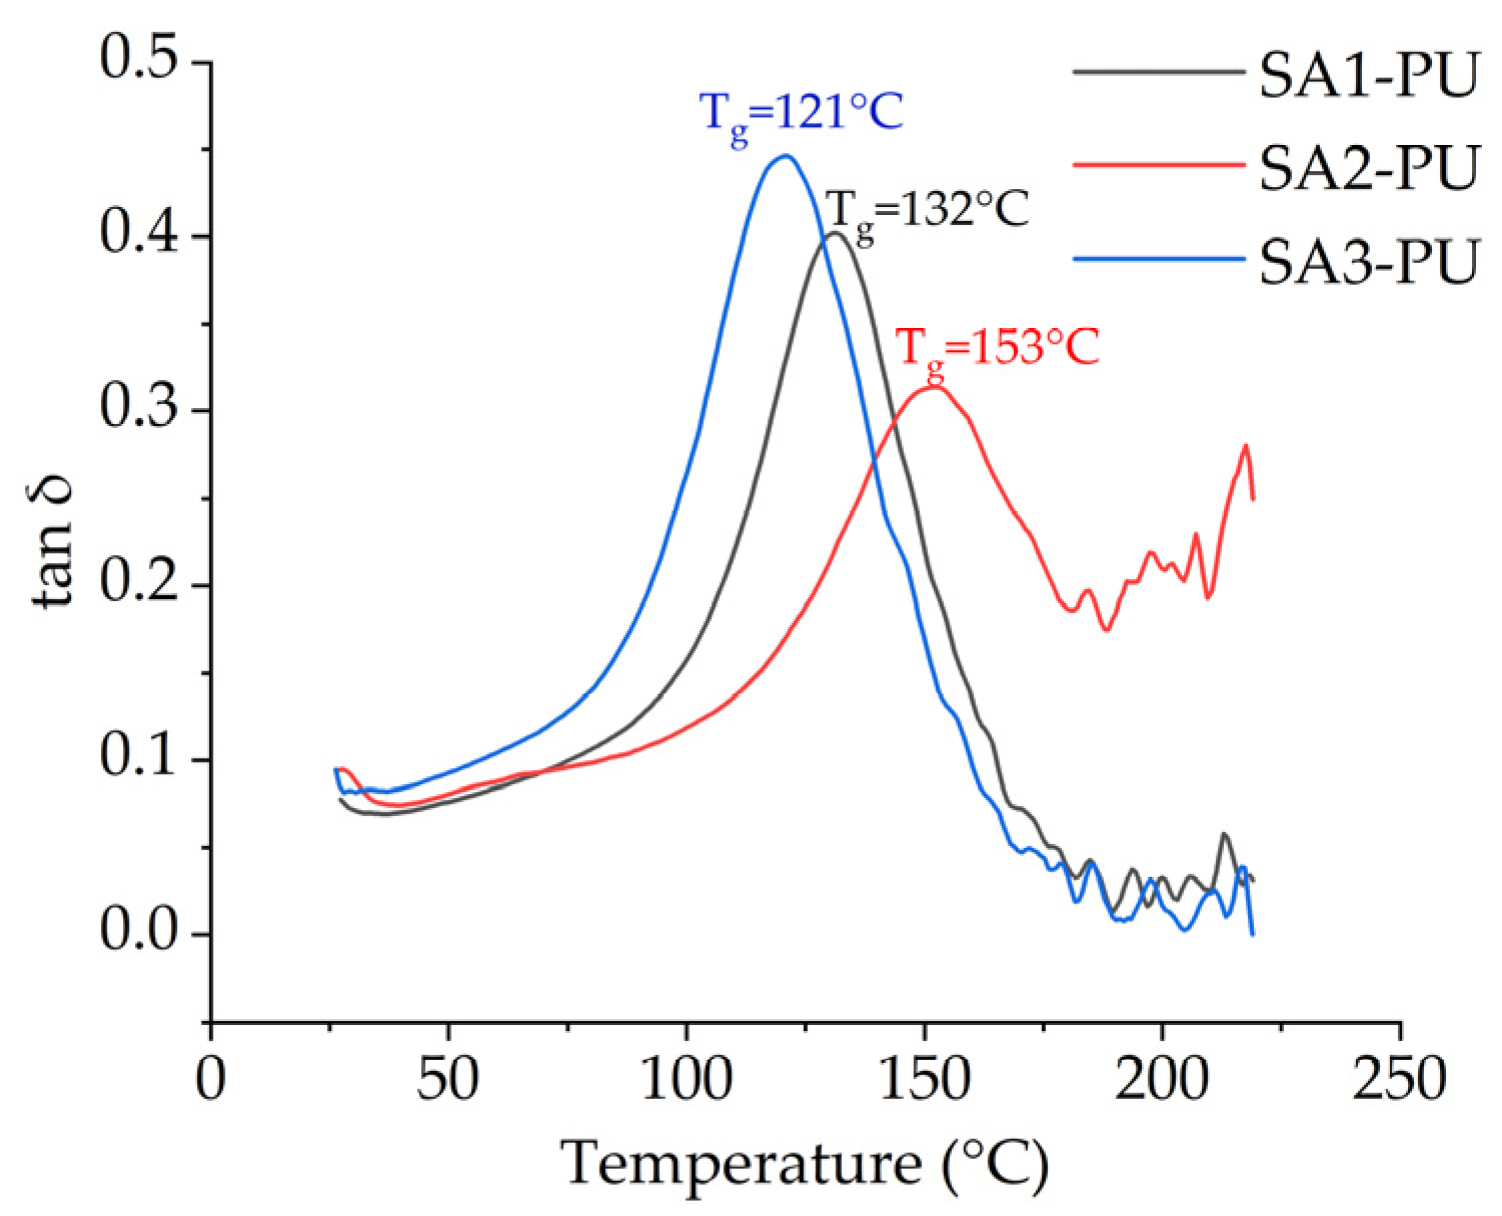
DMA results for the rigid PU foam samples are shown in
Figure 10, with tan δ displayed as a function of temperature.
The Tg of each sample was determined from the peak maximum of the tan δ curve. SA3-PU exhibited the lowest Tg (121 °C), followed by SA1-PU (132 °C), while SA2-PU showed the highest Tg (153 °C). These differences reflect variations in polymer chain mobility: the higher Tg of SA2-PU indicates more restricted segmental motion, likely due to increased crosslinking density or a stiffer molecular architecture, whereas the lower Tg of SA3-PU suggests a more flexible polymer network. During FeCl3 treatment, removal of polyphenolics in SA3 may co-precipitate suberin oligomers rich in hydroxyl or carboxyl groups, reducing the overall functionality of the remaining SA fraction and lowering crosslink density in the resulting PU foam. Although polyphenolics are not the dominant factor controlling Tg, their residual presence in SA1 and SA2 may still contribute to rigidity through side reactions with isocyanates. In addition, FeCl3 treatment may enrich SA3 in shorter aliphatic monomers that act as internal plasticizers, further increasing chain mobility and reducing Tg.
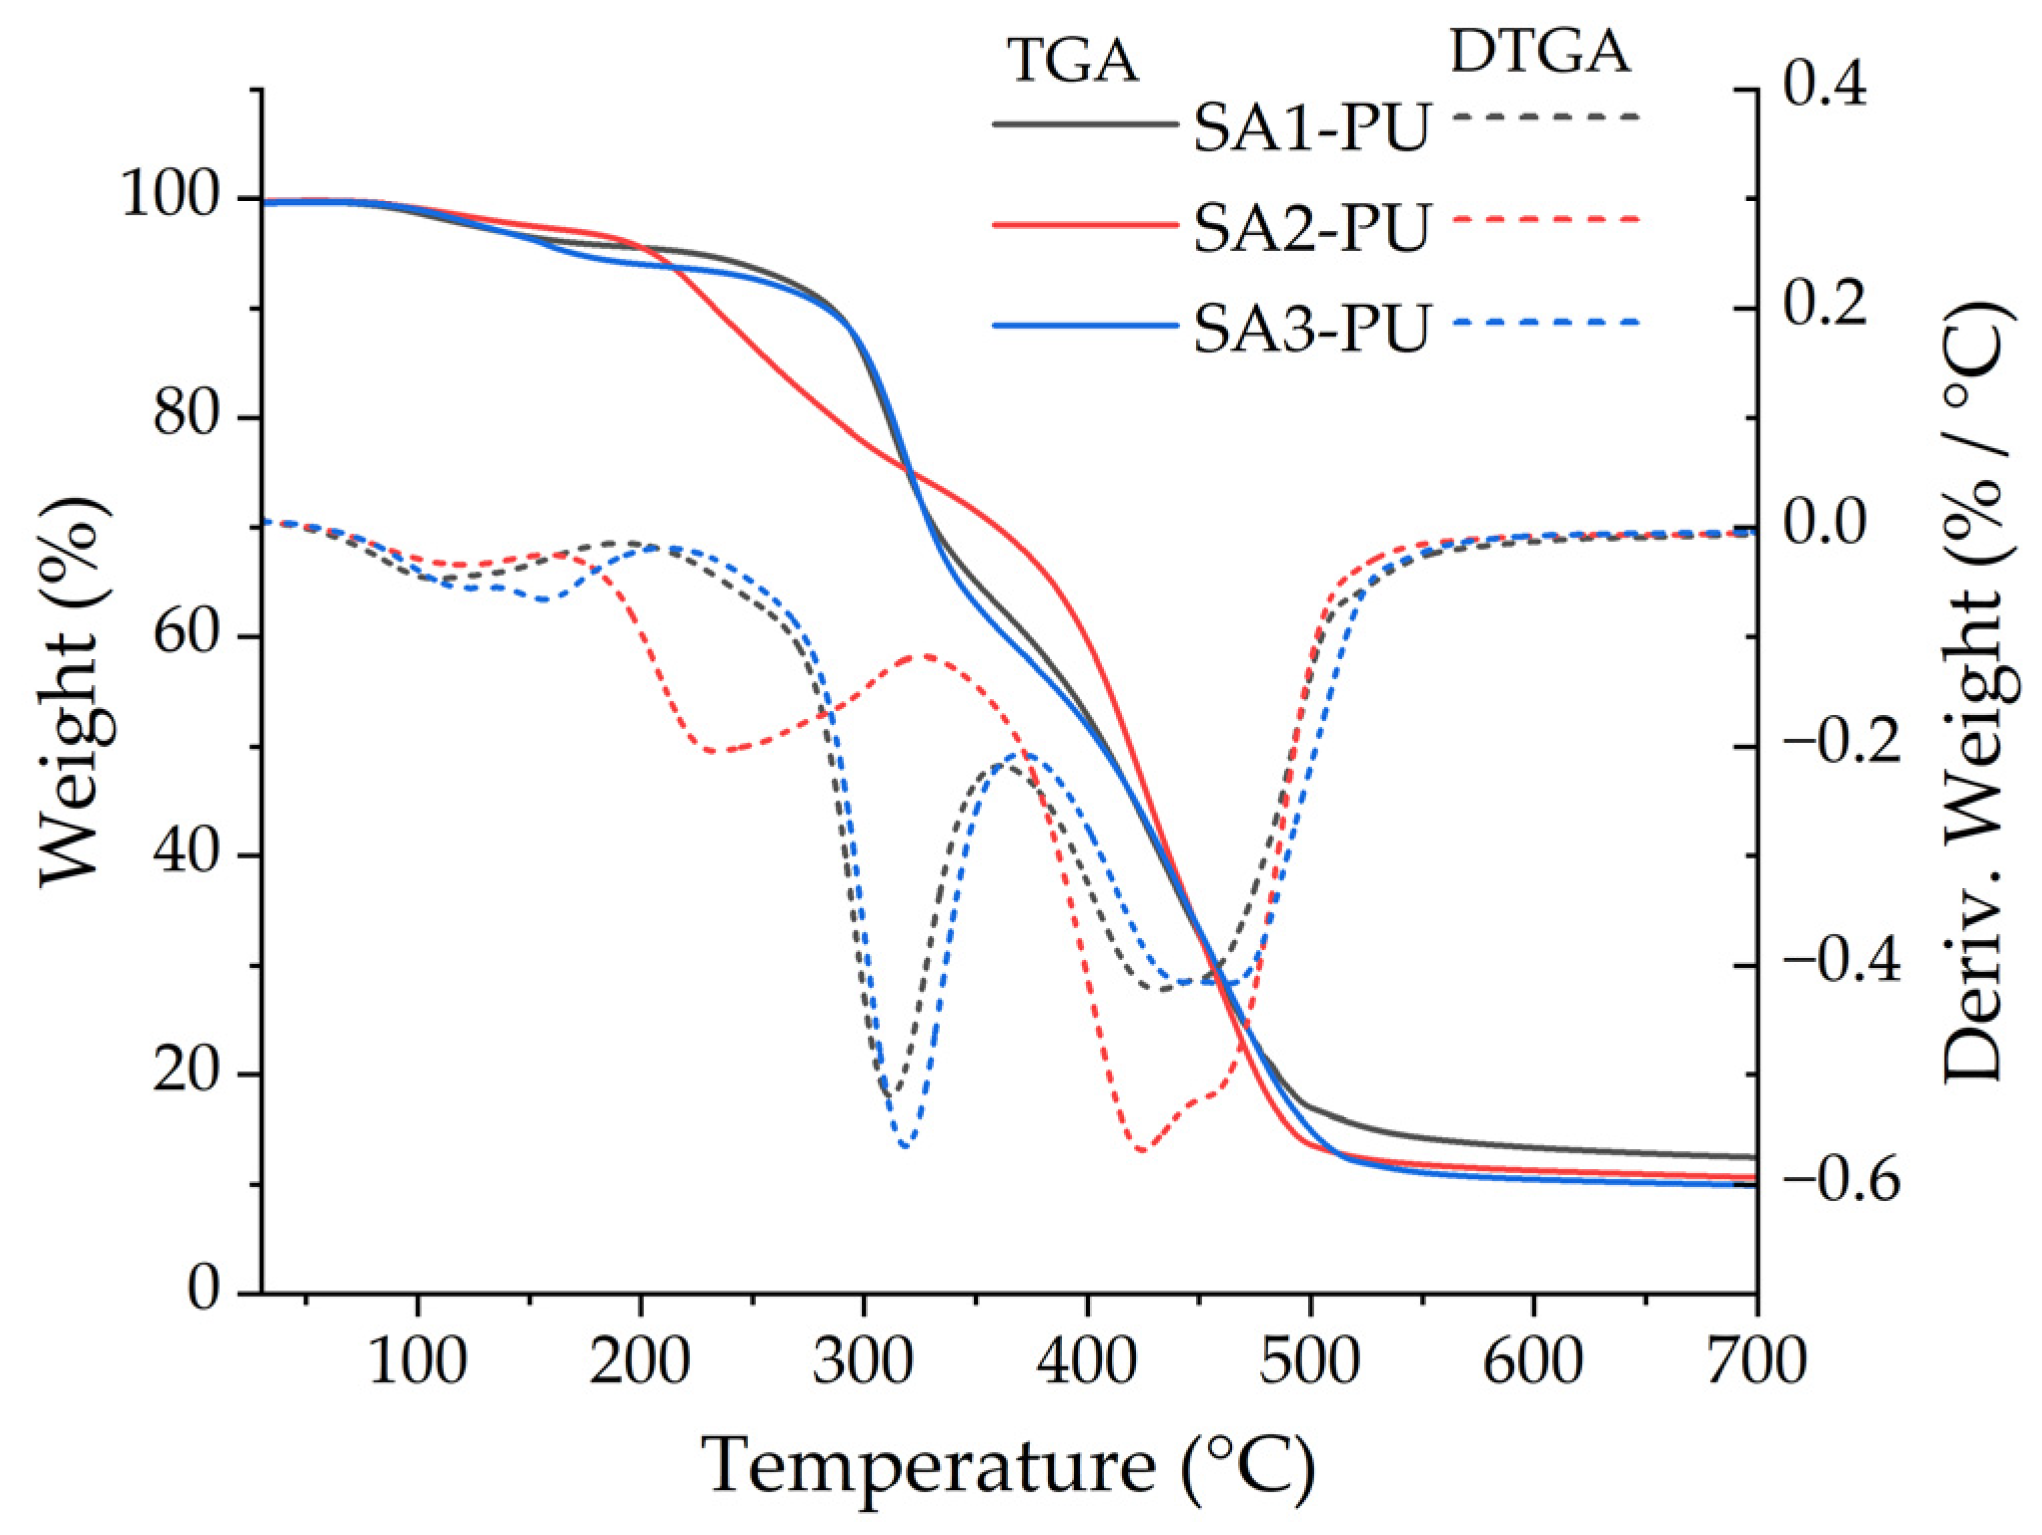
To assess the potential effect of polyphenolic compounds present in SA-based polyols on the flammability and thermal stability of rigid PU foams, a series of tests were conducted, including TGA, small-flame ignition tests, LOI, and cone calorimetry. TGA and its derivative DTGA were used to evaluate the thermal stability of the PU foam samples (see
Figure 11 and
Table 8).
All three samples exhibit a multi-step thermal degradation typical of PUs. The initial weight loss between 80 °C and 200 °C is attributed to the removal of adsorbed moisture, residual low-molecular-weight volatiles, and small amounts of unreacted monomeric species (e.g., foaming agent), as commonly observed in PU systems [
46]. SA3-PU exhibits a higher mass loss in the first degradation stage, reaching 5% weight loss at an earlier temperature than other PU samples. The second major mass-loss event occurs between 200 and 400 °C for SA1-PU and SA3-PU, displaying prominent DTGA peaks, corresponding to cleavage of the more labile ester side-chains from the TOFA component and initial dissociation of urethane bonds (allophanate, biuret, and urethane linkages) [
46,
47,
48]. Peak maxima in this region were observed at ~320 °C for SA1-PU and ~340 °C for SA3-PU, indicating relatively high thermal stability. In contrast, SA2-PU exhibits significantly lower thermal stability in this region. SA2-PU showed an earlier onset of the second degradation stage (~120 °C), with a DTGA peak at lower temperature (~235 °C).
The third degradation stage, associated with decomposition of char residue and remaining polymeric fragments (e.g., flexible polyol segments), occurs above 400 °C [
49,
50].
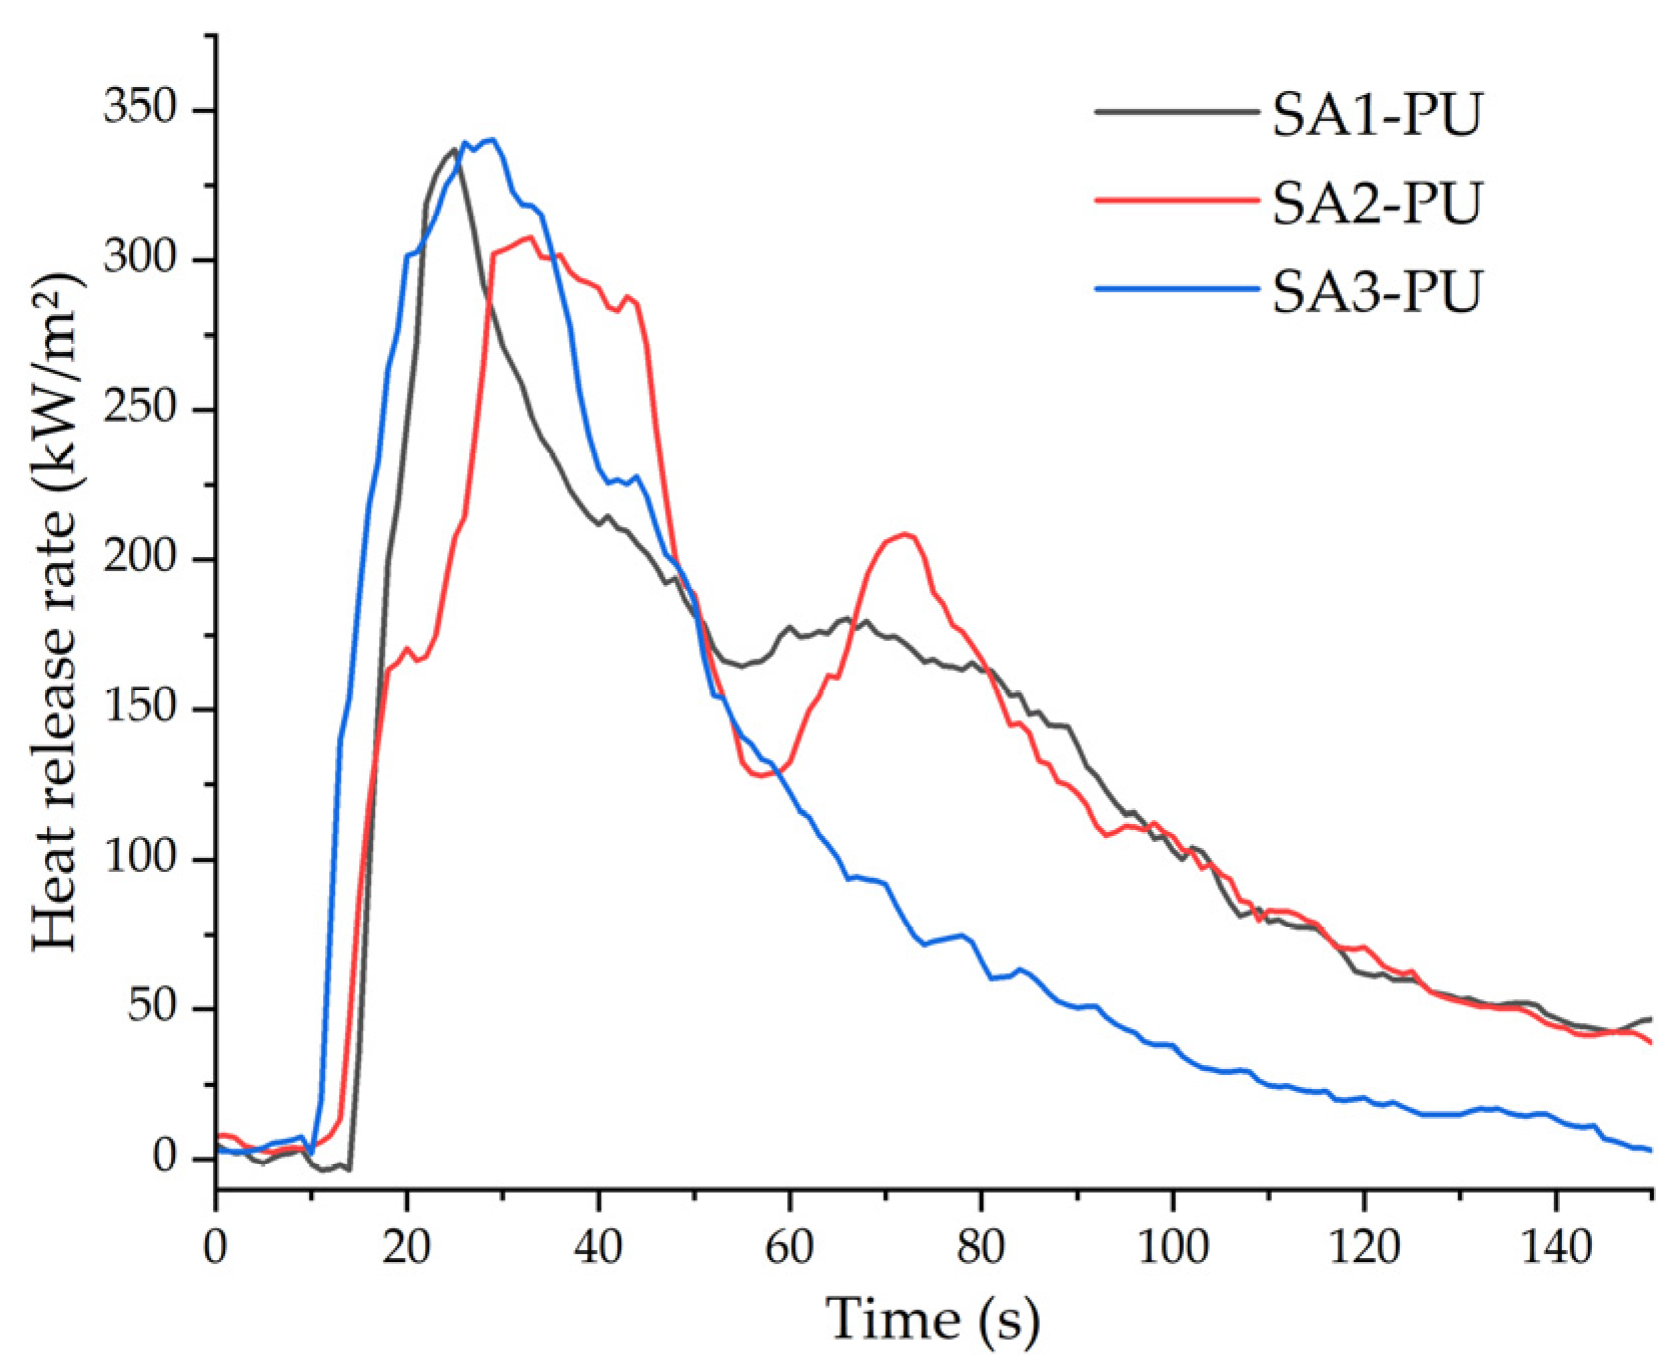
The flammability of the SA-based rigid PU samples was evaluated using the small-flame test (flame height up to 150 mm and afterflame time), the LOI test, and the cone calorimeter test, including TTI, TTF, THR, pHRR, TSR, and MARHE. The corresponding results are summarized in
Table 9 and
Table 10 and
Figure 12.
In the small-flame test, all samples reached a flame height of 150 mm, placing them in the same reaction-to-flame class (F). As a result, this test provided limited ability to distinguish between the materials. Among the samples, the SA2–PU sample showed the longest afterflame time (194 s), indicating a greater tendency for sustained burning after ignition compared to SA1–PU (103 s) and SA3–PU (100 s).
The LOI values of the samples were similar, ranging from 19.1 to 20.1. This places all SA-based rigid PU foams in the flammable category, as materials with an LOI value below 21% are considered flammable, those with between 21% and 2% are combustible, and those above 28% are flame-retardant [
51]. These results are consistent with typical LOI values reported for unmodified rigid PU foams without flame retardants, which generally fall within 16–20% [
52,
53].
In the cone calorimeter test, the pHRR were similar across all samples. SA1–PU and SA2–PU showed somewhat higher THR and TSR values, likely due to warping of the specimens during burning, which increased the effective surface area exposed to the heat flux. This deformation is visible as a secondary peak in the HRR curves; therefore, pHRR provides a more reliable measure for comparison. Based on pHRR, the flammability behaviour of the foams did not depend on the specific suberin extraction method used prior to polyol synthesis, as all samples exhibited values between 323 and 347 kW/m2, which lies within experimental variability. The TSR and MARHE values were similarly comparable, ranging from 579 to 727 m2/m2 and 175 to 211 kW/m2, respectively.
Overall, no statistically significant differences in flammability were observed among the tested samples, indicating that variations in suberin depolymerization conditions, including changes in polyphenolic content and the removal of higher-molecular-weight fractions during FeCl3 treatment, do not play a dominant role in governing fire performance under the studied conditions. These findings suggest that the concentration and chemical nature of polyphenolic compounds present in the investigated SA fractions are insufficient to induce measurable flame-retardant effects in rigid PU foams. This may be attributed to the relatively low absolute content of polyphenolic structures in the investigated SA fractions and their limited ability to alter the dominant thermal degradation pathway of the PU matrix. Consequently, the combustion behaviour of the foams is primarily governed by the PU network itself, masking any minor contribution arising from differences in polyphenolic content. Additional flame-retardant strategies or higher aromatic/phenolic loadings would therefore be required to achieve meaningful improvements in fire resistance in SA-based PU systems.




 ,
,