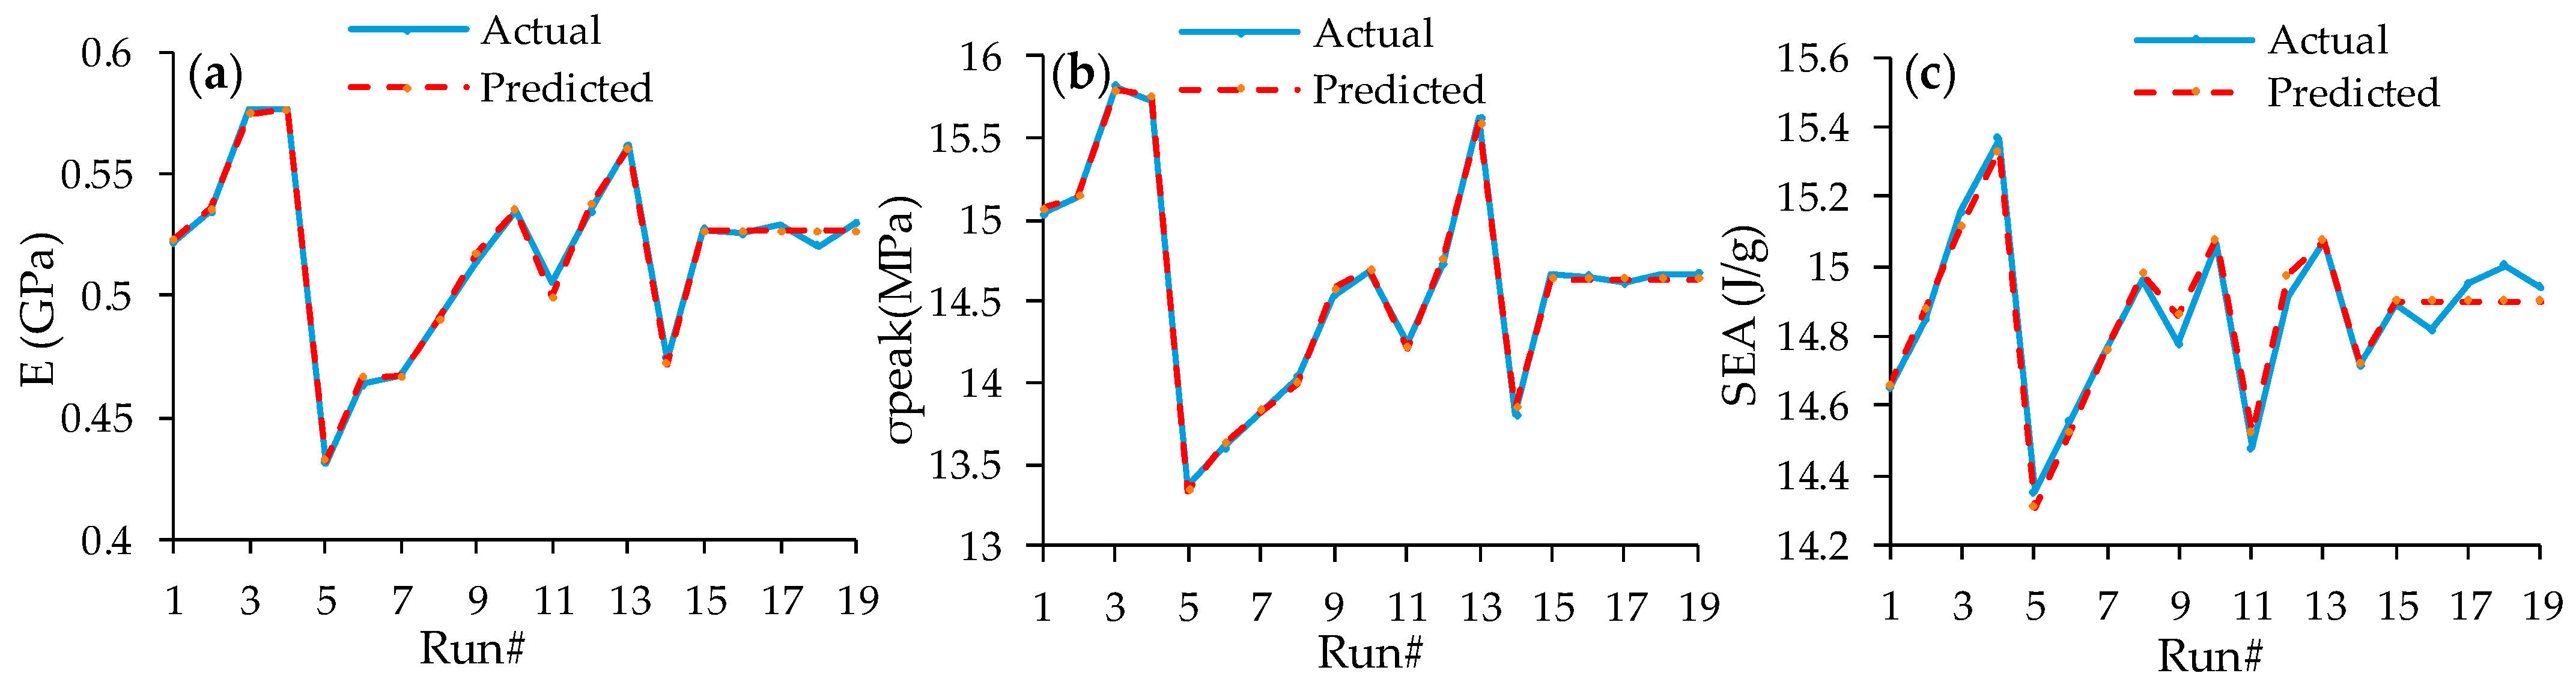
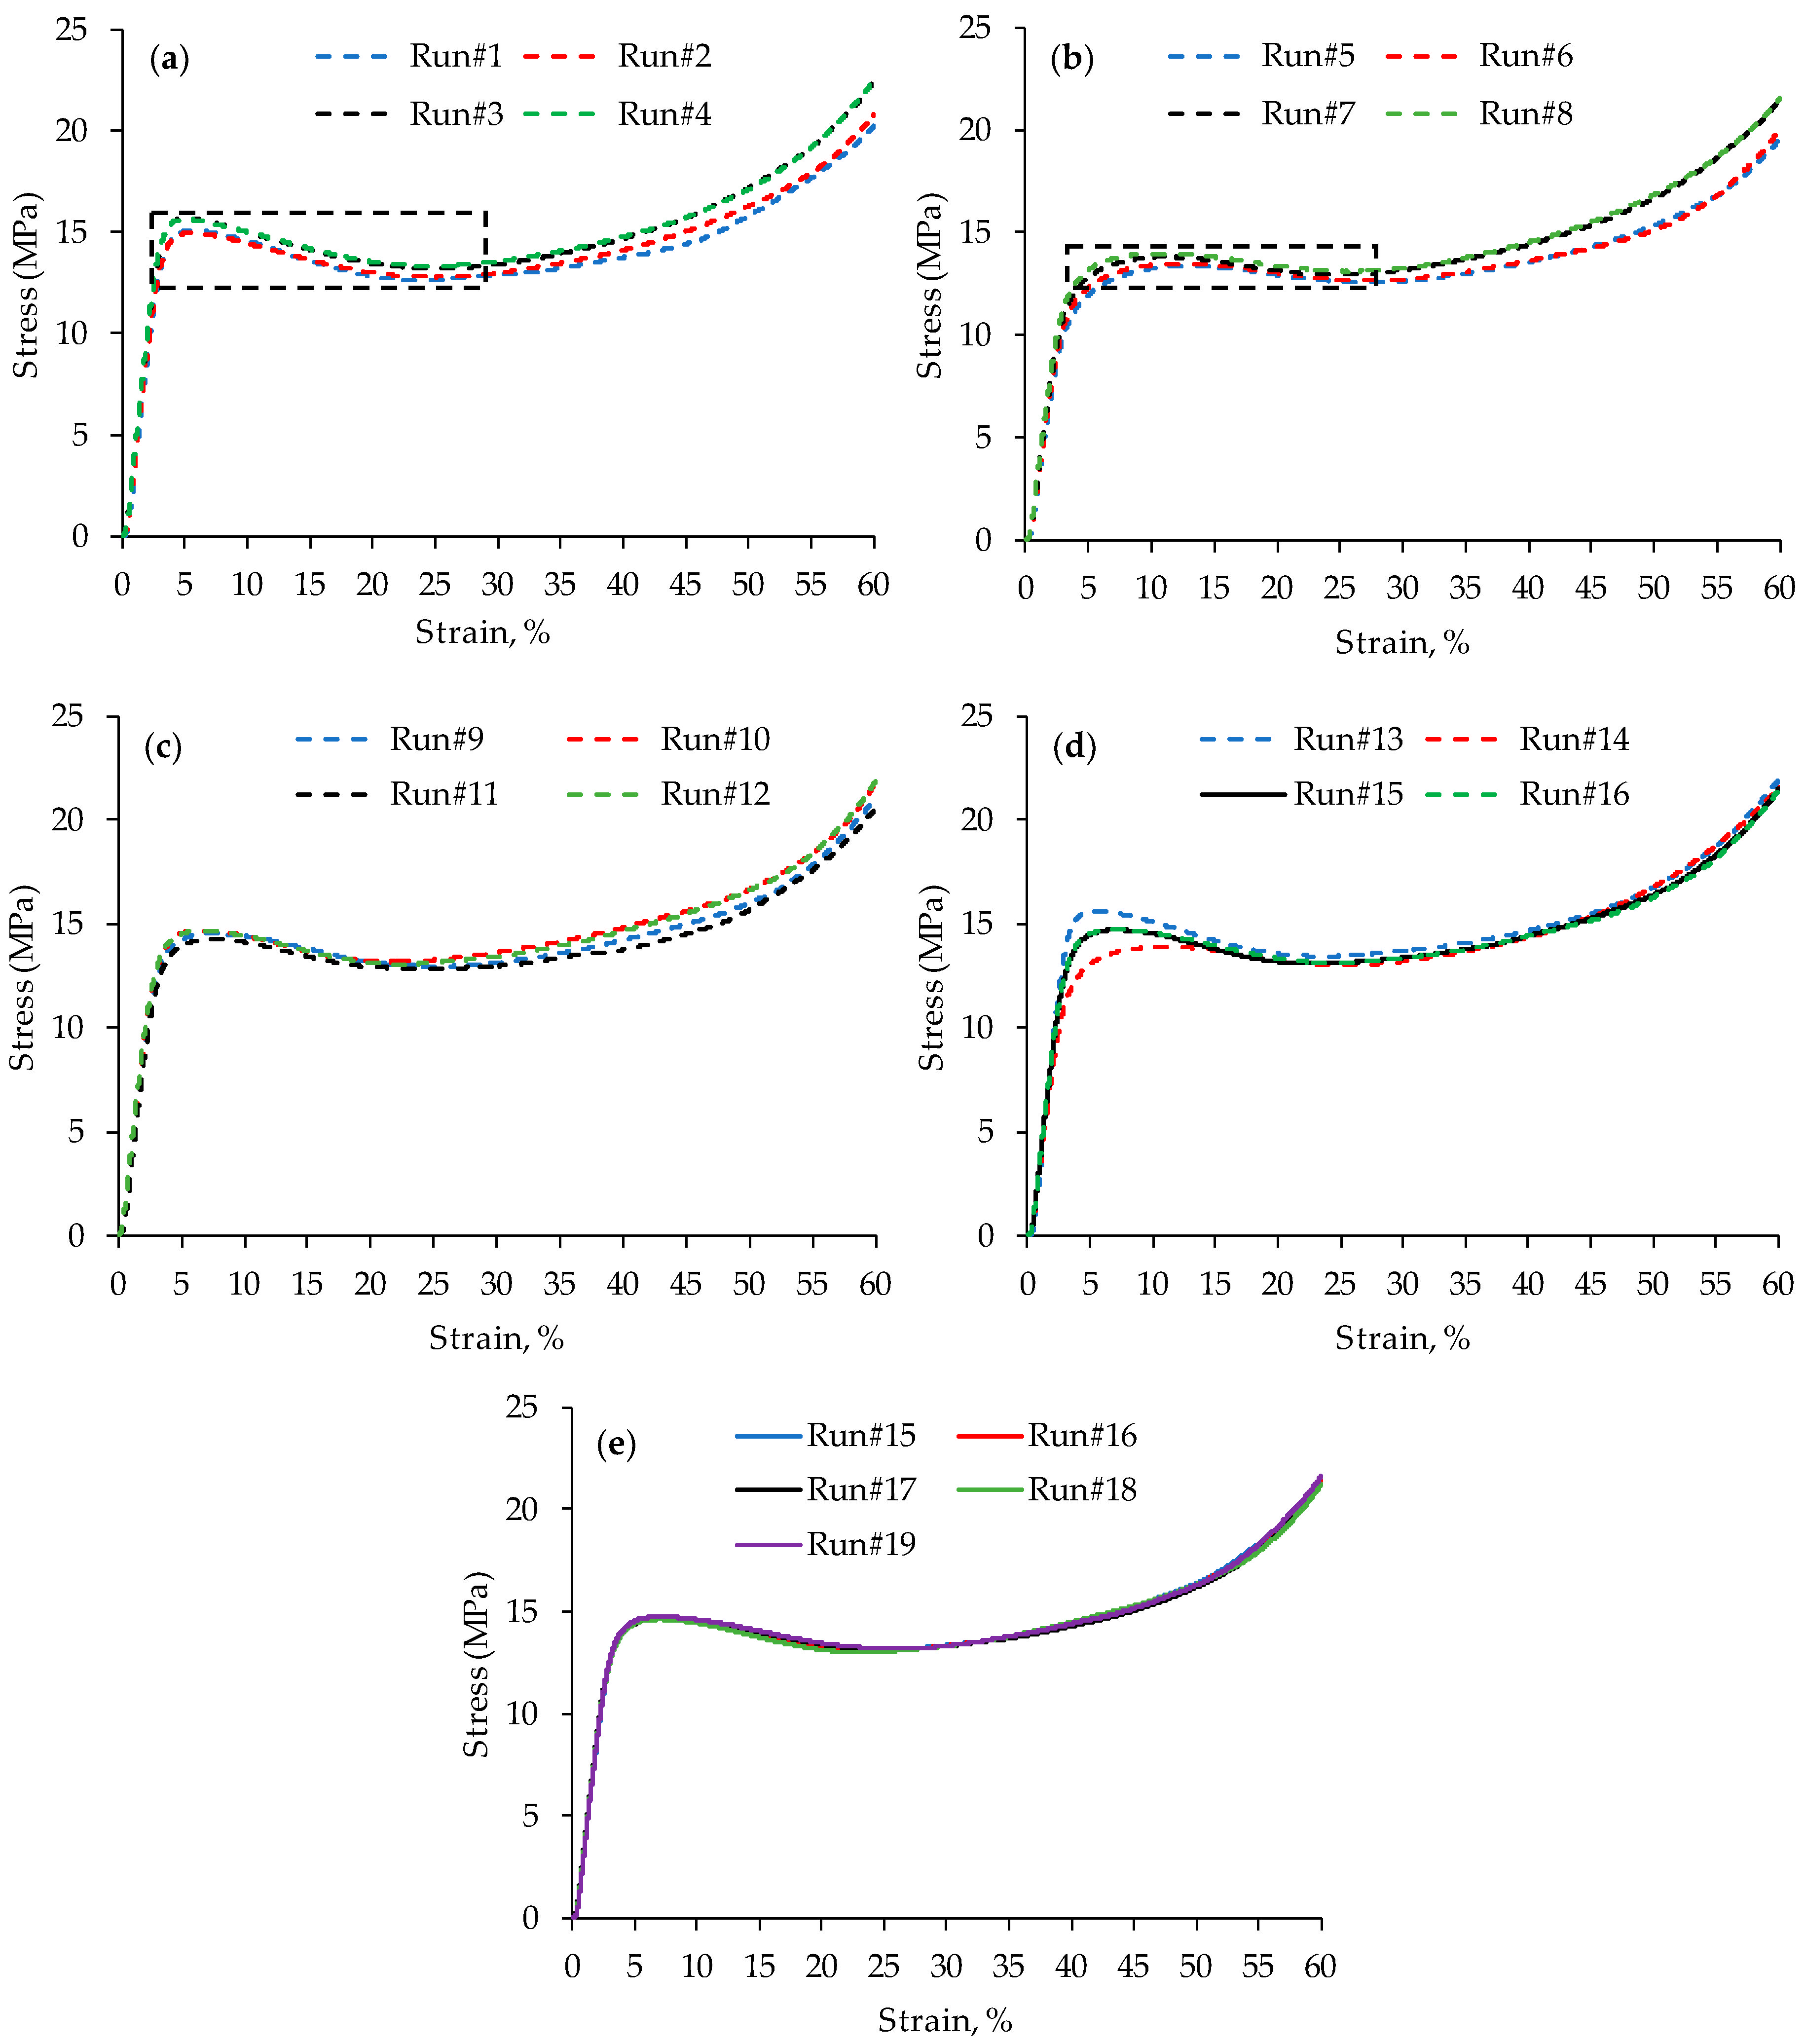
From the results presented in
Table 4, lattice structures printed at a high ET and low LT (run#3 and run#4) showed the best mechanical properties, including E, σ
peak, and SEA. For instance, the maximum compressive modulus (0.577 GPa) and σ
peak (15.816 MPa) were observed at 30 mm/s PS, 235 °C ET, and 0.2 mm LT (run#3). Similar findings were observed in (run#4), where the SEA was the maximum (15.366 J/g). On the other hand, the worst mechanical responses were obtained at a low ET, low PS, and high LT (run#5). For example, the minimum E (0.432 GPa), σ
peak (13.373 MPa), and SEA (14.351 J/g) were obtained at a low ET, low PS, and high LT (run#5).
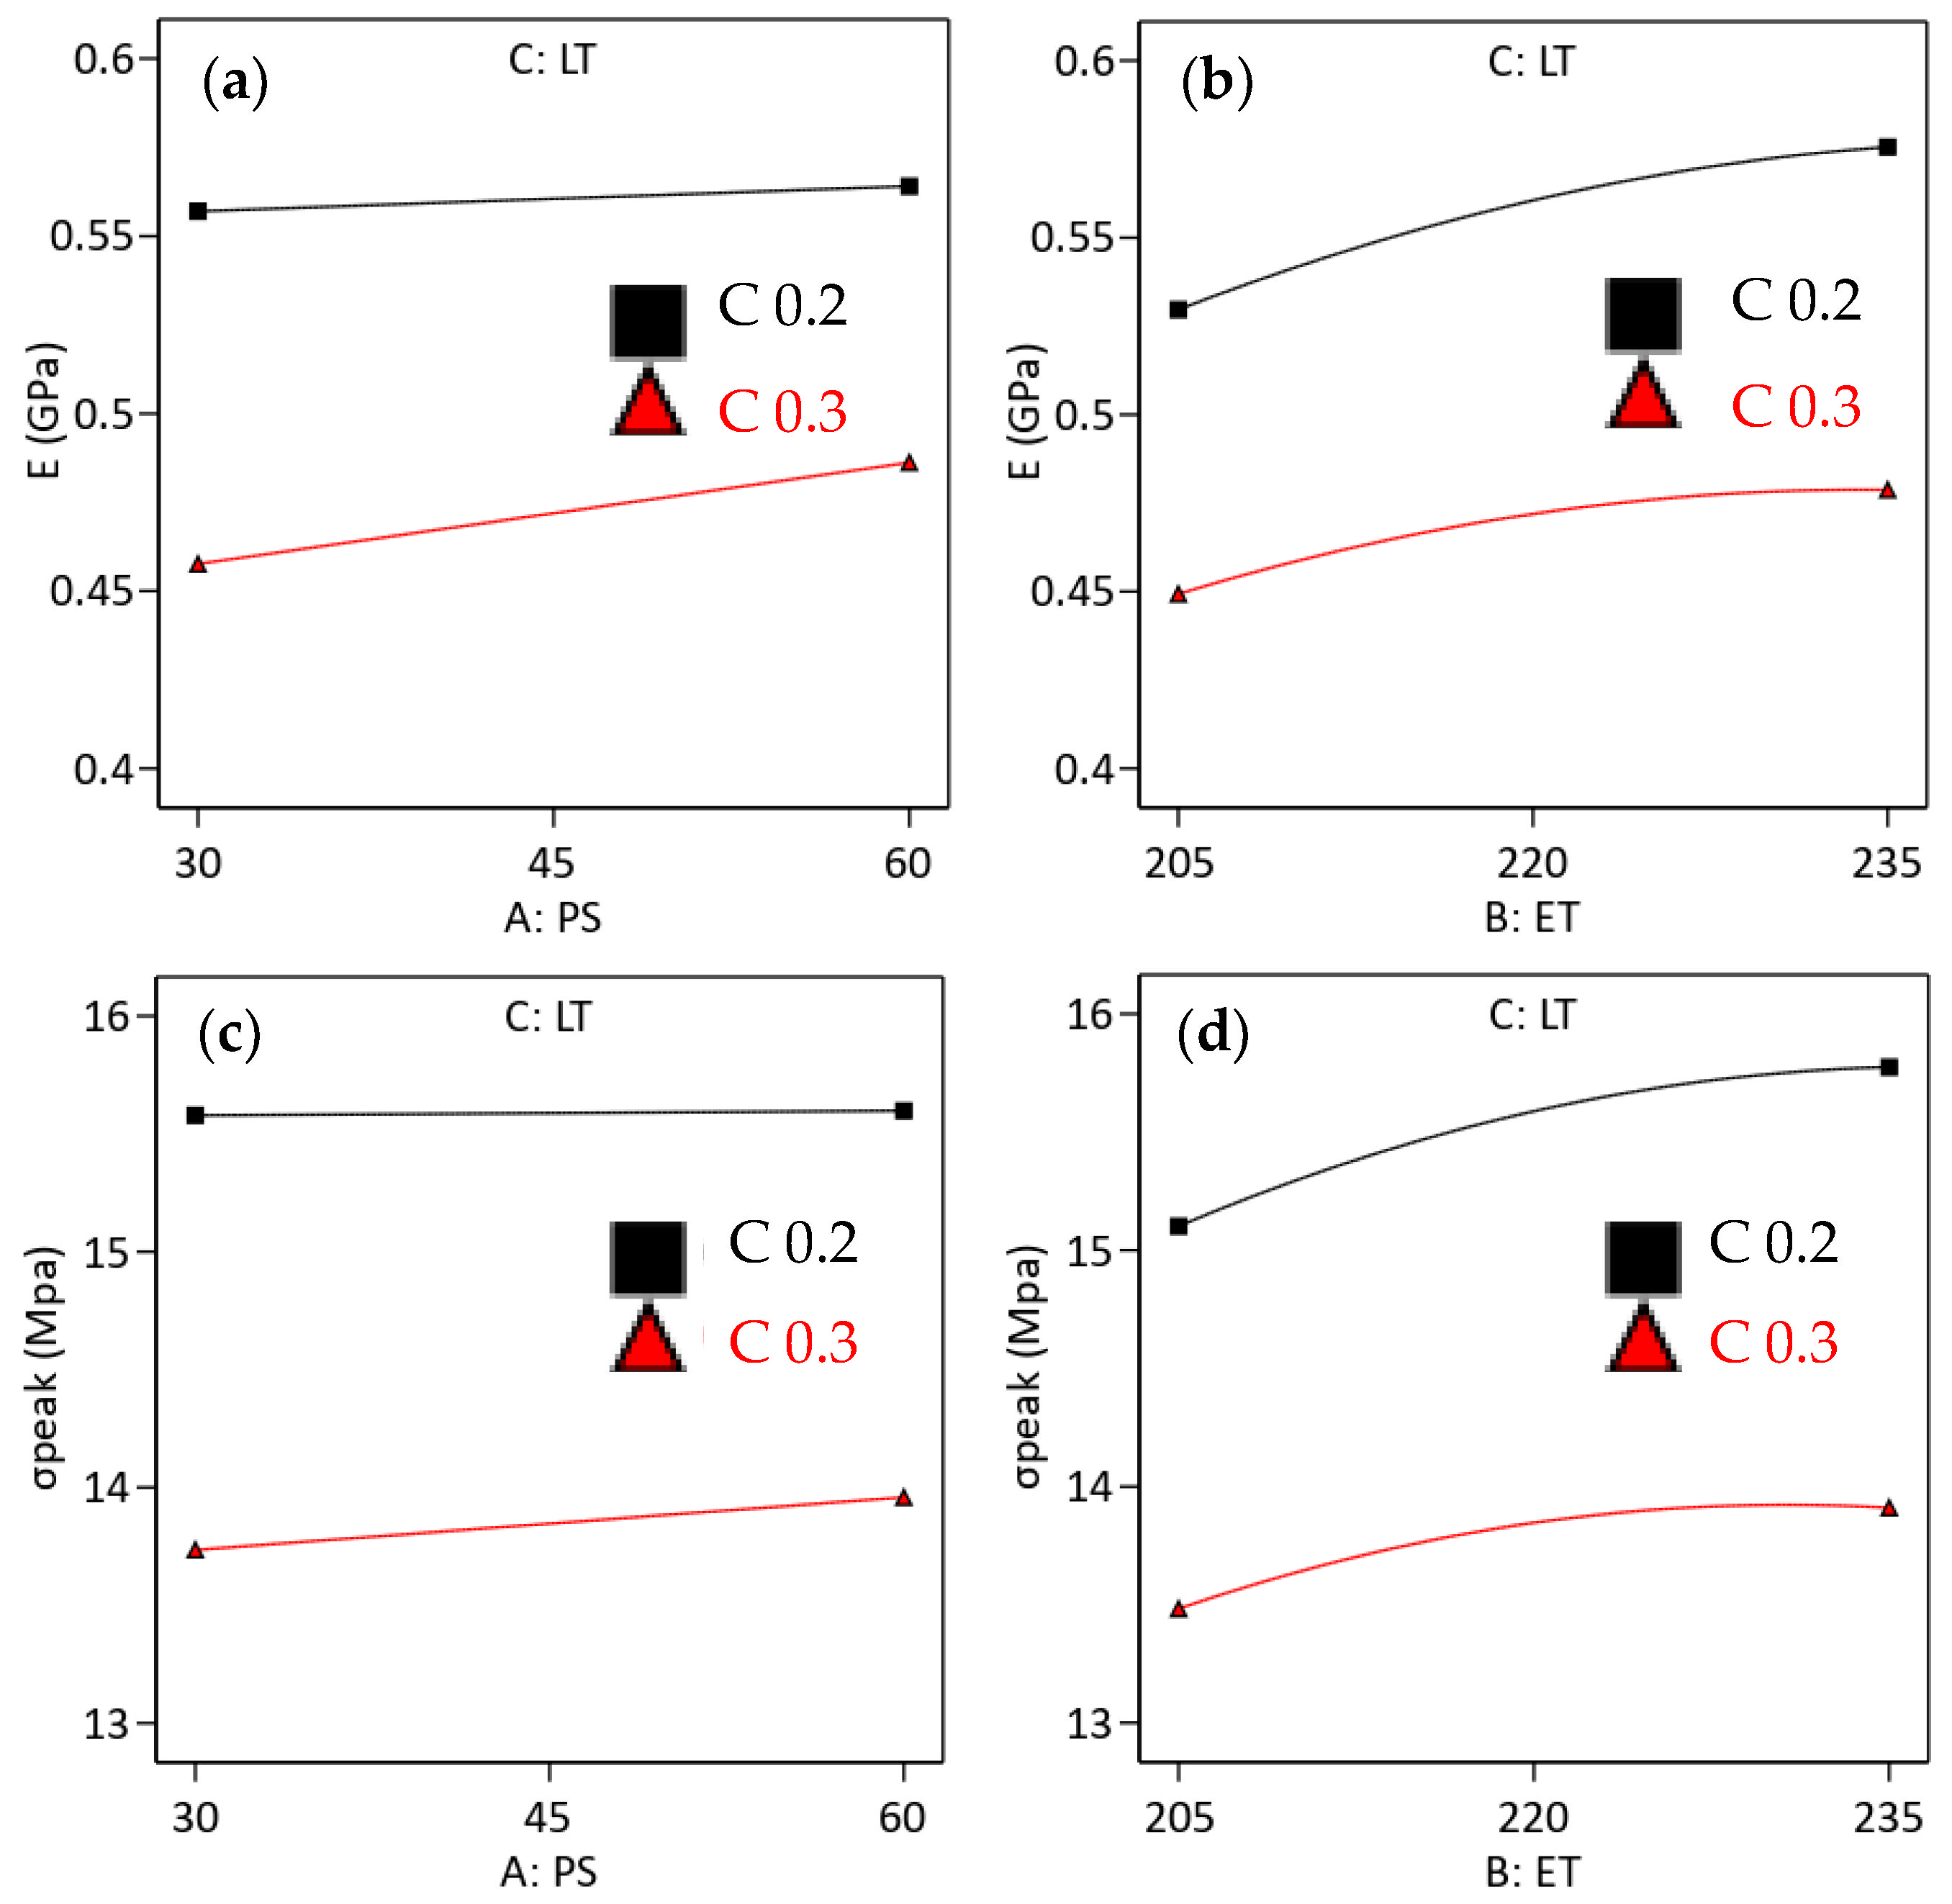
The effect of ET on E, σ
peak, and SEA was proportional, with an increase in ET from 205 °C to 235 °C enhancing the mechanical performance of the D-TPMS structures. These results are consistent with those reported in [
28], where increasing ET from 195 °C to 210 °C improved the compressive modulus and strength of PLA-based structures. However, the findings reported in [
27] showed the opposite trend, with the yield strength and plateau stress of FDM-printed PLA-based circular structures decreasing as the printing temperature increased from 200 °C to 240 °C. At low ET (i.e., 205 °C), the composite has high viscosity (low melt flow rate), making it difficult to extrude, as also highlighted by [
36]. On the other hand, a higher ET facilitates the flow, which in turn enables the gaps/voids between the adjacent rasters to be filled and reduces the likelihood of clogging. Furthermore, the voids and gaps commonly observed in FDM-printed composite materials can be fully or partially filled due to the overflow of molten material at elevated temperatures. Consequently, the mechanical properties are enhanced due to the filling of the micro-gaps and voids and improve the bonding between intralayers and interlayers. Furthermore, this will improve the SEA by reducing the initiation and propagation of failures, i.e., those caused by voids and insufficient bonding, during the plastic deformation phase, i.e., the region in the stress–strain curve that accounts for the majority of the SEA. This behavior is illustrated in
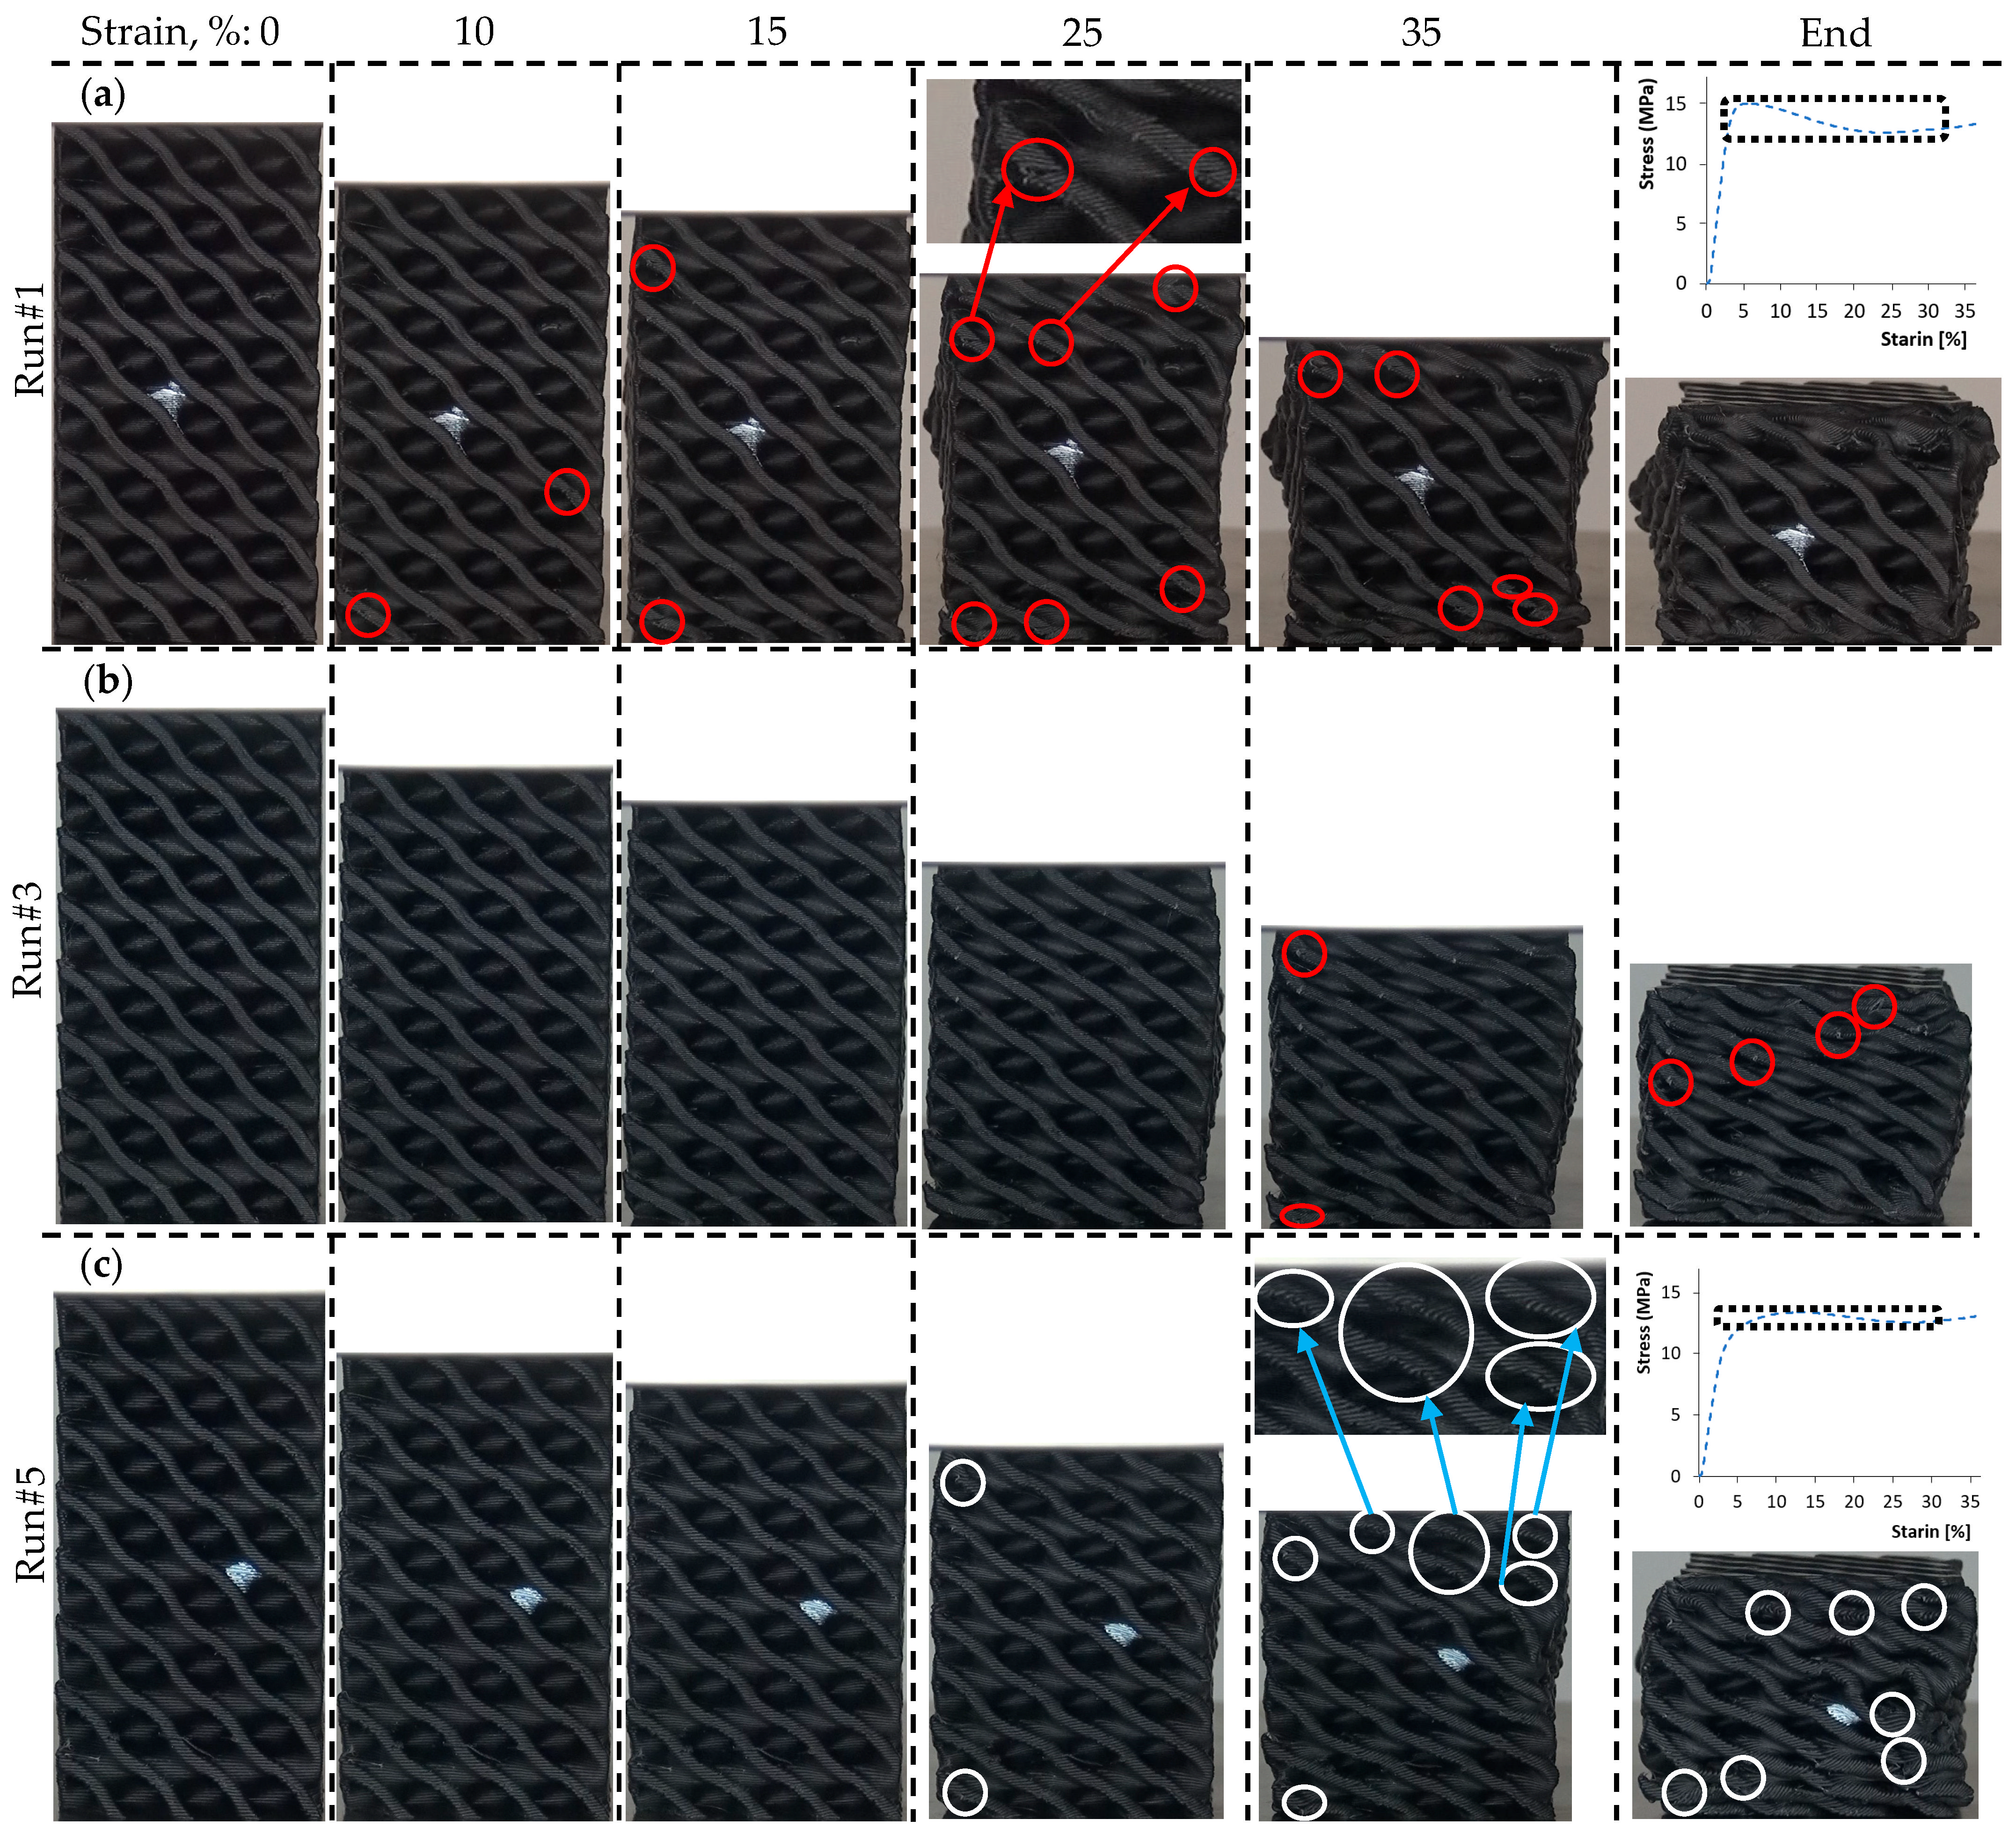
Figure 8, where structures fabricated at a lower extrusion temperature exhibit earlier crack initiation and fracture at approximately 5% strain (
Figure 8a), whereas specimens fabricated at a higher extrusion temperature maintain structural integrity until approximately 35% strain (
Figure 8b). Because SEA depends on the material’s ability to sustain deformation and absorb energy over a large strain range (up to 55% strain in the present study), the enhanced bonding associated with higher extrusion temperatures has a more pronounced effect on SEA than on E or σ
peak. This explains why extrusion temperature exhibits the highest contribution to SEA, whereas layer thickness is more influential for E and σ
peak. For instance, ET accounted for 55.76% (48.92% from ET and 6.84% from ET
2) of the variability in SEA, whereas LT accounted for 28.89%.
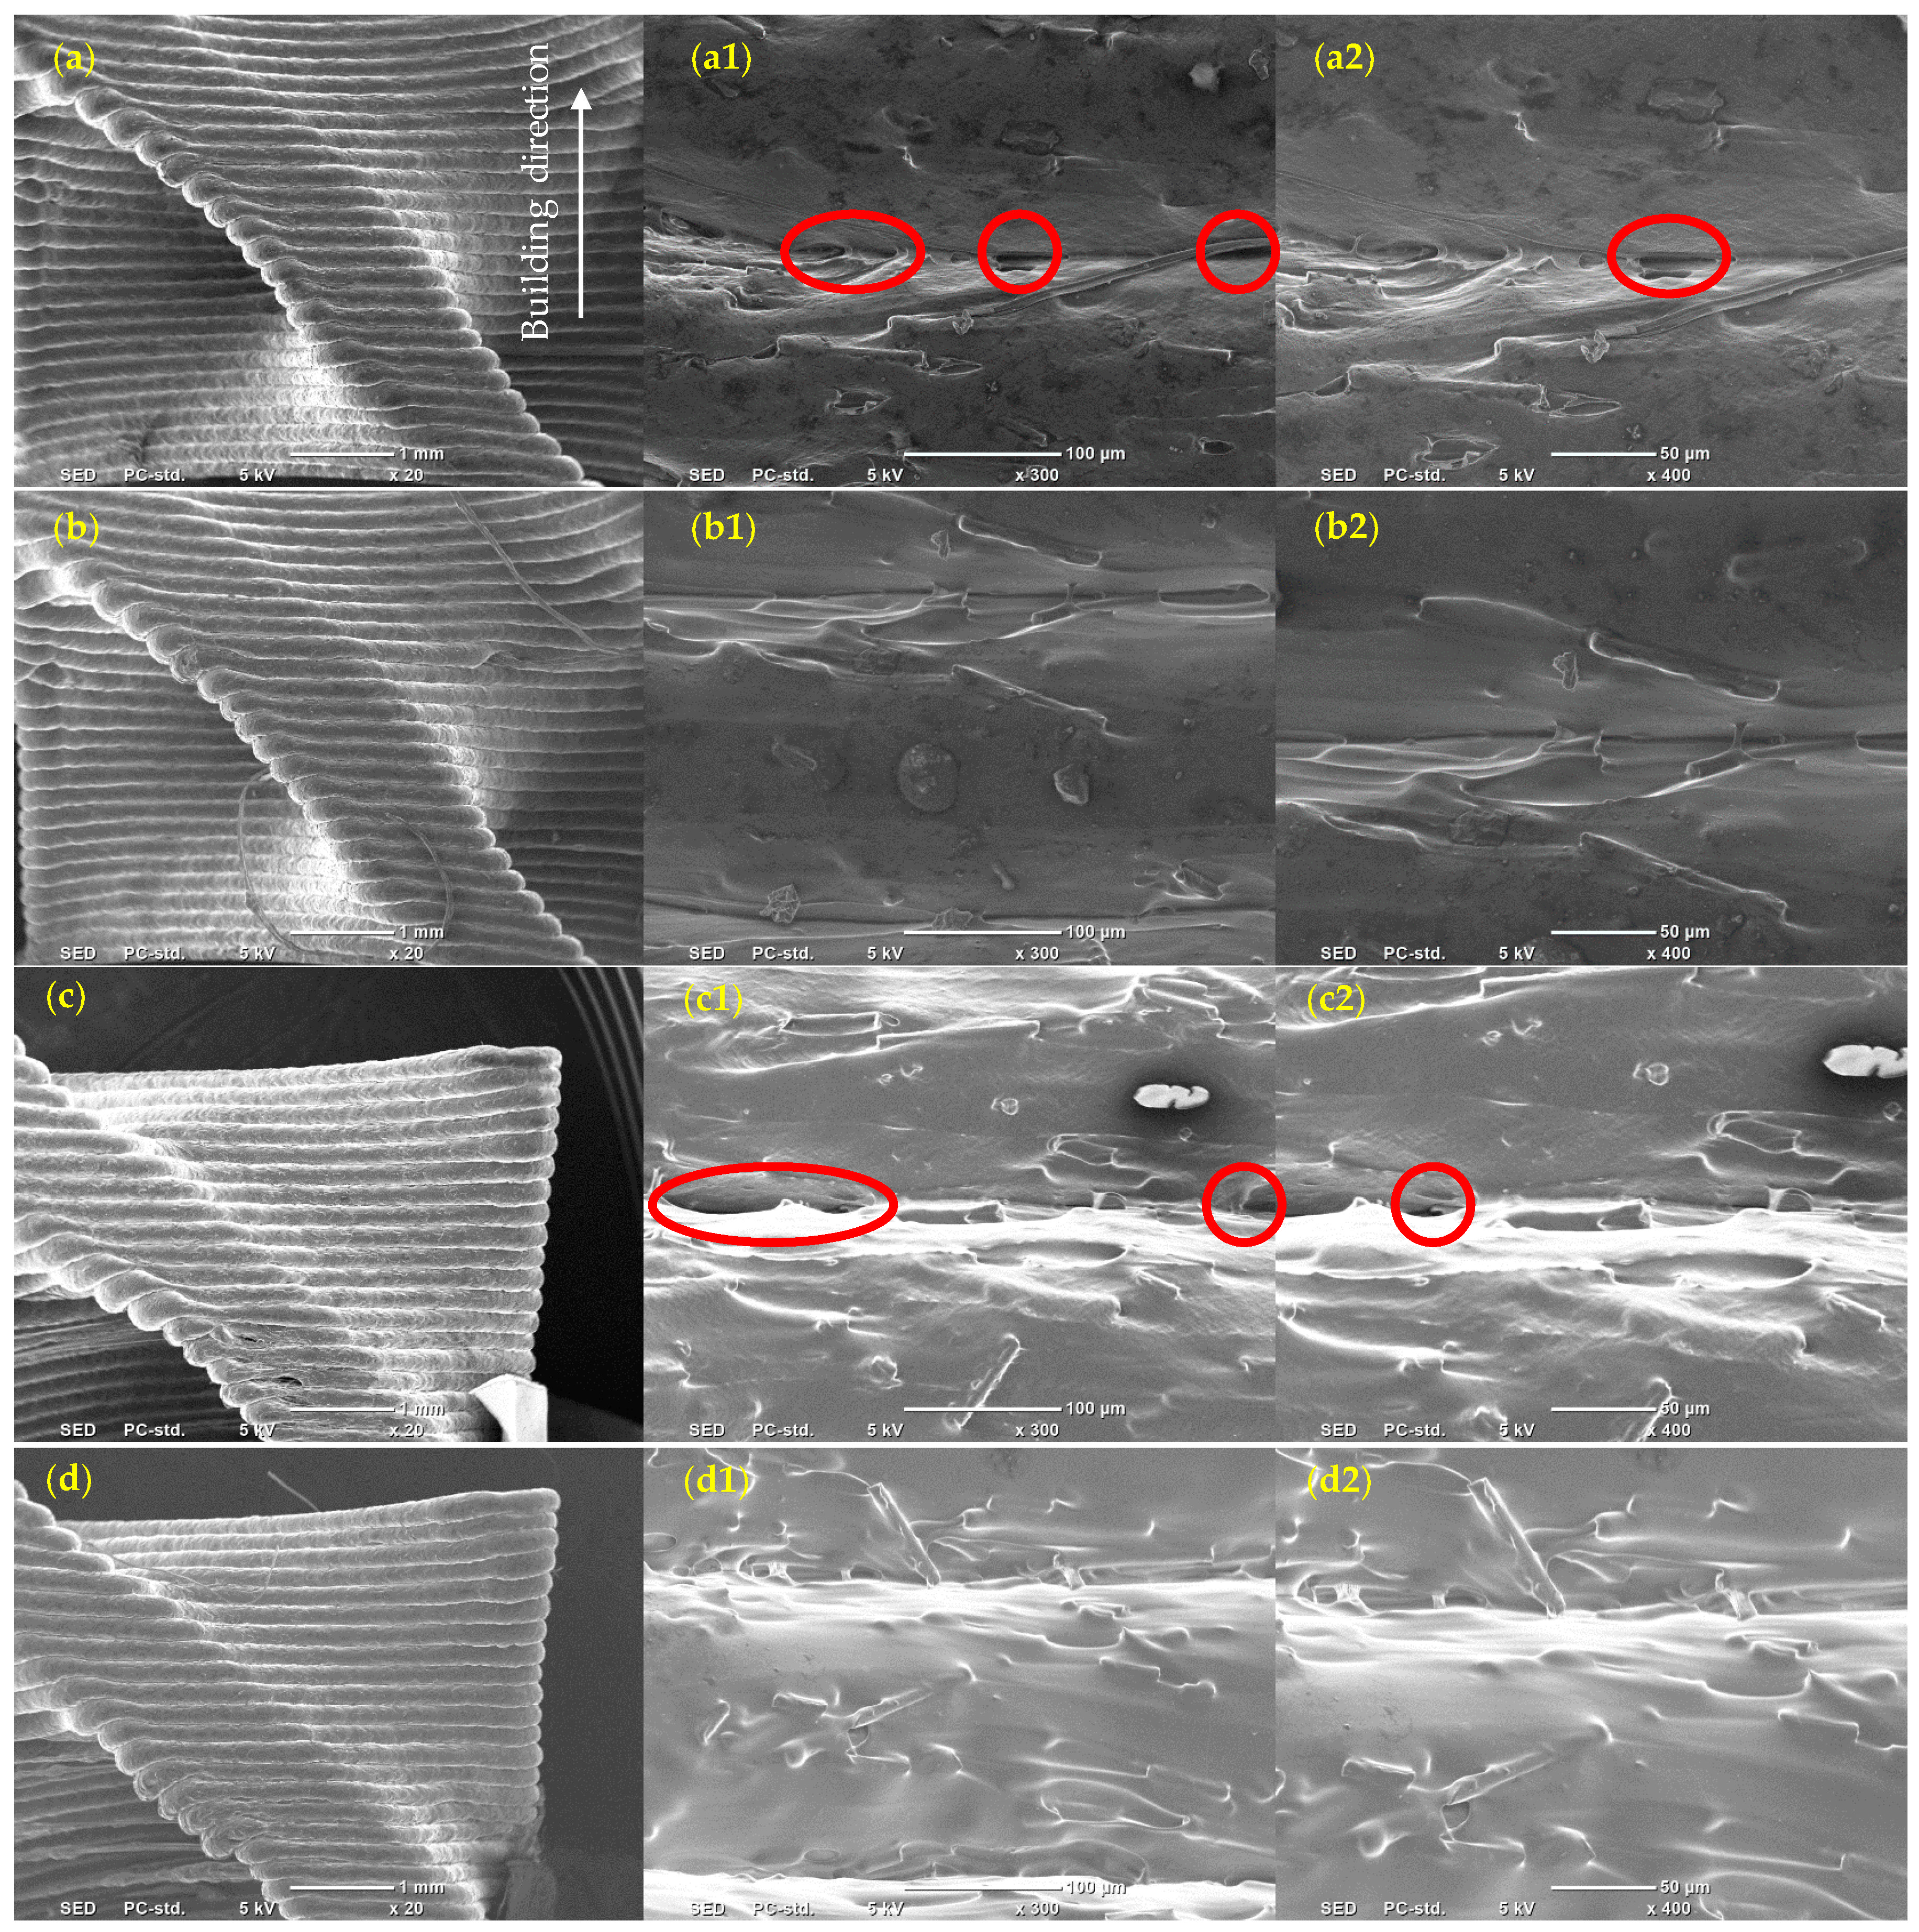
Figure 13 compares the interlayer morphologies of structures printed at a low ET (Run#1;
Figure 13a,c) and high ET (Run#3;
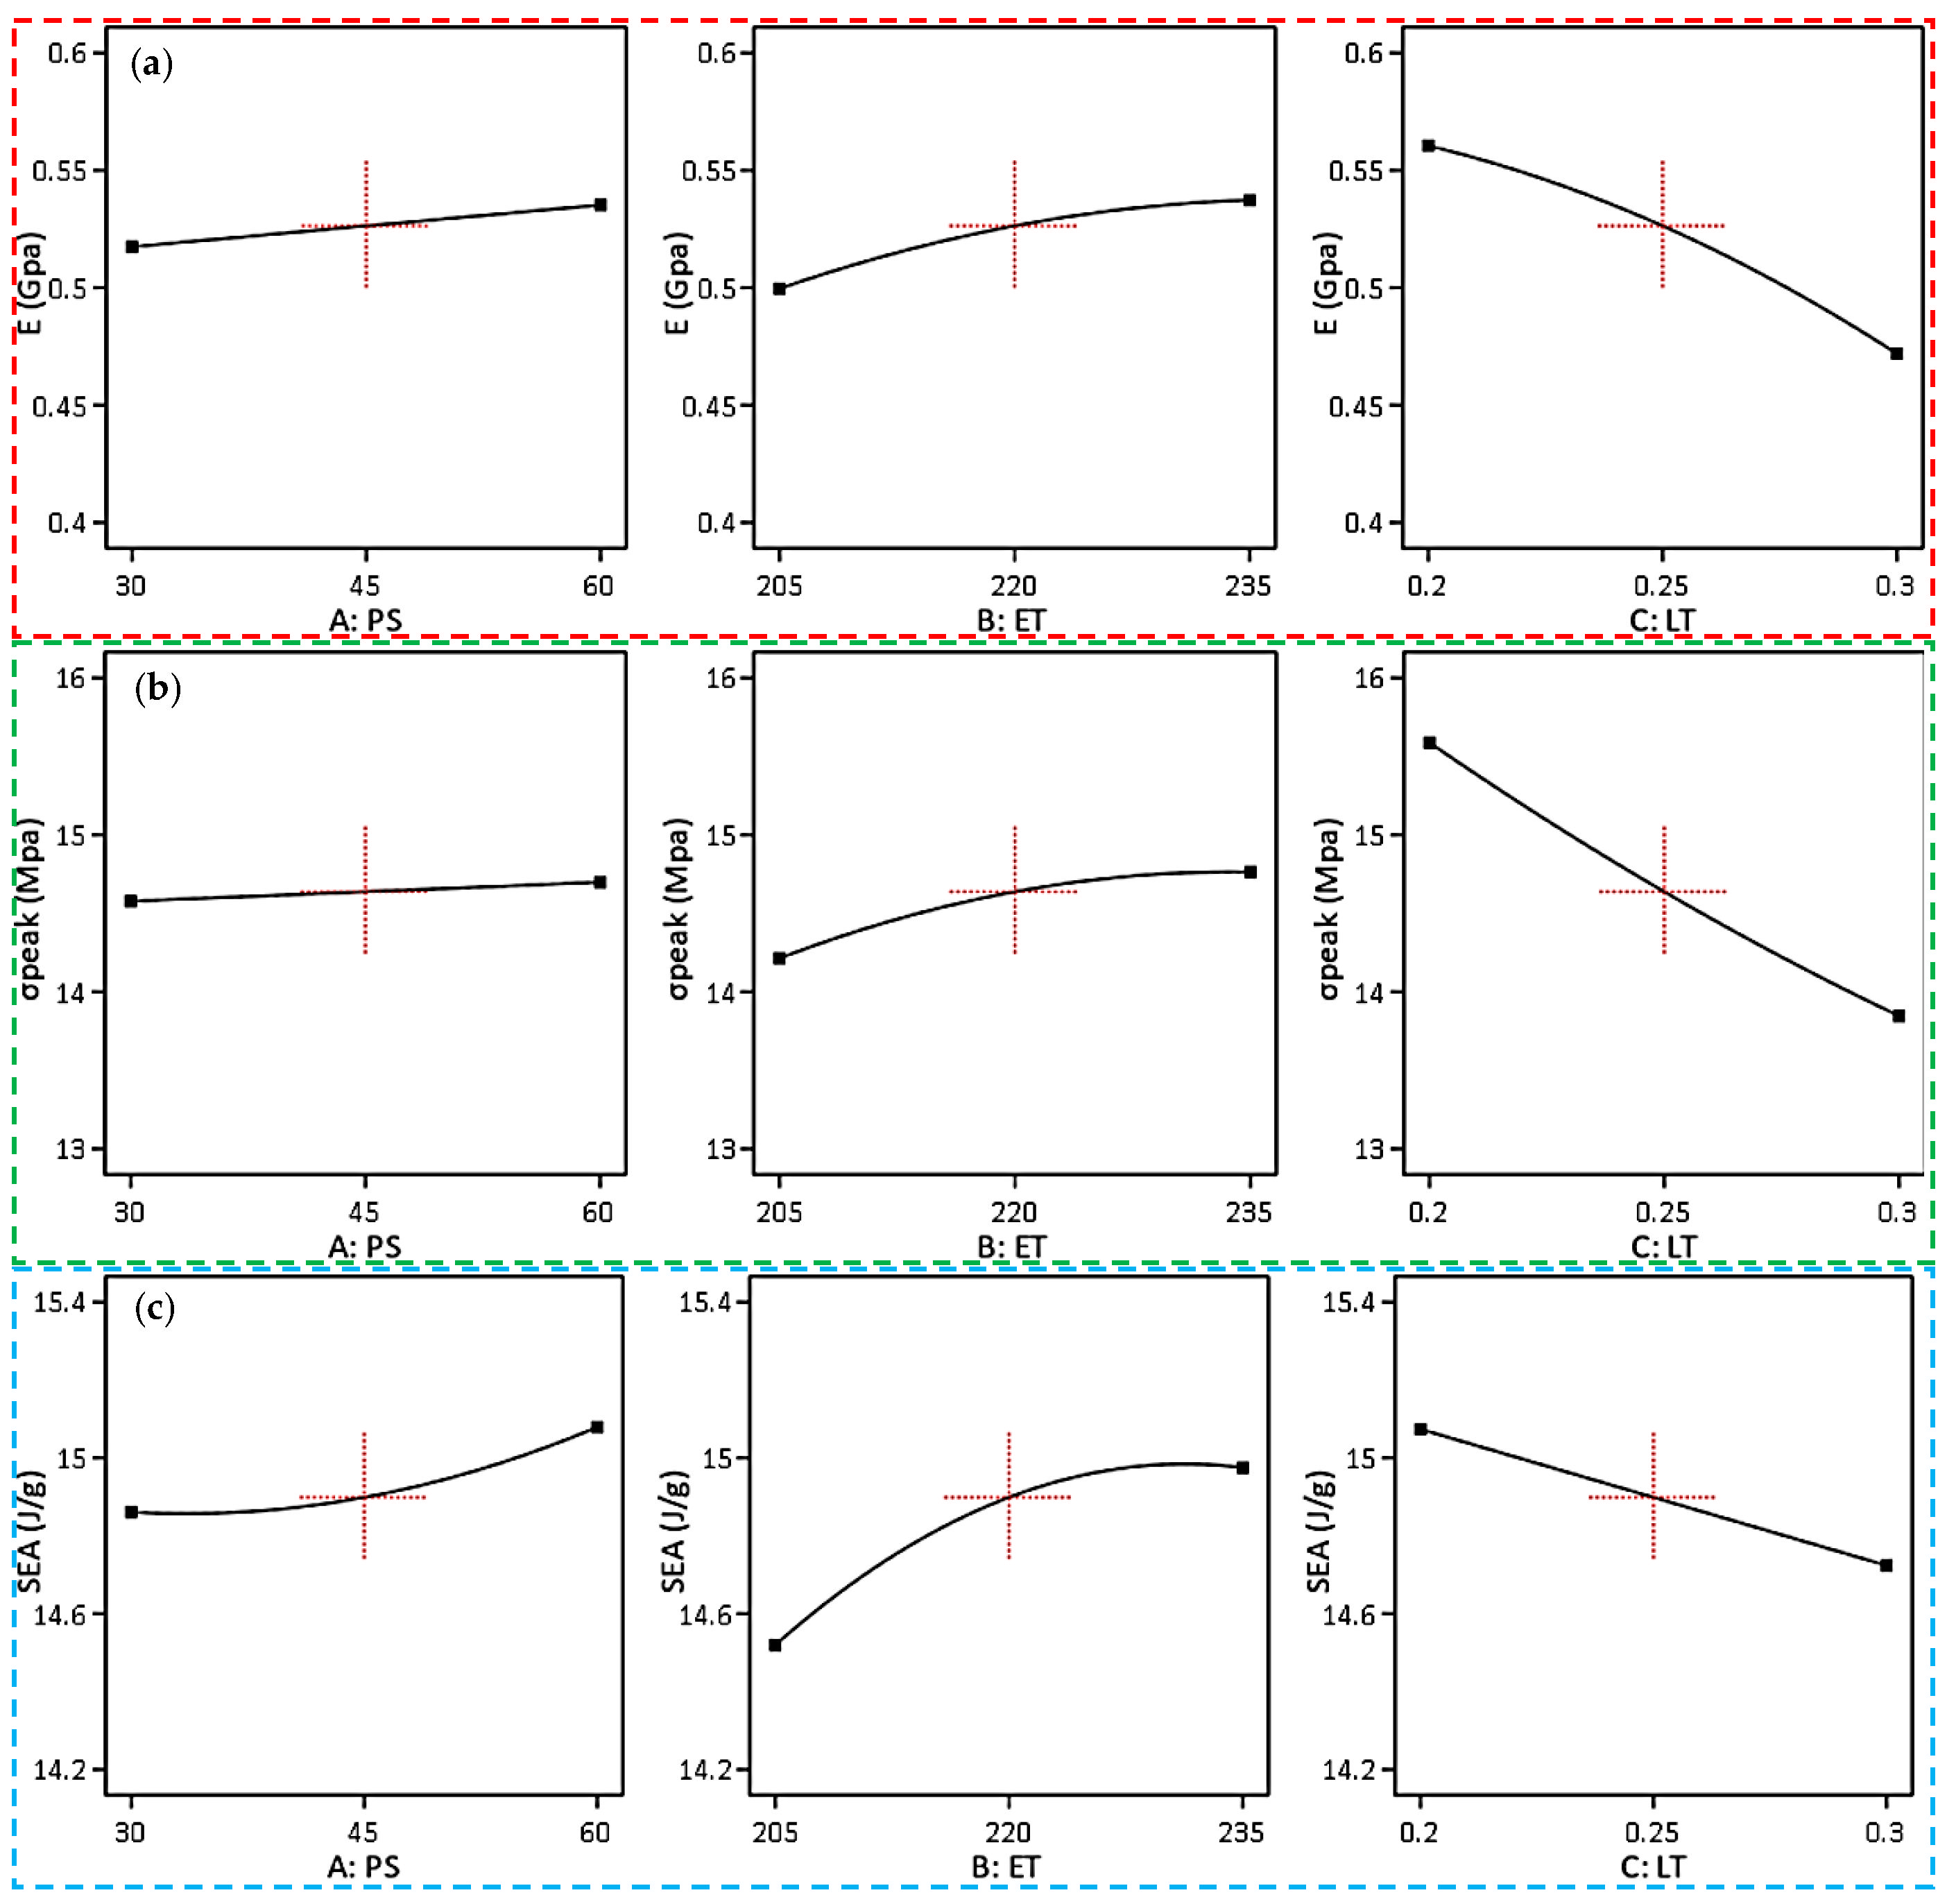
Figure 13b,d), considering different locations. A dominant presence of deep voids and gaps is observed at the low ET (205 °C) compared with the high ET (235 °C), as highlighted by the circles. It should be highlighted that a further increase in the ET may degrade the mechanical behavior, as evidenced from the main effect plots in
Figure 10, particularly the peak strength (
Figure 10b) and SEA (
Figure 10c). This could be attributed to the fact that increasing ET further causes viscosity to substantially decrease, which in turn lowers the structure’s strength [
37]. Regarding LT, the ANOVA results showed that LT had the greatest influence on both E and σ
peak, contributing 77.45% of the total variation in E (76.19% from LT and 1.26% from LT
2) and 89.25% of the total variation in σ
peak (89.02% from LT and 0.23% from LT
2), respectively. Increasing LT from 0.2 mm to 0.3 mm decreased the mechanical performance of the D-TPMS composite structures. These findings are consistent with those reported in [
28], which also showed that LT had the highest influence on the compressive modulus and strength, where a lower LT resulted in improvements in these properties. While the findings reported in [
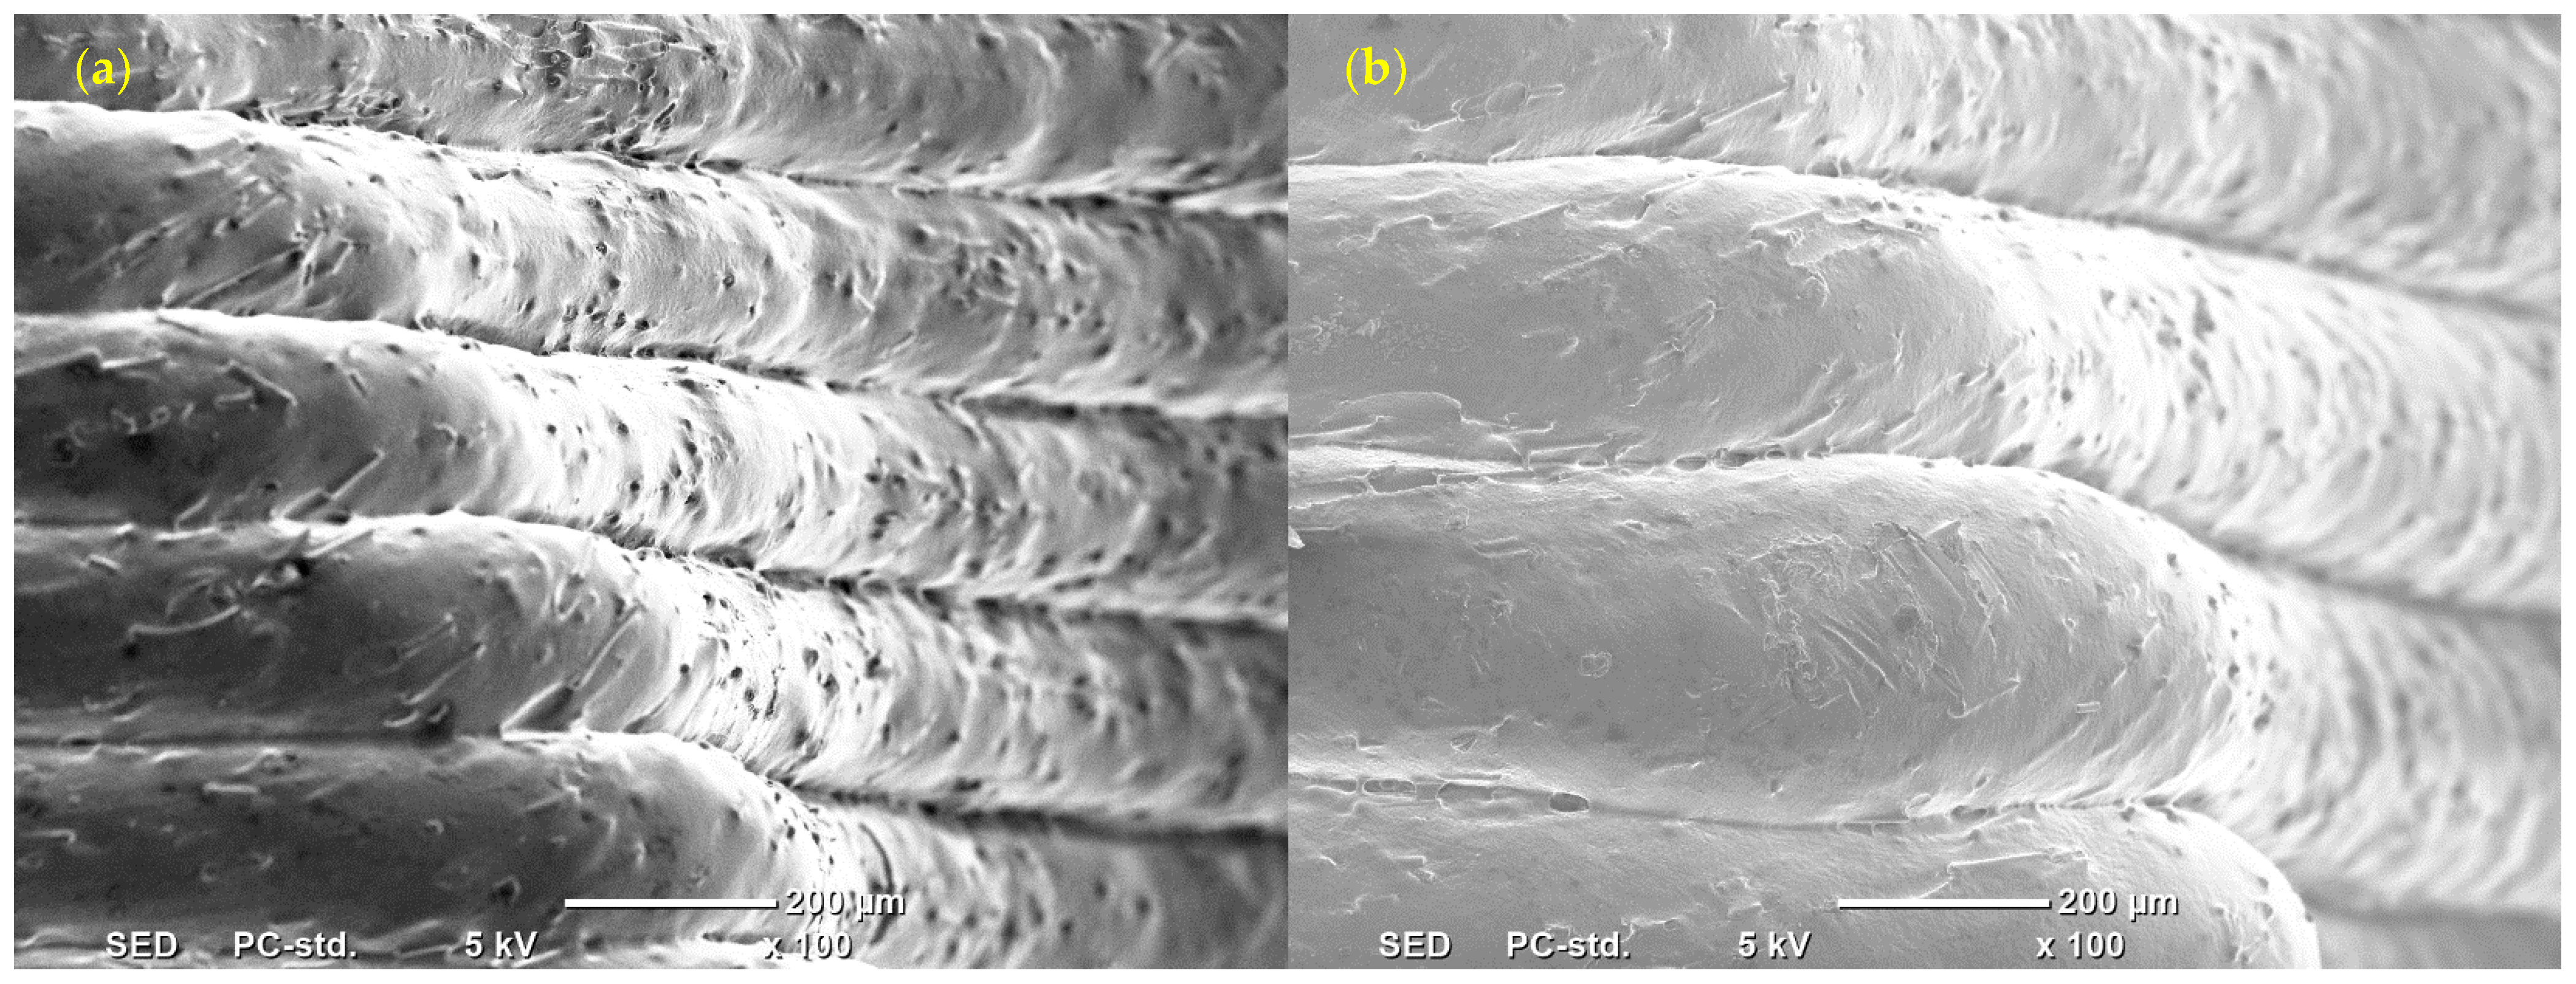
26] also identified LT as the most significant factor, they showed the opposite trend, as the highest yield strength and modulus of the FDM-printed PLA-based structures were achieved at a higher LT (0.3 mm). A high LT (e.g., 0.3 mm) results in the deposition of rasters with a more rounded shape (
Figure 14b) compared to the less rounded rasters observed at a low LT (
Figure 14a). Consequently, more gaps with a reduced contact area between adjacent rasters and layers are formed at a high LT. This, in turn, leads to the initiation and propagation of cracks during compression testing. In contrast, a low LT (e.g., 0.2 mm) creates denser parts and better layer-to-layer bonding, leading to better mechanical properties. PS showed a relatively lower impact on E and SEA, contributing 3.08% and 11.37% (11.25% from PS and 0.12% from PS
2) of the total variation, respectively, while its effect on σ
peak was marginal. In general, increasing PS from 30 mm/s to 60 mm/s enhanced the mechanical performance of the D-TPMS composite structures. The literature reports conflicting findings regarding the effect of PS on the mechanical behavior of lattice structures. For instance, for PLA-based lattice structures, Ref. [
26] reported an increase in the compressive modulus at a higher PS (80 mm/s), while [
30] observed an improvement in the compressive strength at a higher PS (90 mm/s). In contrast, Ref. [
27] reported a decrease in the yield strength and plastic platform stress as PS increased from 30 mm/s to 60 mm/s. Another study, Ref. [
28], showed that PS had no effect on the compressive modulus but reduced the compressive strength.
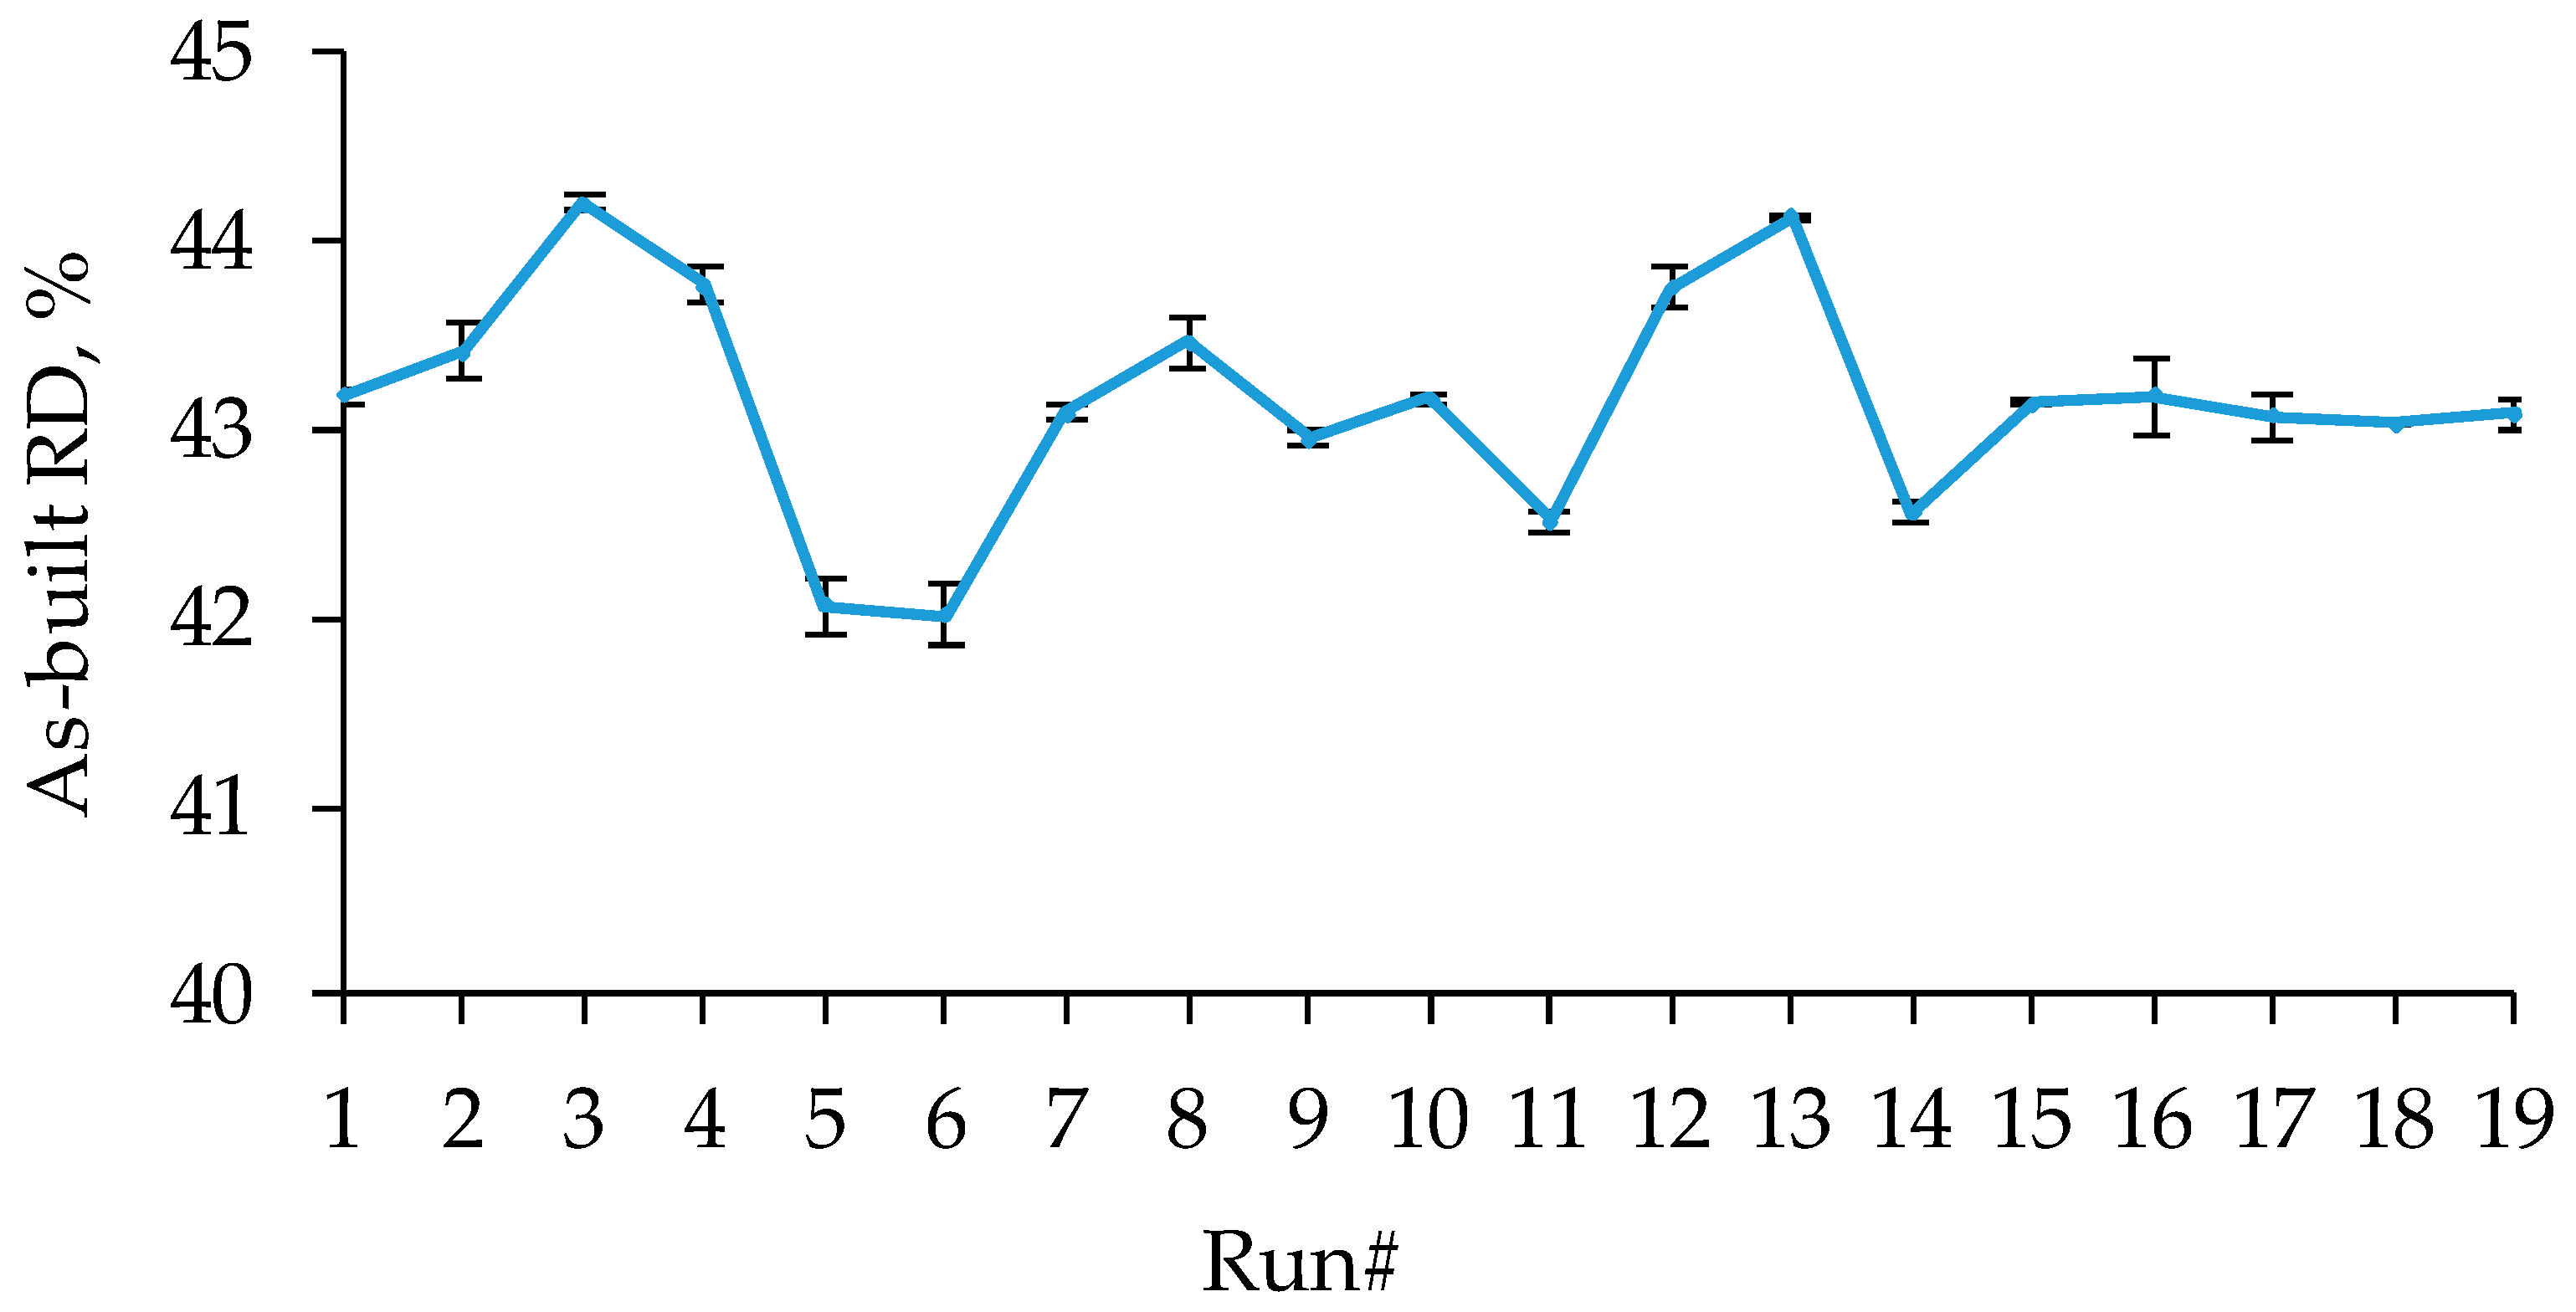
As previously mentioned, the high ET promotes the flow, while the lower LT reduces the roundness of the raster. This directly contributes to the production of dense structures with minimal voids/gaps, as assessed by the as-built RD. For instance, at 235 °C ET and 0.20 mm LT (run#3), the as-built RD of the D-TPMS structure is 44.17%, while at 205 °C ET and 0.30 mm LT (run#5), the as-built RD is 42.06%.
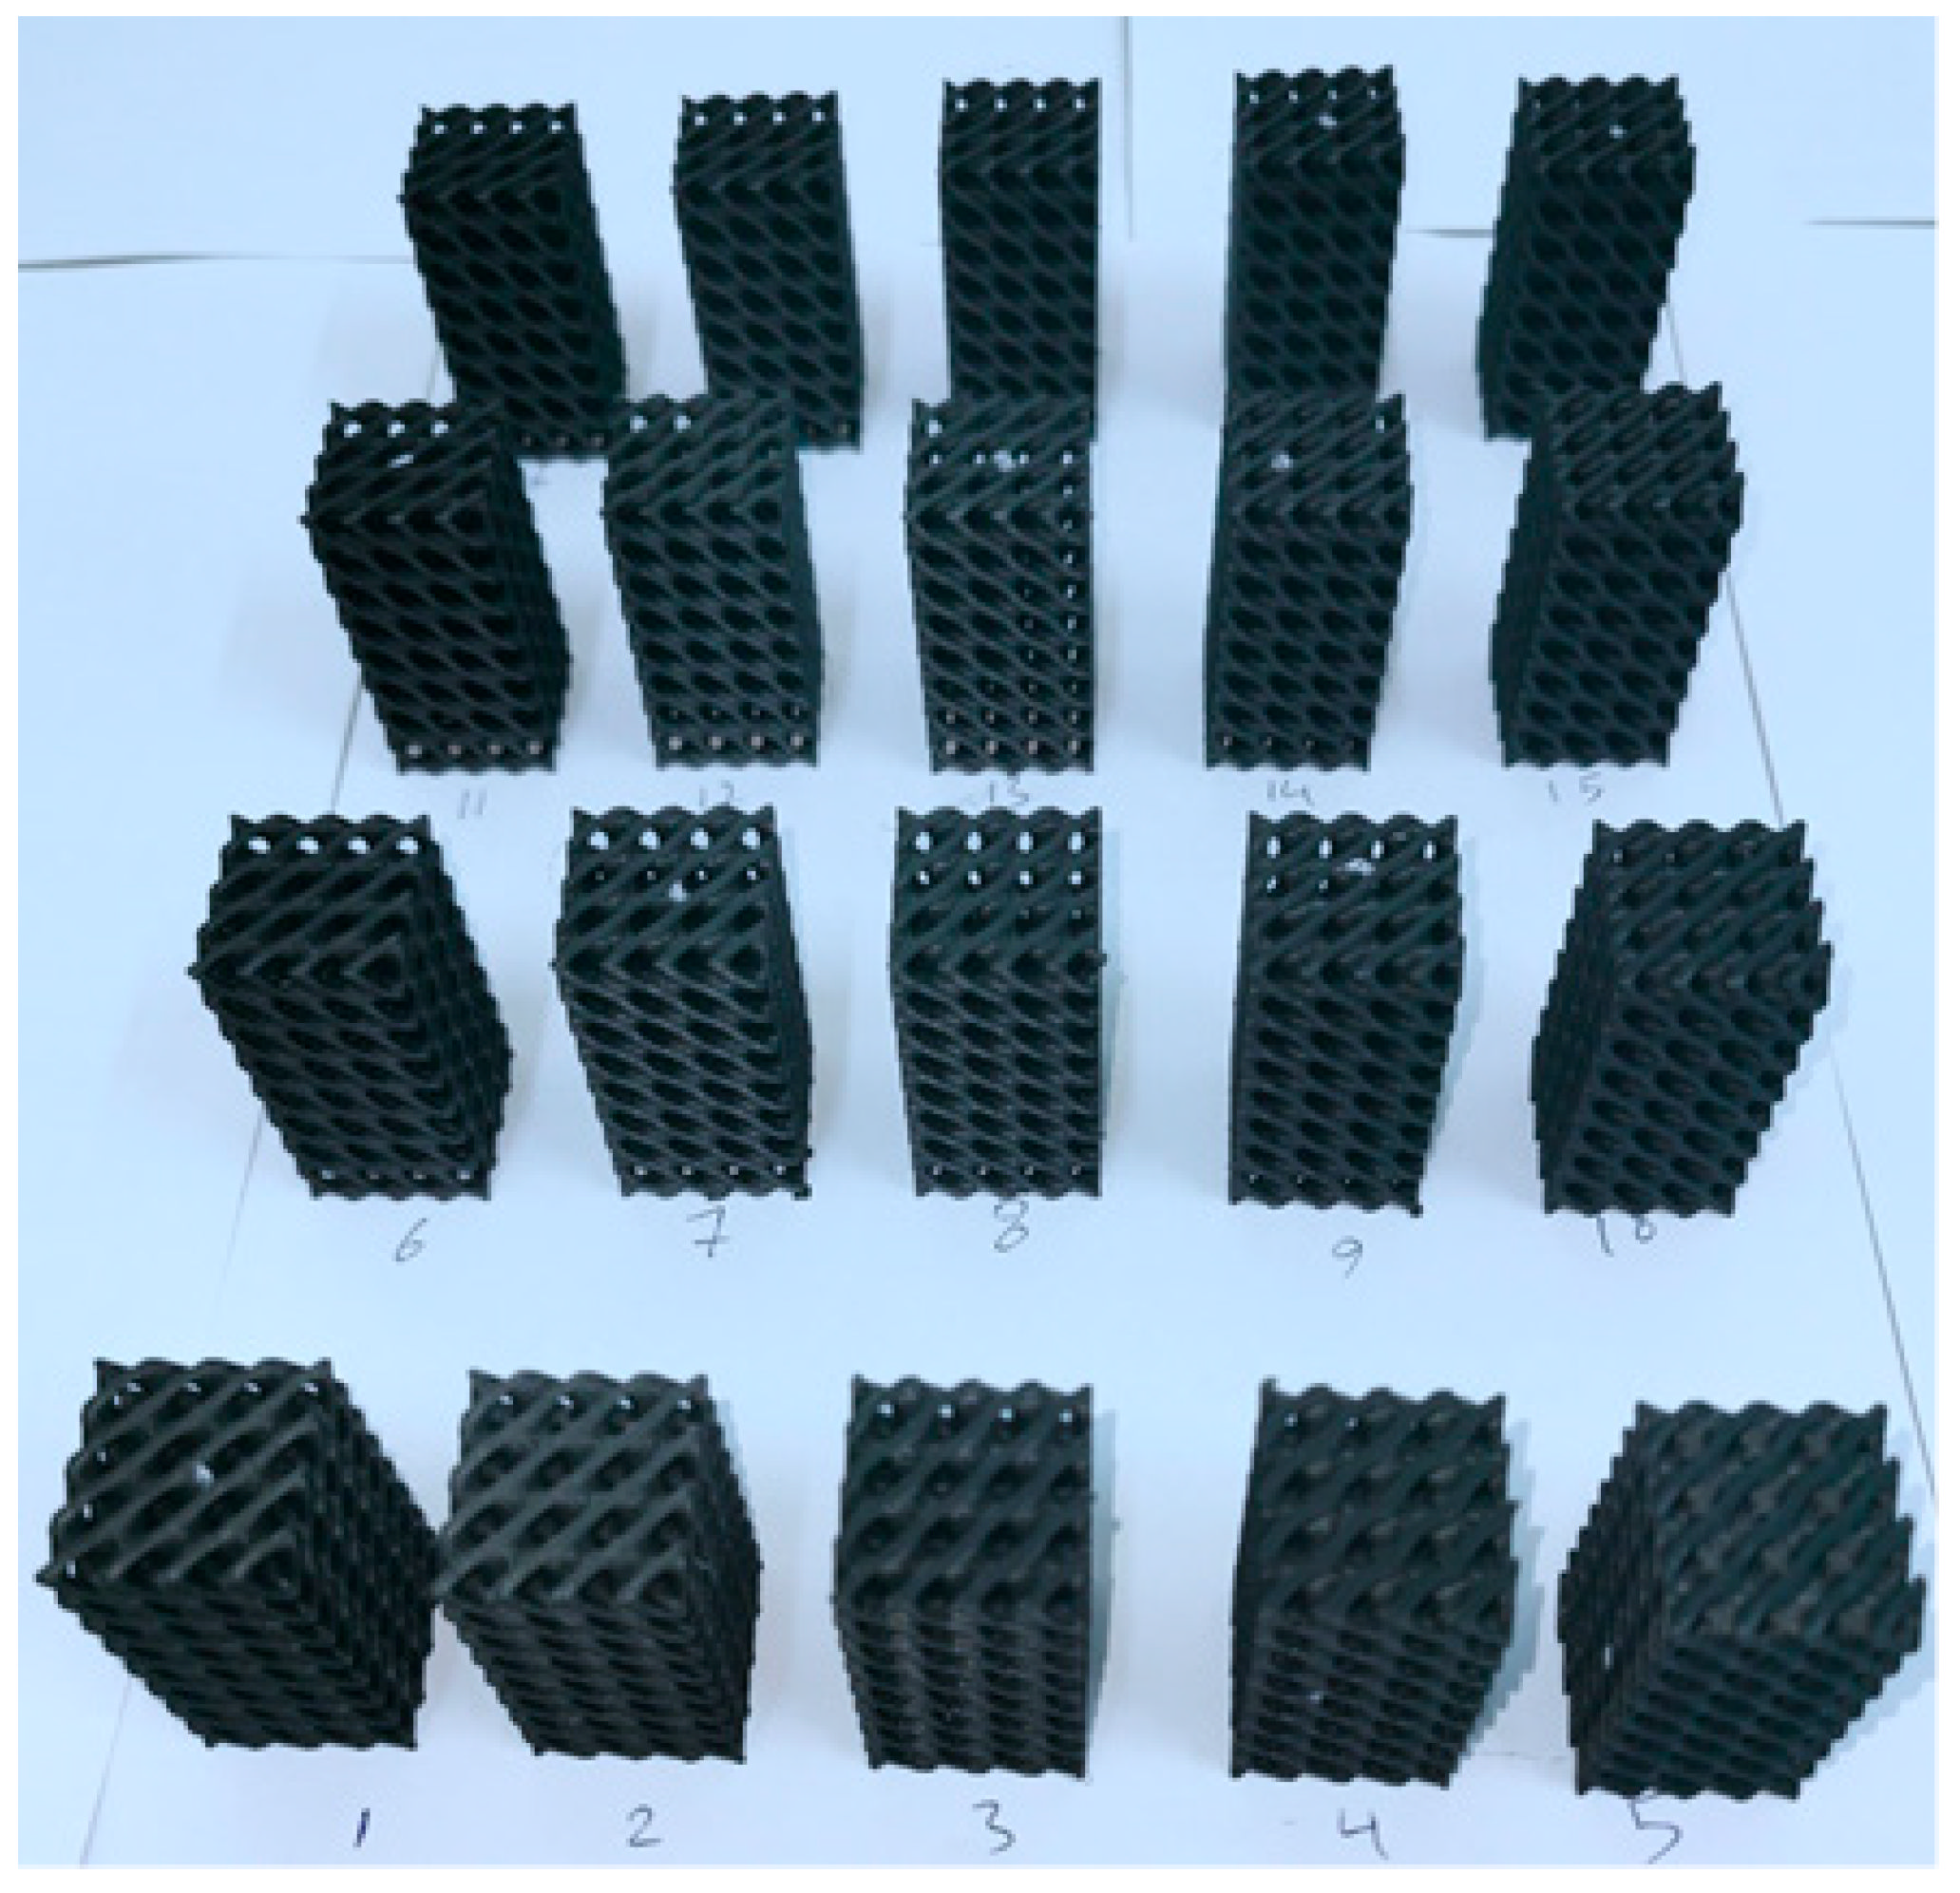
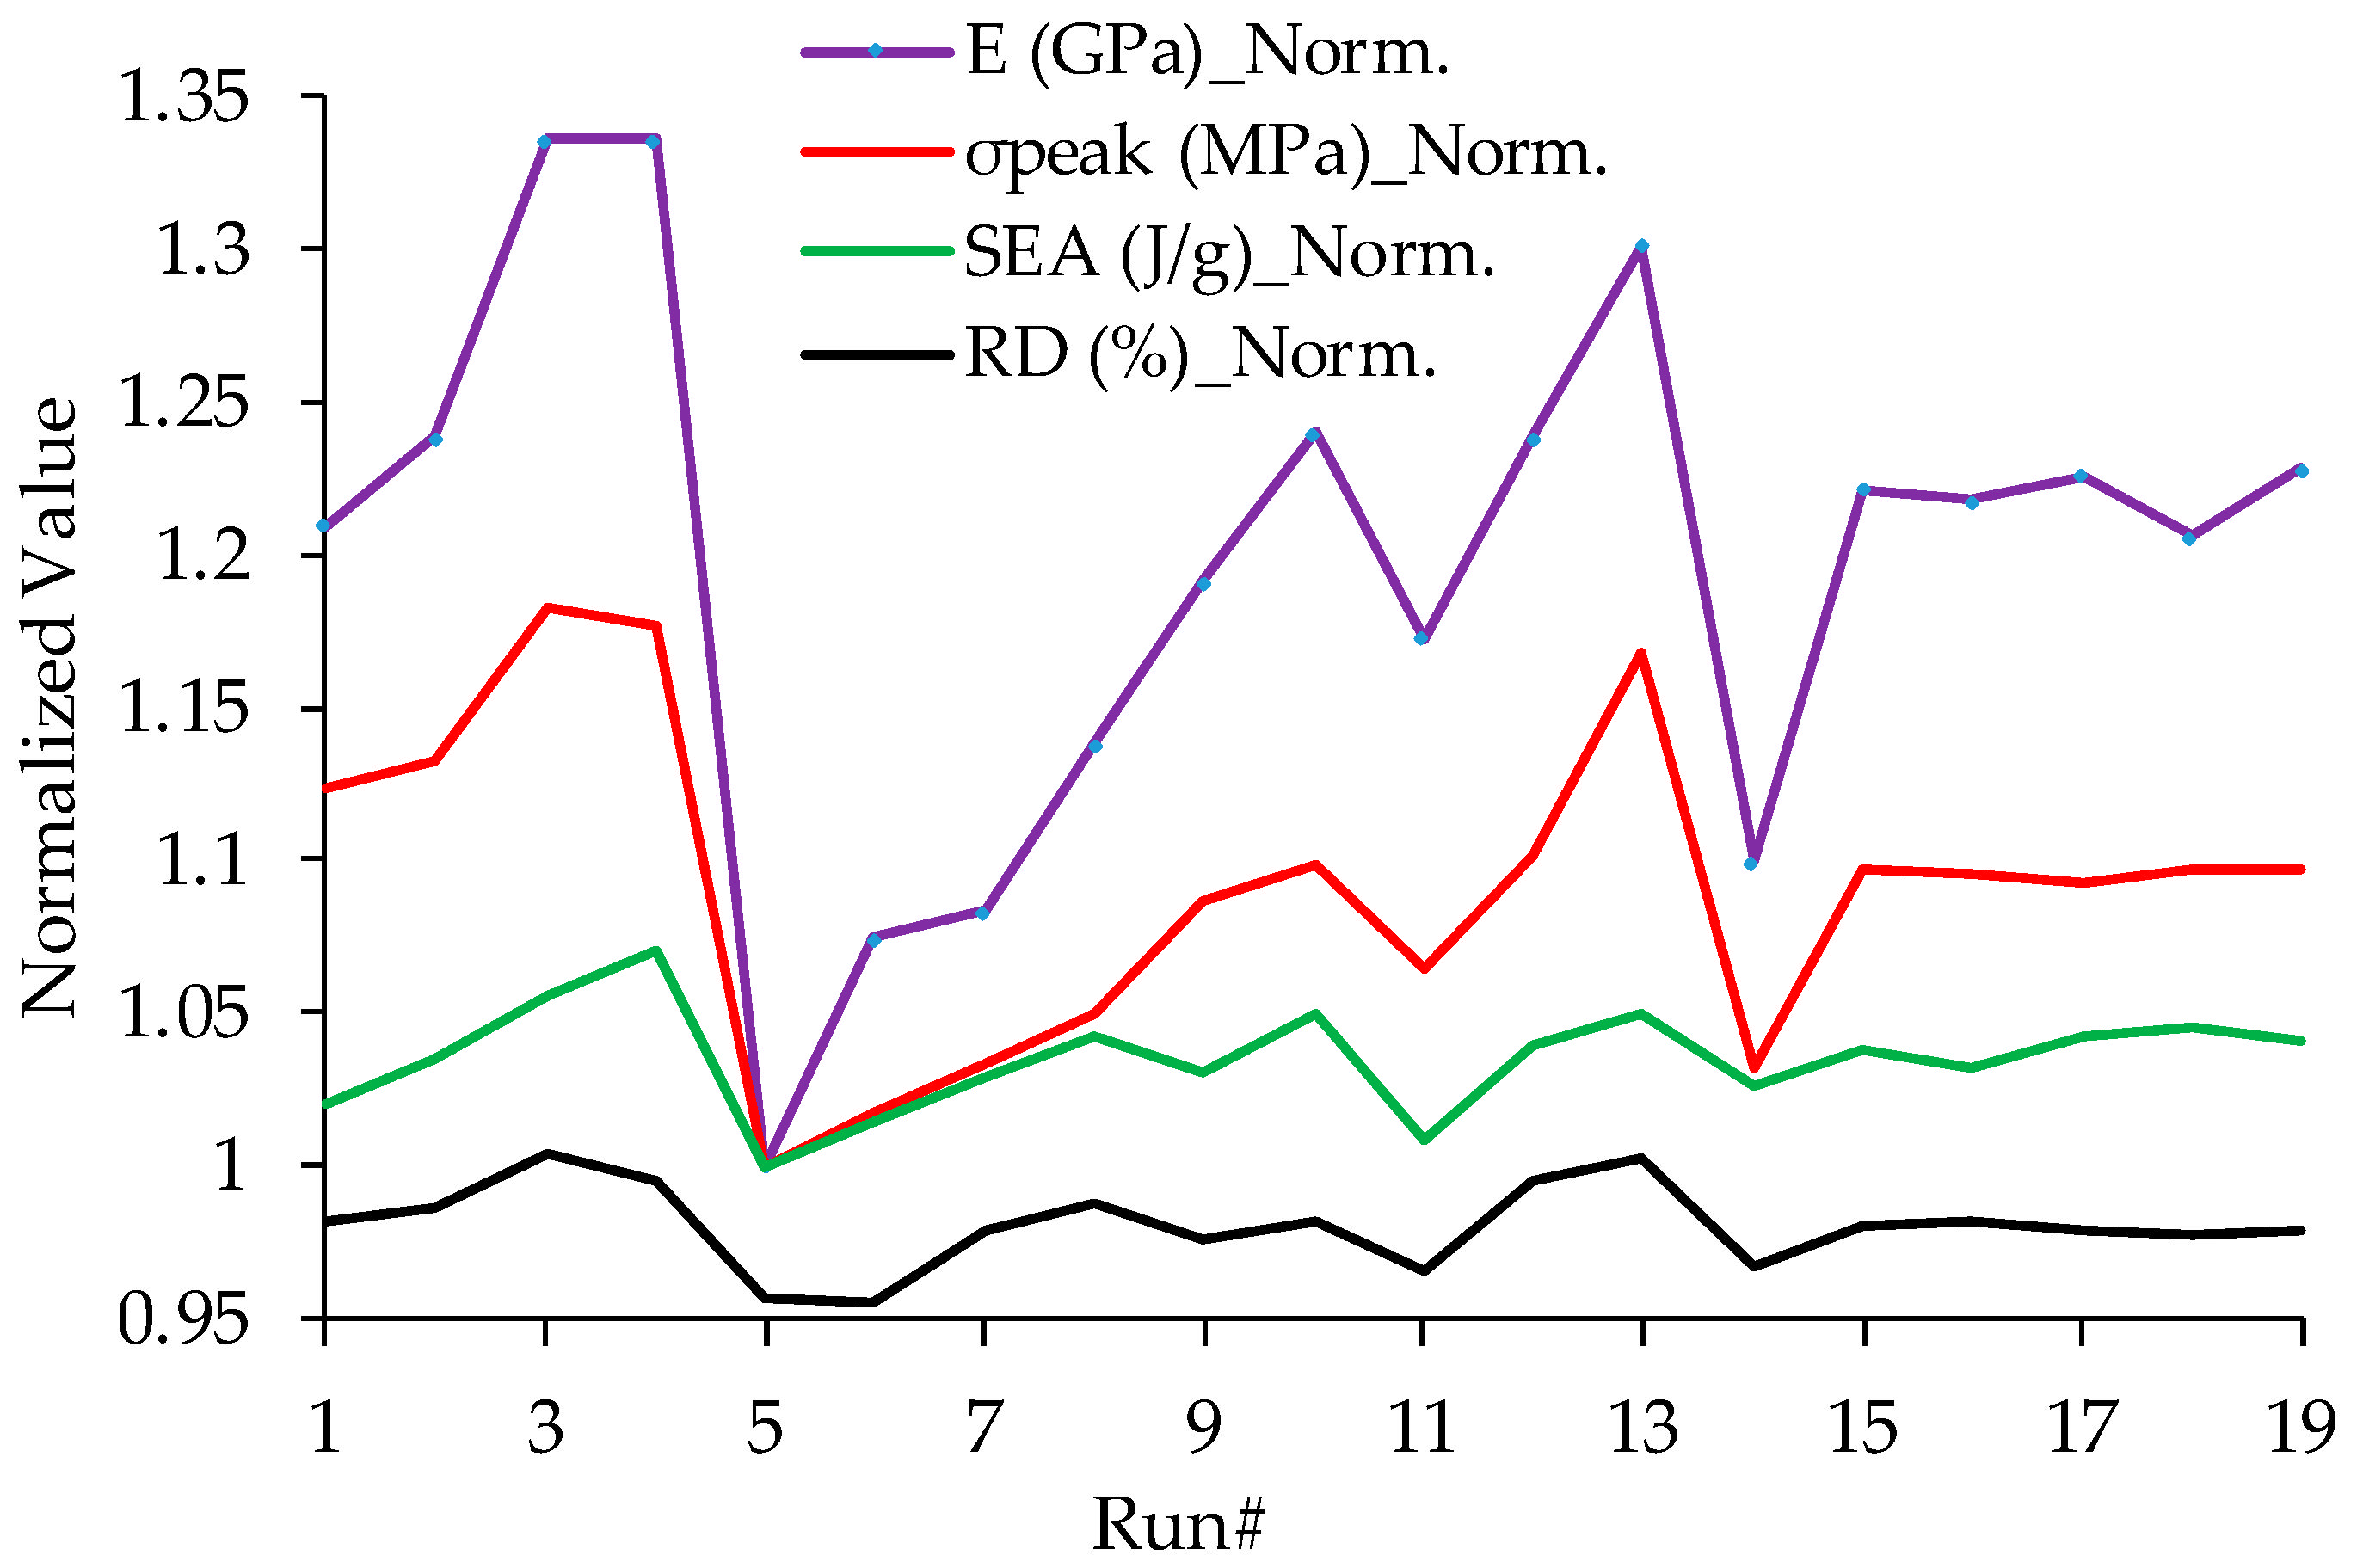
Figure 6 and
Figure 15 illustrate the as-built RD of the FDM-printed D-TPMS structures, highlighting the as-built RD variations among the RSM runs listed in
Table 4. It is important to note that the as-built RD shown in
Figure 15 was represented in “normalized values” by dividing the as-built RD by the intended one, 44%. As evident from
Figure 6 and
Figure 15, the minimum as-built RDs were observed for runs #5, 6, 11, and 14, where the ET was low and/or the LT was high, indicating that both parameters (ET and LT) significantly impact the as-built RD. The RD is the most significant factor influencing the mechanical behavior of lattice structures, and any deviation from the designed RD will certainly affect the mechanical behavior, as also illustrated by [
32,
33].
Figure 15 also presents normalized values of E, σ
peak, and SEA to further illustrate the correlation between them and the as-built RD. Please note that the normalized values for each response of E, σ
peak, and SEA were calculated by dividing the corresponding result by its corresponding minimum value. It is evident from
Figure 15 that the as-built RD is correlated with all responses, where a higher as-built RD indicates improved mechanical performance and vice versa. The Pearson correlation test confirms the relationship between RD and all responses, as illustrated in
Table 11, demonstrating a significant correlation with a high coefficient (higher than 0.8). Although all specimens were designed with an identical relative density (44%), the as-built RD varied as a function of the considered FDM-printing parameters, particularly ET and LT. High correlations were observed between RD and the mechanical responses (E: r = 0.839; σ
peak: r = 0.854; SEA: r = 0.818), indicating that RD variations contributed substantially to the mechanical behavior. Nevertheless, the FDM printing parameters may also influence the mechanical response through RD-independent mechanisms, such as bonding quality, local thermal history, raster deformation resistance, and defect formation, which are not fully accounted for by RD alone. The positive Pearson coefficients represent a positive relationship between the RD and the mechanical responses, indicating that as the RD increases, E, σ
peak, and SEA tend to increase.
The findings demonstrate that the mechanical performance of FDM-fabricated lattice structures is governed not only by lattice geometry, material composition, and RD, but also by the FDM printing parameters. In particular, extrusion temperature and layer thickness significantly affect material deposition, interfacial bonding quality, and the as-built relative density, which in turn influence stiffness, strength, and energy absorption. Thus, extrusion temperature and layer thickness provide an effective means of controlling stiffness, strength, and energy absorption in lattice structures for lightweight load-bearing and energy-absorbing applications. The results further indicate that improving raster interfacial bonding reduces defect formation and delays crack initiation during compression, thereby enhancing the deformation stability and energy absorption capability of the lattice structures. In this regard, ET can be used as an effective process parameter for improving raster interfacial bonding and consequently enhancing the energy absorption capability of lattice structures. The results also demonstrate that the mechanical performance of FDM-fabricated lattice structures is highly sensitive to FDM-induced variations in as-built RD arising from the printing parameters, even when the designed RD is held constant. In this regard, it should be noted that deviations of the as-built RD from the designed value may arise not only from the lattice design, designed RD, and material composition, but also from the FDM printing parameters. Thus, the findings of this work and [
32,
33] demonstrate the significance of examining how several factors, such as the design, material, RD, and printing parameters, affect the printability and functionality of the lattice structures.




 ,
,