3.2. Kinetic Evaluation
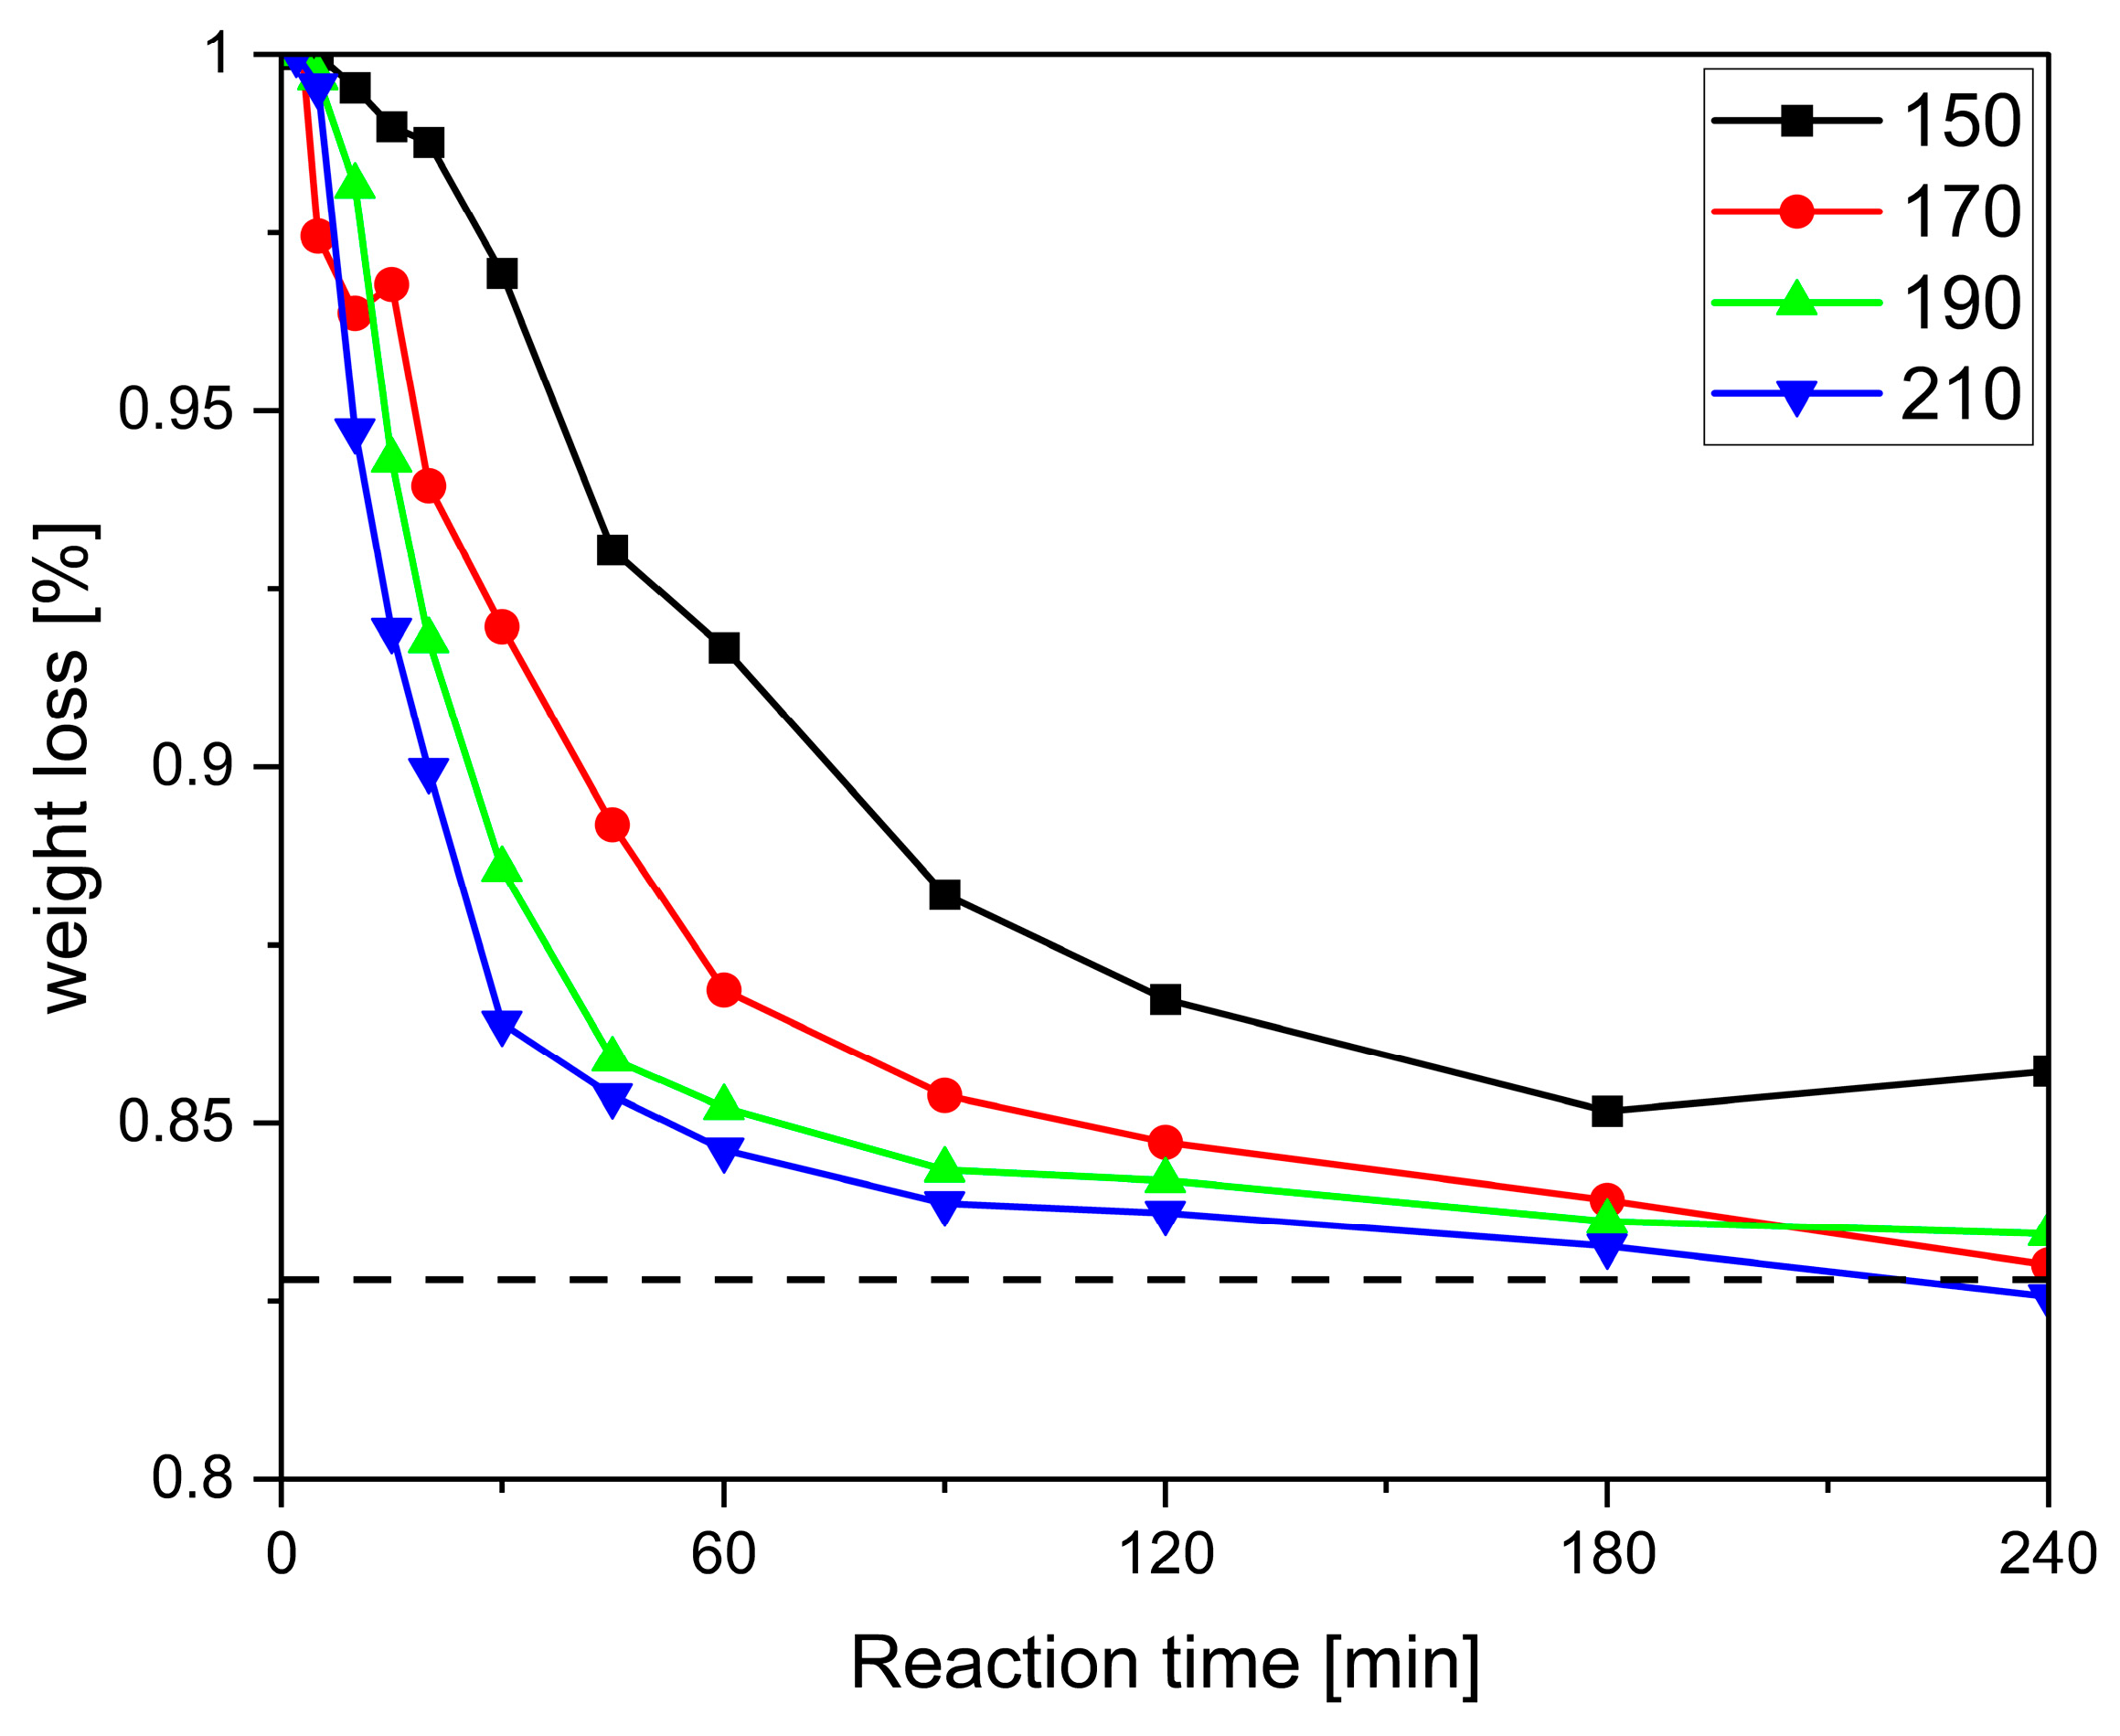
To select the proper conditions for the preparation of larger specimens, it is important to quantitatively assess the conversion-time profiles at different temperatures. We chose the interval between 150 and 210 °C in steps of 20 °C. In Fischer esterification, the formation of one molecule of water indicates the conversion of one hydroxy and one acid group to one ester group. Previous studies have monitored the conversion by, e.g., OH-group analysis [
26], which in the present case is not feasible as the product becomes increasingly insoluble. Assuming that water is the only volatile compound under the selected reaction conditions, the mass loss over the course of the reaction correlates with the concentration of alcohol, acid, and ester groups, as well as the degree of polymerisation, and can thus conveniently be used to record the conversion-time profiles [
31]. Isothermal thermogravimetric analysis seemed to be an ideal method for this, as the reaction can be monitored continuously without interruption. This, however, did not provide the desired reproducible results. The main reason for this was found to be the high-volume stream of nitrogen that flushed the sample chamber in the equipment. Control experiments with pure T at 190 °C revealed that this causes pronounced evaporation even of high-boiling compounds in a short period of time (
Figure S1 in Supplementary Materials). As a result, conversion-time curves from individual experiments were recorded gravimetrically, resulting in more consistent trends (
Figure 6).
For all systems, a short slow induction period is observed, which becomes shorter with increasing temperature (
Figure 6 and
Figures S2–S6 in Supplementary Materials). This is again in line with the observations in
Figure 4 and is explained by the reactants having to come up to reaction temperature, melt, and mix—or, in the case of pentaerythritol (P), dissolve, as its melting point is above the highest reaction temperature—before the reaction can fully set in. A closer comparison of
Figure 4 and
Figure 6 reveals that foaming occurs when the conversion rate d
m/d
t is at its maximum. It was also observed that for all systems except SA-P (
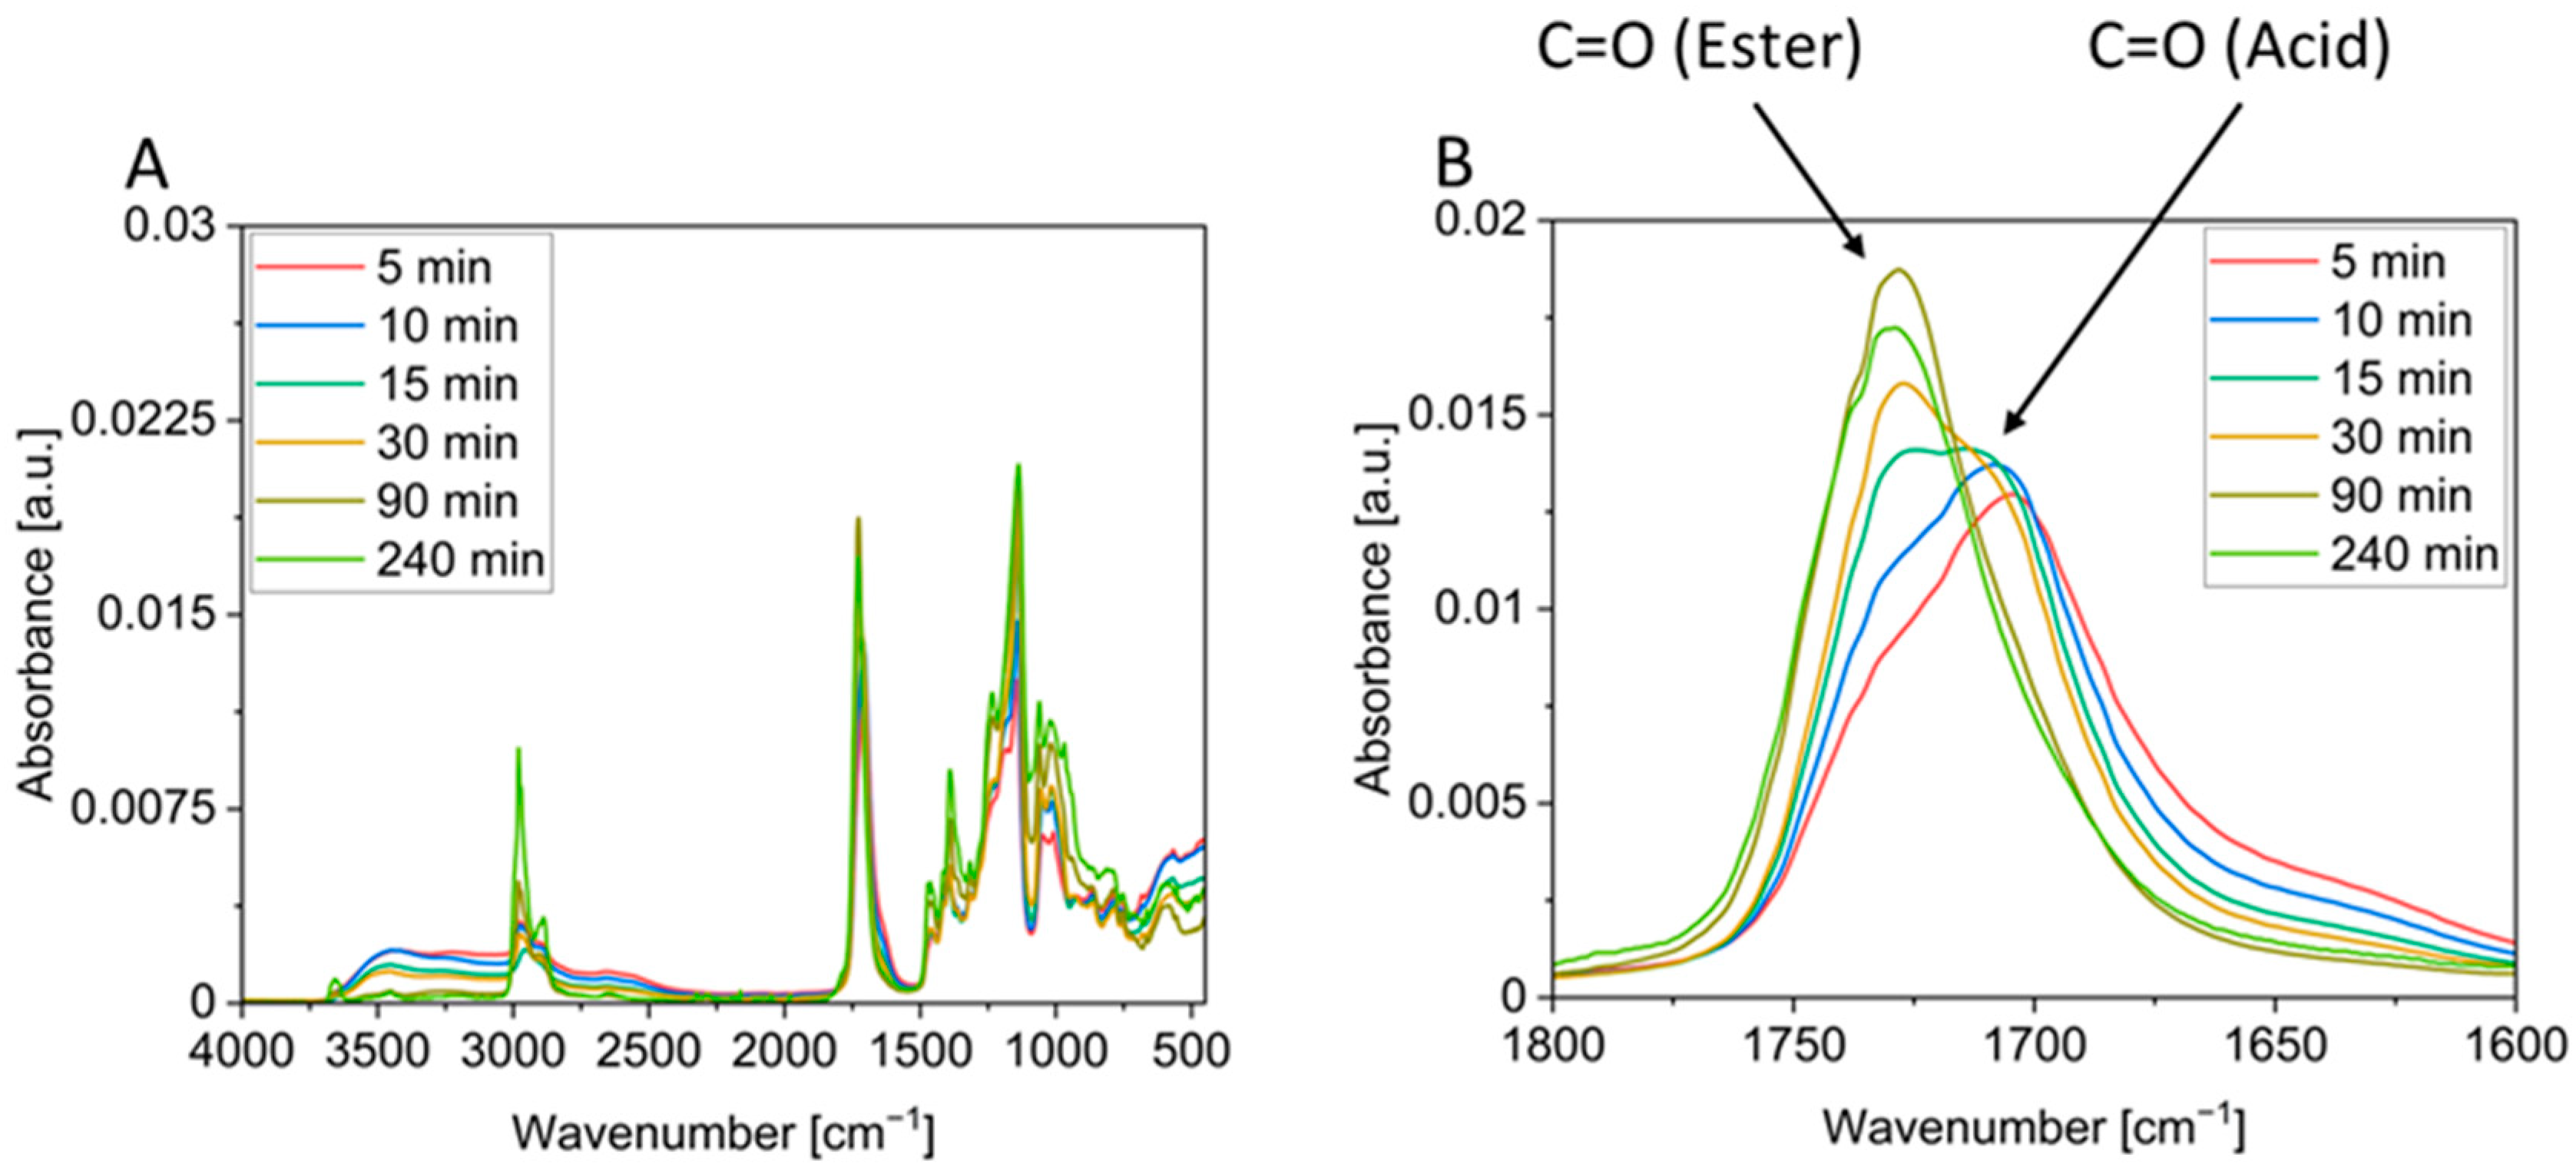
Figure S6 in Supplementary Materials), the mass loss at all four reaction temperatures approached the theoretical value. Thus, the observed degradation, indicated by the increasingly darker colouring of the foams in the vial test (
Figure 4) and the decrease in the ester vibration (
Figure 5B), does not result in a significantly increased mass loss beyond the theoretical value (cf.
Figure 6 and
Figures S2–S6 in Supplementary Materials). This indicates that even small amounts of decomposition products in the otherwise colourless foam lead to discolouration. In addition, systems containing pentaerythritol (P) appear to show a faster tendency for degradation at prolonged reaction times, which might be due to the faster reaction and might indicate that degradation is a side reaction of the product.
The reason why the reactions of the SA-P system at lower temperatures do not reach the theoretical mass loss might be that neither of the two compounds melts below 190 °C. Nonetheless, it is interesting to note that the reaction also takes place at these temperatures and a foam is produced albeit with a greater delay. Here, the low molecular weight oligomers act as solvent, facilitating the reaction of the mostly solid reactants. For reaction temperatures above 190 °C, a mass loss higher than calculated was observed, possibly due to the earlier onset of the decomposition of oligomers or unreacted educts.
For the GA-T system (
Figure S4 in Supplementary Materials), the conversion-time curves at 150 °C and 170 °C deviate strongly from the expected course. First, a slow melting process is observed, leading to a shift in the reaction towards longer reaction times. After all the reactants have melted, a plateau appears to be reached after approximately 60 min of reaction time. This can be explained by the formation of a polymer layer on the surface, which acts as a lid and hampers the evaporation of water. The layer is not visible in the vial tests (
Figure S7 in Supplementary Materials), but can be detected by probing the mixture, e.g., at 90 min with a needle, which reveals a leathery surface with a viscous liquid beneath. As the evaporation of water drives the equilibrium to the product side, a layer with reduced permeability slows down the reaction. With longer reaction times and increasing pressure of the formed water, the layer can be broken up, water vapour is released, and the reaction continues (
Figures S3 and S7 in Supplementary Materials).
As stated above, the mass loss determined gravimetrically can be converted to the concentration of the functional groups with the help of the density. However, assessing the density required making some simplifying assumptions. For example, the density could only be determined for those systems that form liquid prepolymers before the foaming process starts, which is not the case for SA-P and AA-P. It was then assumed that the density was approximately constant during the reaction and at the different reaction temperatures. This is, of course, not the case, but it was assumed that the errors were similar for all the systems under investigation and smaller than the uncertainty of the fit, so that the values were comparable within the set under investigation. On paper, the Fischer esterification is first-order in both alcohol and acid, which adds up to a second-order reaction. However, trying to fit a second-order rate law to the data points provides only a poor correlation, even when excluding the values of the initial phase. A first-order rate law, on the other hand, results in an excellent match in most cases and is, consequently, used for the quantitative evaluation of the reaction. The deviation from the classic textbook knowledge is explained as follows:
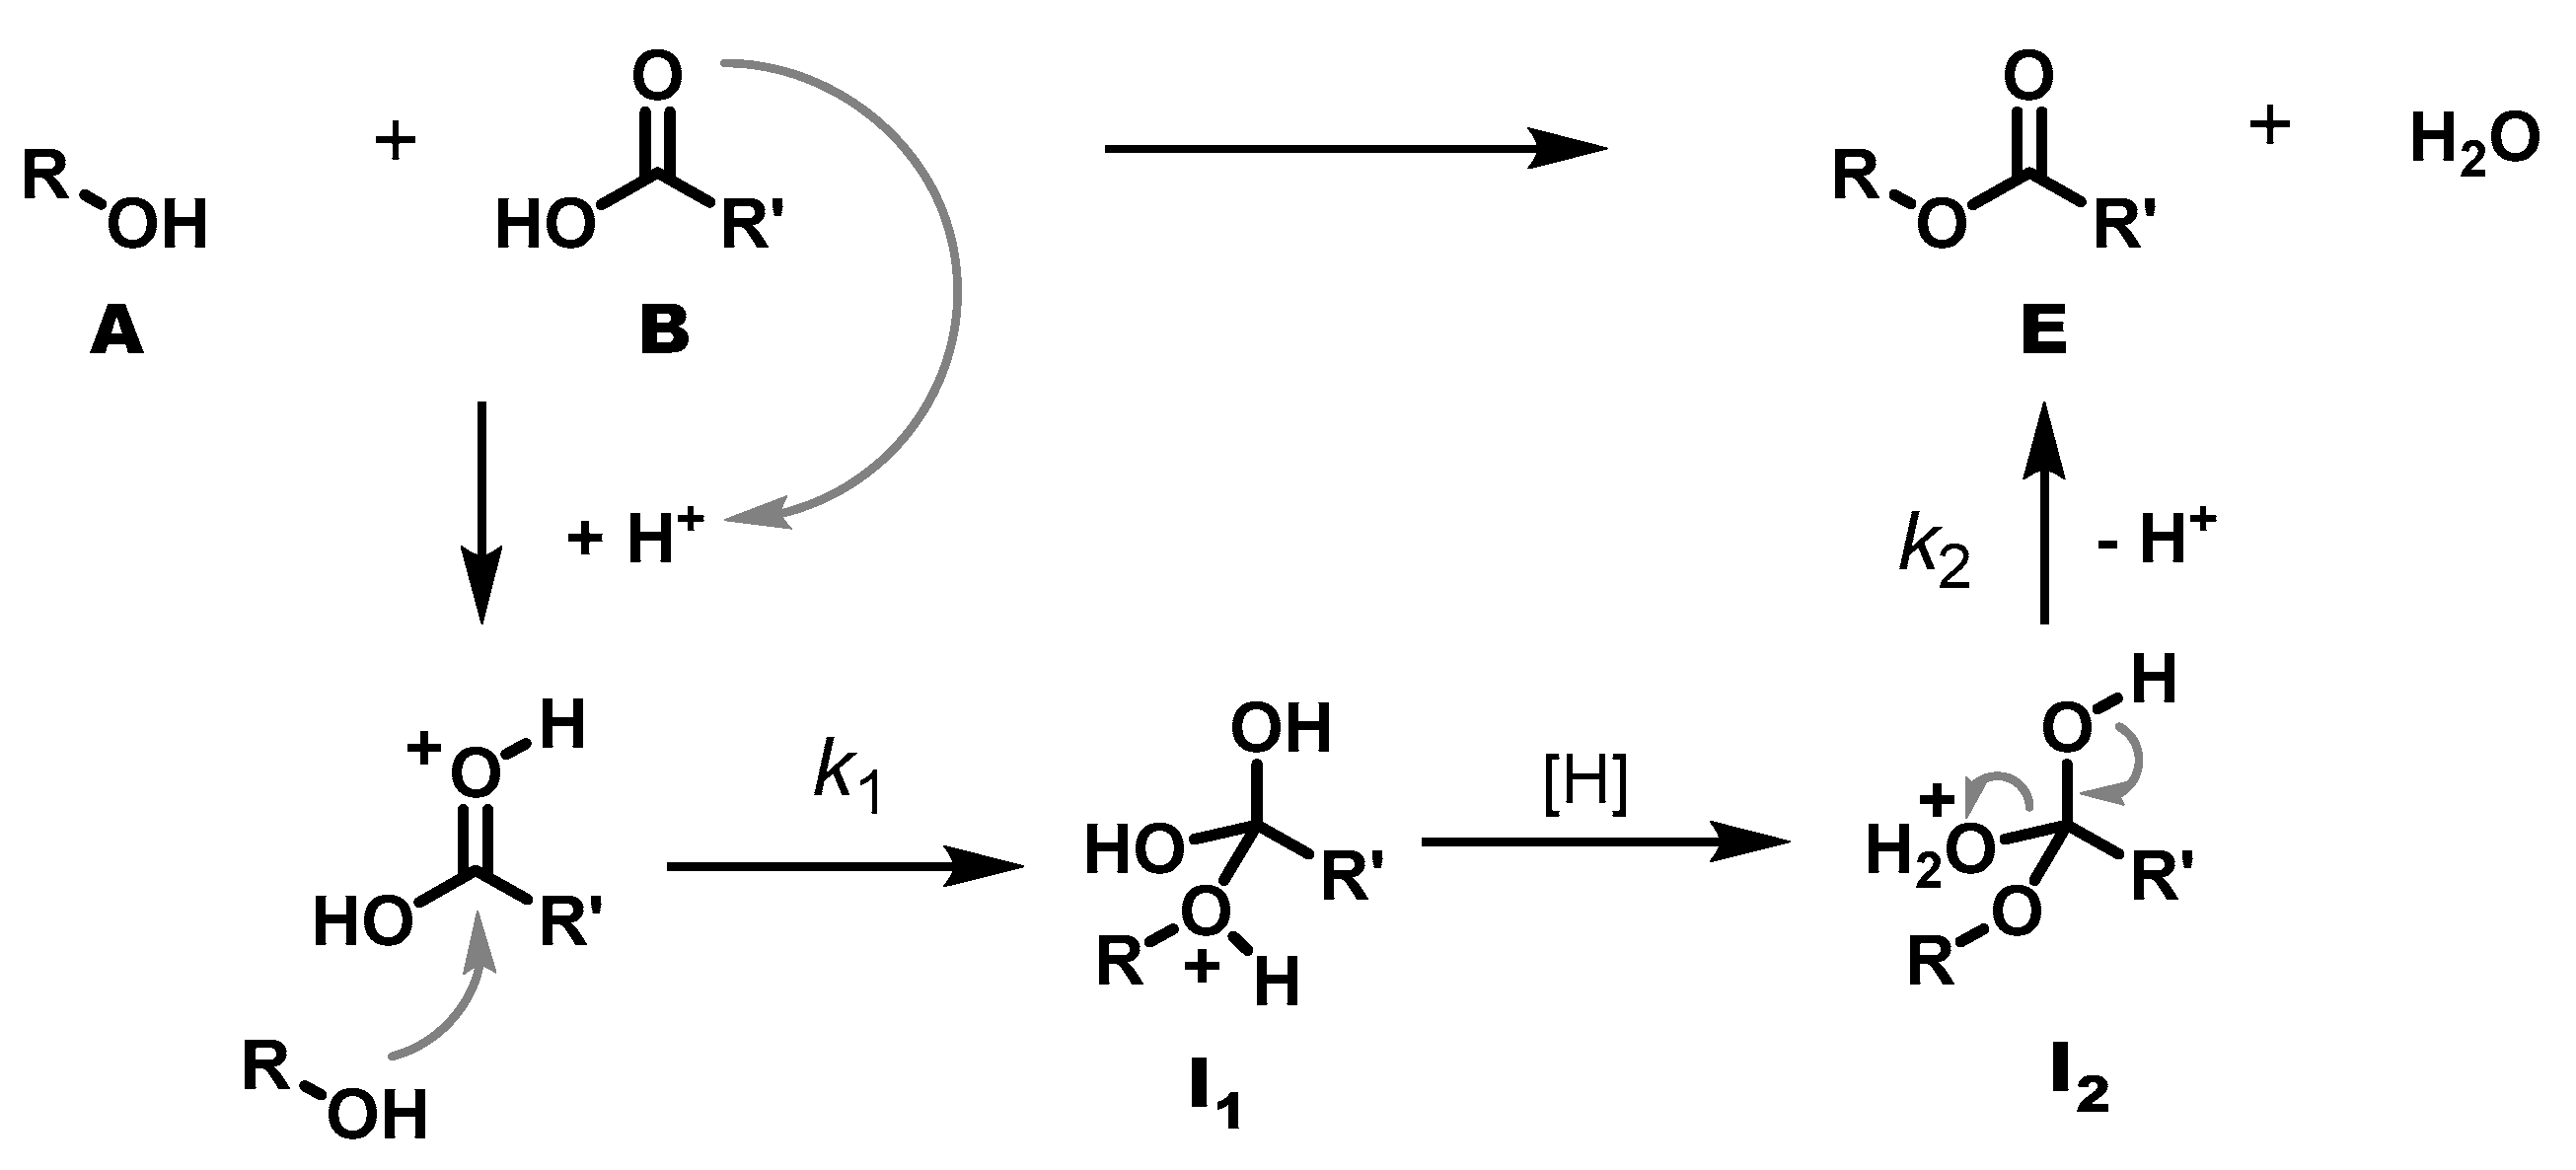
During polycondensation, a hydroxy group (A) reacts with an acid group (B) to form an ester group (E) and a water molecule as a by-product. However, the progress of the reaction is not monitored as usual via the decrease in reactants, but via the evaporating water. Provided that the protonation of the ester and the proton transfer from I1 to I2 are fast, the formation of water is controlled by two steps: the bimolecular addition of alcohol to the protonated ester (k1) and the unimolecular elimination of water from I2 (k2). Both are equilibrium reactions, but it is evident that I2 E + H2O can be shifted to the I2 side by hampering the evaporation of water, as is the case in a highly viscous medium. The elimination then becomes rate-determining, and the overall formation of water appears as unimolecular reaction.
Under the above assumptions and conditions that the elimination of I
2 to E + H
2O is the rate determining step leading to a first-order reaction, the polycondensation reactions were analysed using the first-order rate law.
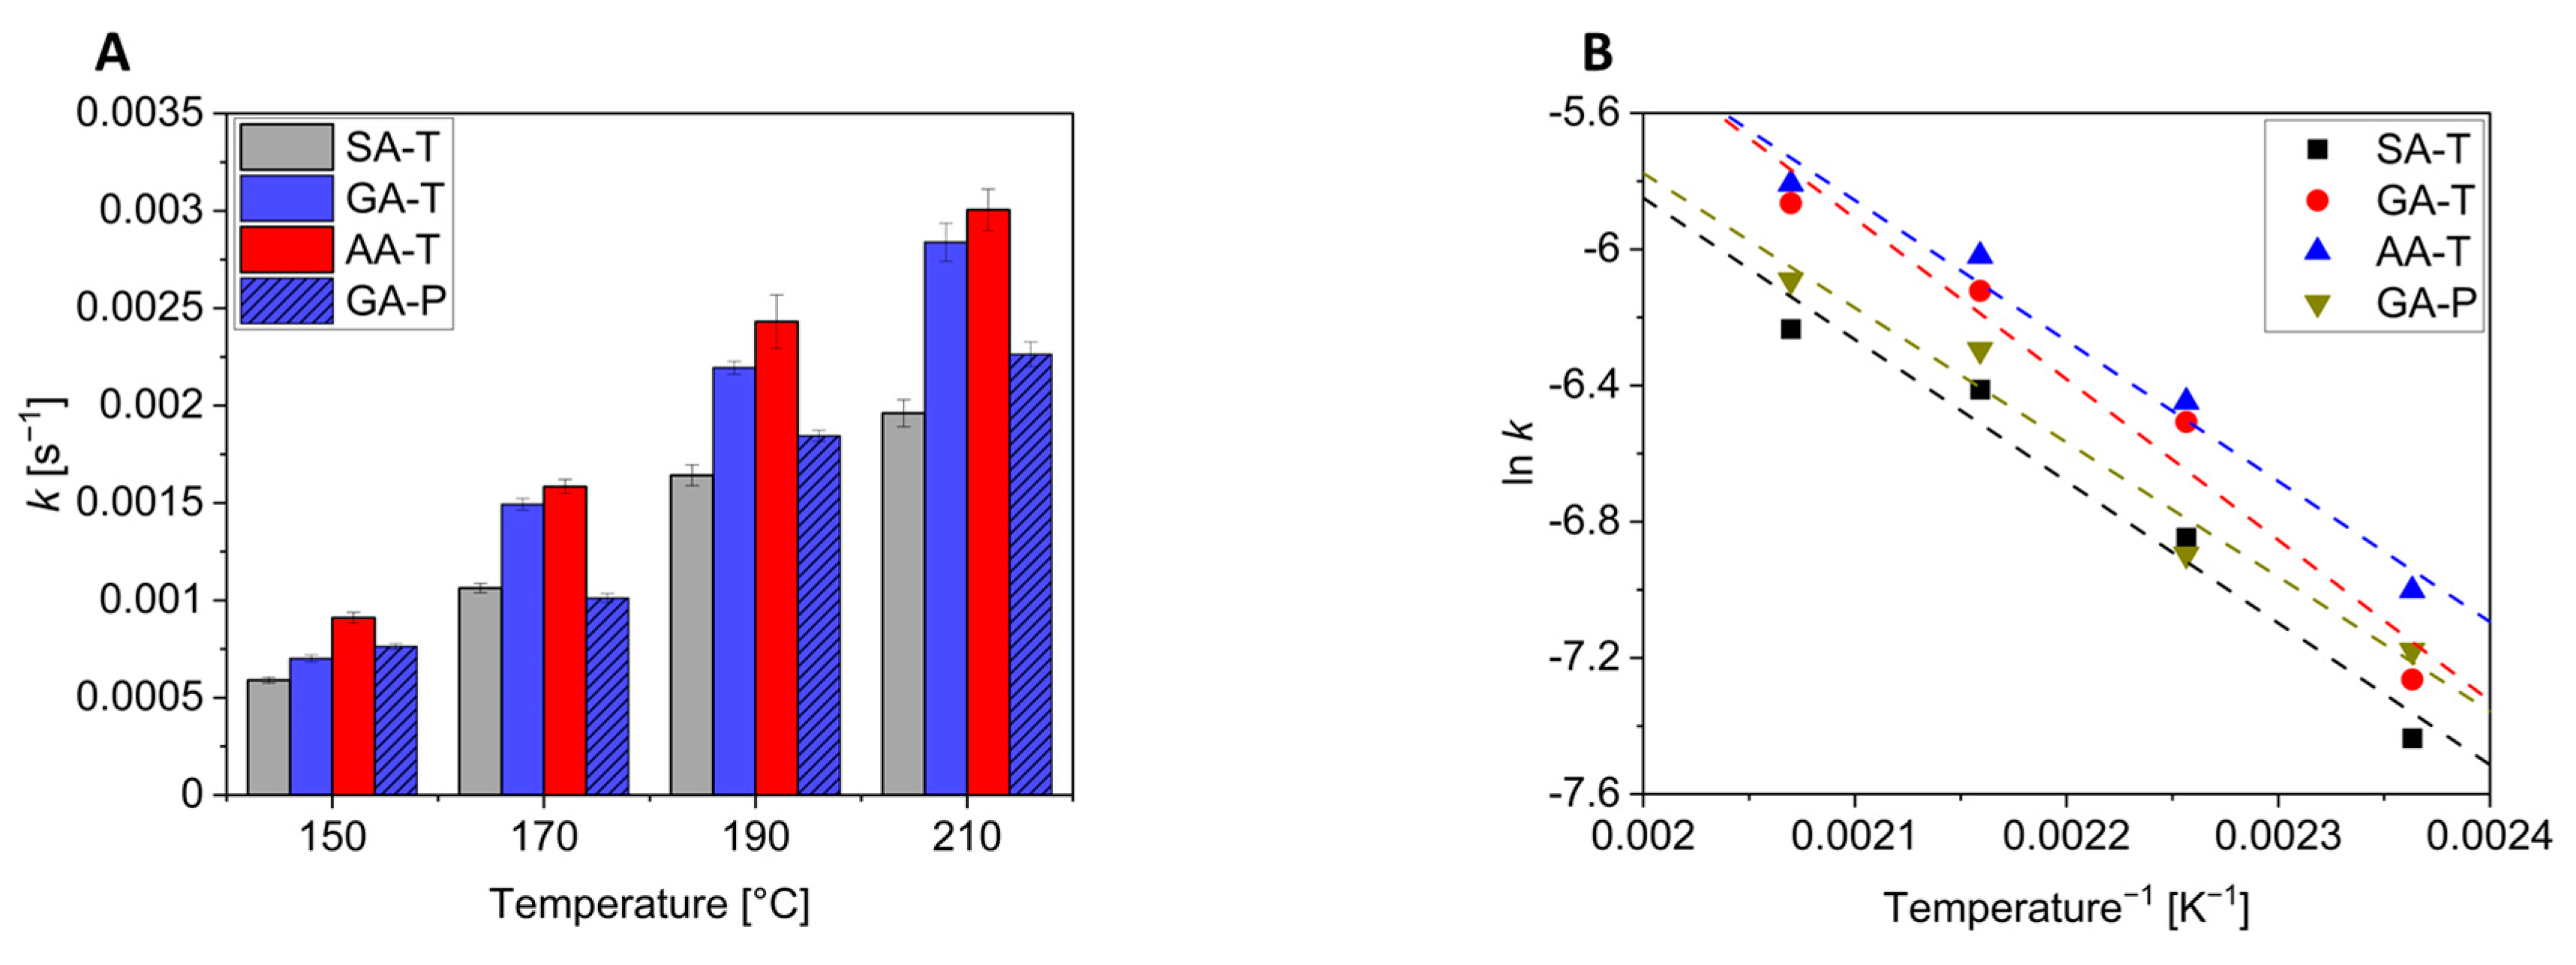
Figure 7 shows the apparent rate constants and their dependence on temperature. A table with the values can be found in
Supplementary Materials (Table S2). As already seen in
Figure 6, the reactions become faster with increasing temperature for all reactions. It is, however, interesting to note that at a given reaction temperature, the values increase in the order AA > GA > SA, i.e., the reaction is faster with higher dicarboxylic acids (
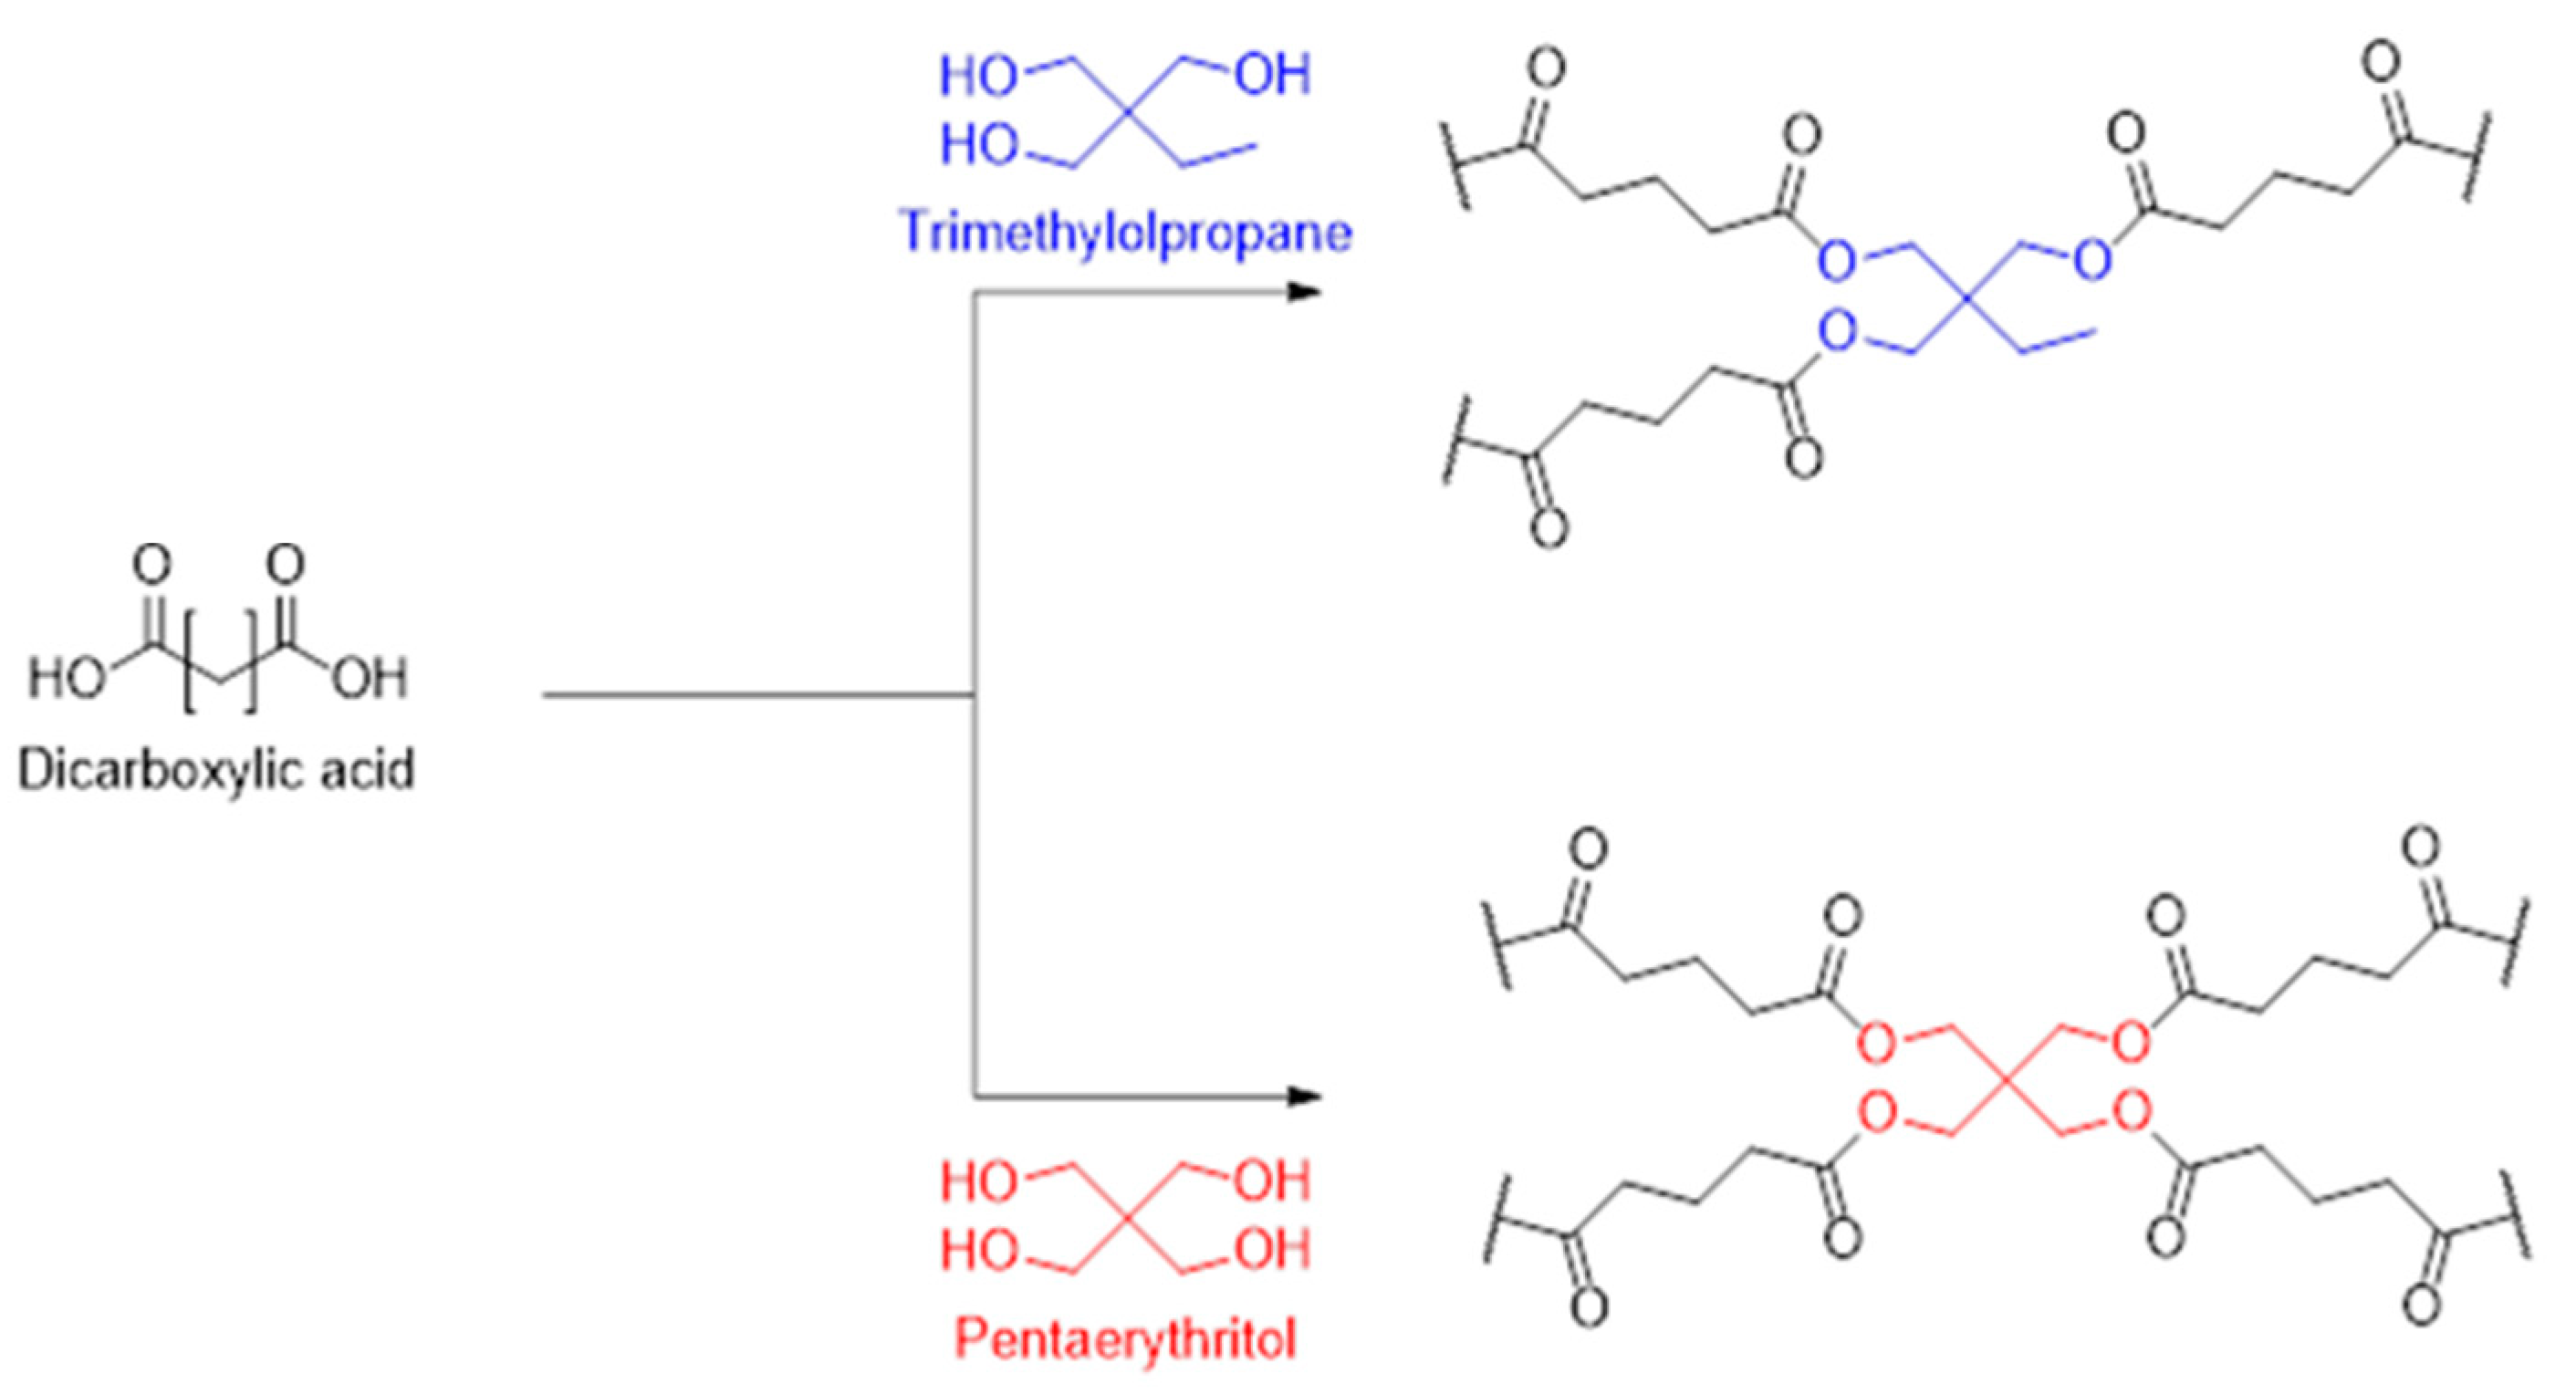
Figure 8A). This is due to the increased mobility of the chains as their length increases, which accelerates the reaction by favouring the spatial proximity of the reactive groups. As outlined above, only the GA-P system of the pentaerythritol-containing mixtures could be investigated. Comparing this to the GA-T system reveals another interesting aspect of these mixtures. While at 150 °C the rates of these two systems are comparable, the values for the GA-T system increase faster with increasing temperature than for the GA-P system. This could be due to two effects: First, a denser network is formed with P due to the tetravalent nature, which makes it more difficult for the system to react due to steric hindrance. The second effect might be due to the lower melting point of T compared to P. This results in a more homogeneous and faster mixture, as no dissolution process is included. This can lead to a faster reaction.
Plotting ln
k vs. 1/T gives straight lines with a coefficient of determination of >0.97 (
Figure 8B). The slopes are on the order of −4000 (≈480 kJ/mol) with the exception of the GA-T mixture, which calculates to approximately −4700 (≈560 kJ/mol). These values are, of course, far too high for the activation energy of esterification reactions and may be due to the use of a first-order rate law, the melt reaction, and/or the fact that the reaction was monitored by the evaporating water. As a result, the thermodynamics of the reaction are not discussed further.
Alternatively, a modified temperature correction factor
Q20 was determined according to Equation (1), which indicates an increase in the rate for a temperature jump by 20 K. According to the rule of thumb, an increase in temperature by 10 K should double the rate, so
Q20 should be close to 4. This is not the case for the present reactions, and this might again be due to the reasons given above during the discussion of the thermodynamic parameters. However, the activation energies derived from
Q20 are much more realistic (
Table 1) than those extracted from
Figure 8B.
3.3. Test Specimens
The initial attempts to produce test specimens revealed that moulds with the same volume but different geometries lead to different results under otherwise identical conditions. Shallow moulds do not show any pronounced foam formation, which improves as the base area of the mould decreases and the height increases. From the geometries tested, the cube was selected as the shape with the best foam formation and used in further tests.
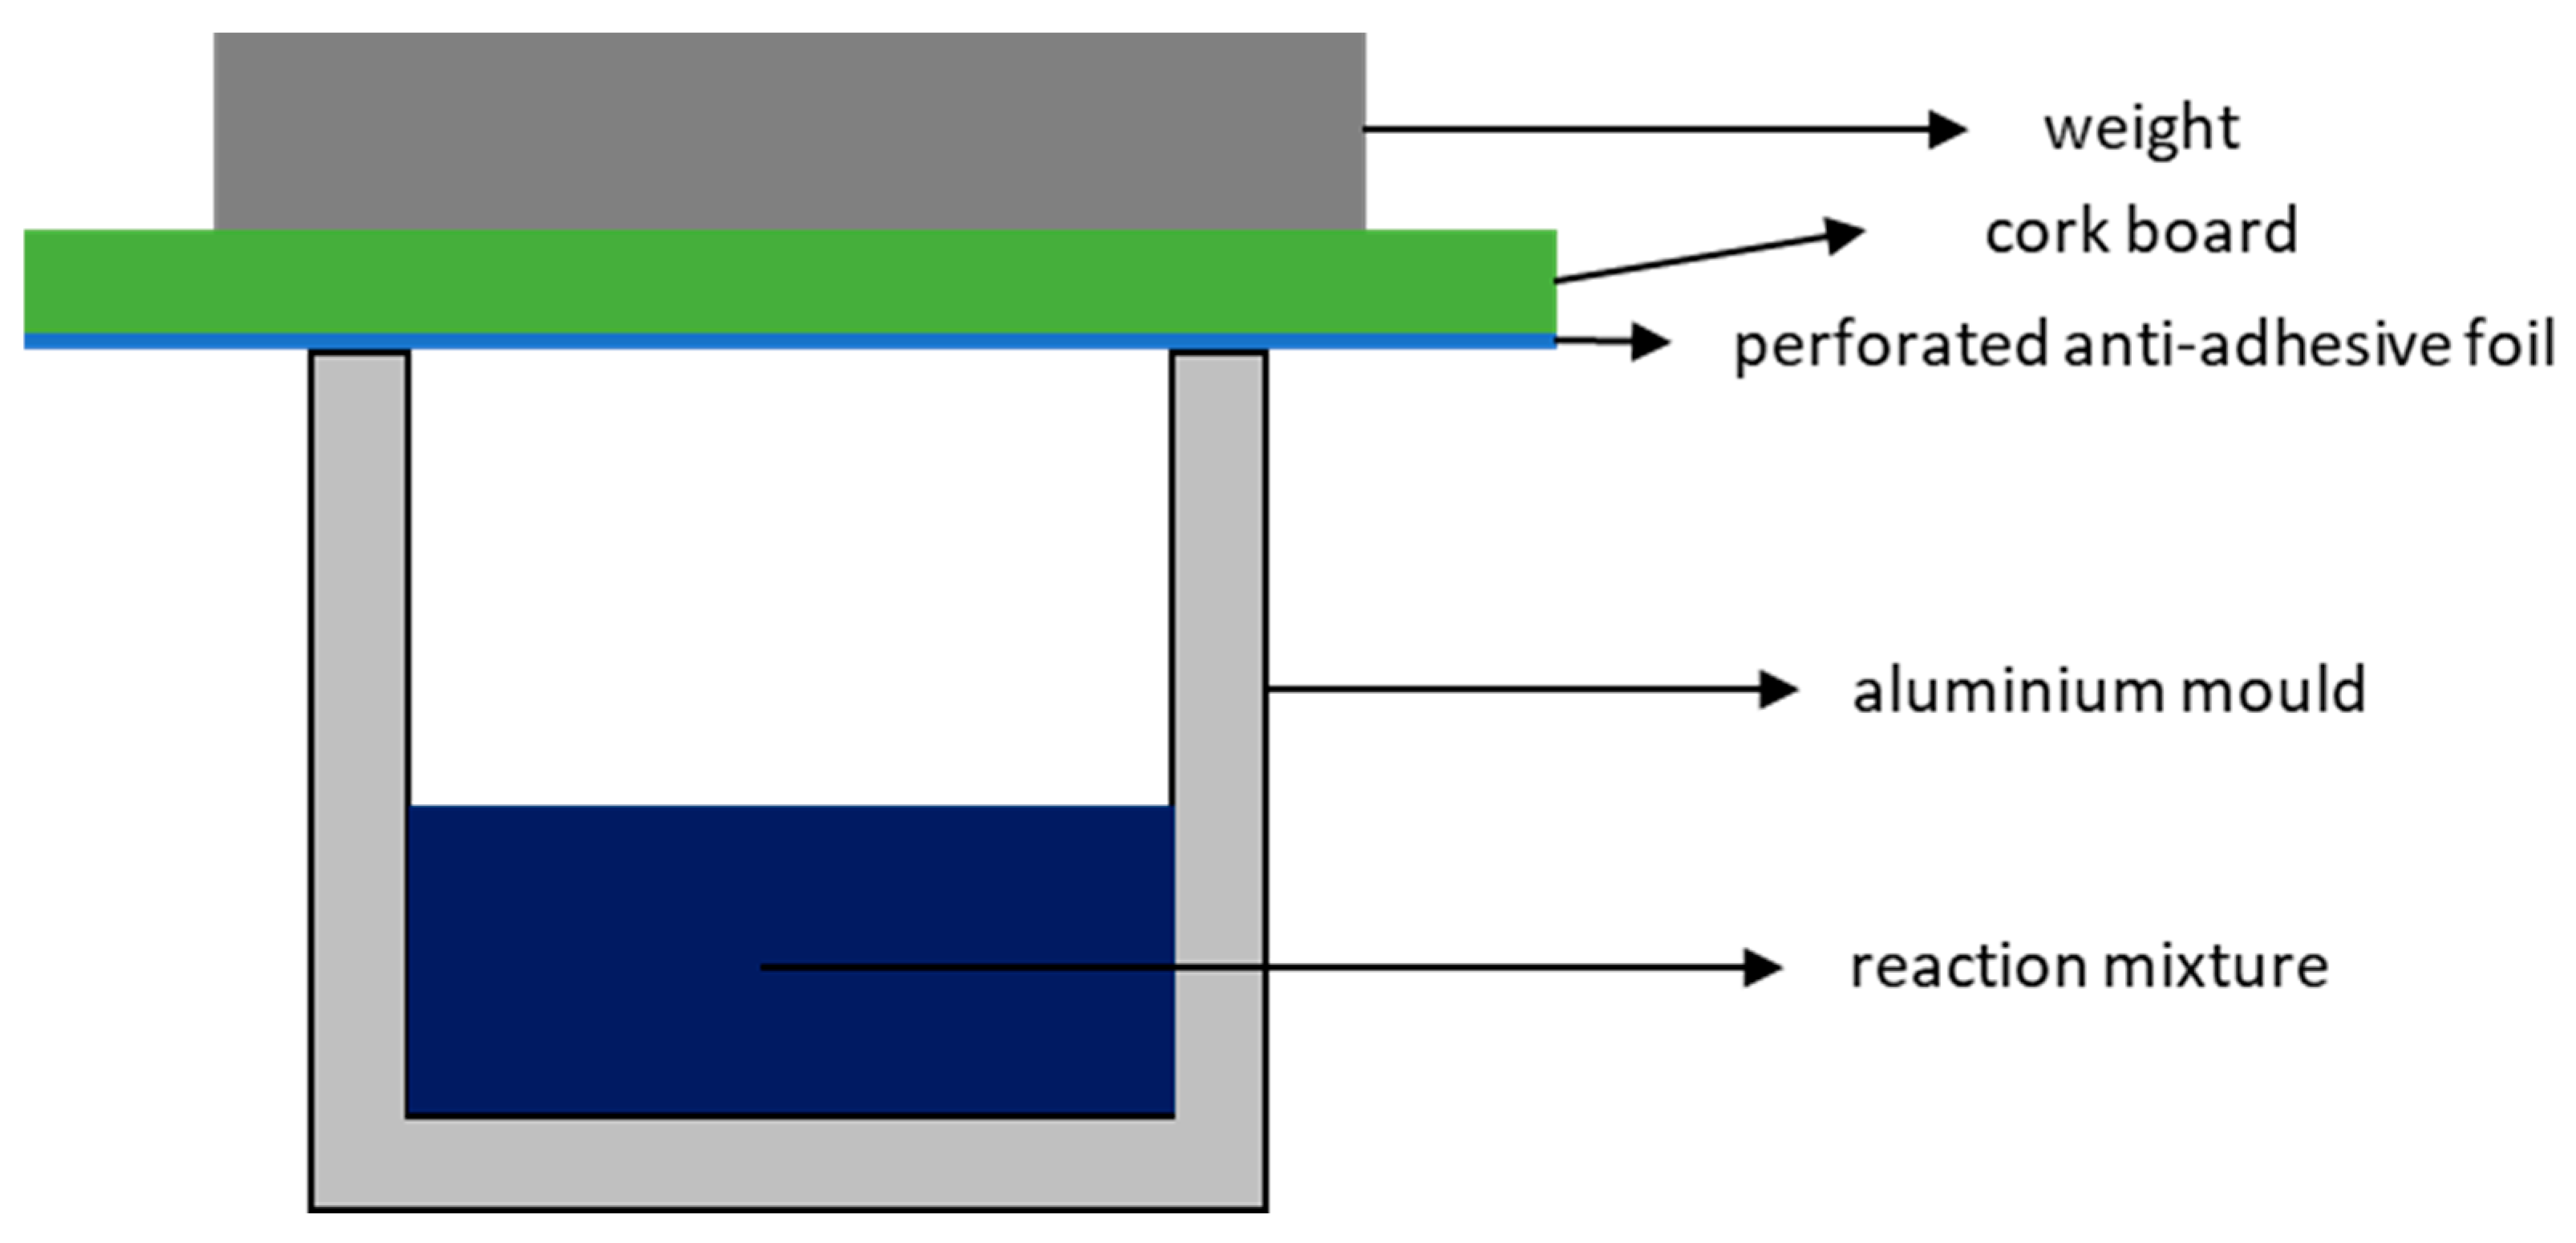
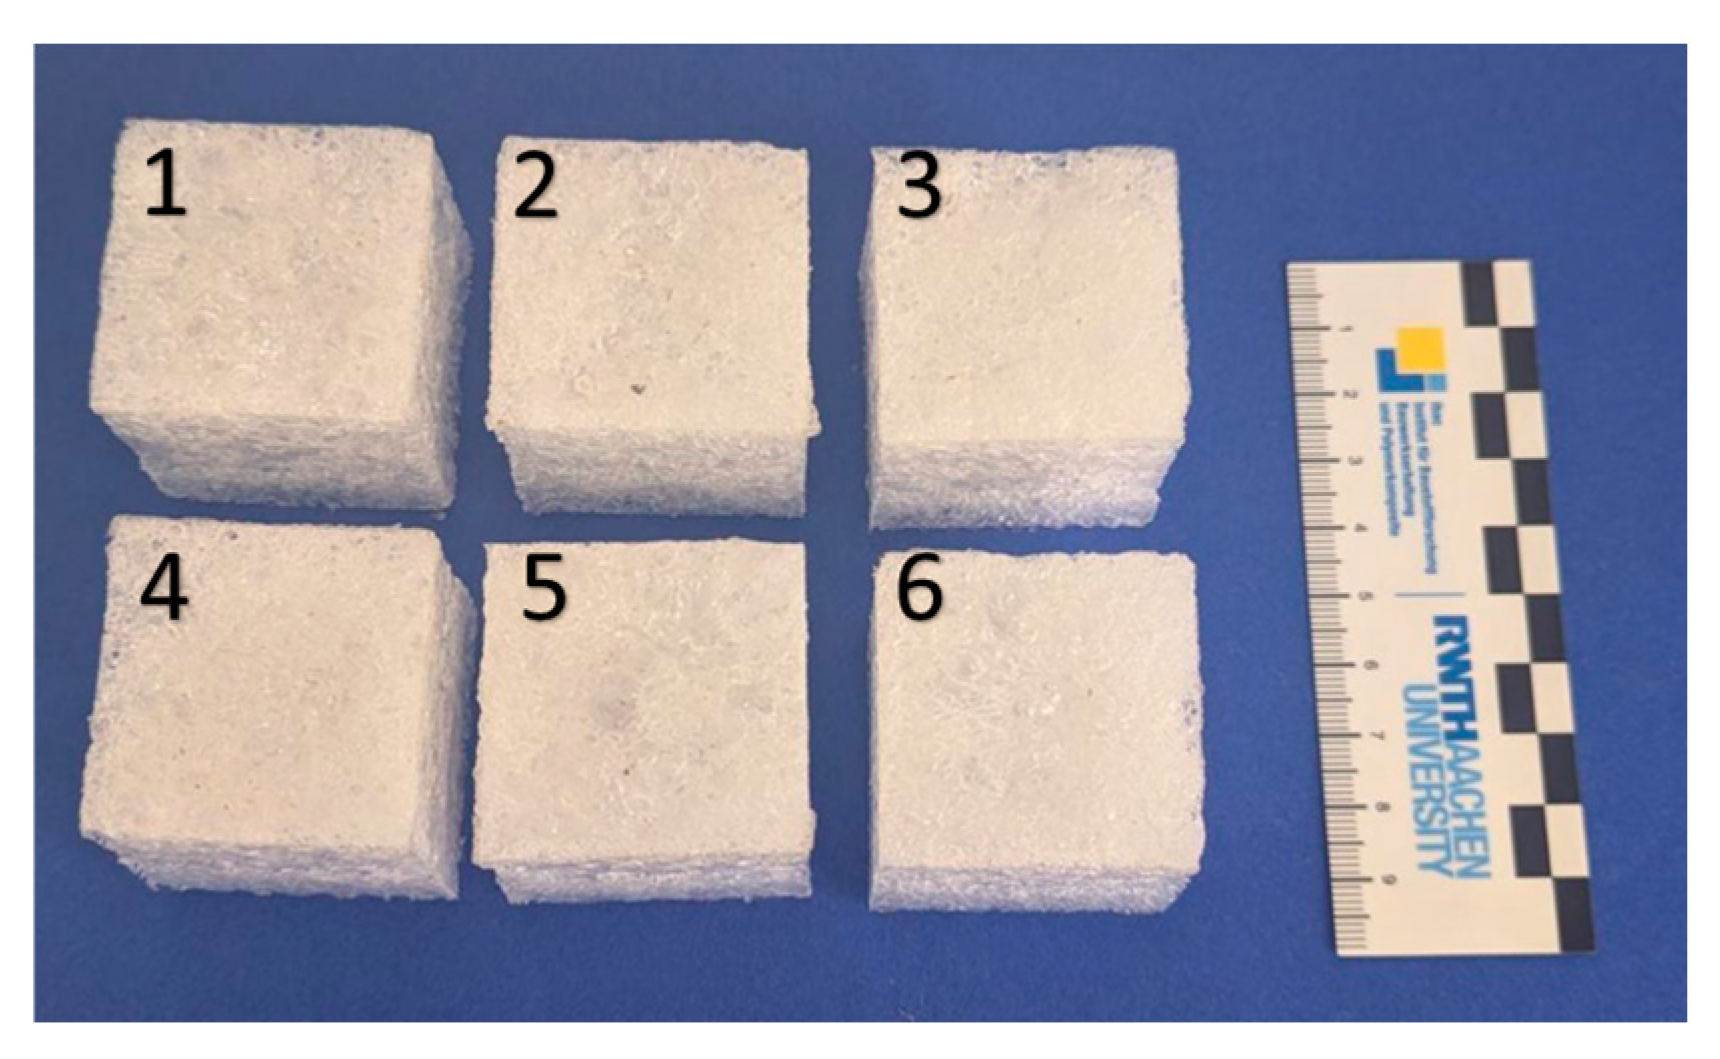
Therefore, to evaluate the physical and thermal properties of the foams, cubic specimens measuring 4 × 4 × 4 cm
3 were prepared in aluminium moulds lined with an anti-adhesive film (
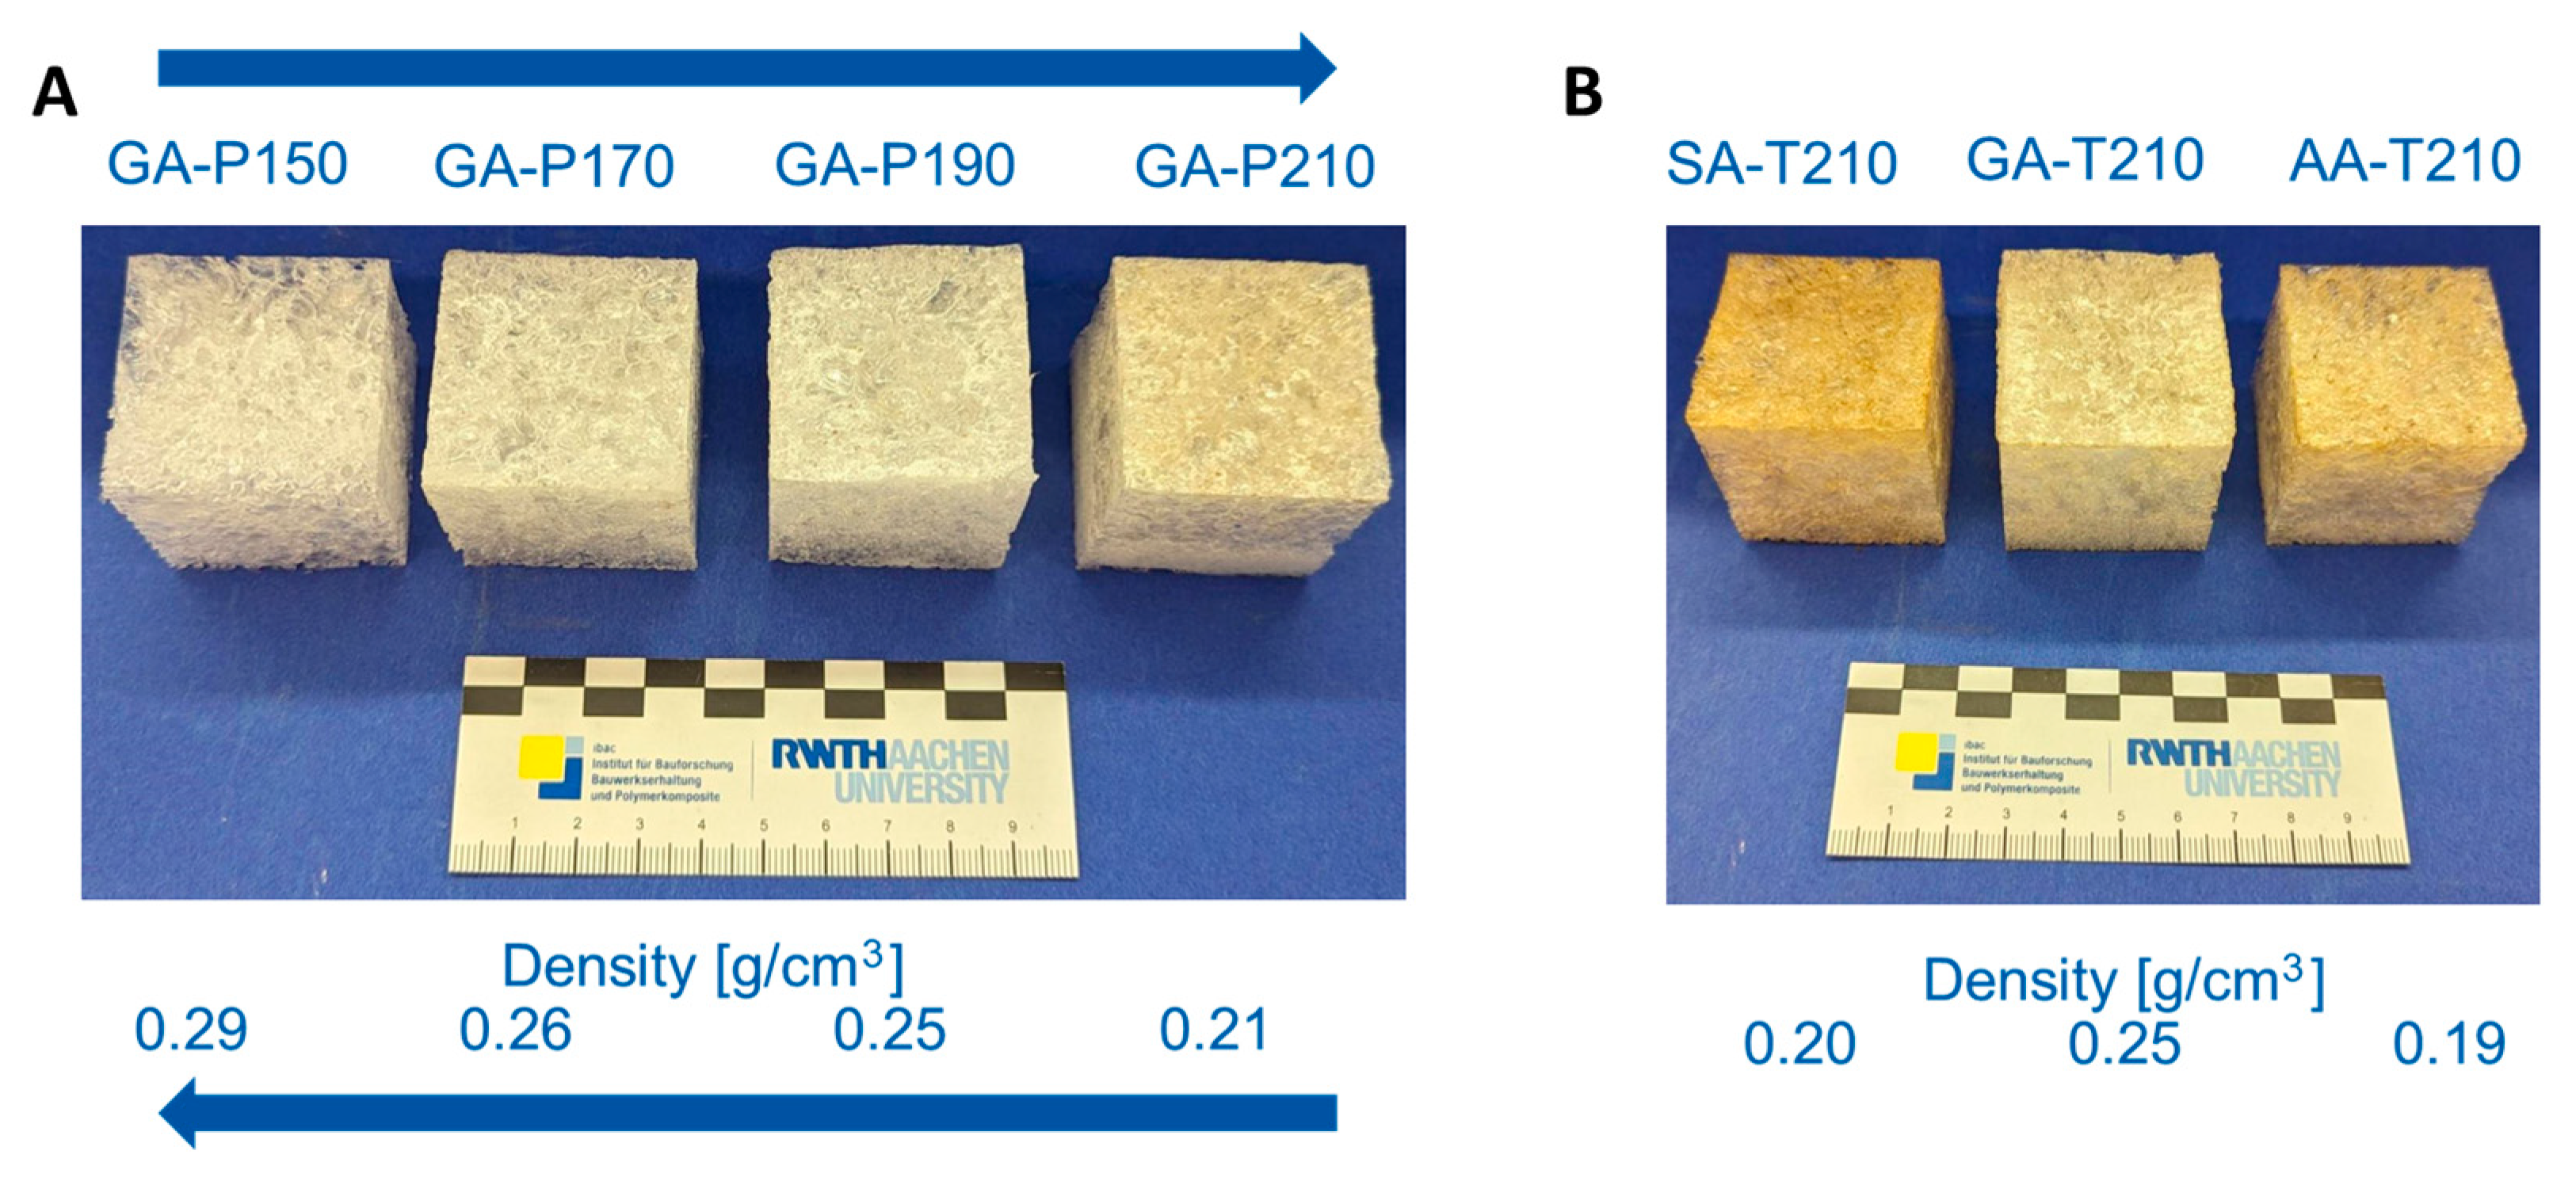
Figure 2). For large-scale preparation, the present set offers several degrees of freedom. Increasing the reaction temperature decreases the density of the foams. For example, in the GA-P system, the density decreases from 0.29 g/cm
3 at 150 °C to 0.21 g/cm
3 at 210 °C (
Figure 9A). As shown in the reaction kinetics, the reaction rate increases with temperature. This faster reaction leads to the more rapid formation of water, which evaporates and drives the foaming process. Additionally, accelerated curing promotes better stabilization of the resulting foam. Consequently, foam is formed more quickly, achieving a lower density, similar to the effect of an increased blowing agent potential. On the other hand, the variation in the chain length of the acid does not lead to a clear trend in the densities (
Figure 9B). The reason why GA-T produces foams with higher densities is unclear, as the only observable difference is that GA is an odd-numbered dicarboxylic acid. However, glutaric acid not being in line with the trend of SA and AA matches the macroscopic appearance of the foams with succinic and adipic acid tending to produce more rigid materials, whereas all foams based on glutaric acid are pliable. A strong influence on the macroscopic appearance is also observed by varying the crosslinking density, as all materials using pentaerythritol (P) showed a significant increase in the apparent hardness. This is explained by the higher crosslinking density compared to T, which results in a more rigid molecular structure and implies that all hydroxy groups of P are active during the polymerisation.
Another degree of freedom is the amount of starting material that is put into the moulds at the beginning of the reaction.
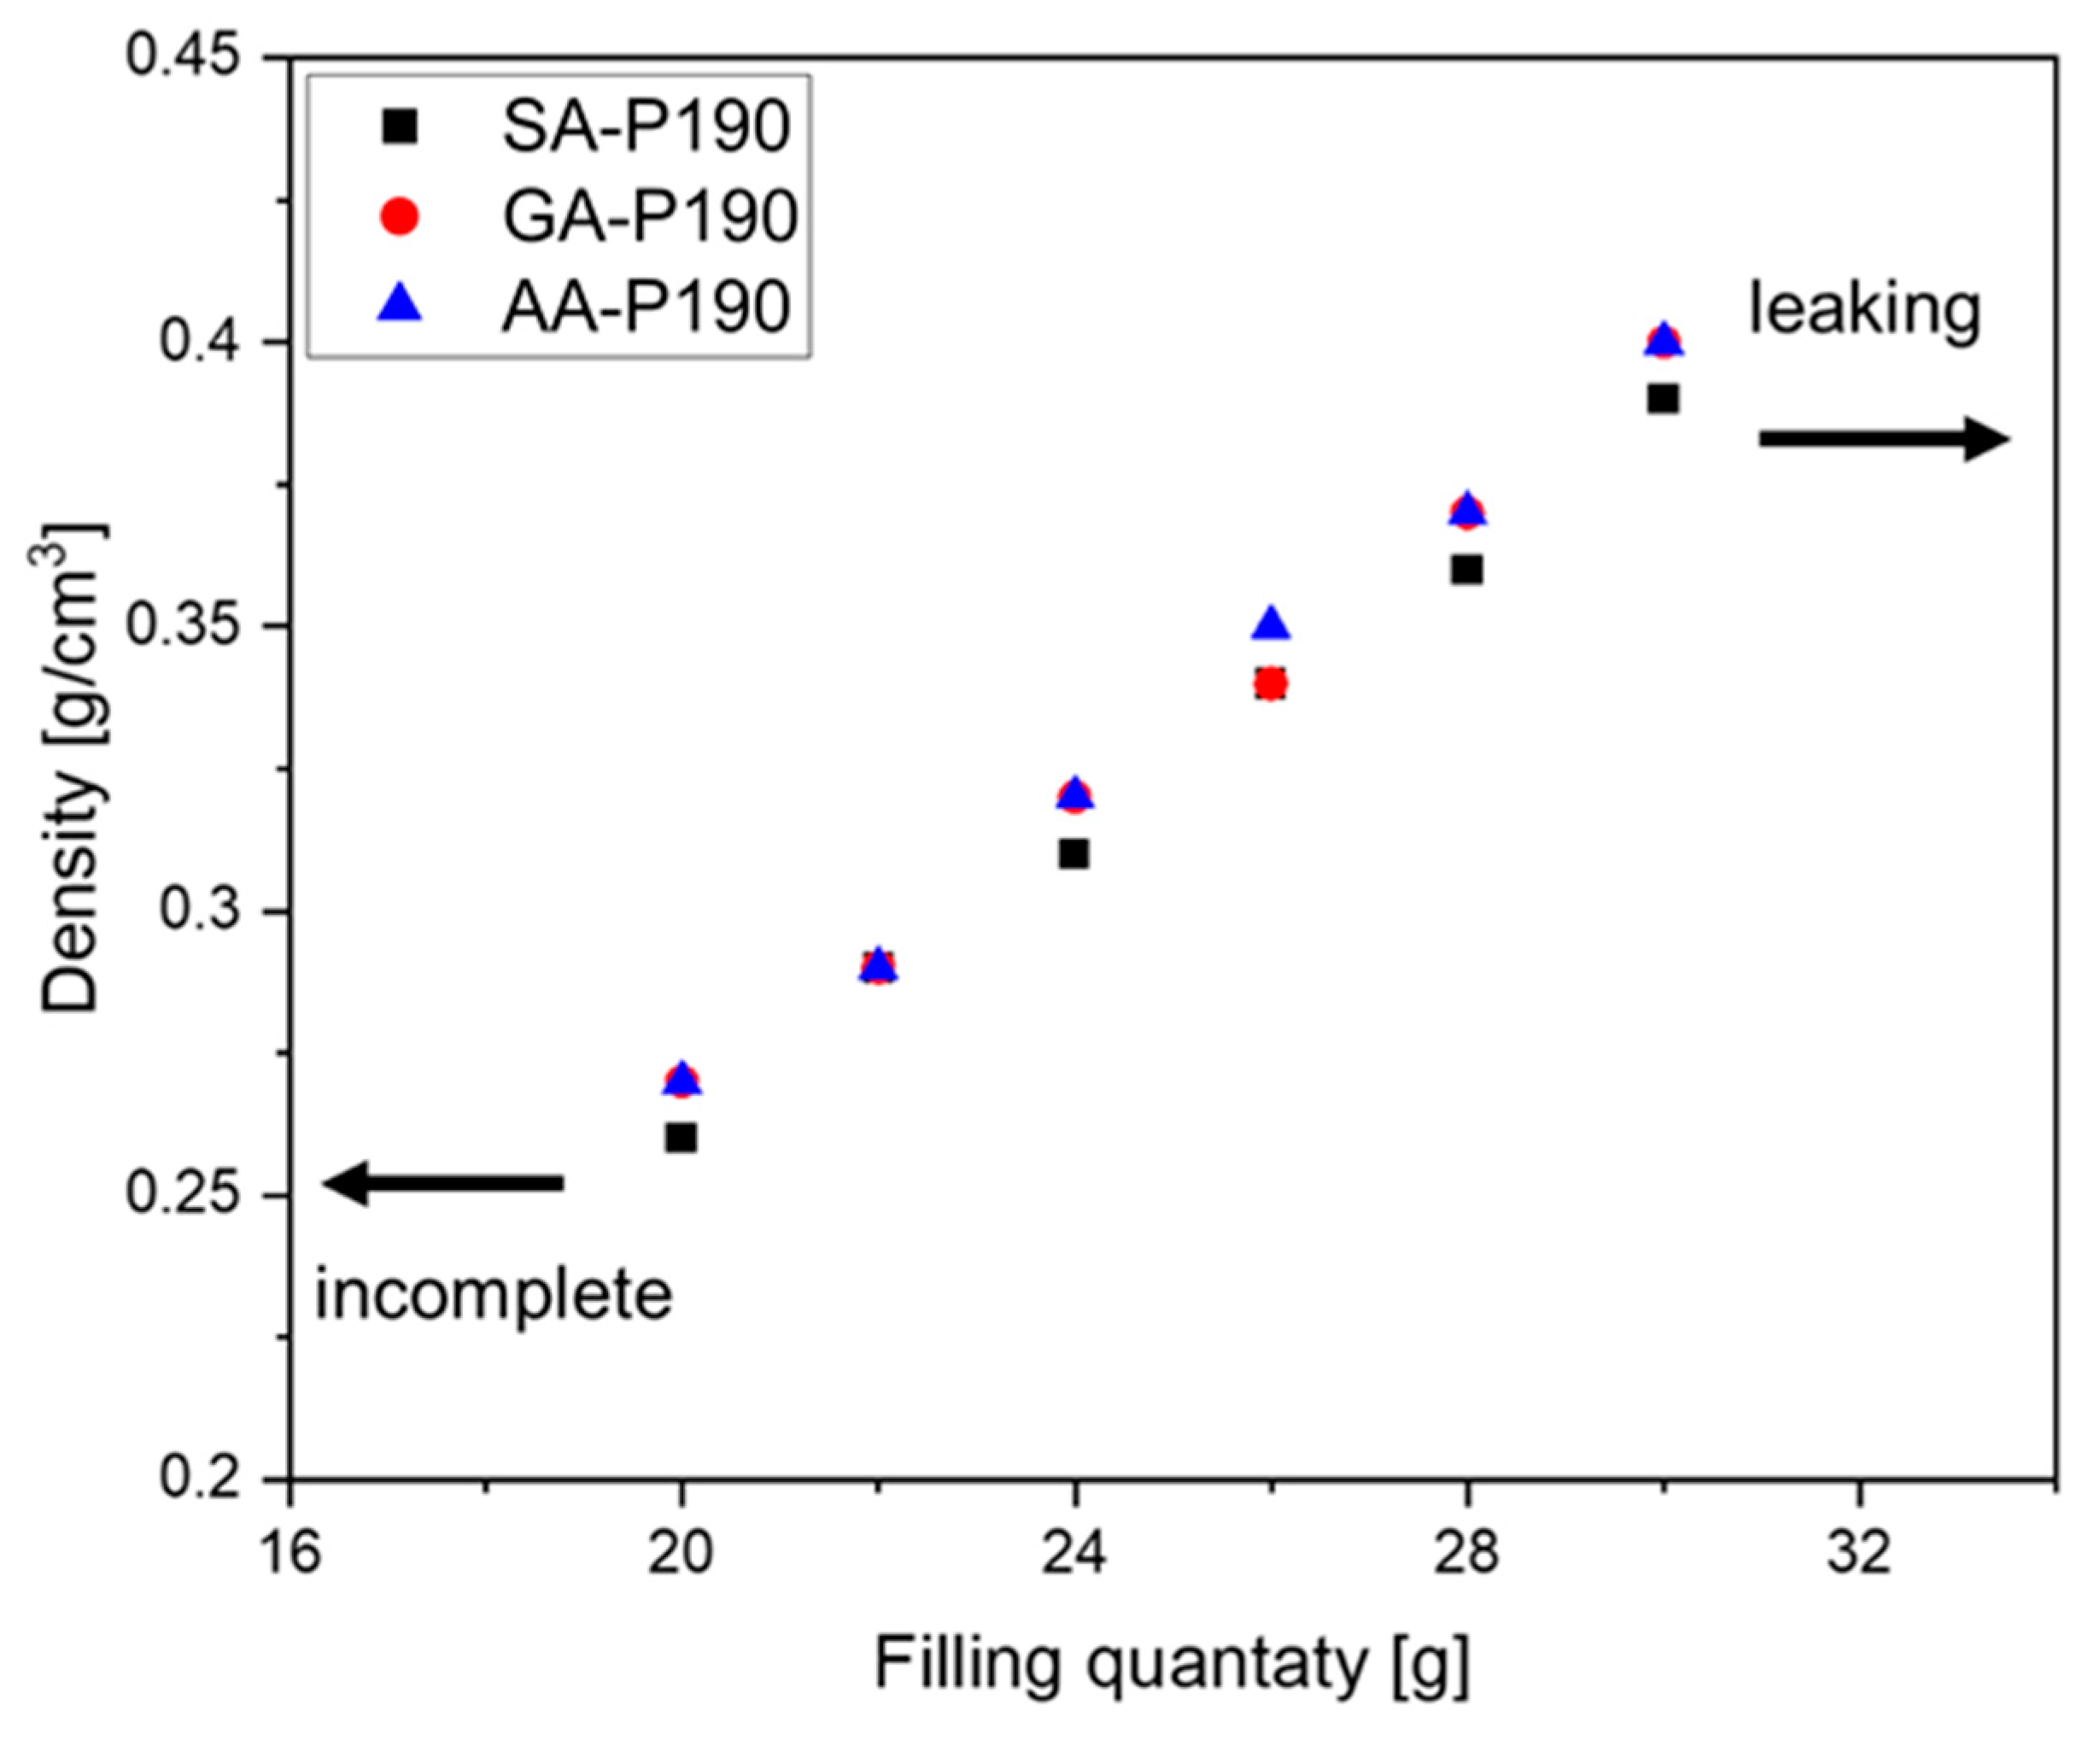
Figure 10 shows the dependence using the GA-P system at 190 °C as an example. As the foams are produced in a partially closed mould (
Figure 2) to allow water vapour to evaporate and the pressure to equilibrate, the resulting density depends on the filling quantity. For our 4 × 4 × 4 cm
3, the limit lies between incomplete foaming at <20 g and leaking of the material at the top end at >30 g. As a result, foams with densities ranging from 0.26 g/cm
3 to 0.40 g/cm
3 could be produced, and each sample matches the theoretical value calculated from the filling mass divided by 64 cm
3, taking into account the mass loss during polycondensation. The reason why less than 20 g of material does not completely fill the mould with foam is, therefore, that the volume of water vapour available for the foam formation is insufficient, and too much escapes the mould.
In order to reduce the discolouration observed with long reaction times and high reaction temperatures, the preparation of the test specimens was slightly modified based on the observations made in
Figure 4 and
Figure 5. As stated above, foaming occurs in a rather limited time frame, and further conversion of the functional groups mainly consolidates the polyester framework surrounding the bubbles. Thus, when limiting the time at the given reaction temperature to the time interval of foam formation and subsequently consolidating the foam at lower temperatures, e.g., below 130 °C, the discolouration could be completely avoided and the decomposition prevented (
Figure 11) compared to the previous test specimen (
Figure 9). An overview of all test specimens, including measured mass loss, calculated conversion, and the resulting densities, is provided in
Tables S3 and S4 of Supplementary Materials.
3.5. Thermal Conductivity
In order to get an indication of the thermal conductivity of the foams, the cubic specimens were placed in a tight-fitting frame made from a commercial polyurethane (PUR) thermal insulation foamboard and placed on a hotplate at 80 °C. The temperature was recorded every 5 min using a thermal imaging camera during heating for 60 min and subsequent cooling (
Figures S12 and S13 in Supplementary Materials). The corresponding images at 0 min and after 60 min for the P-system with a density of 0.25 g/cm
3 are shown in
Figure 12, and the course of the sample temperature during heating and cooling is shown in
Figure 13. It was, however, not possible with this method to compare the performance of the present foams with a commercial reference, such as EPS or XPS. Thermal imaging reacts very sensitively to changes in the IR reflectivity so that materials with the same temperature but different reflectivity appear to have different temperatures. This effect can clearly be seen in the left image of
Figure 12, where the PUR-foam frame appears significantly brighter than the samples, but both are still at room temperature.
It was observed that all materials showed a temperature between 19.6 and 20.7 °C at the beginning (room temperature 20 °C). After heating on a hot plate at 80 °C for 60 min, all materials showed temperatures of up to 29.7 to 31.6 °C. It must be mentioned that the surface of the specimens shows an uneven colouration, which indicates different temperatures. This is mainly due to inhomogeneities due to the open-cell foam structure, which results in a different heat transfer depending on whether there is a cavity or wall structure at the point of measurement. To compensate for this, the point of measurement was kept the same during the experiment. Plotting the measured temperatures over time revealed a linear increase during the first 35 min of heating, which levels off after approximately 50 min (
Figure 13). Here, the supply of thermal energy from the hotplate to the sample and its discharge into the surroundings have reached an equilibrium. In contrast, the cooling proceeded linearly until the samples reached room temperature. No difference in thermal conduction or radiation could be observed for the samples in the P-system.
With the density increasing to 0.34 g/cm
3, a difference in the measured surface temperature was observed in the various systems (
Figure 14, see also
Figures S14 to S17 in Supplementary Materials). It was found that the surface temperature of SA-P to GA-P and then to AA-P continued to decrease with increasing chain length. This can be due to better pore stabilisation due to lower steric hindrance in the system with increasing chain length. Hardly any differences were observed between the different densities within a system (
Figure S14 in Supplementary Materials). This could be due to different heat reflection, as the differences were measured in different rows to the front and not in one row with the same sample. For further investigation, a different measurement for the thermal conductivity should be considered. A comparison with EPS, XPS, and PUR is shown in
Supplementary Materials (Figure S18), where significant heat radiation was also observed.
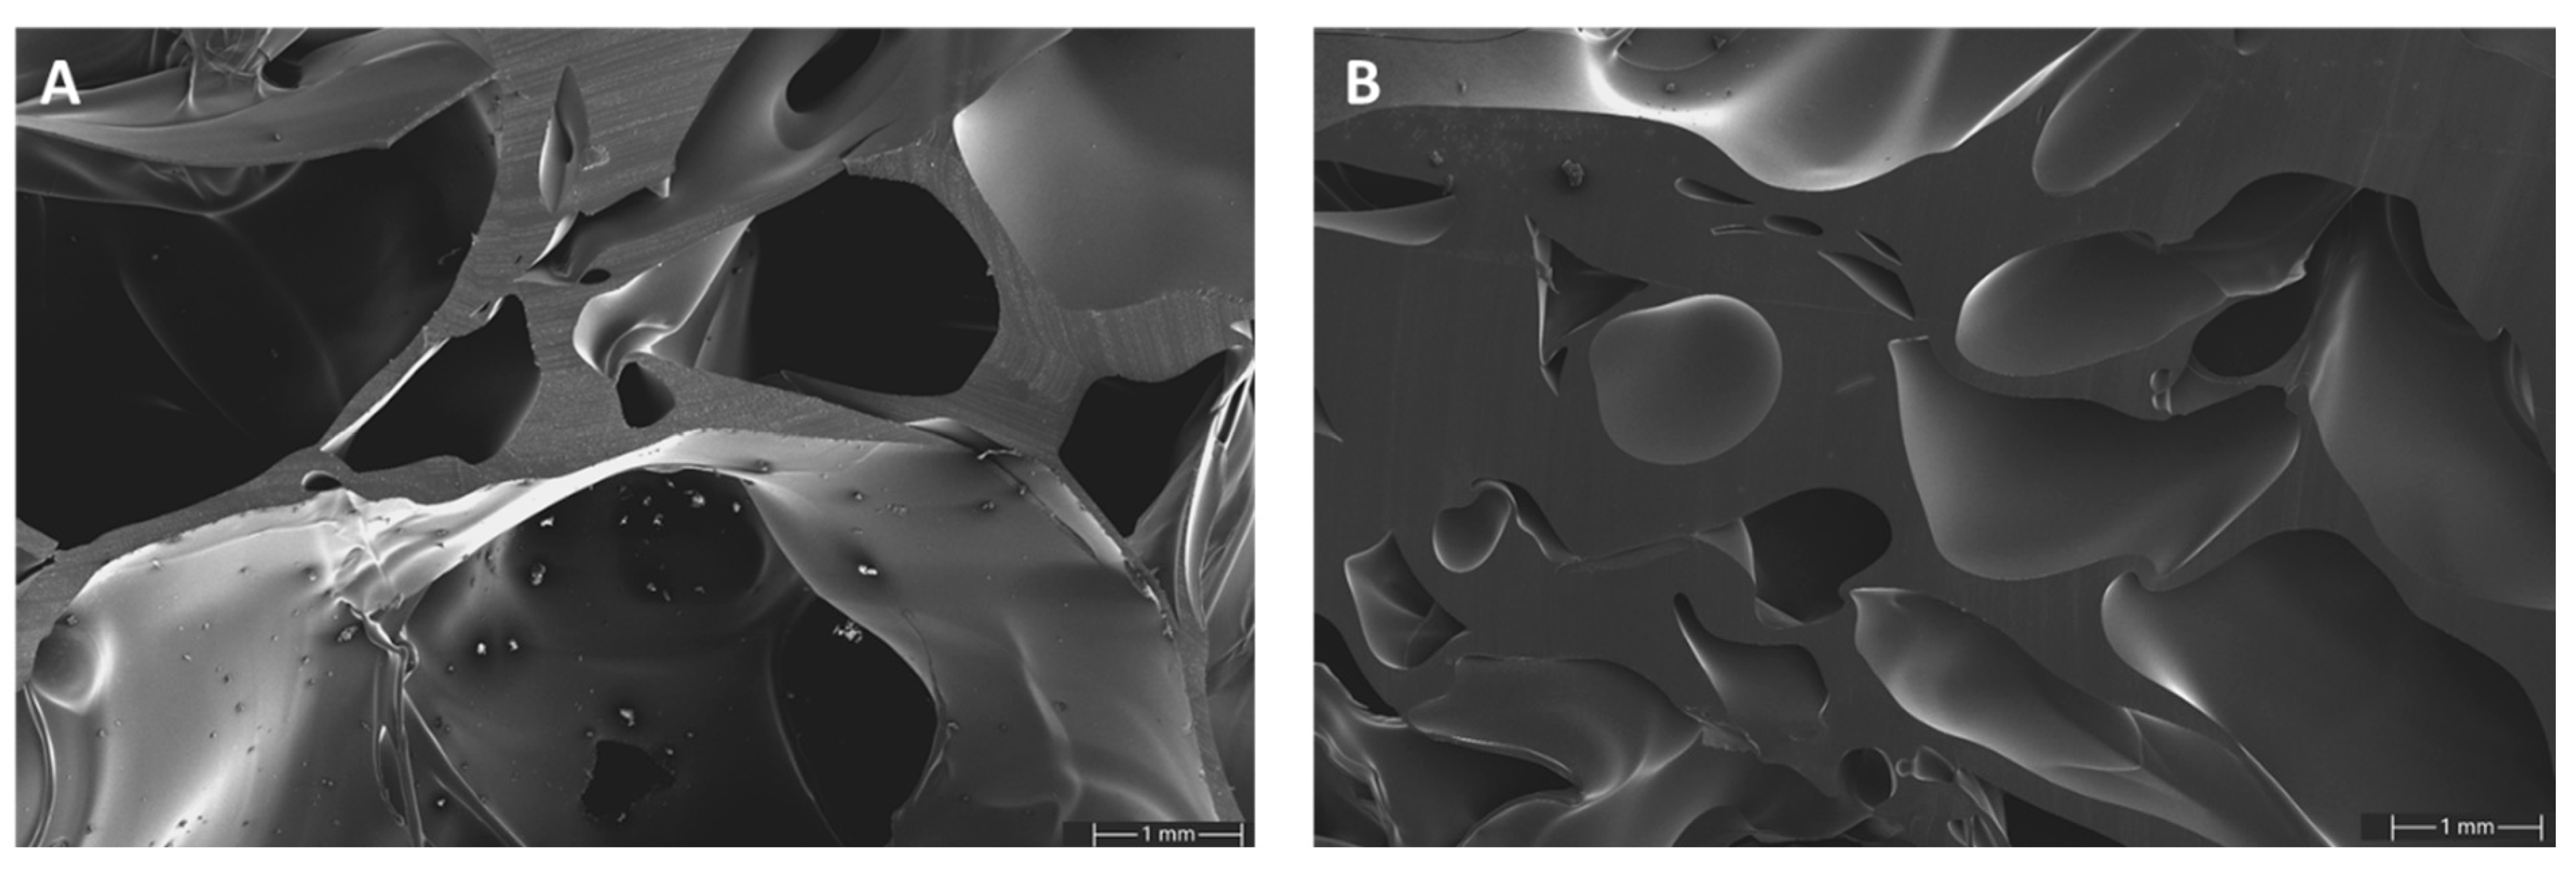
SEM images of GA-P190 were taken at two different densities to gain a more detailed understanding of the pore morphology and cell wall structure (
Figure 15). At a lower density, the foam exhibits a predominantly open-cell structure with relatively thin cell walls. The majority of the pores appear to be interconnected, although the presence of small, closed cells cannot be entirely ruled out. In contrast, the higher-density sample reveals a more compact microstructure with significantly thicker cell walls and smaller pores. Notably, in both samples, the cell walls display an exceptionally smooth surface and lack any detectable microporosity, indicating a high degree of homogeneity in the polymer phase. These differences indicate that increasing the density of the material limits the extent of foam expansion during polymerisation, leading to reduced pore sizes and improved structural integrity. This correlation between density, pore architecture, and wall thickness plays a key role in determining the mechanical and thermal properties of the resulting foam. Furthermore, at higher magnification, microcrystalline structures become visible. An EDX analysis confirmed the presence of sulphur, suggesting that these microcrystals consist of
p-toluenesulfonic acid, the catalyst used in the system. Since
p-toluenesulfonic acid is hydrophilic while the polymer matrix is hydrophobic, the catalyst is pushed out of the matrix during polymerization. Due to the limited mobility caused by the increasing rigidity of the curing polymer network, only small agglomerates can form, resulting in the observed microcrystalline structures (
Figure S19 and Table S5 in Supplementary Materials).

