
Impact and Failure Analysis of U-Shaped Concrete Containing Polyurethane Materials: Deep Learning and Digital Imaging Correlation-Based Approach

 ,
,  ,
,  ,
,
Abstract
1. Introduction
2. Materials and Methods
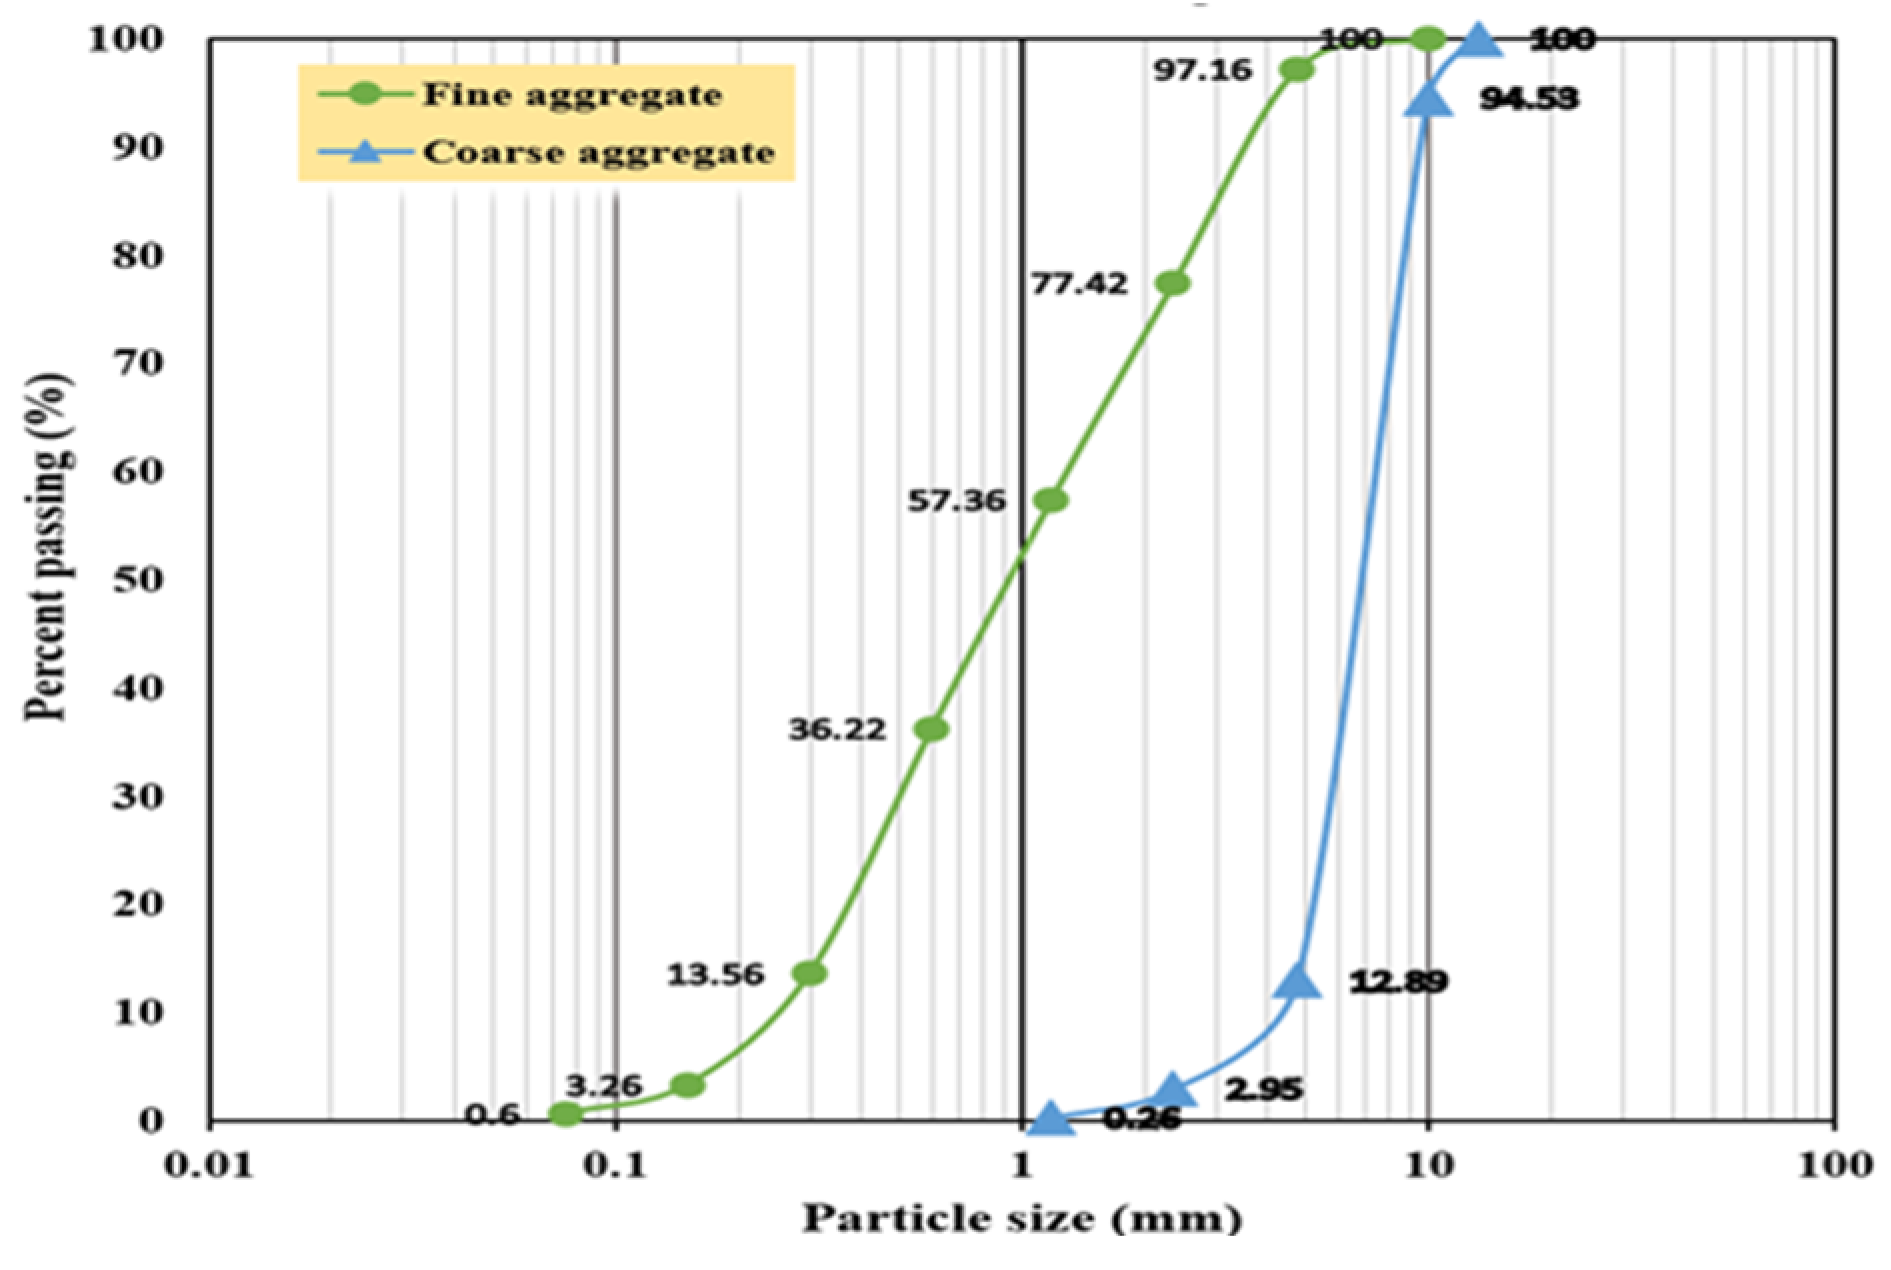
2.1. Materials
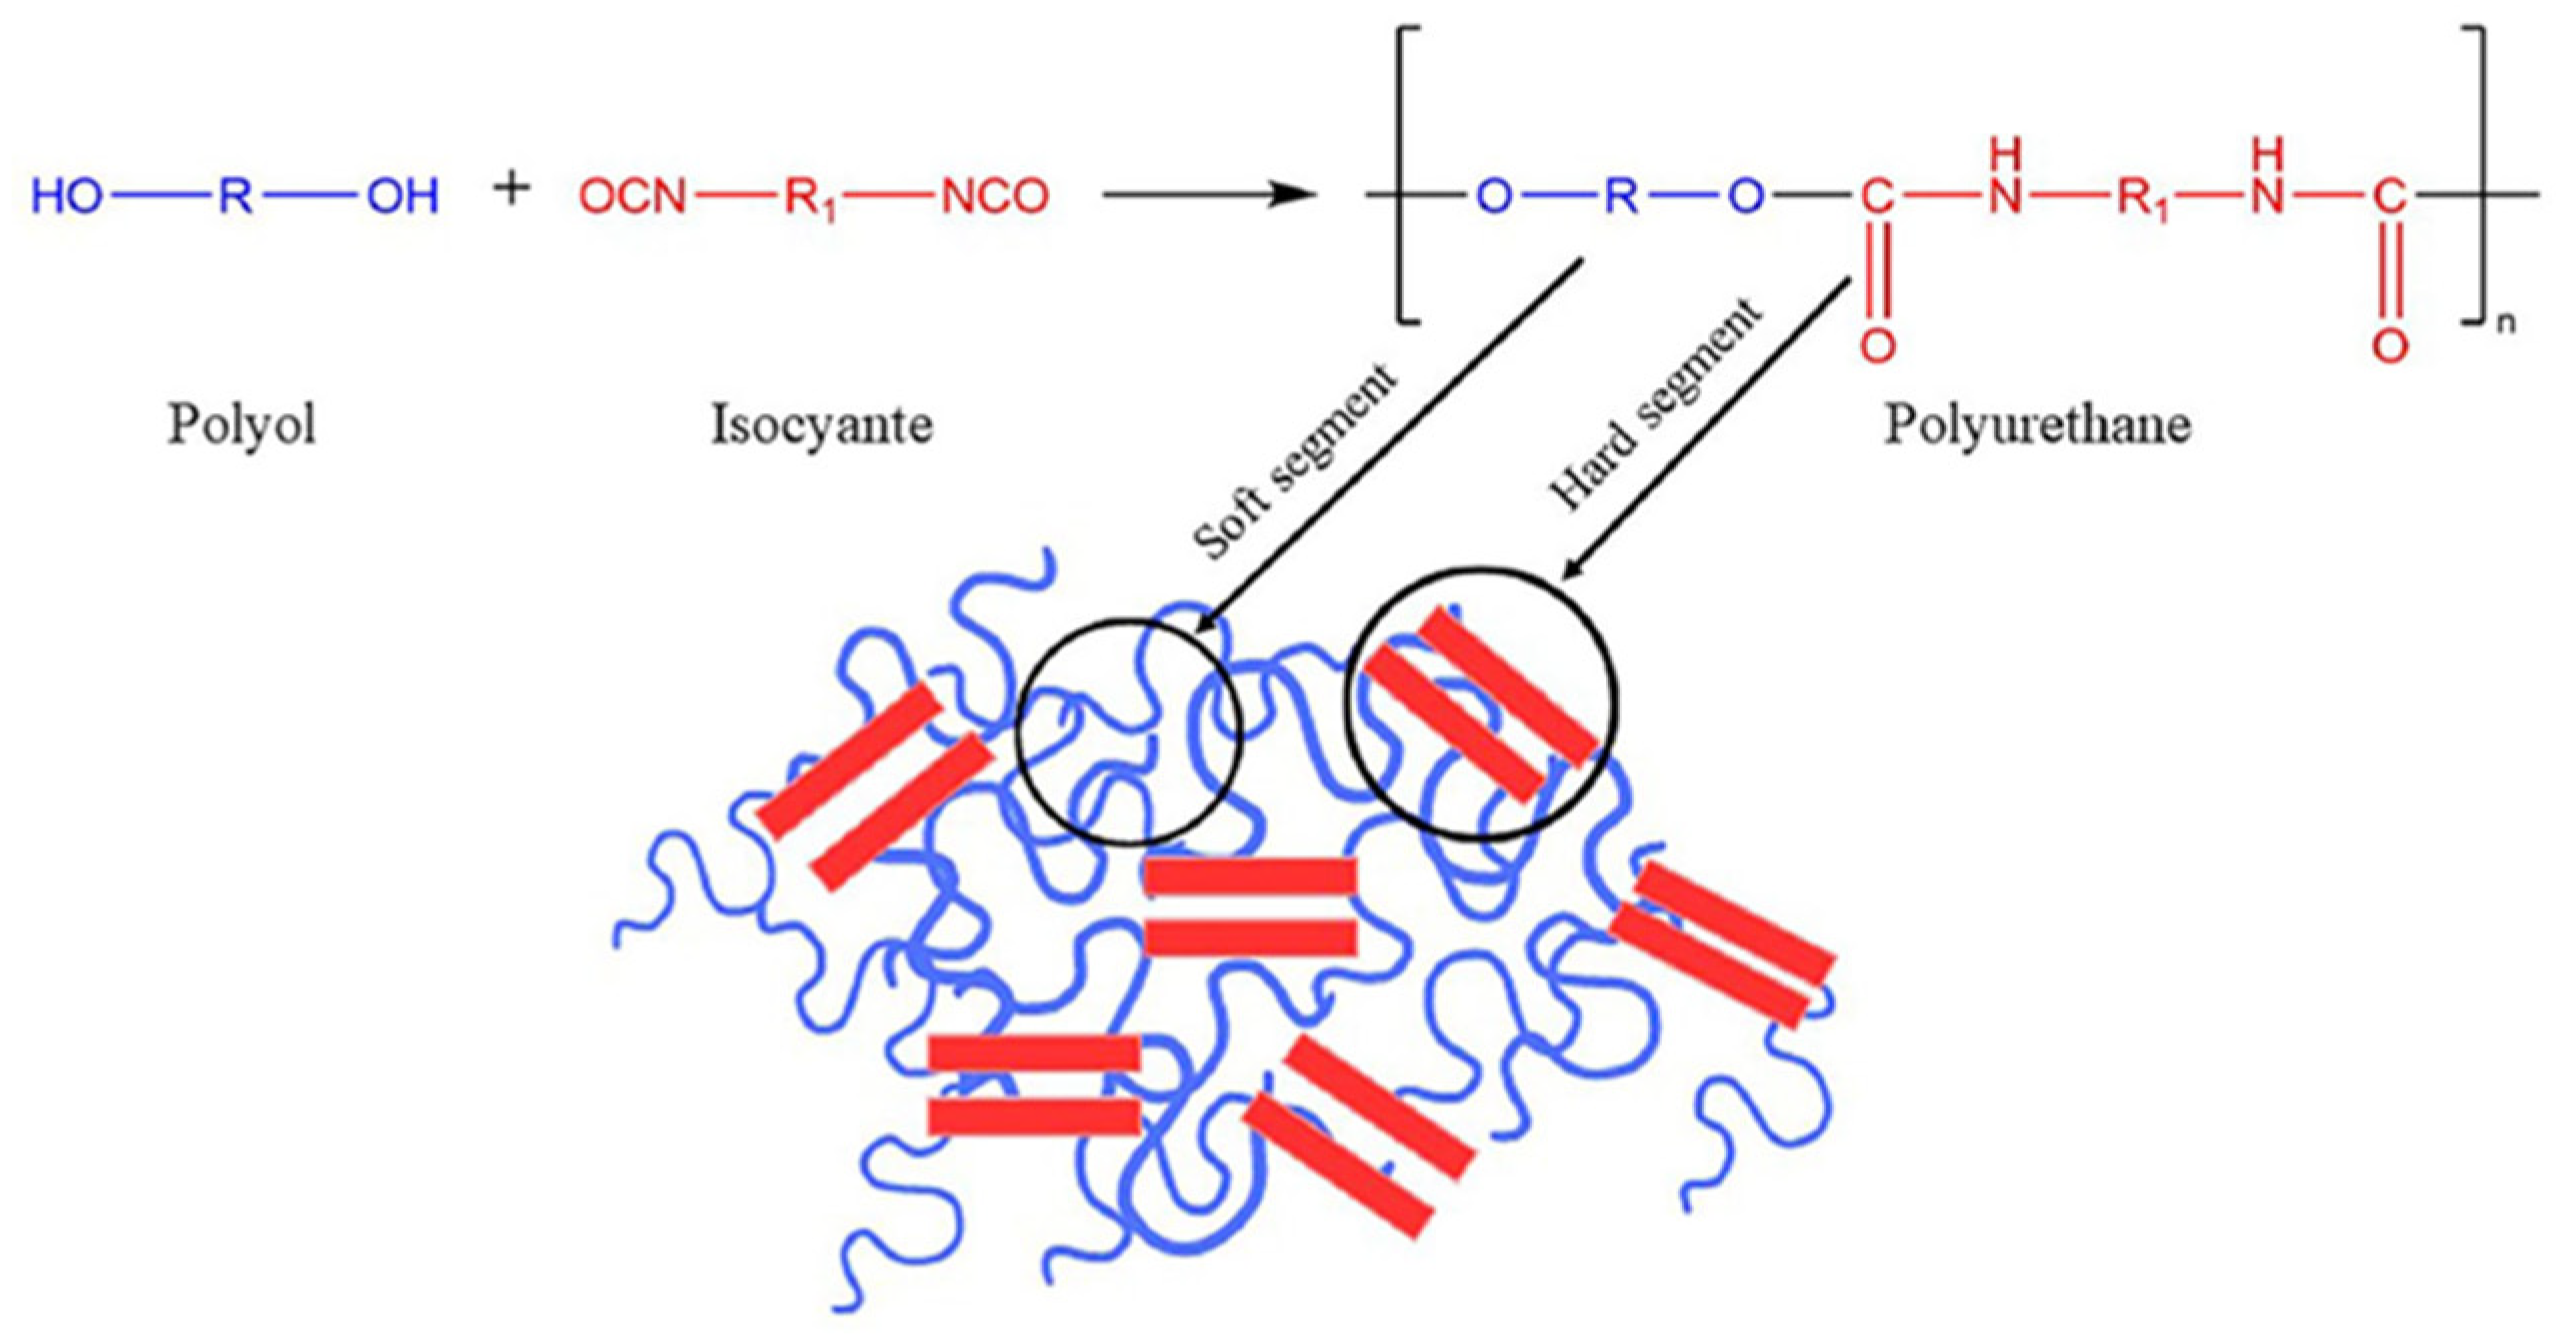
2.1.1. Polyurethane (PU) Structure
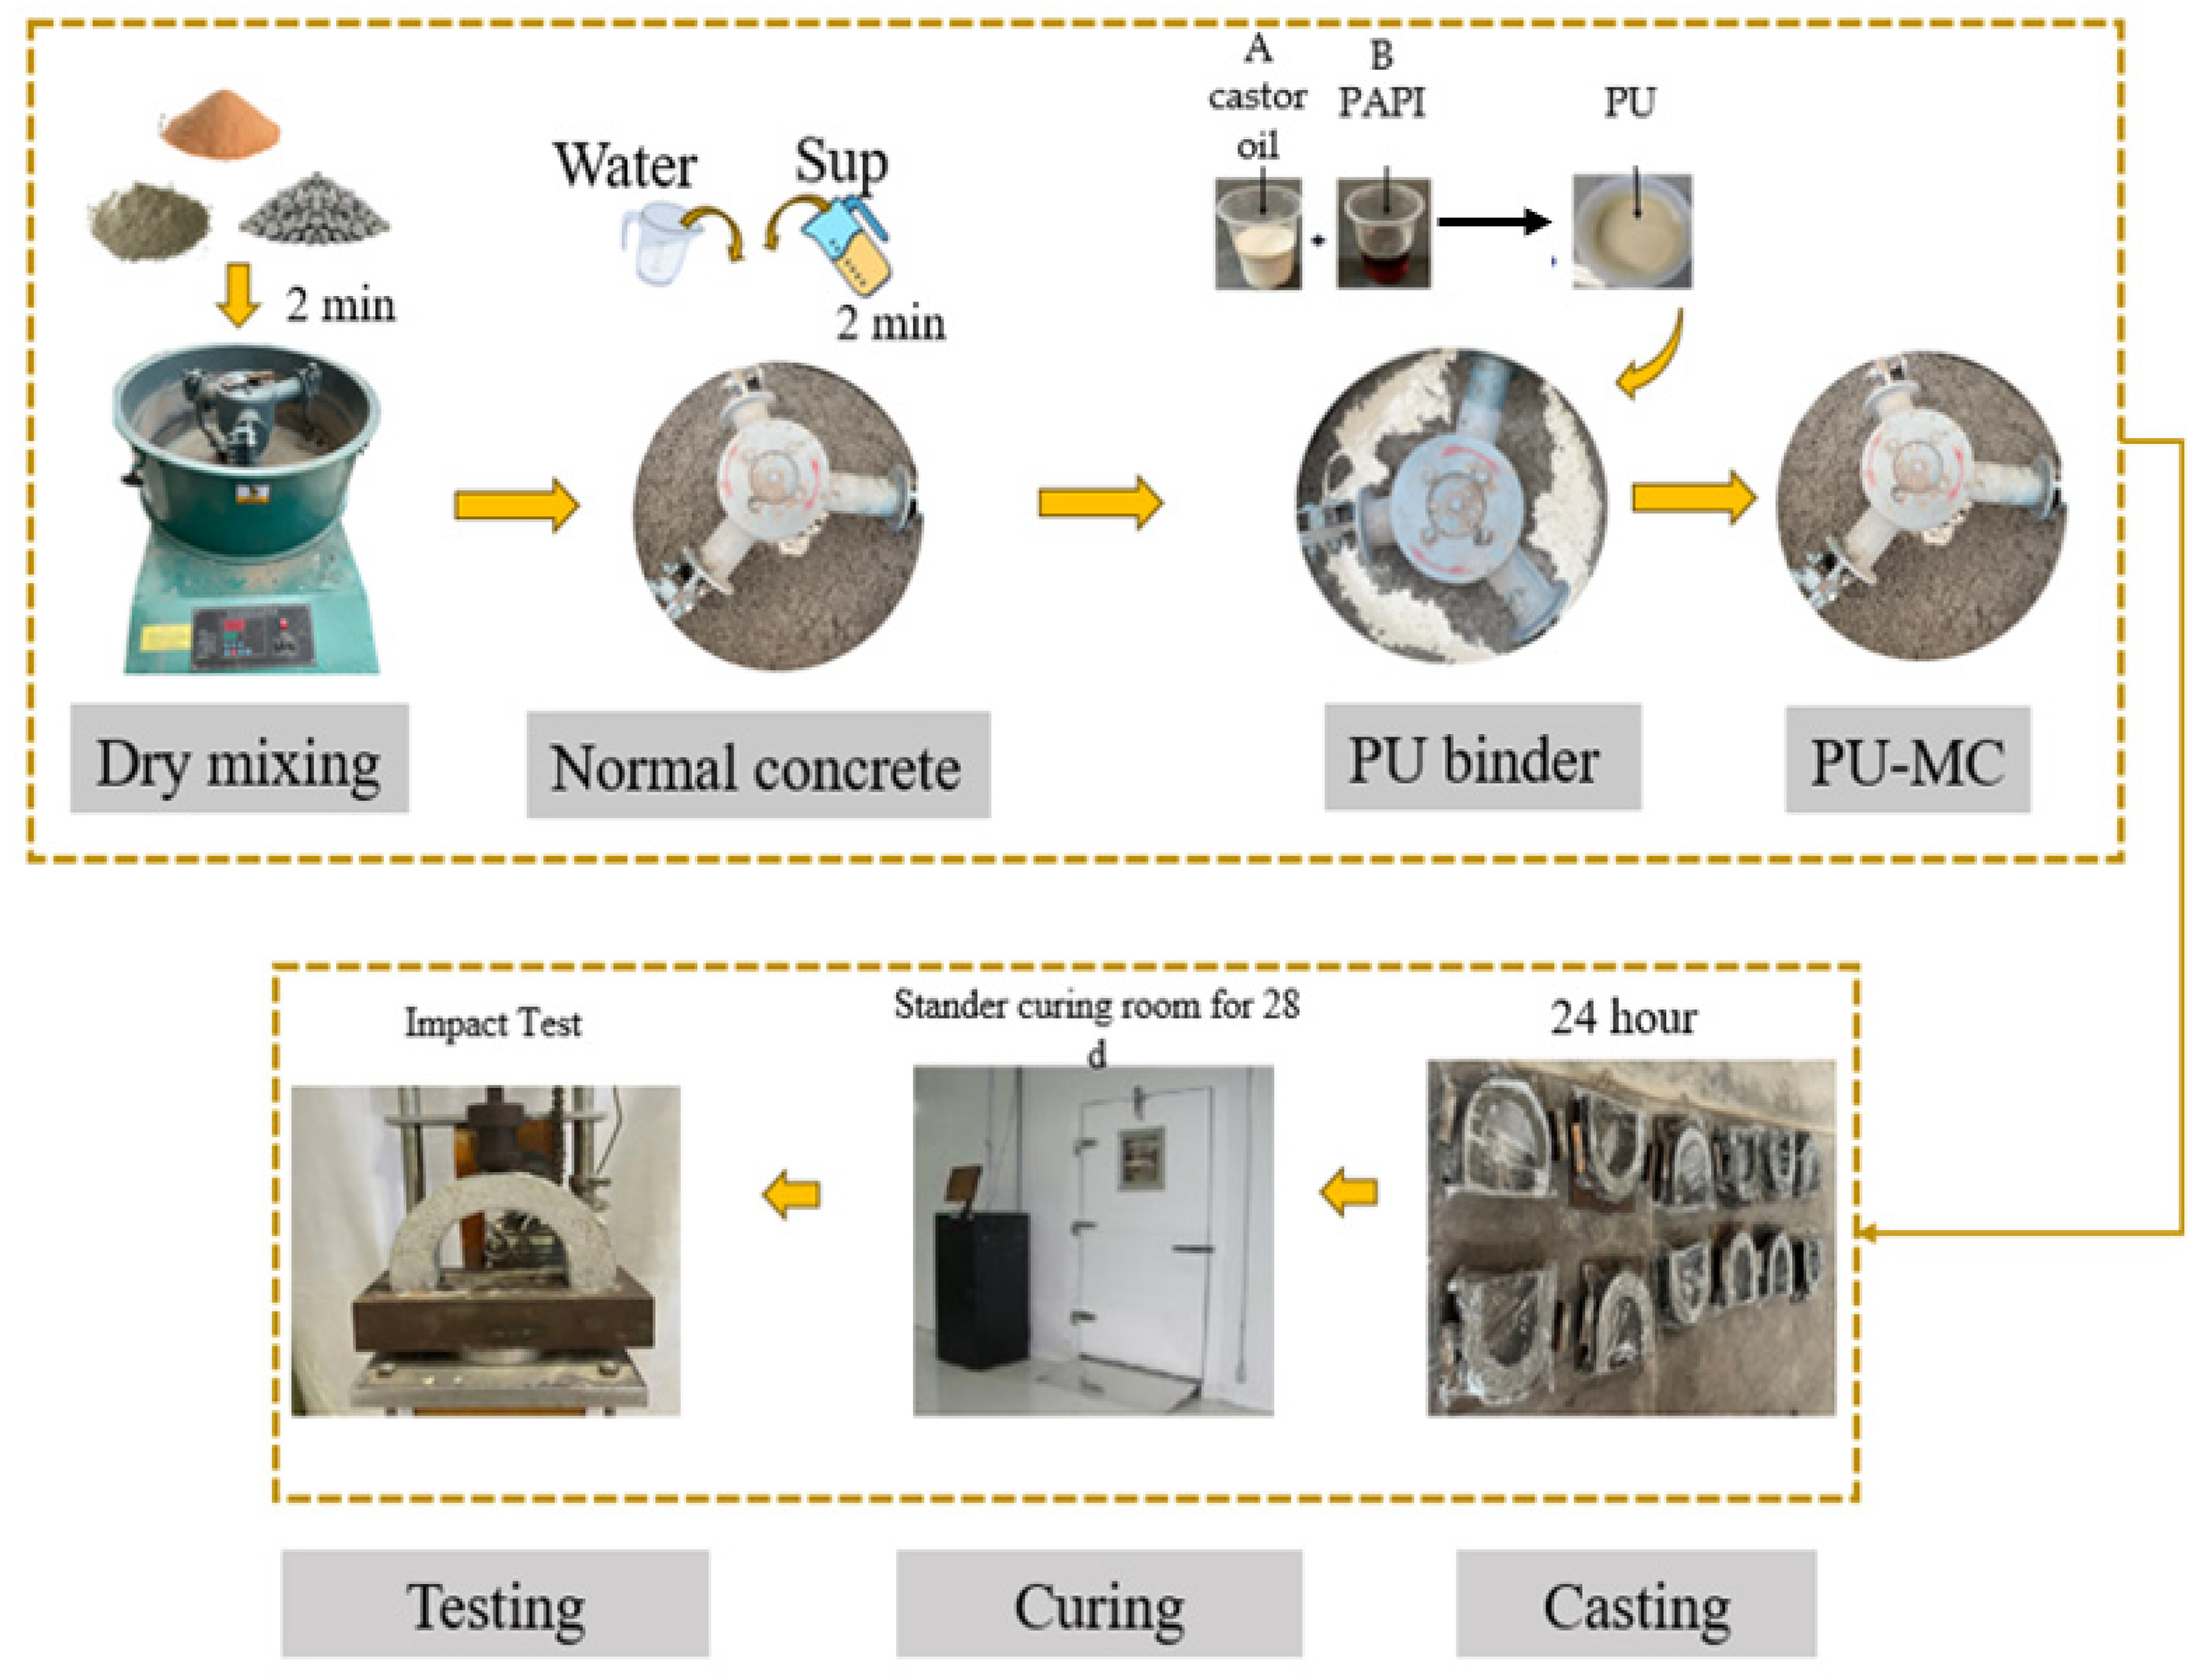
2.1.2. Mix Proportion and Specimen Preparation
2.2. Testing Method
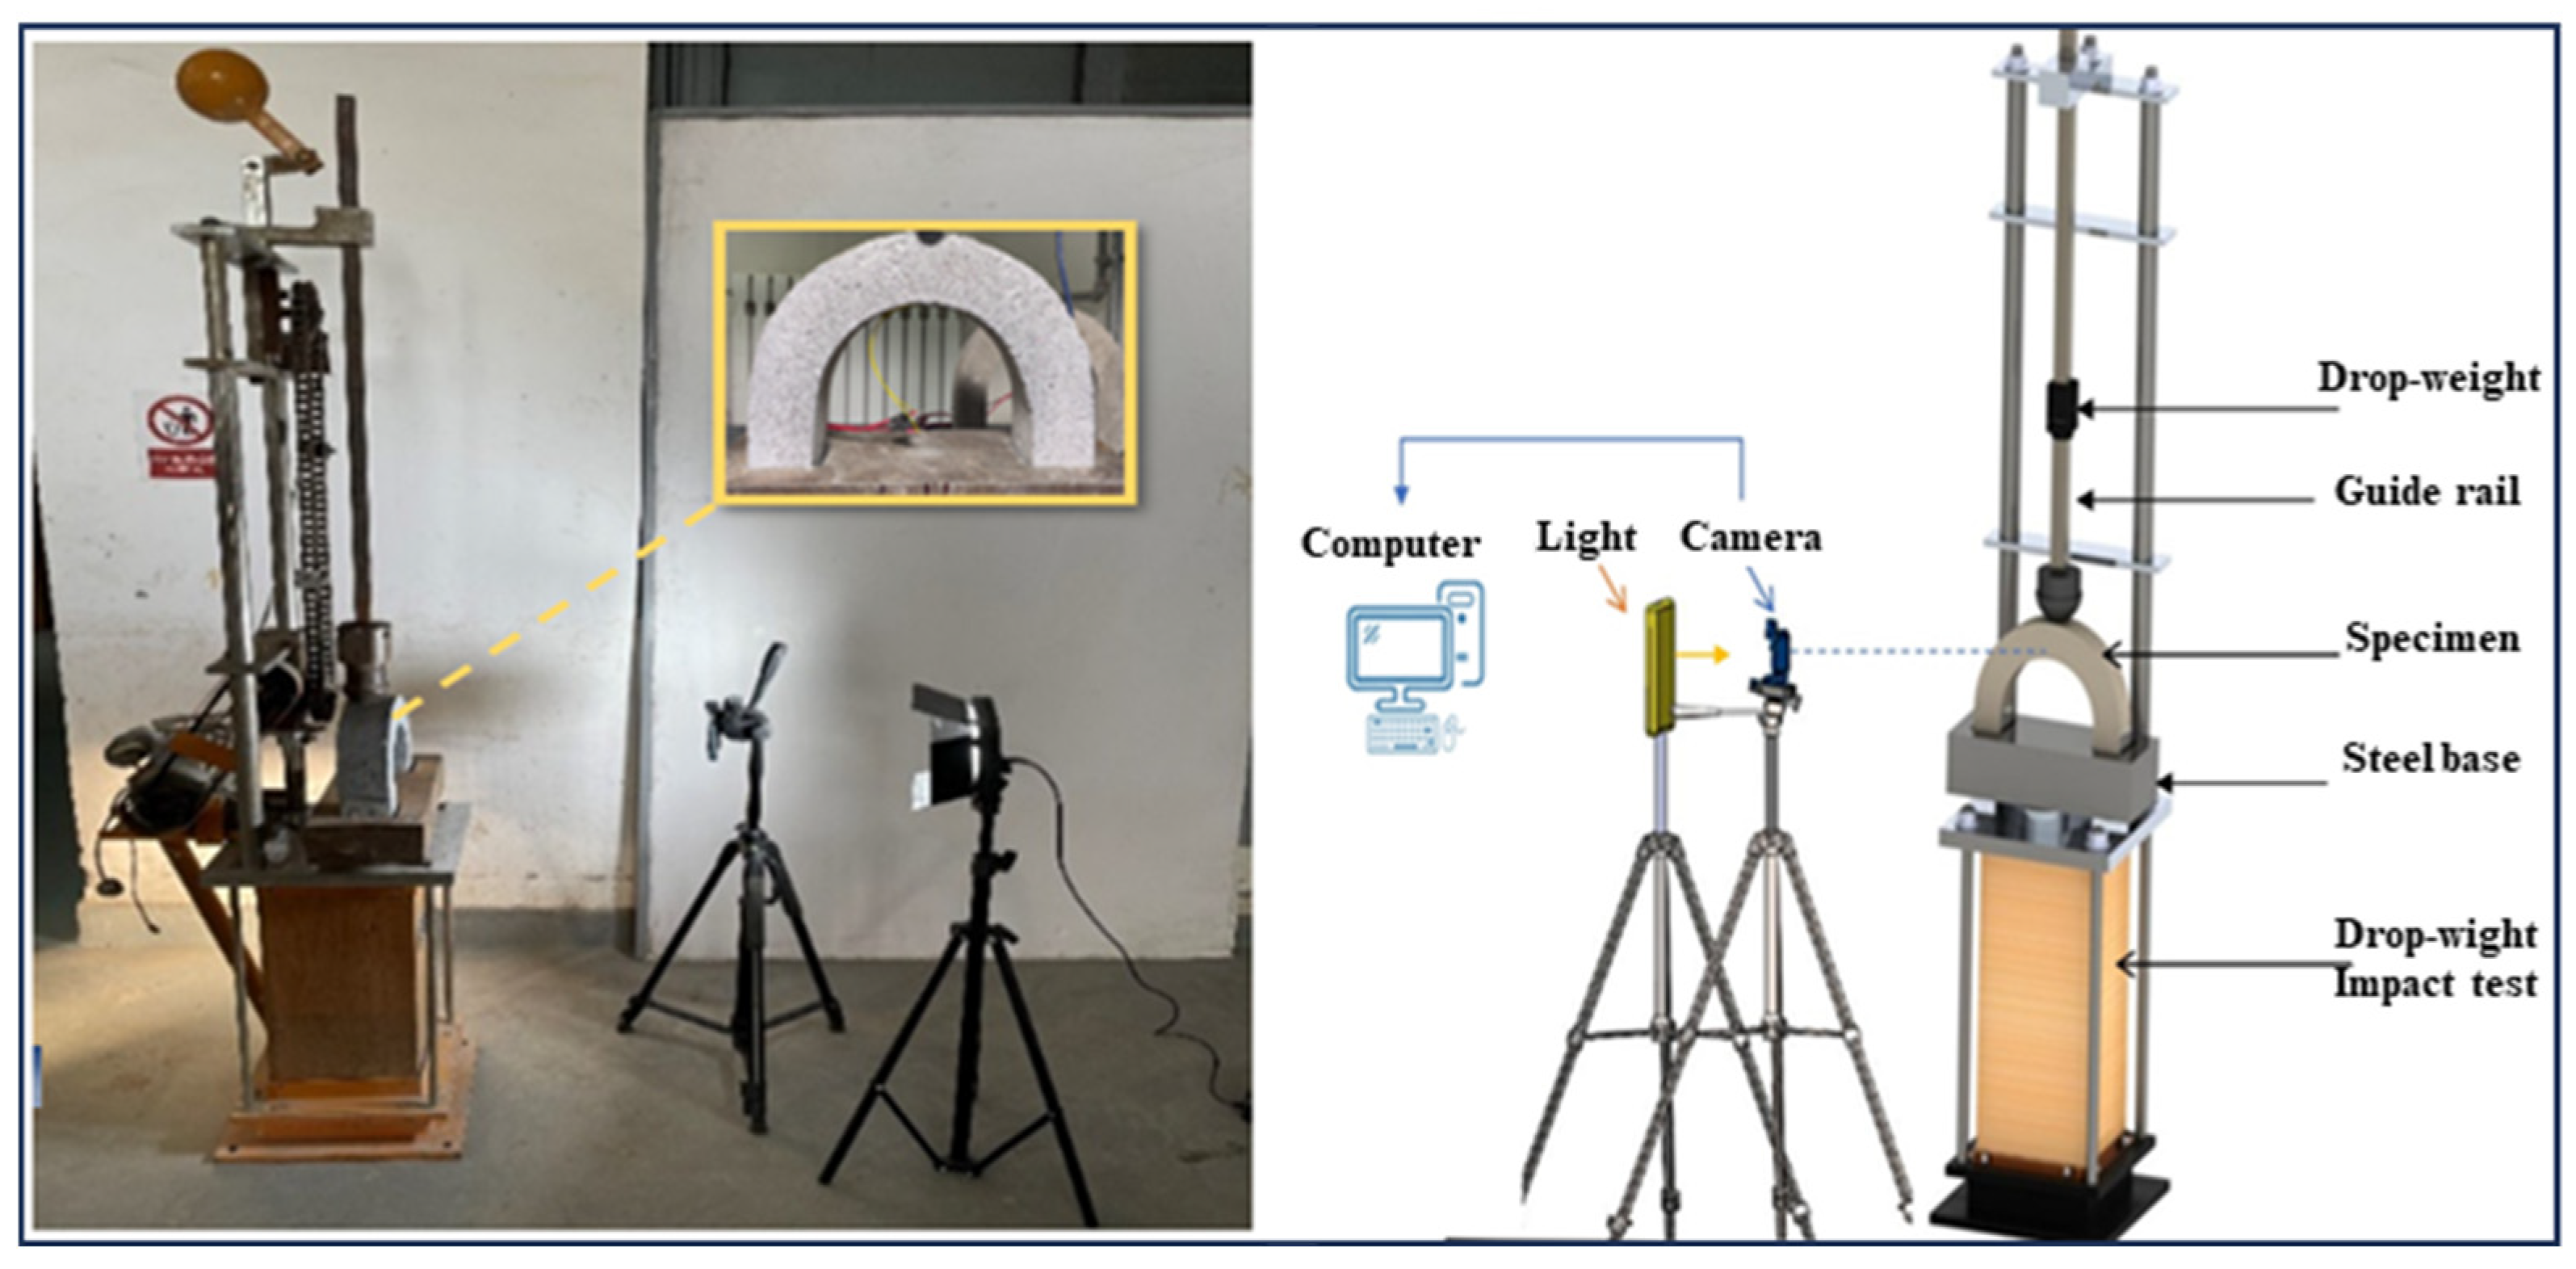
2.2.1. Drop-Weight Impact Test
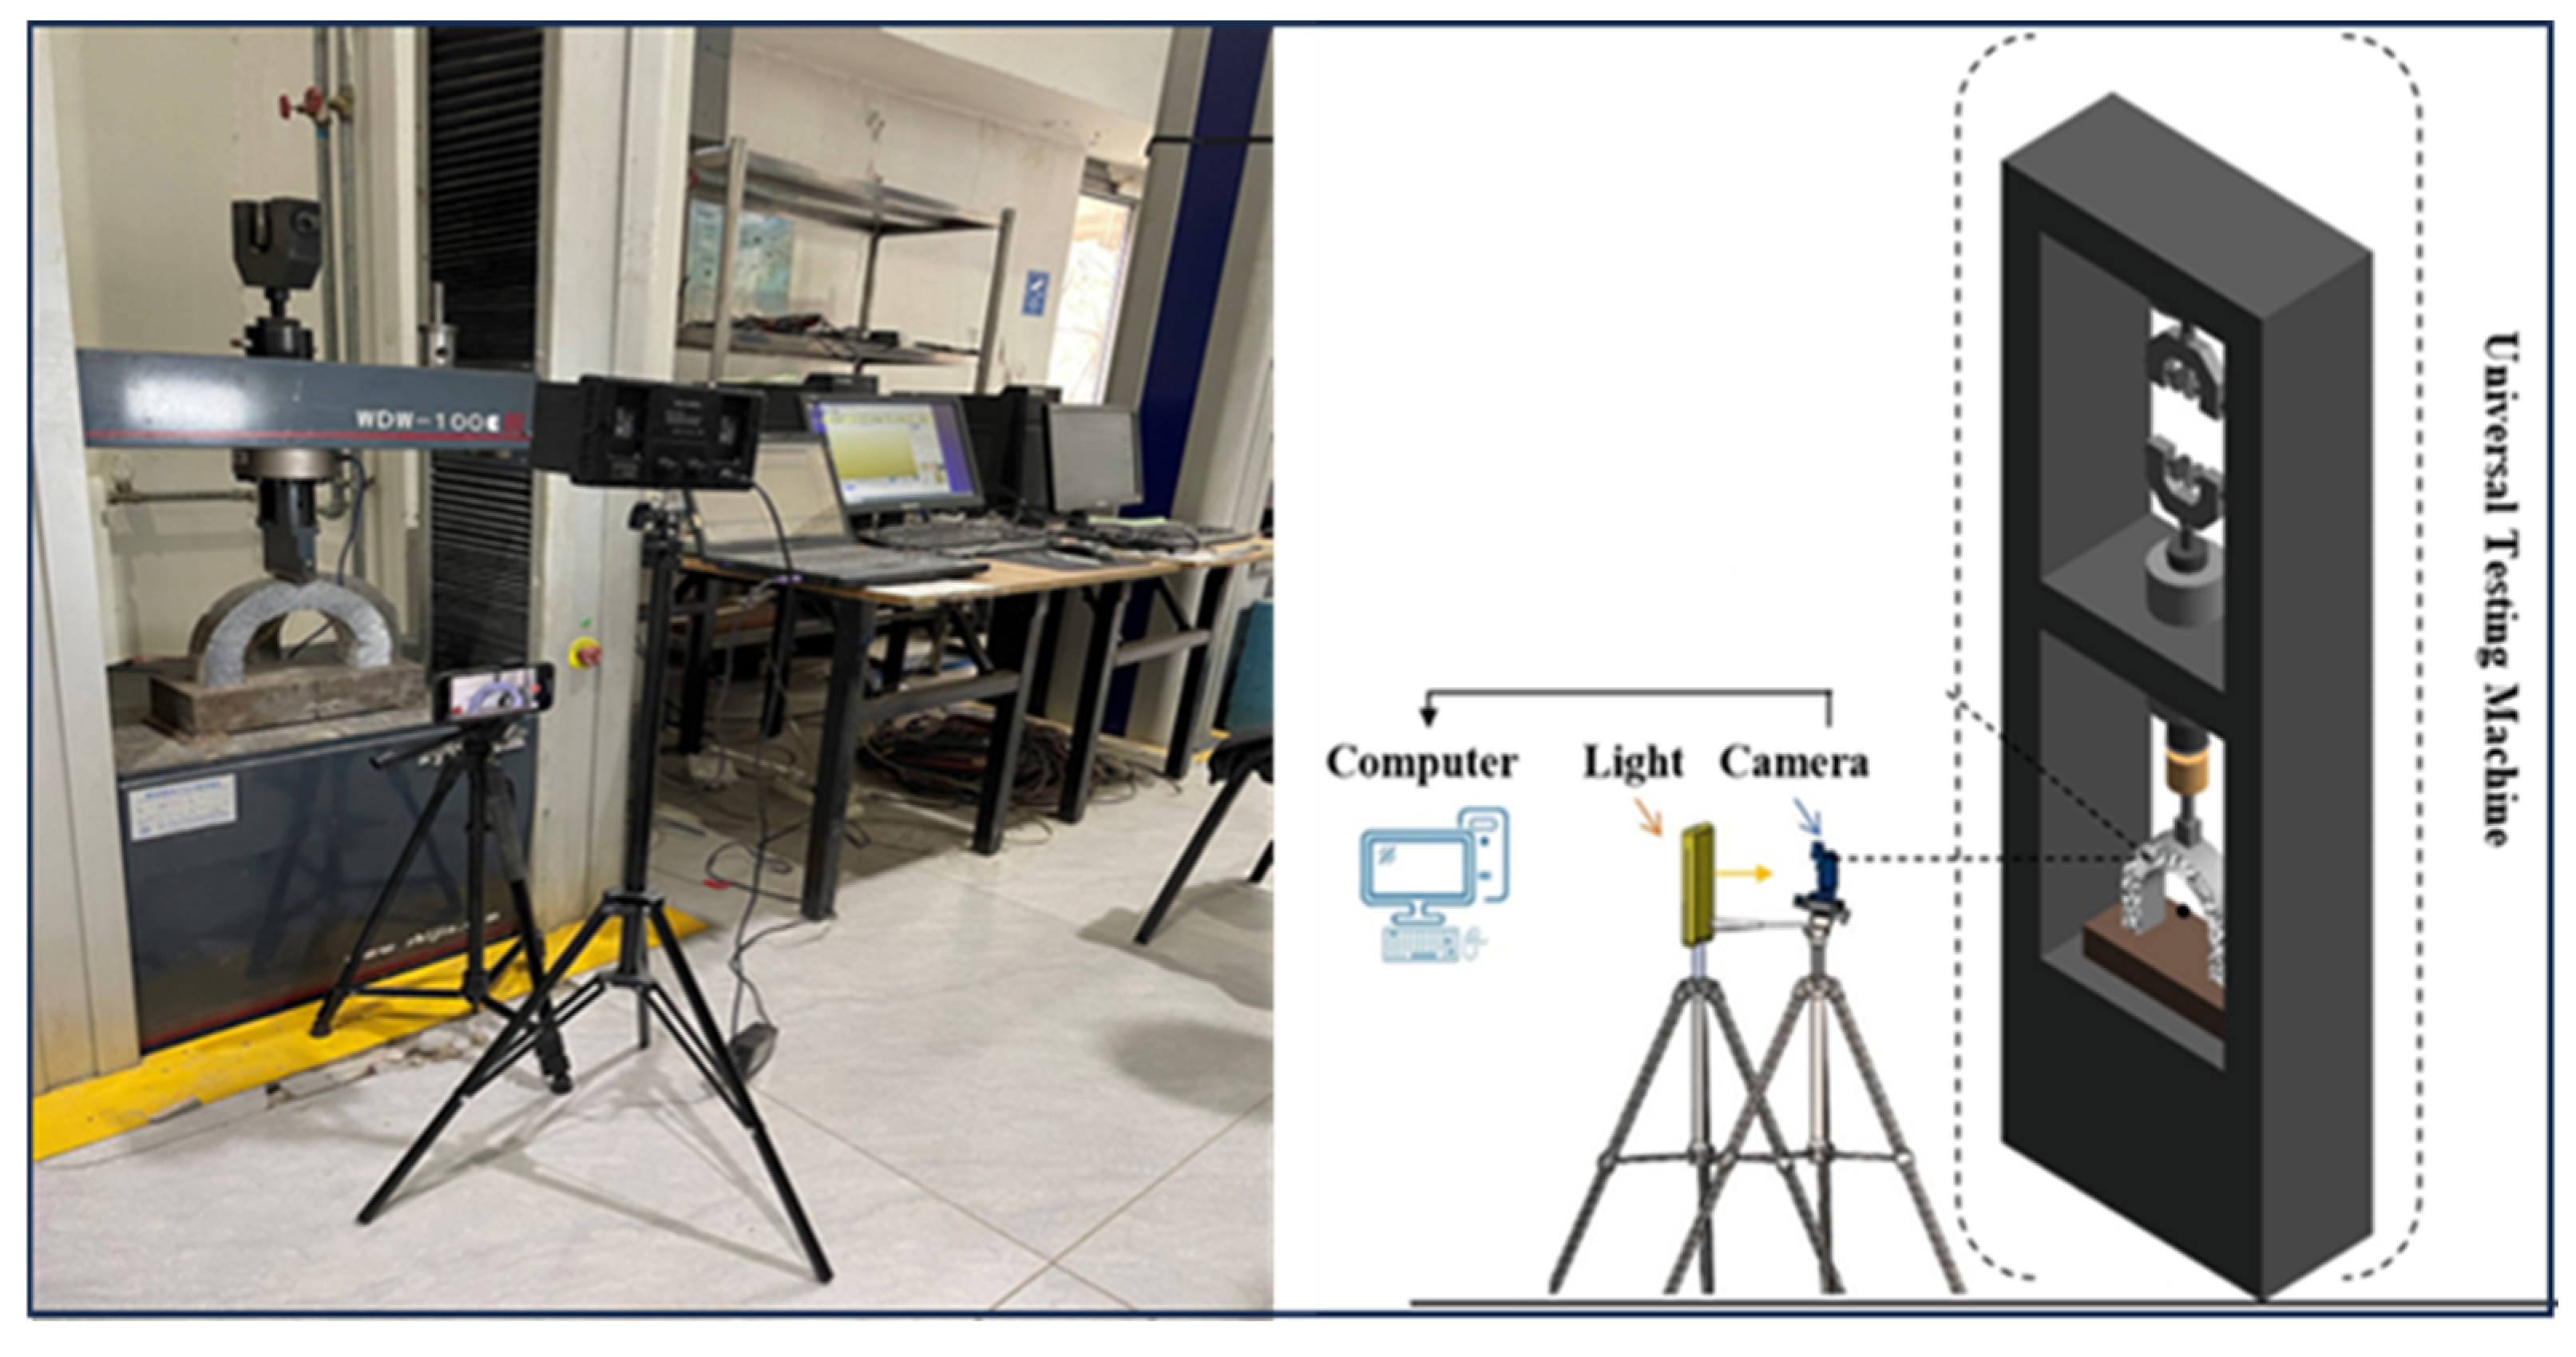
2.2.2. Digital Image Correlation (DIC) Analysis
2.3. Development of a Deep Learning Algorithm to Evaluate the Crack
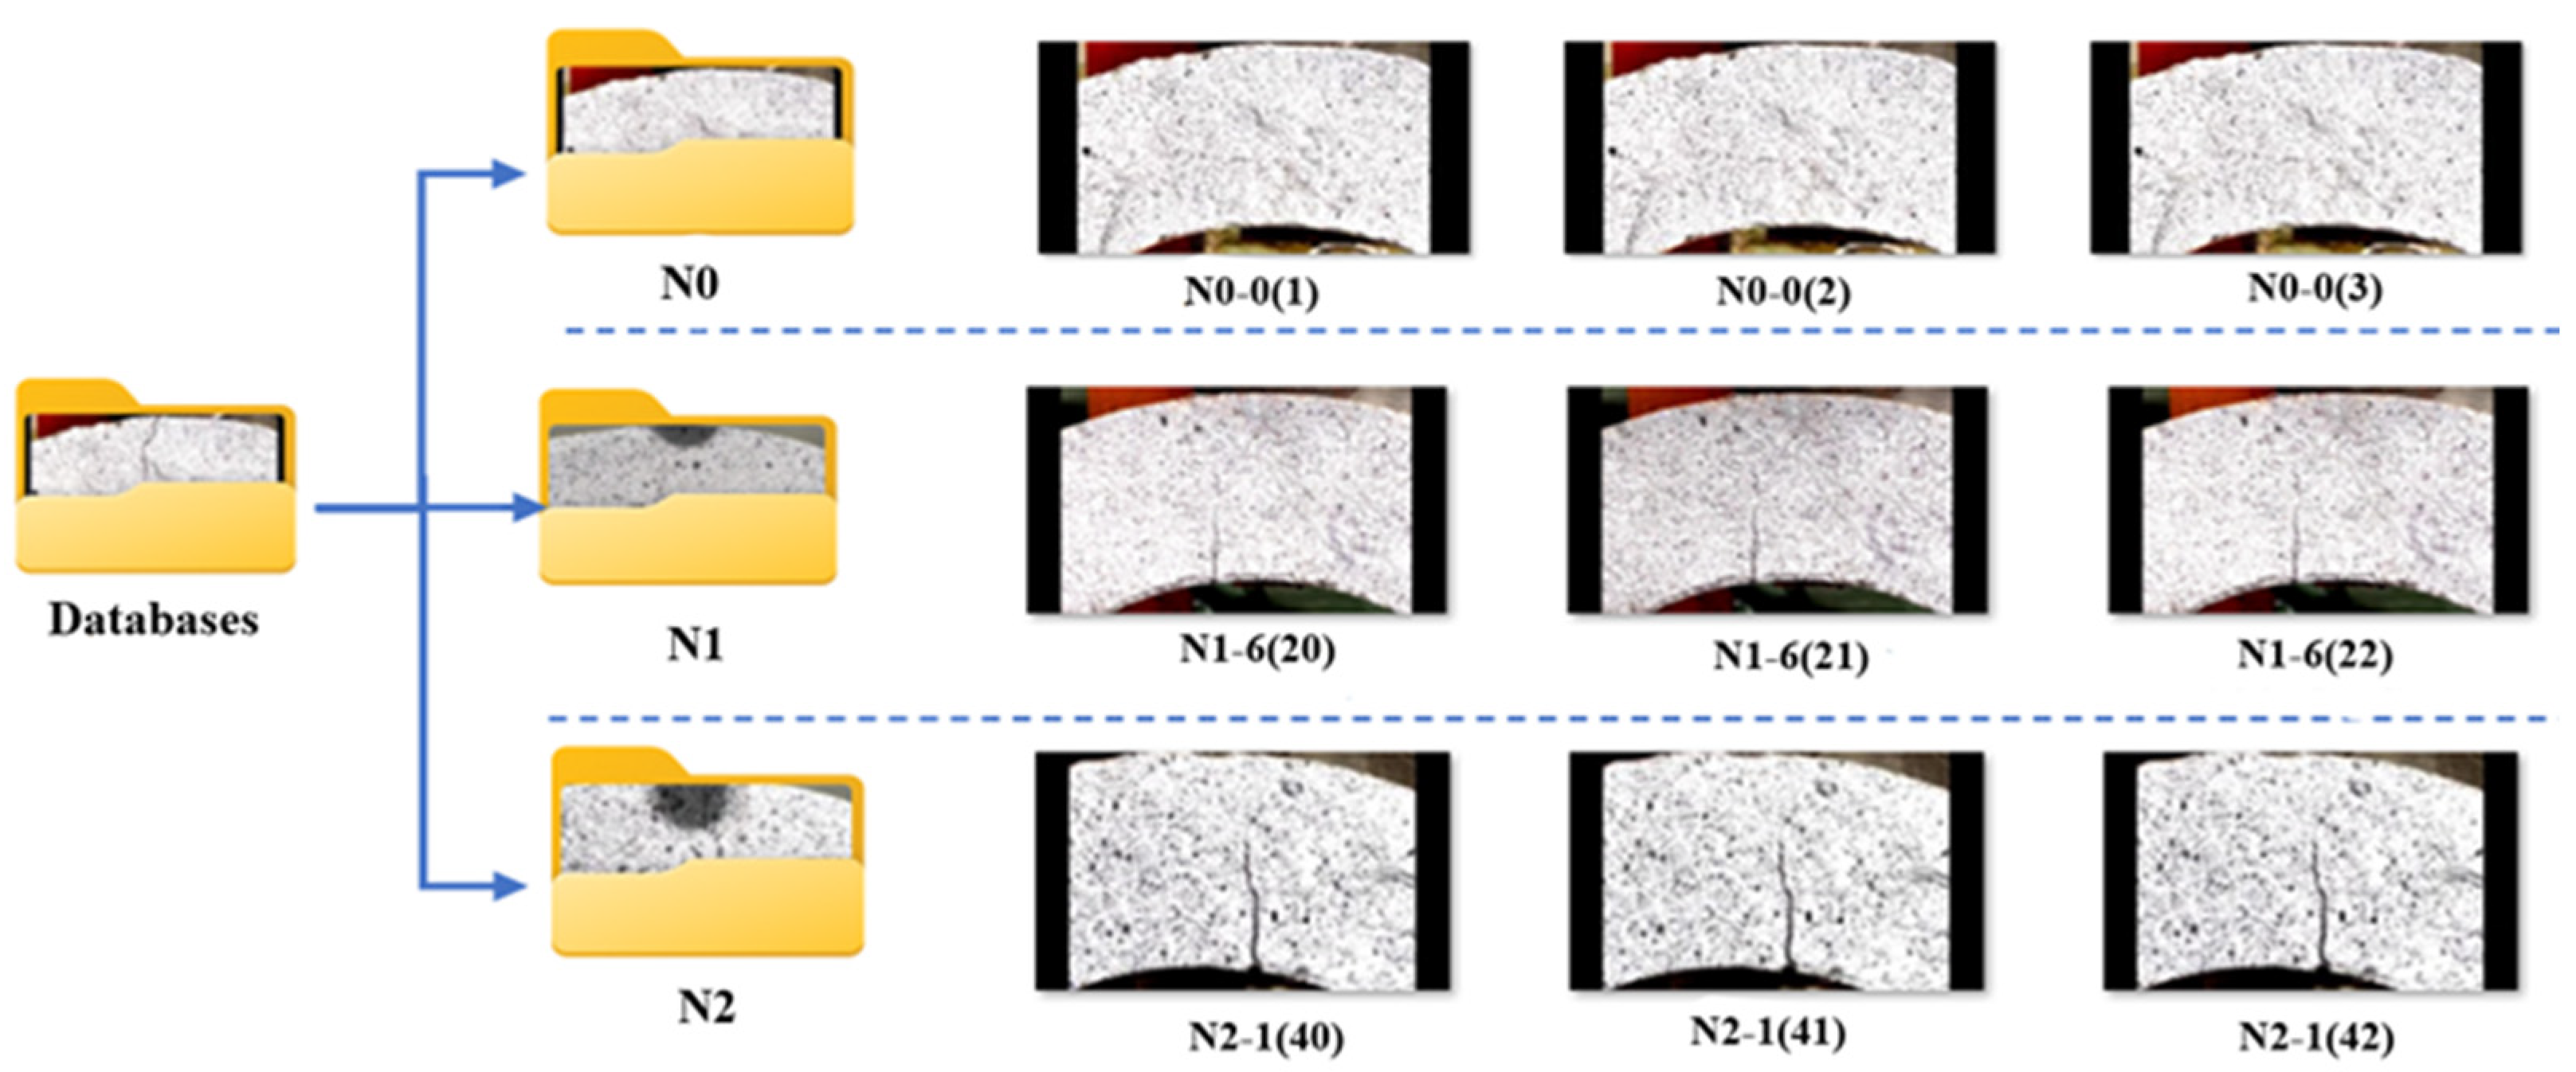
2.3.1. Databases
2.3.2. Conventional Neural Networks (CNNs)
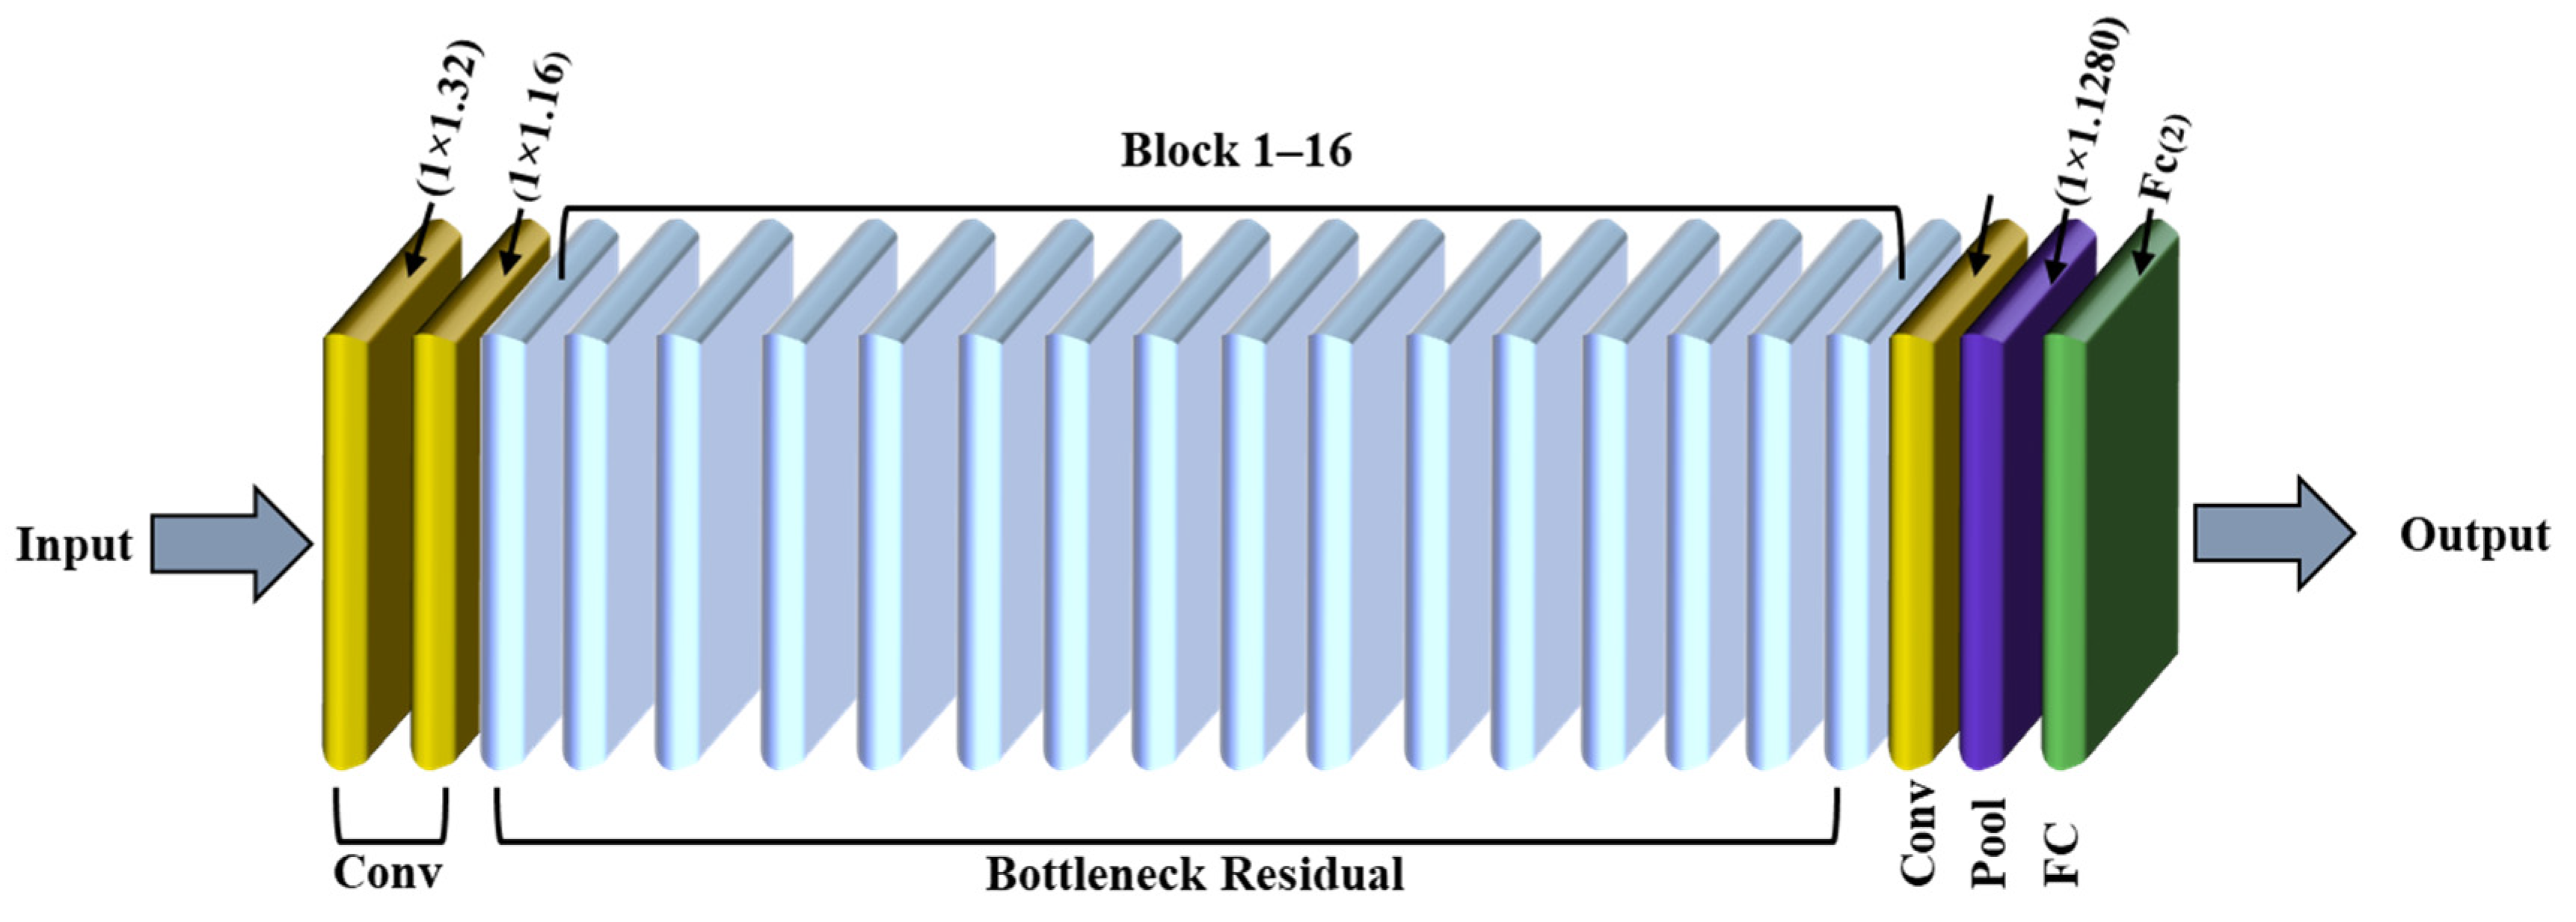
2.3.3. MobileNet
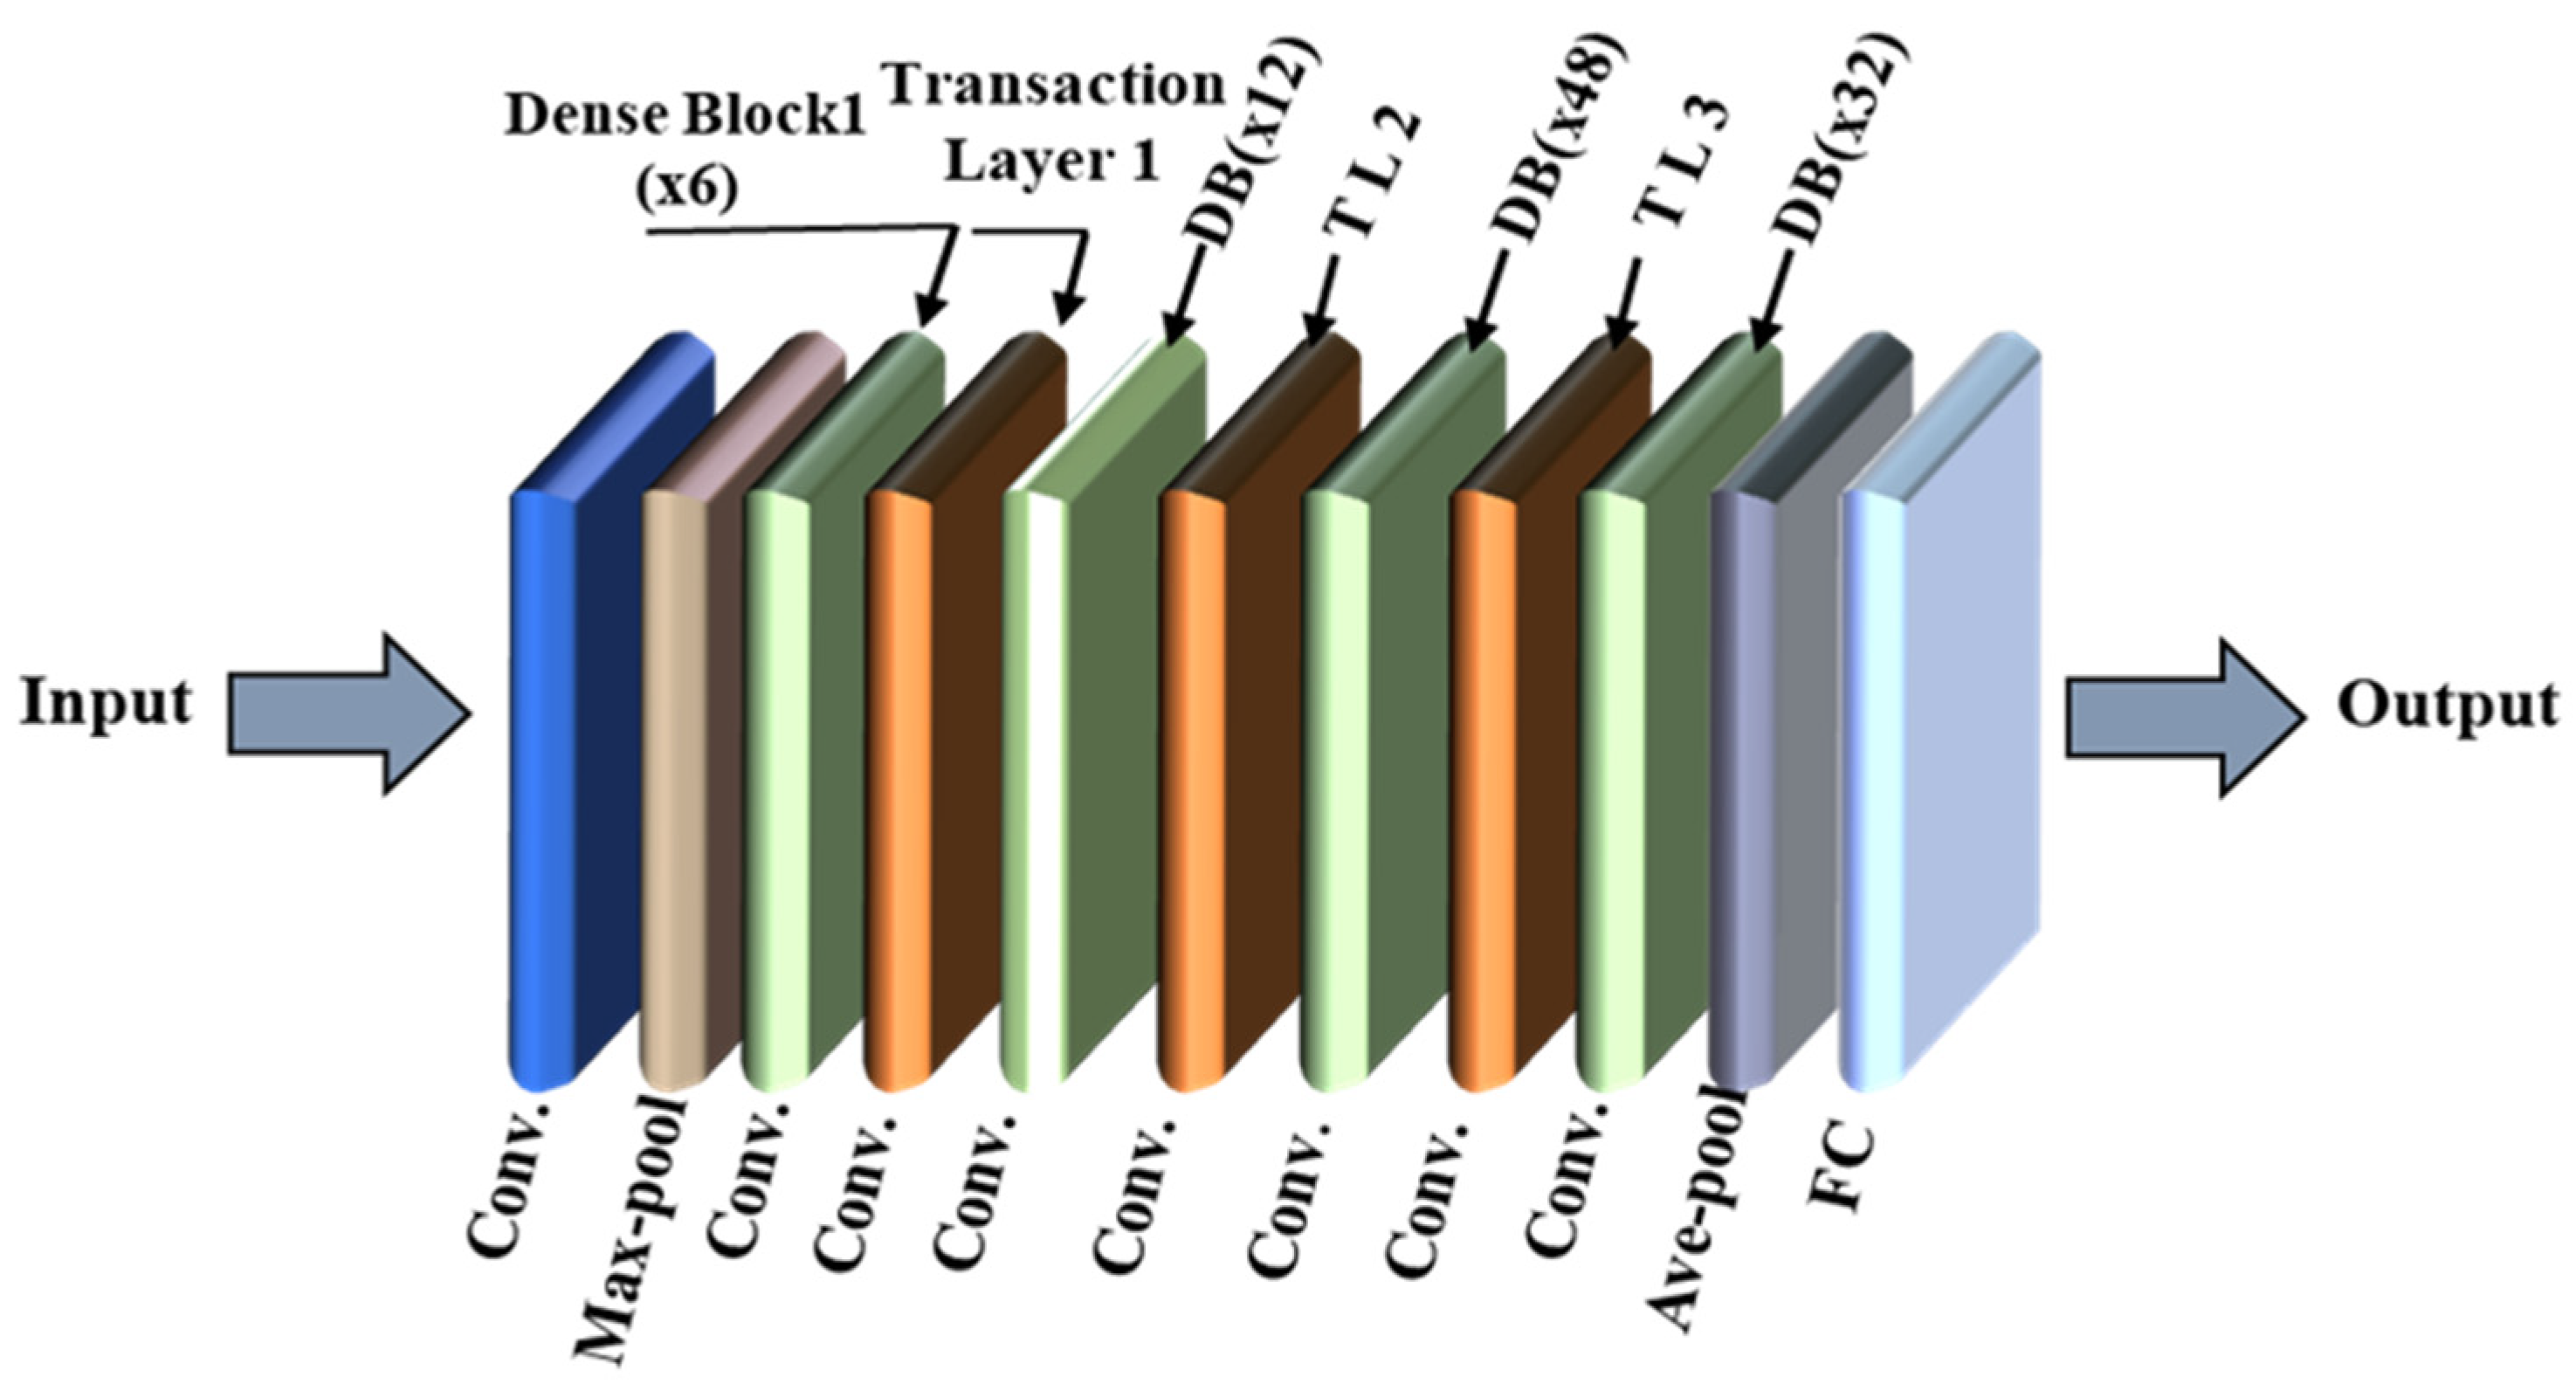
2.3.4. DenseNet121
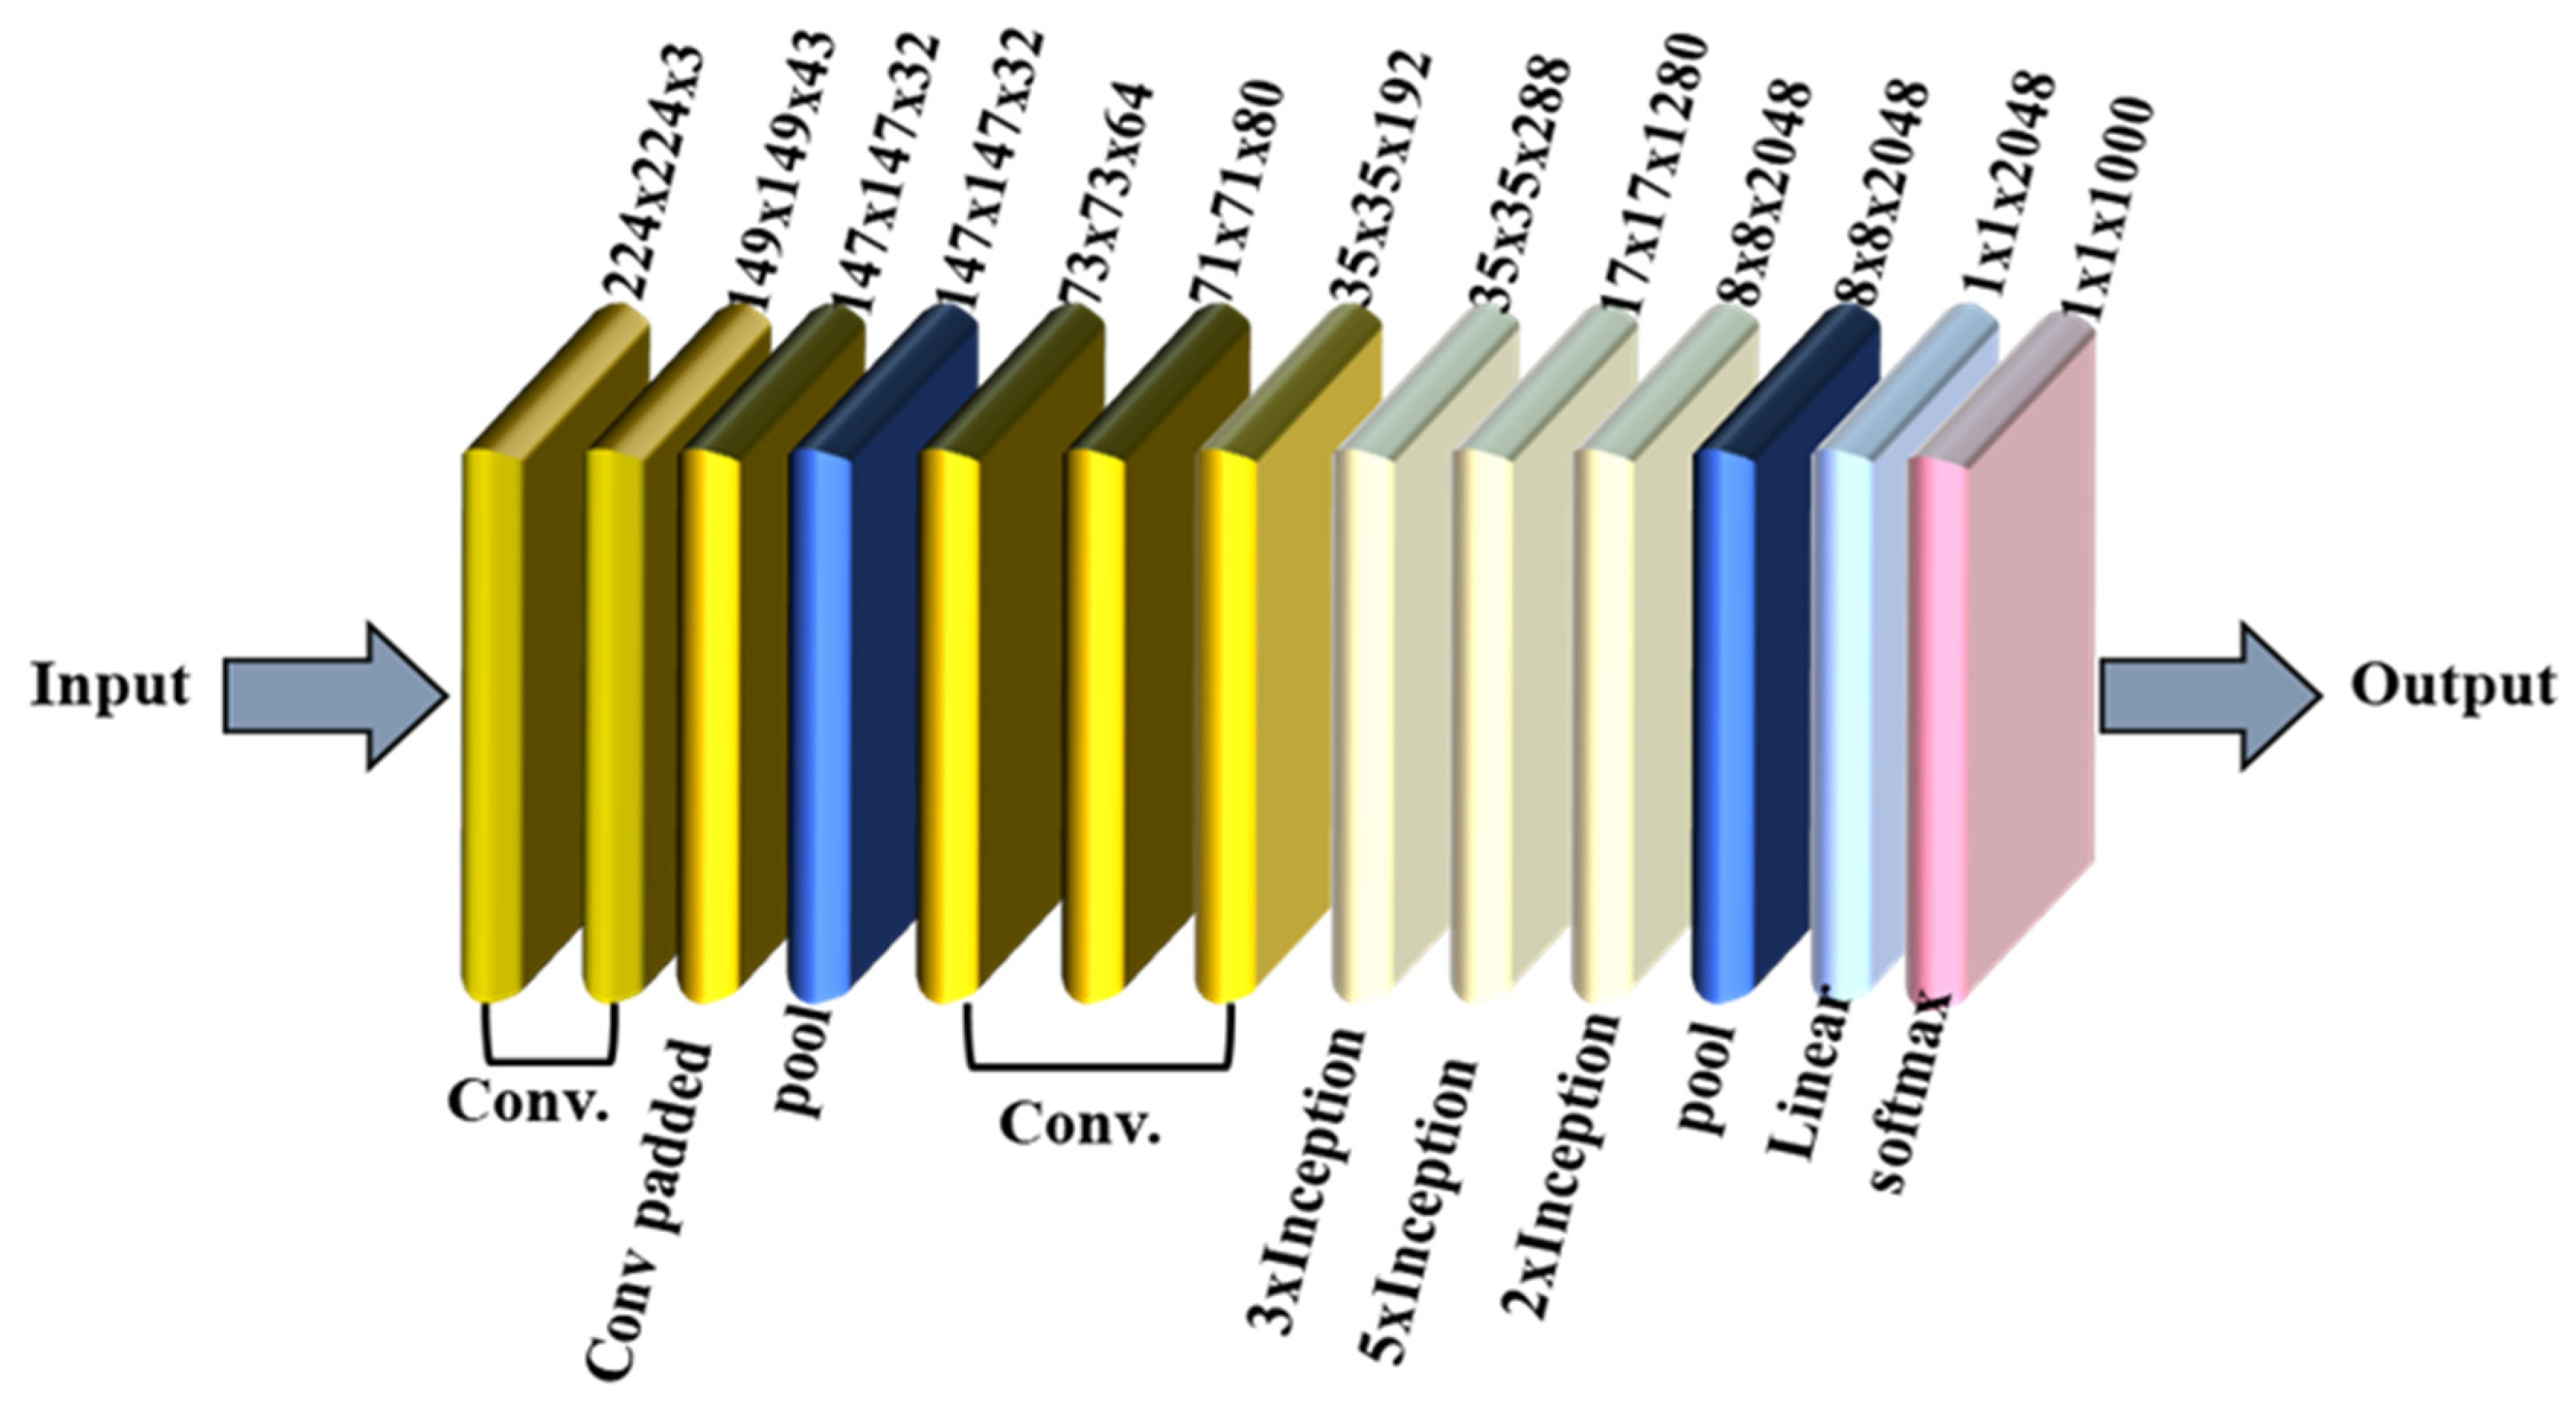
2.3.5. InceptionV3
2.3.6. CNN Evaluation Method
3. Results and Discussions
3.1. Impact Strength of U-Shaped PU-Modified Concrete
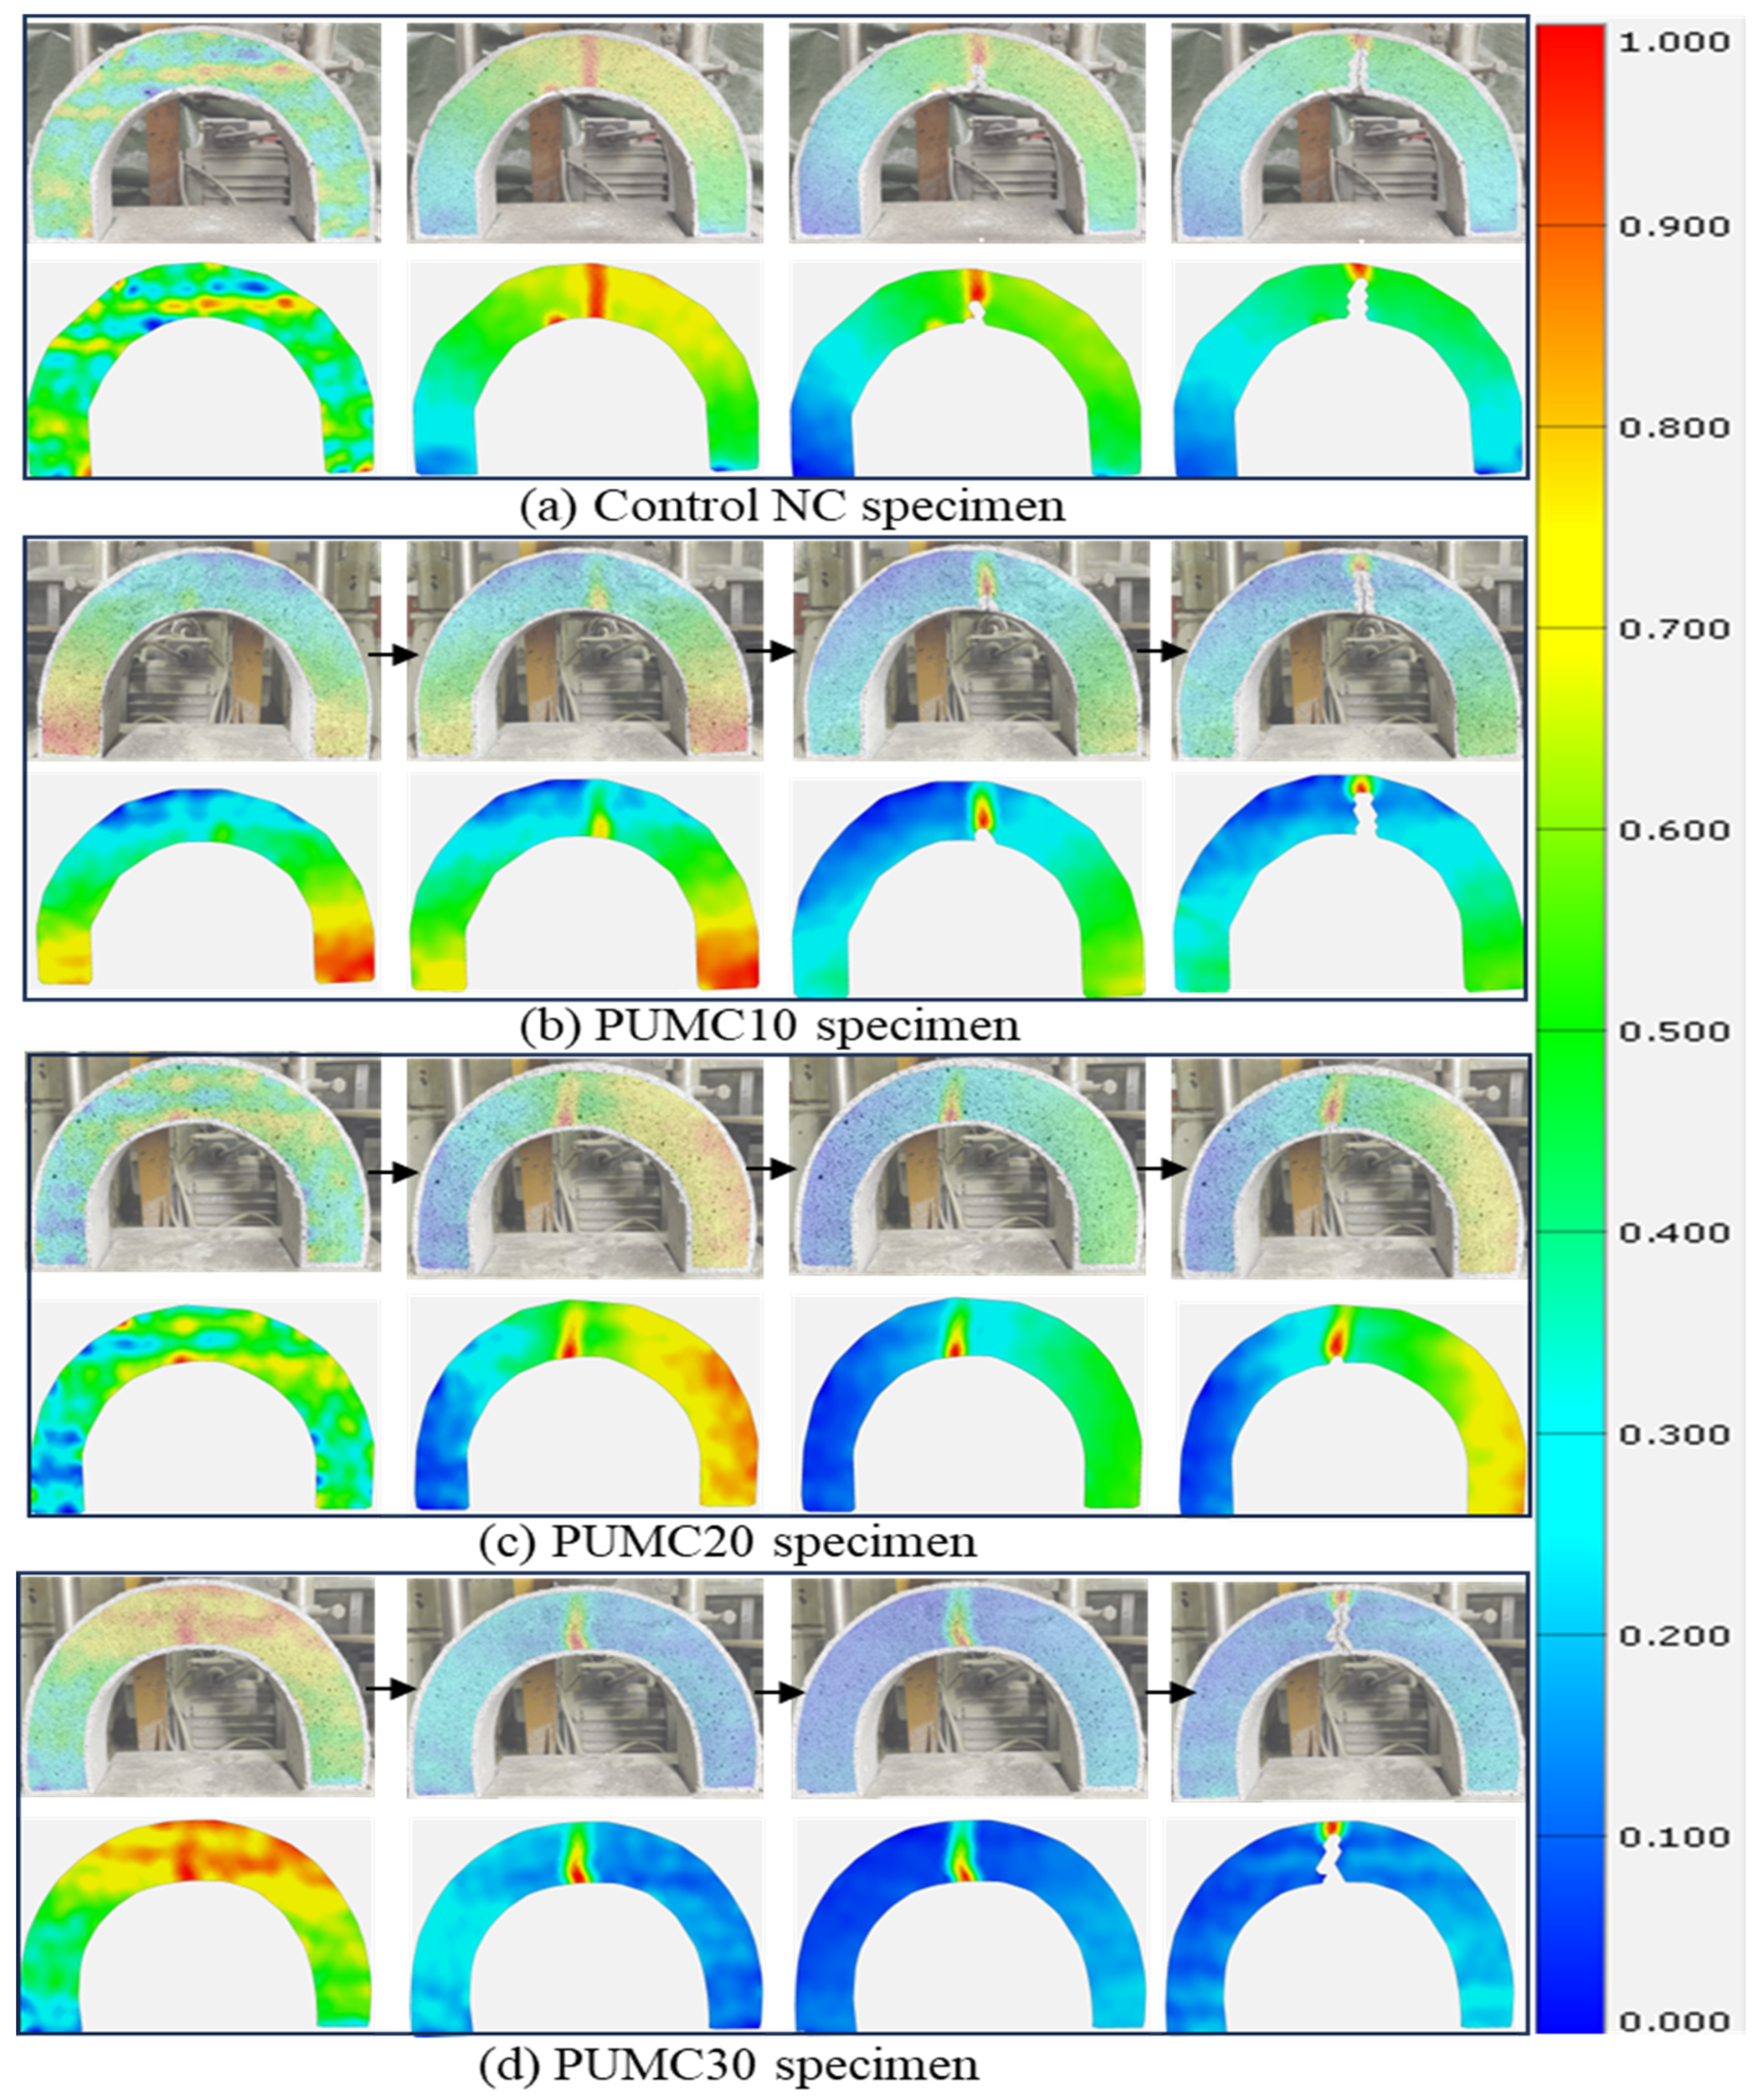
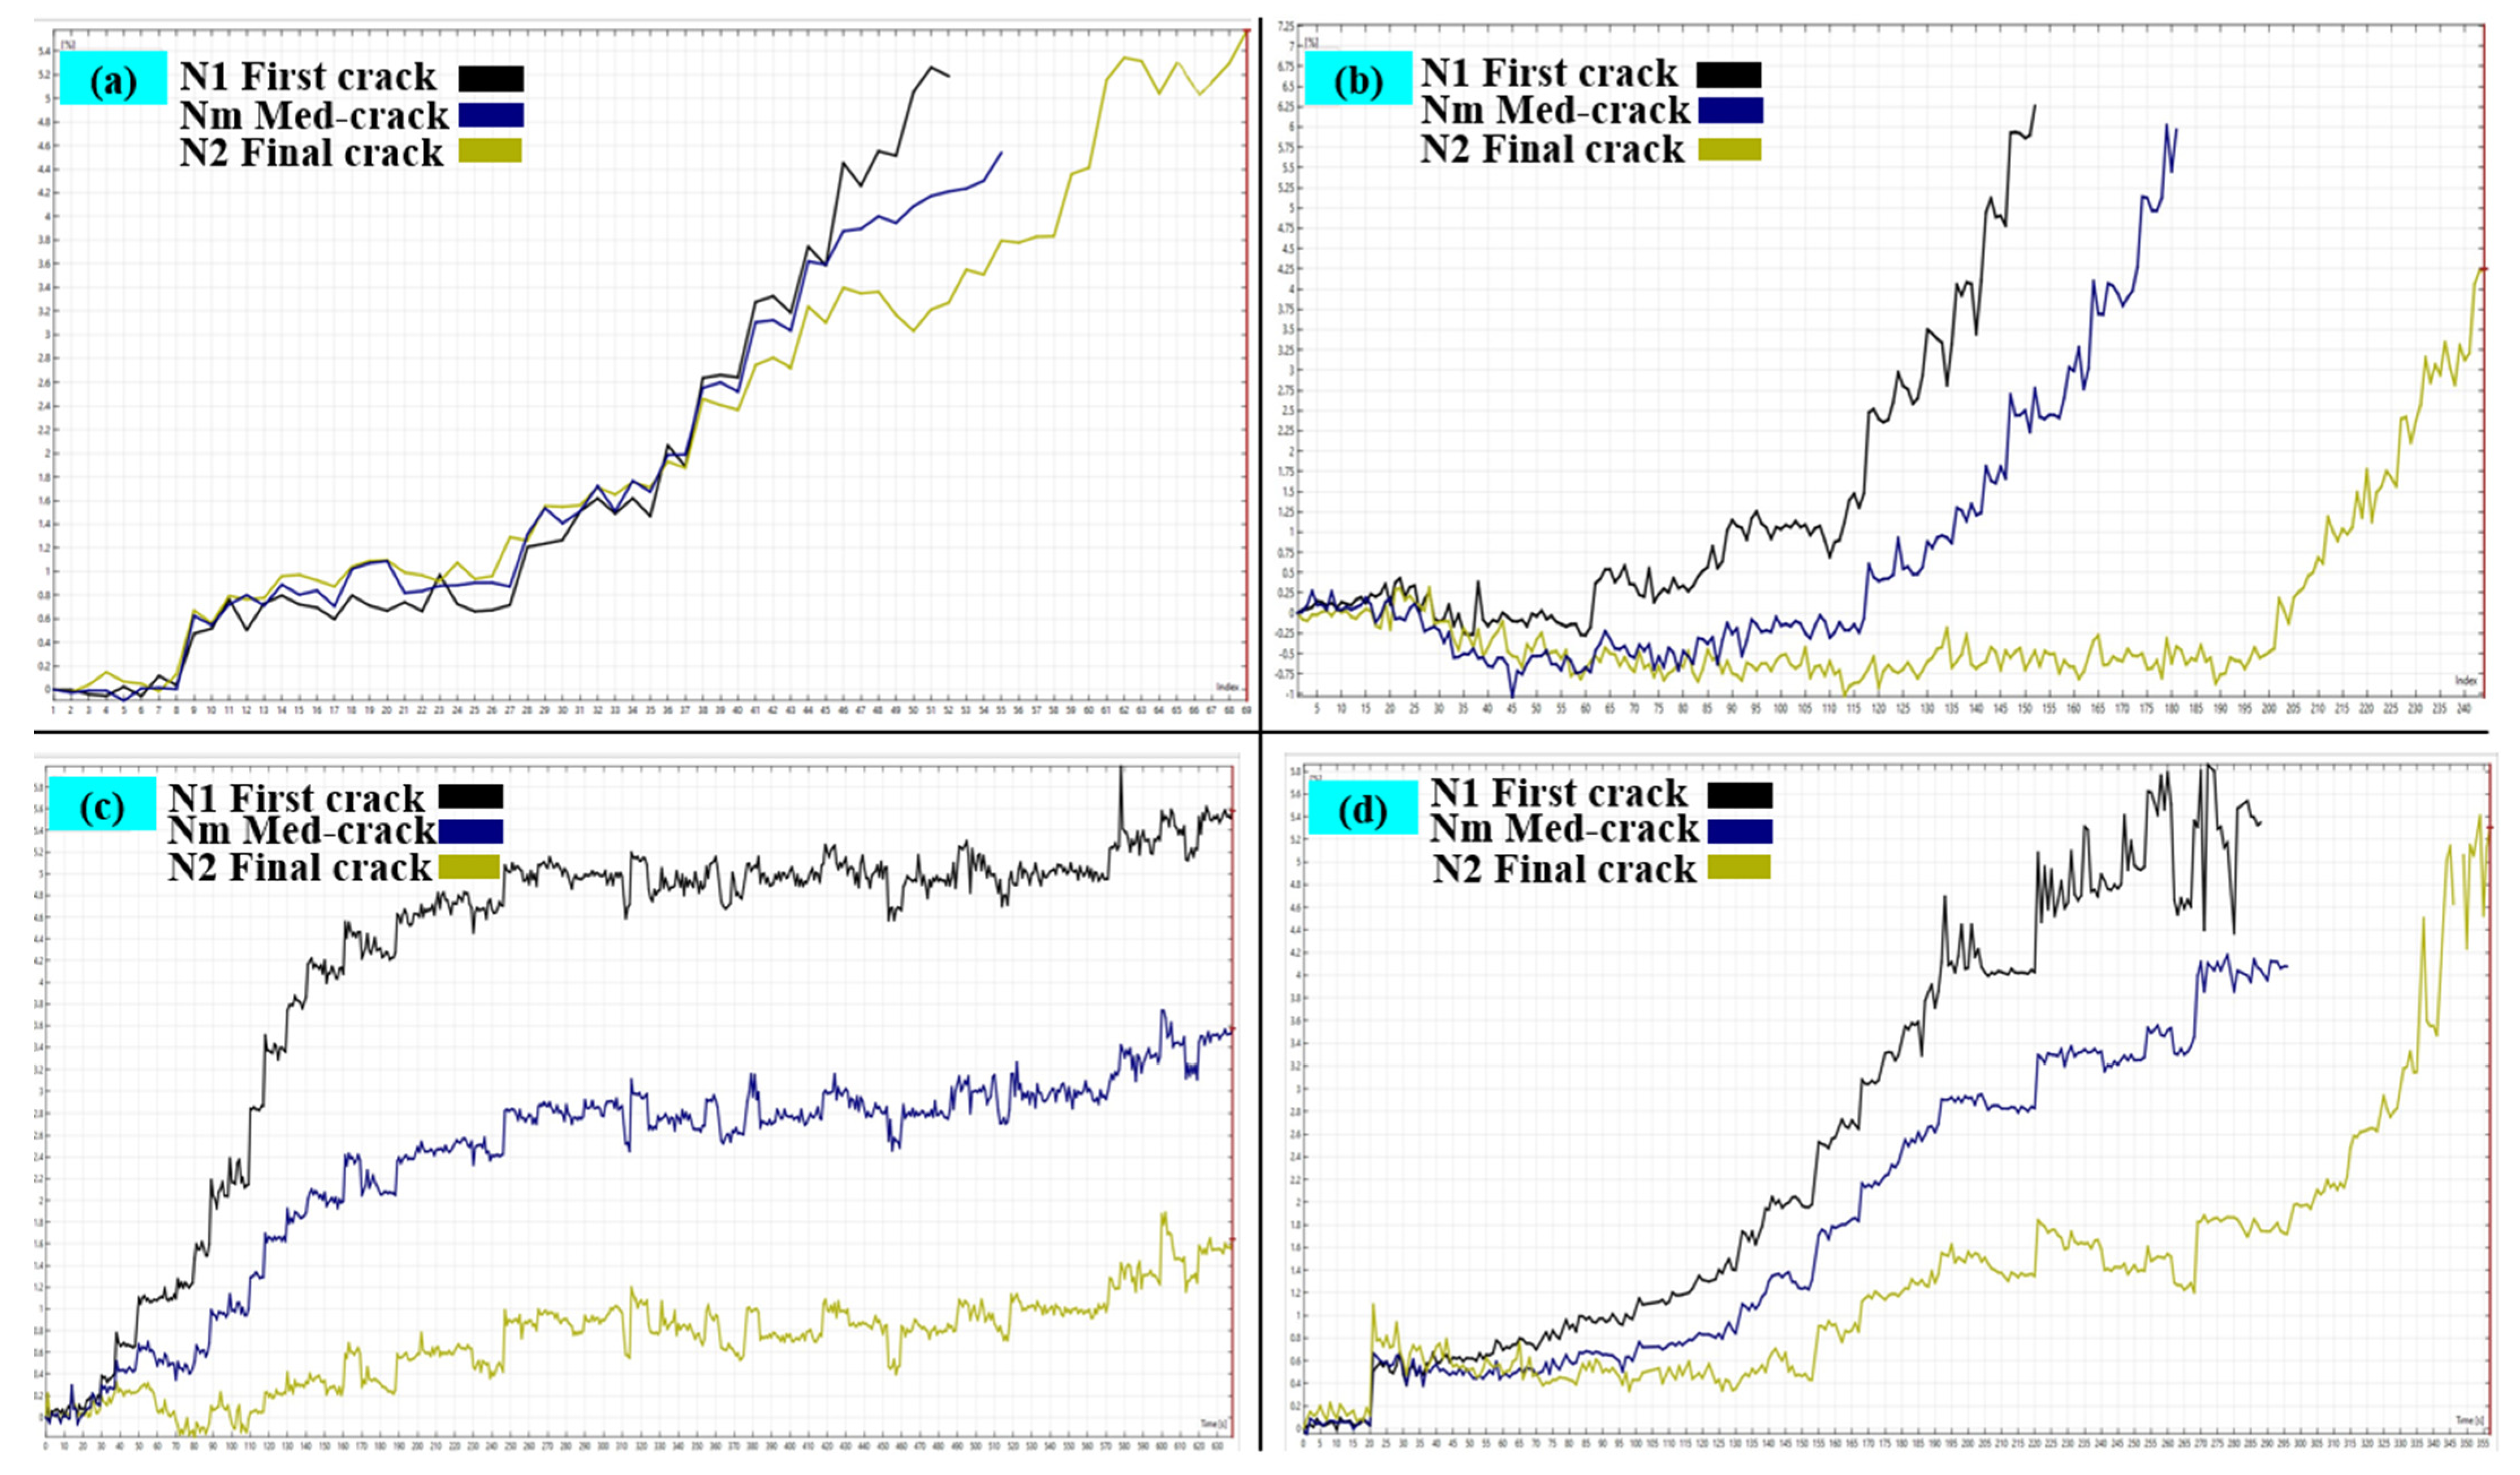
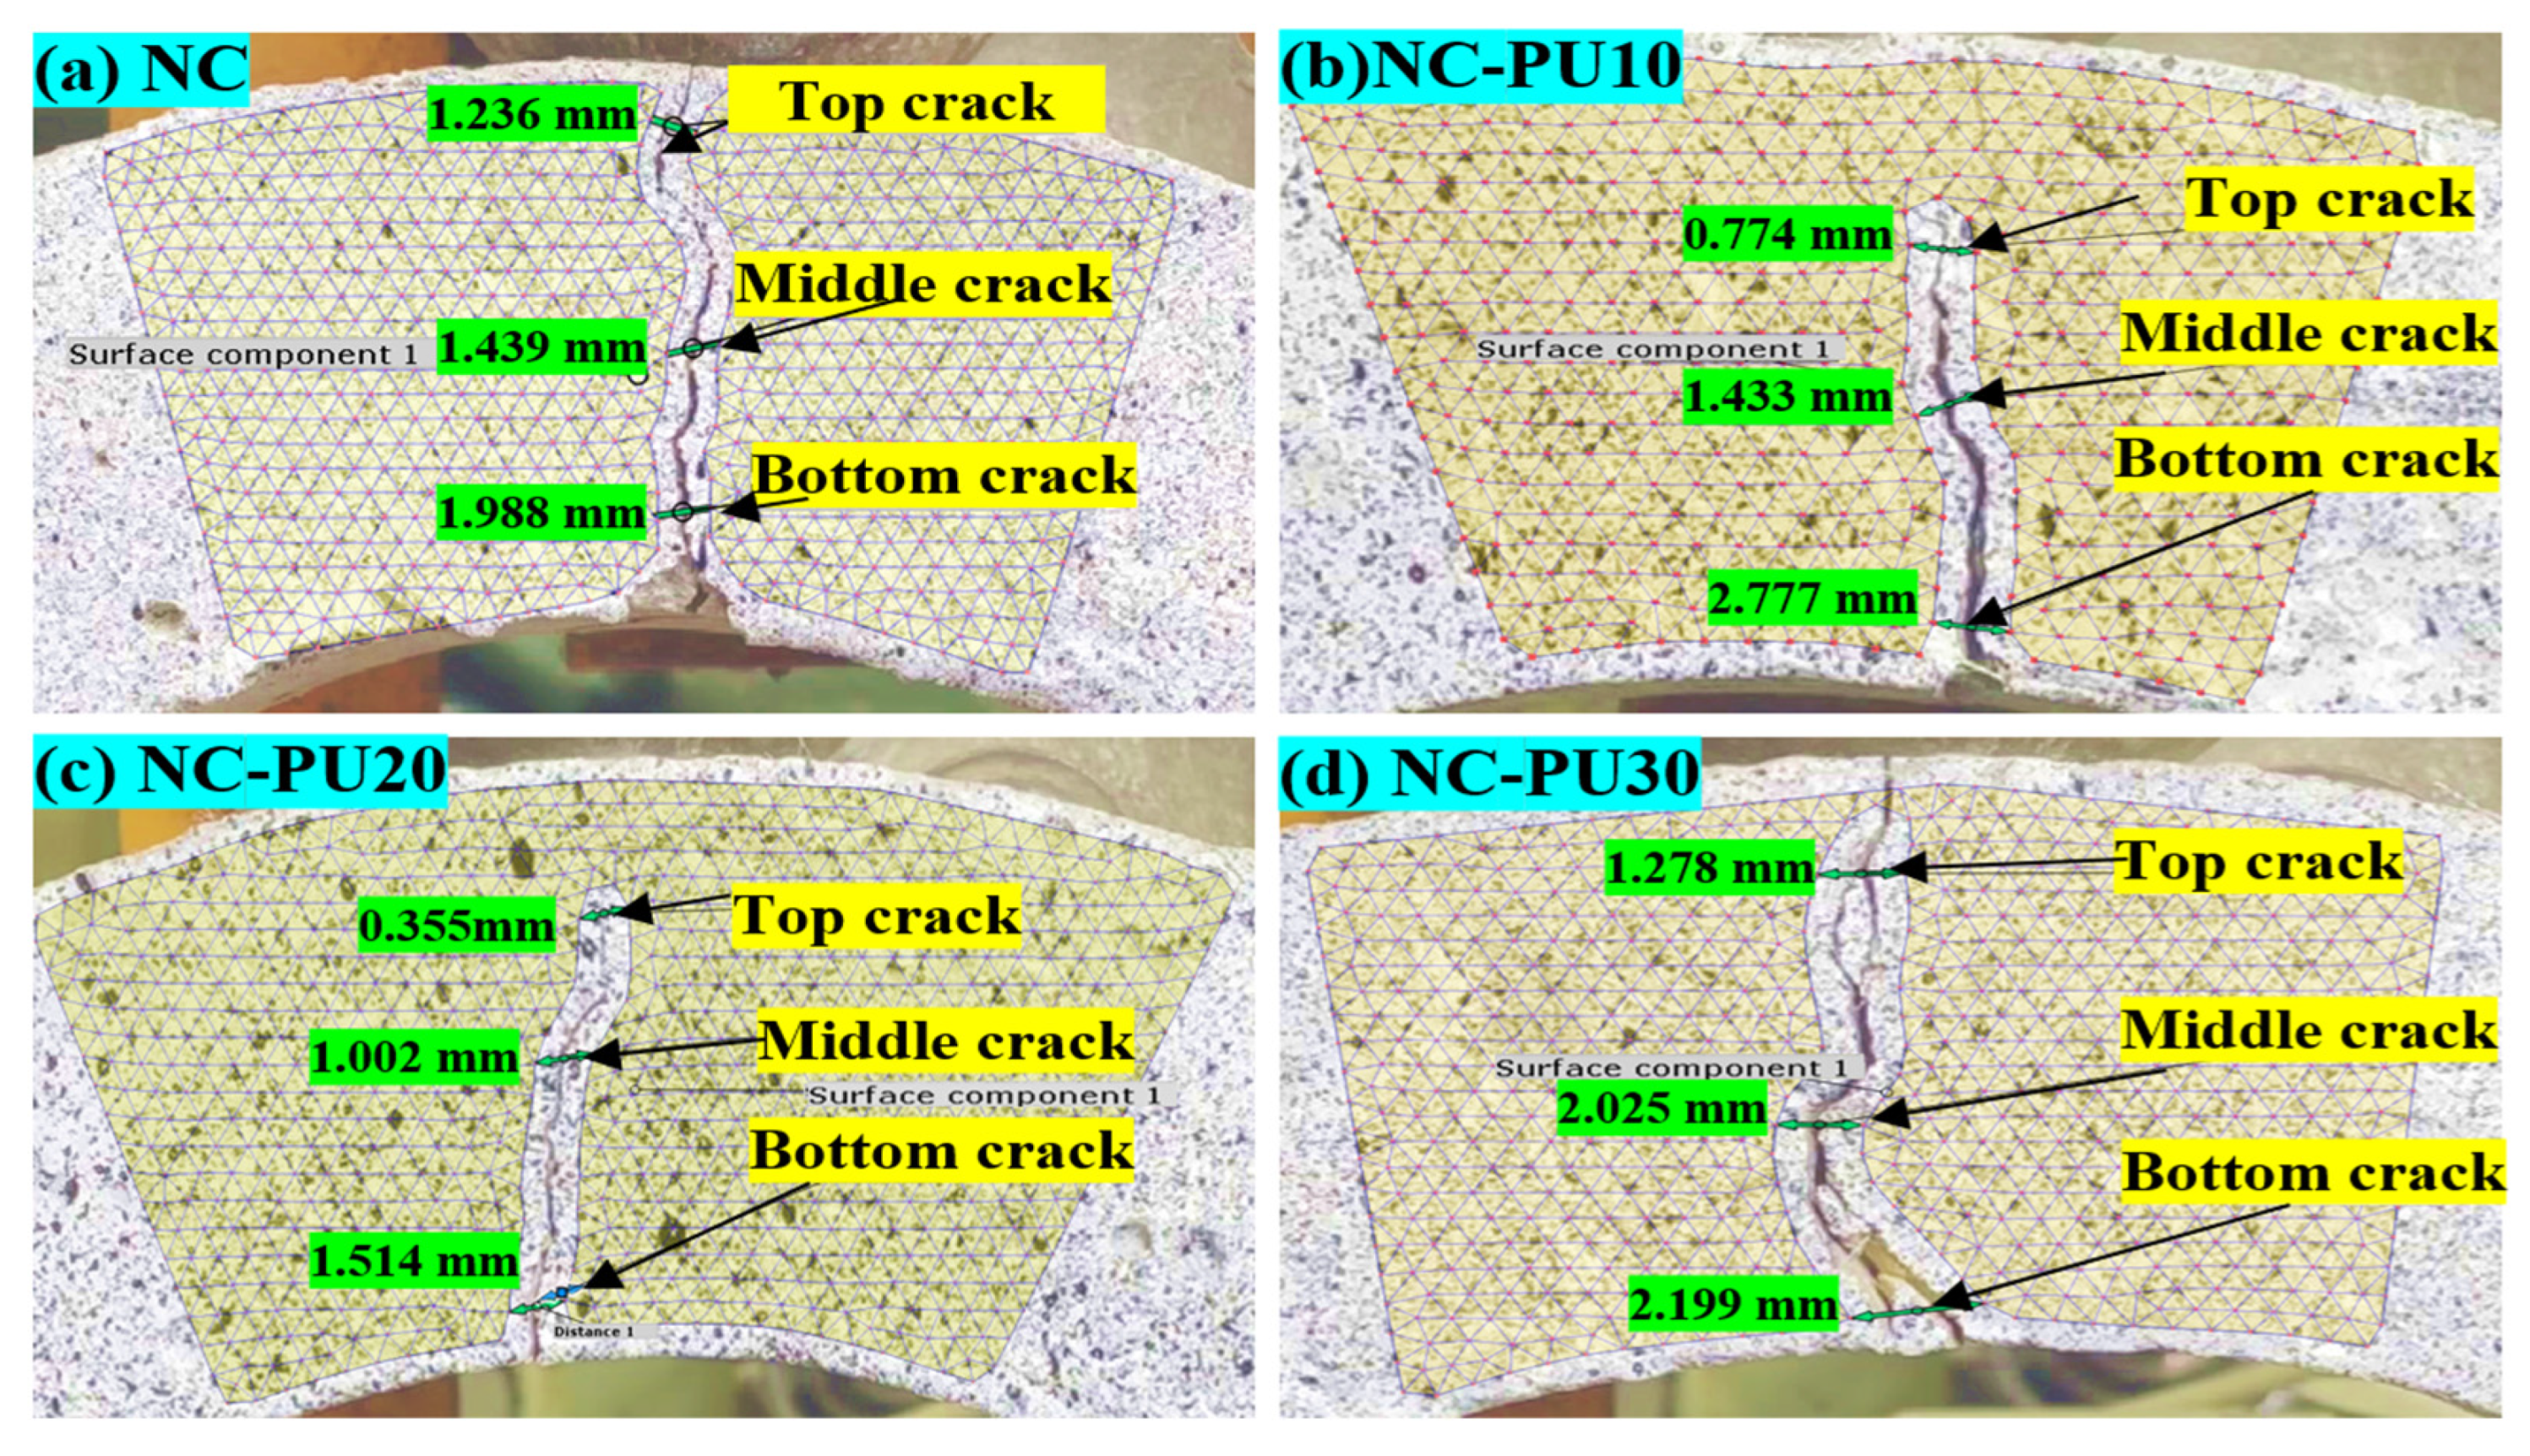
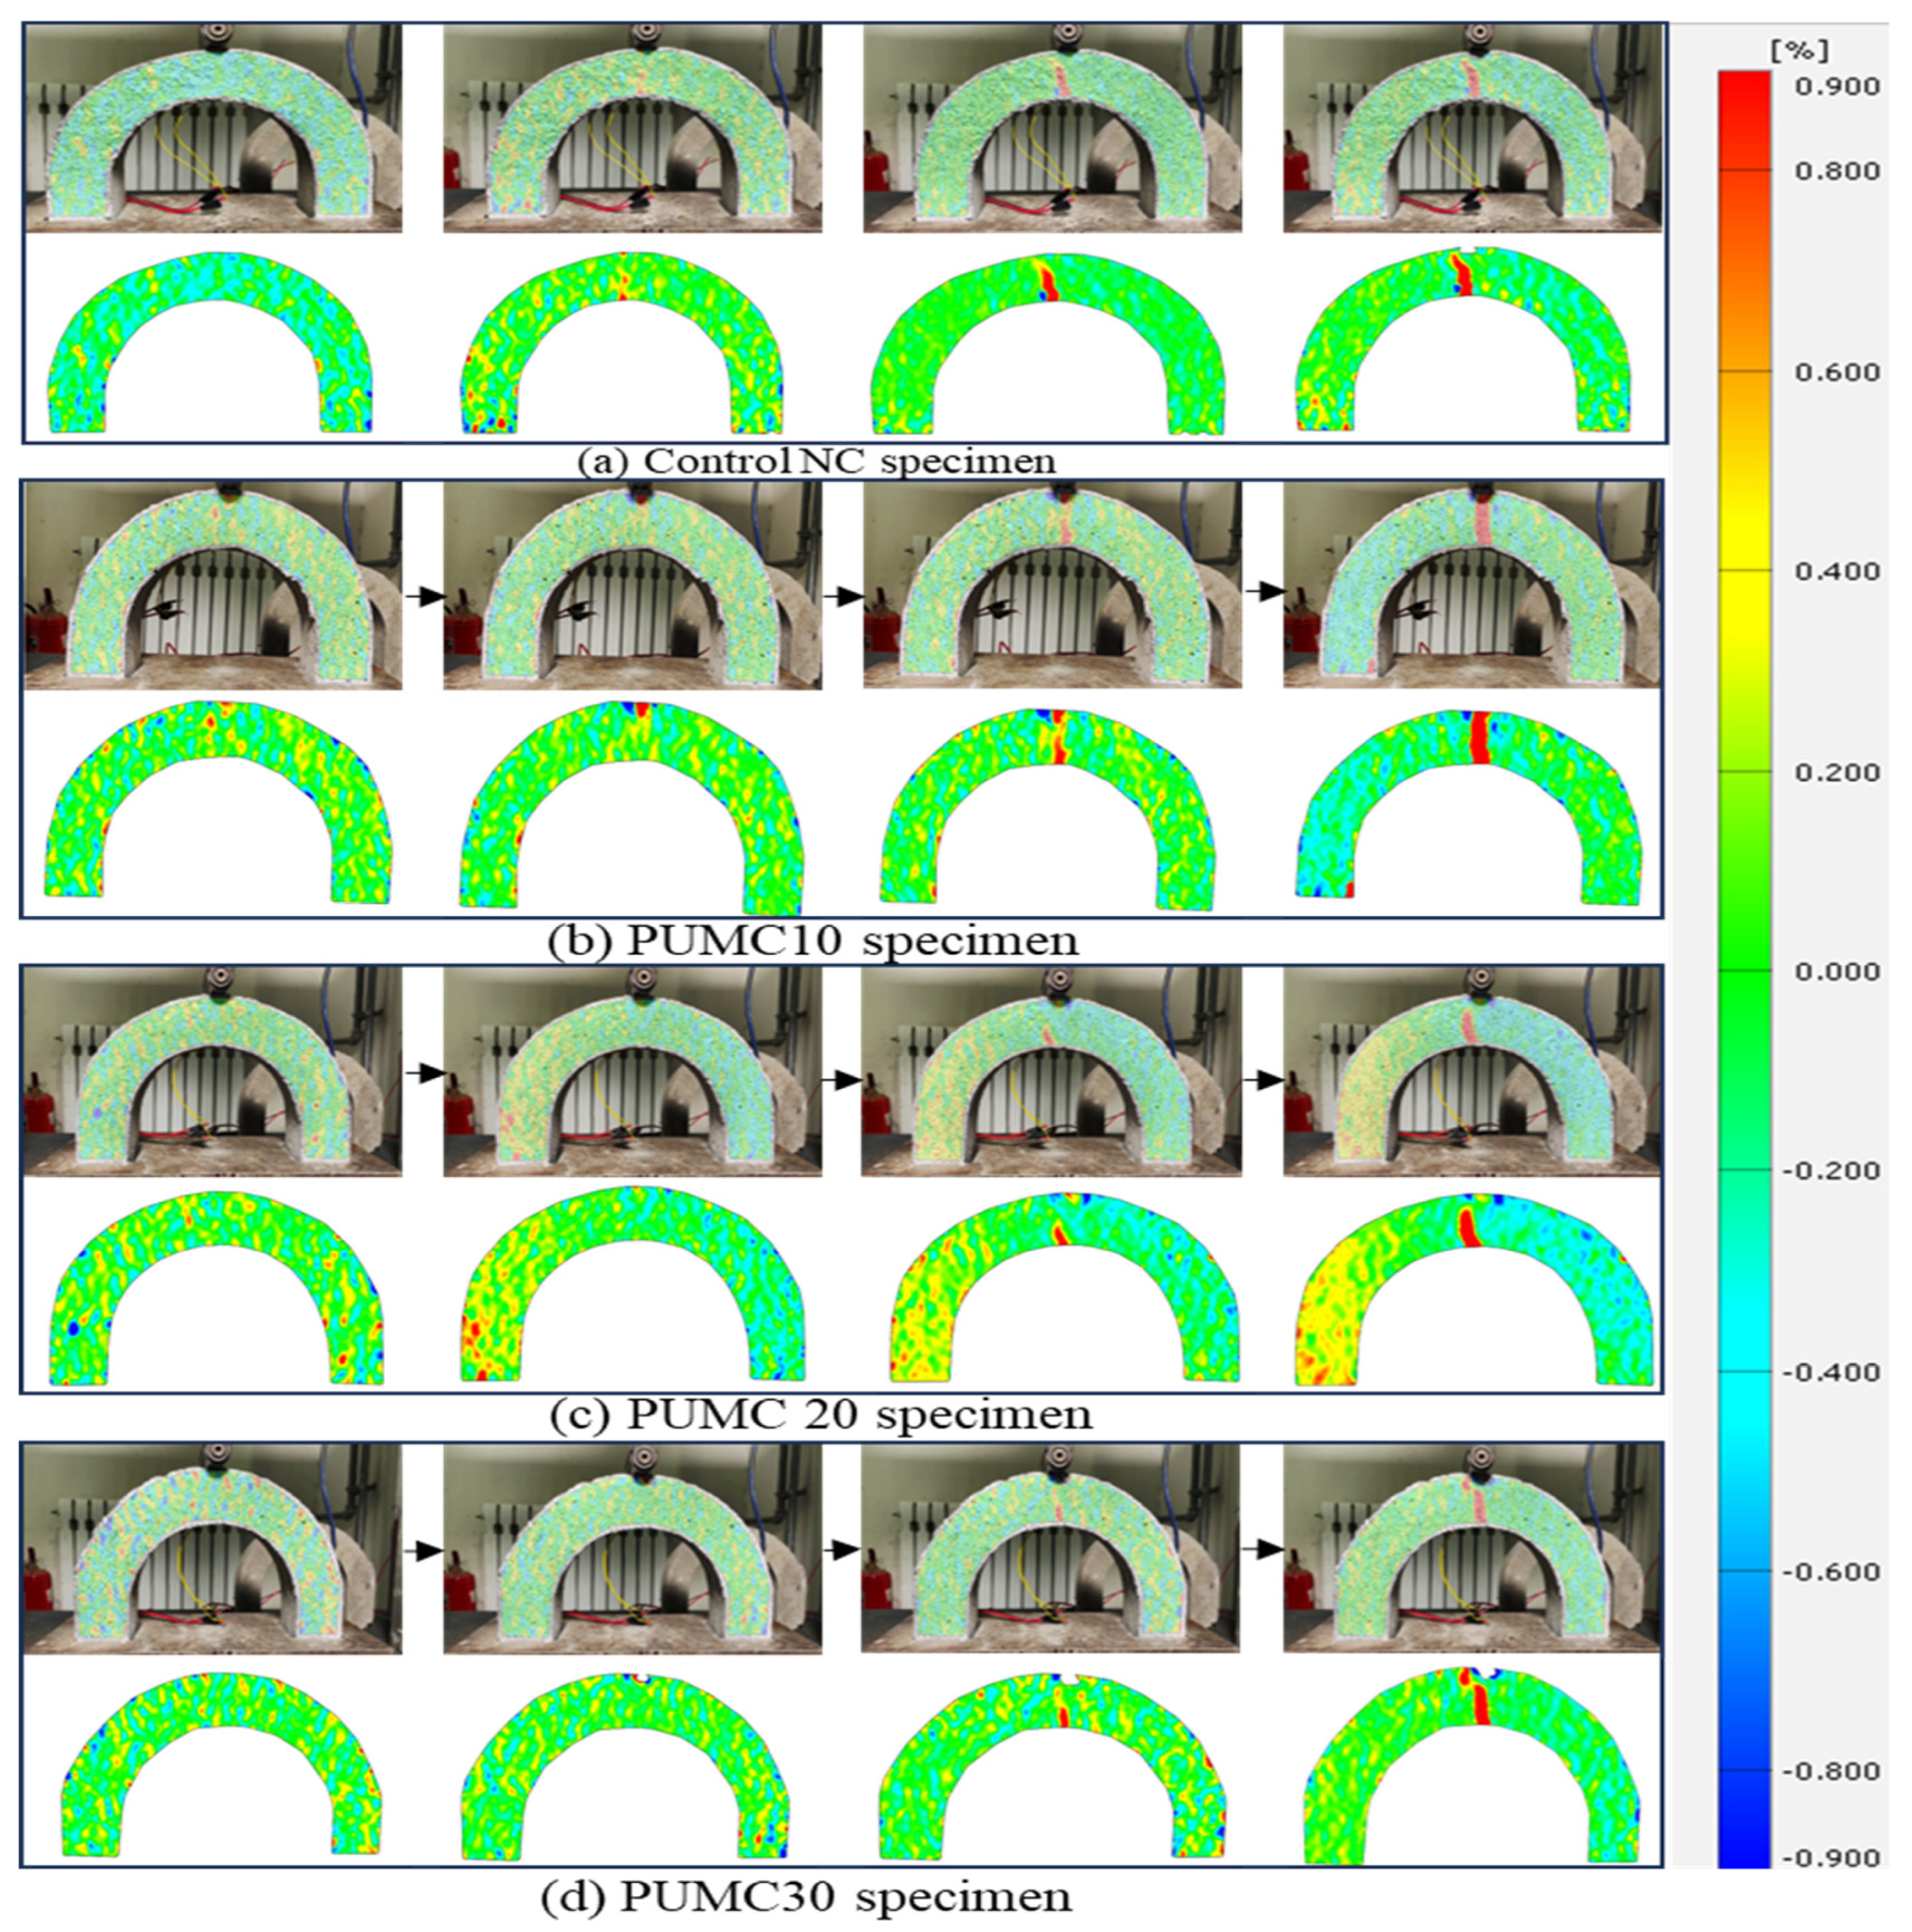
3.2. Failure Progression in U-Shaped Specimens Under Drop-Weight Using DIC
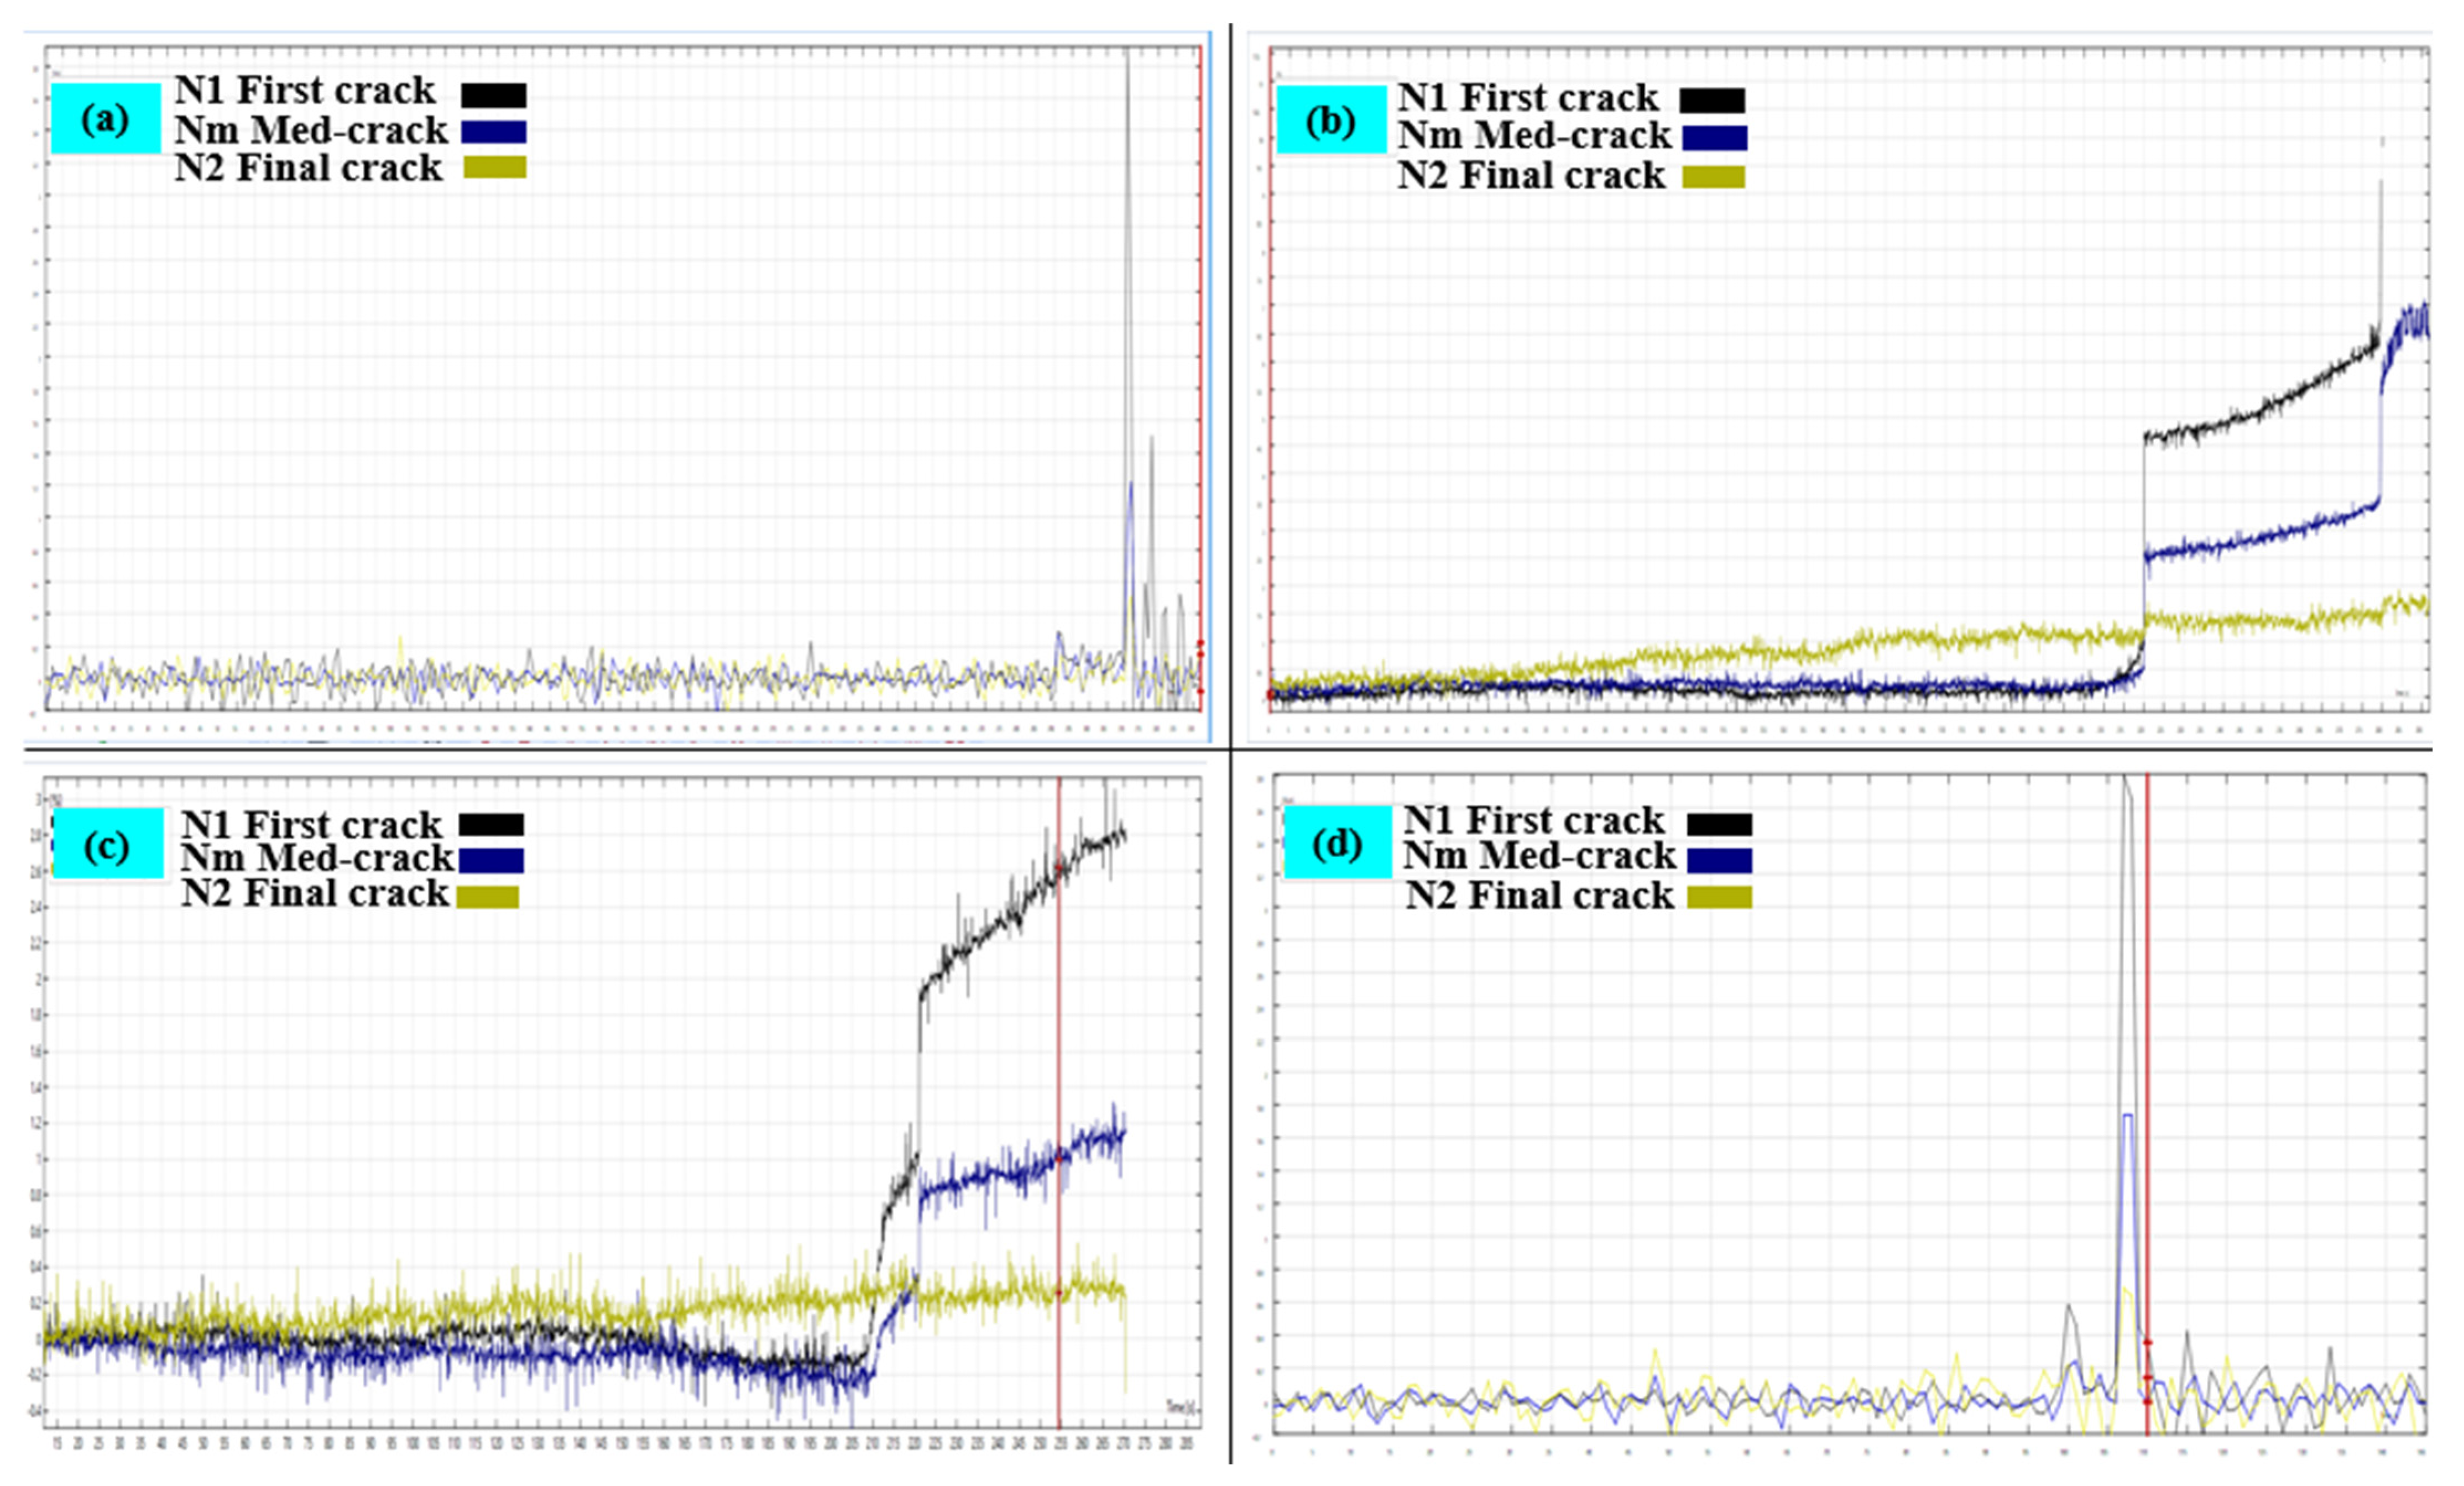
3.3. Failure Progression in U-Shaped Specimens Under Static Load Using DIC
4. Result of the Deep Learning Algorithm to Evaluate the Crack
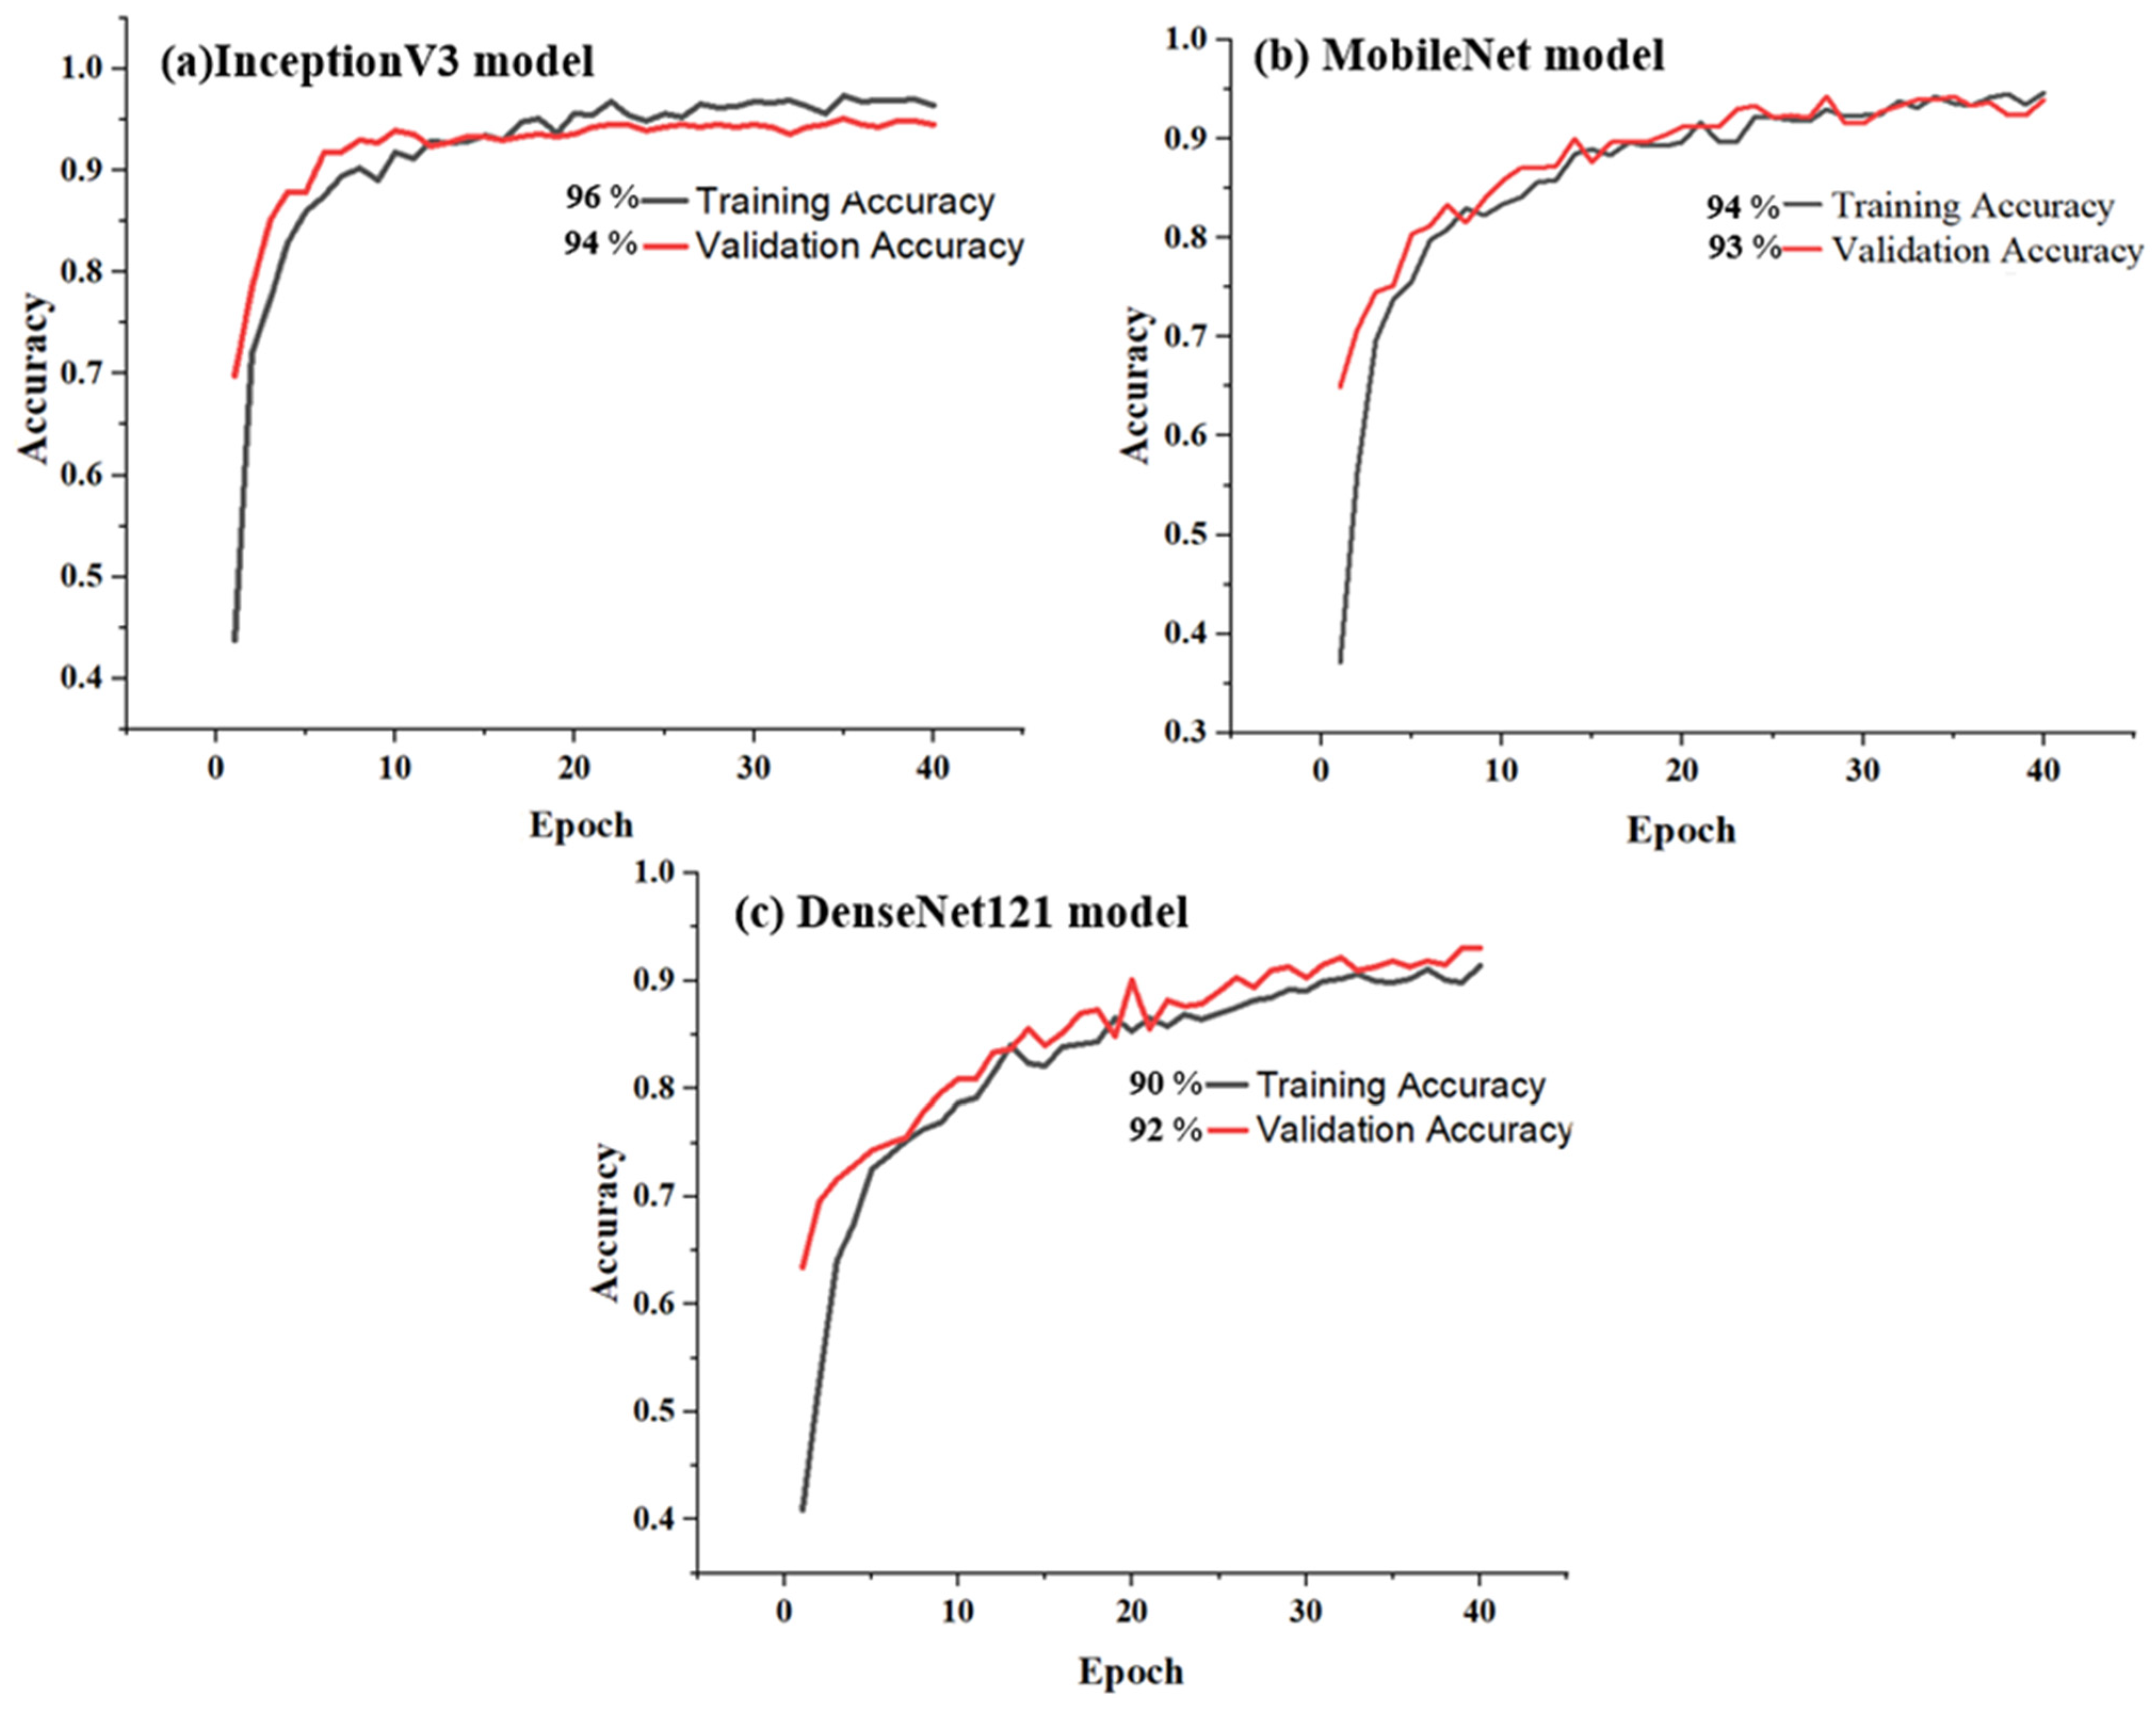
4.1. Performance Evaluation
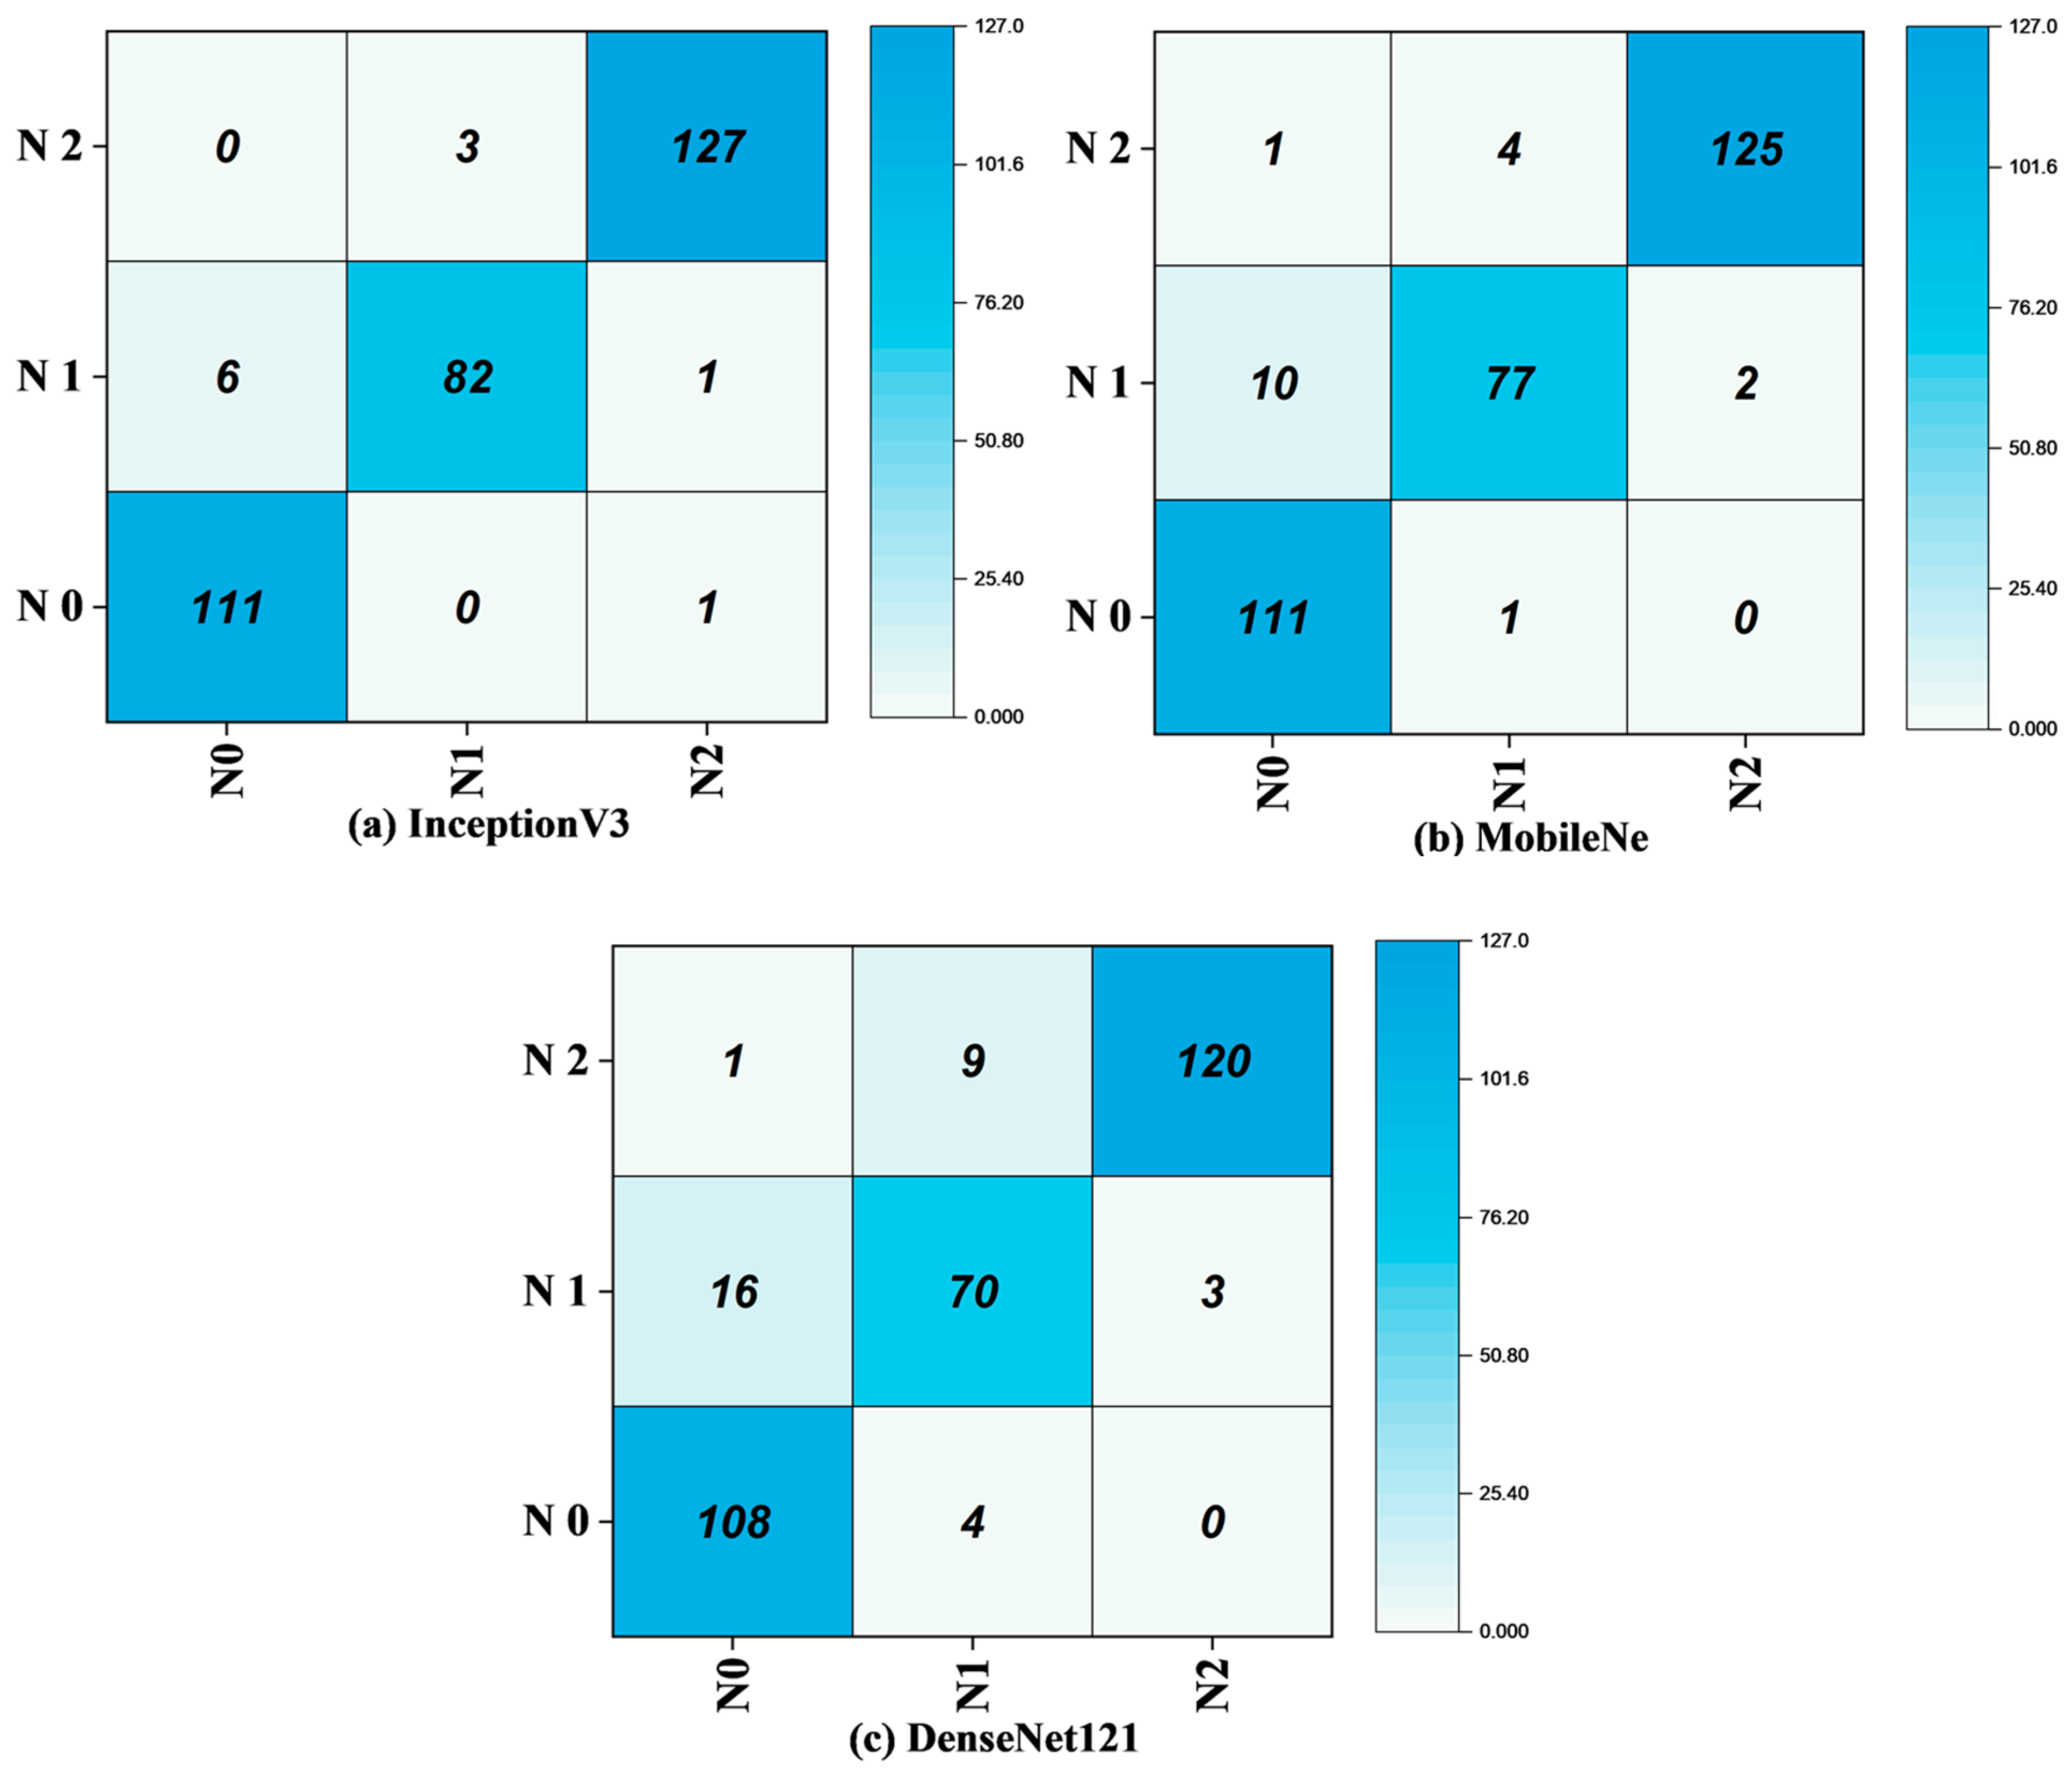
4.2. Confusion Matrix Analysis
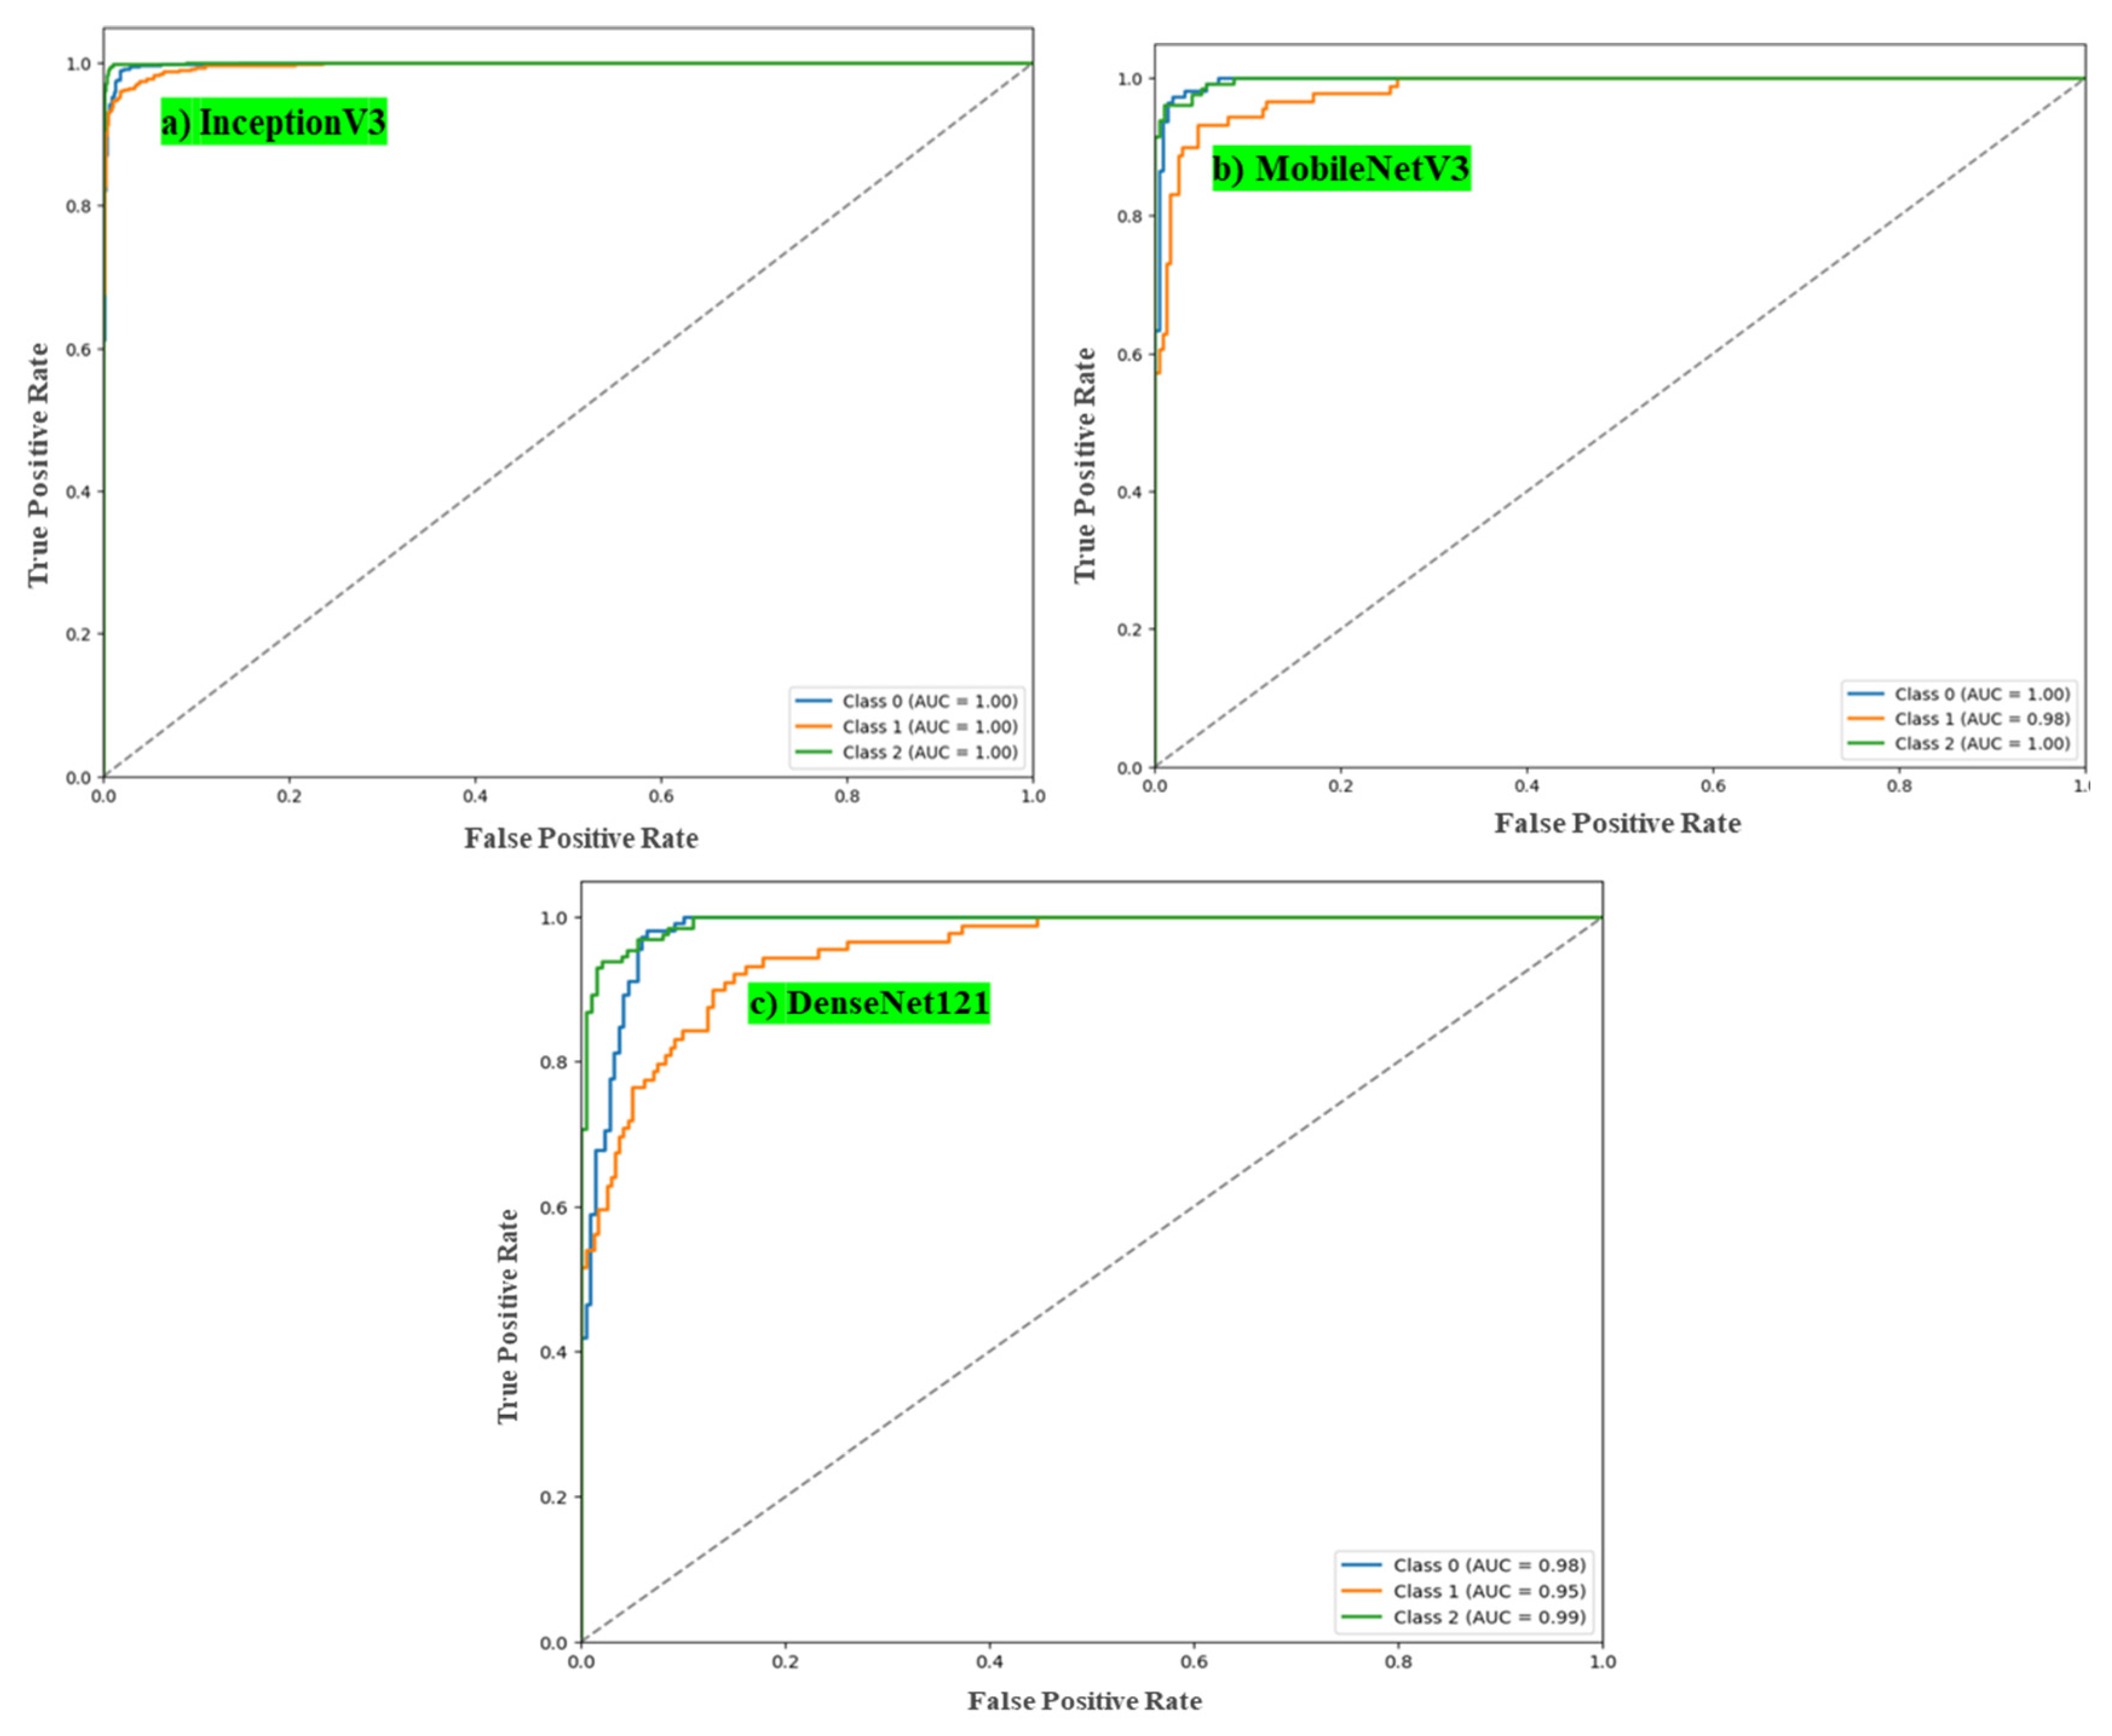
4.3. ROC Curve Analysis
5. Conclusions
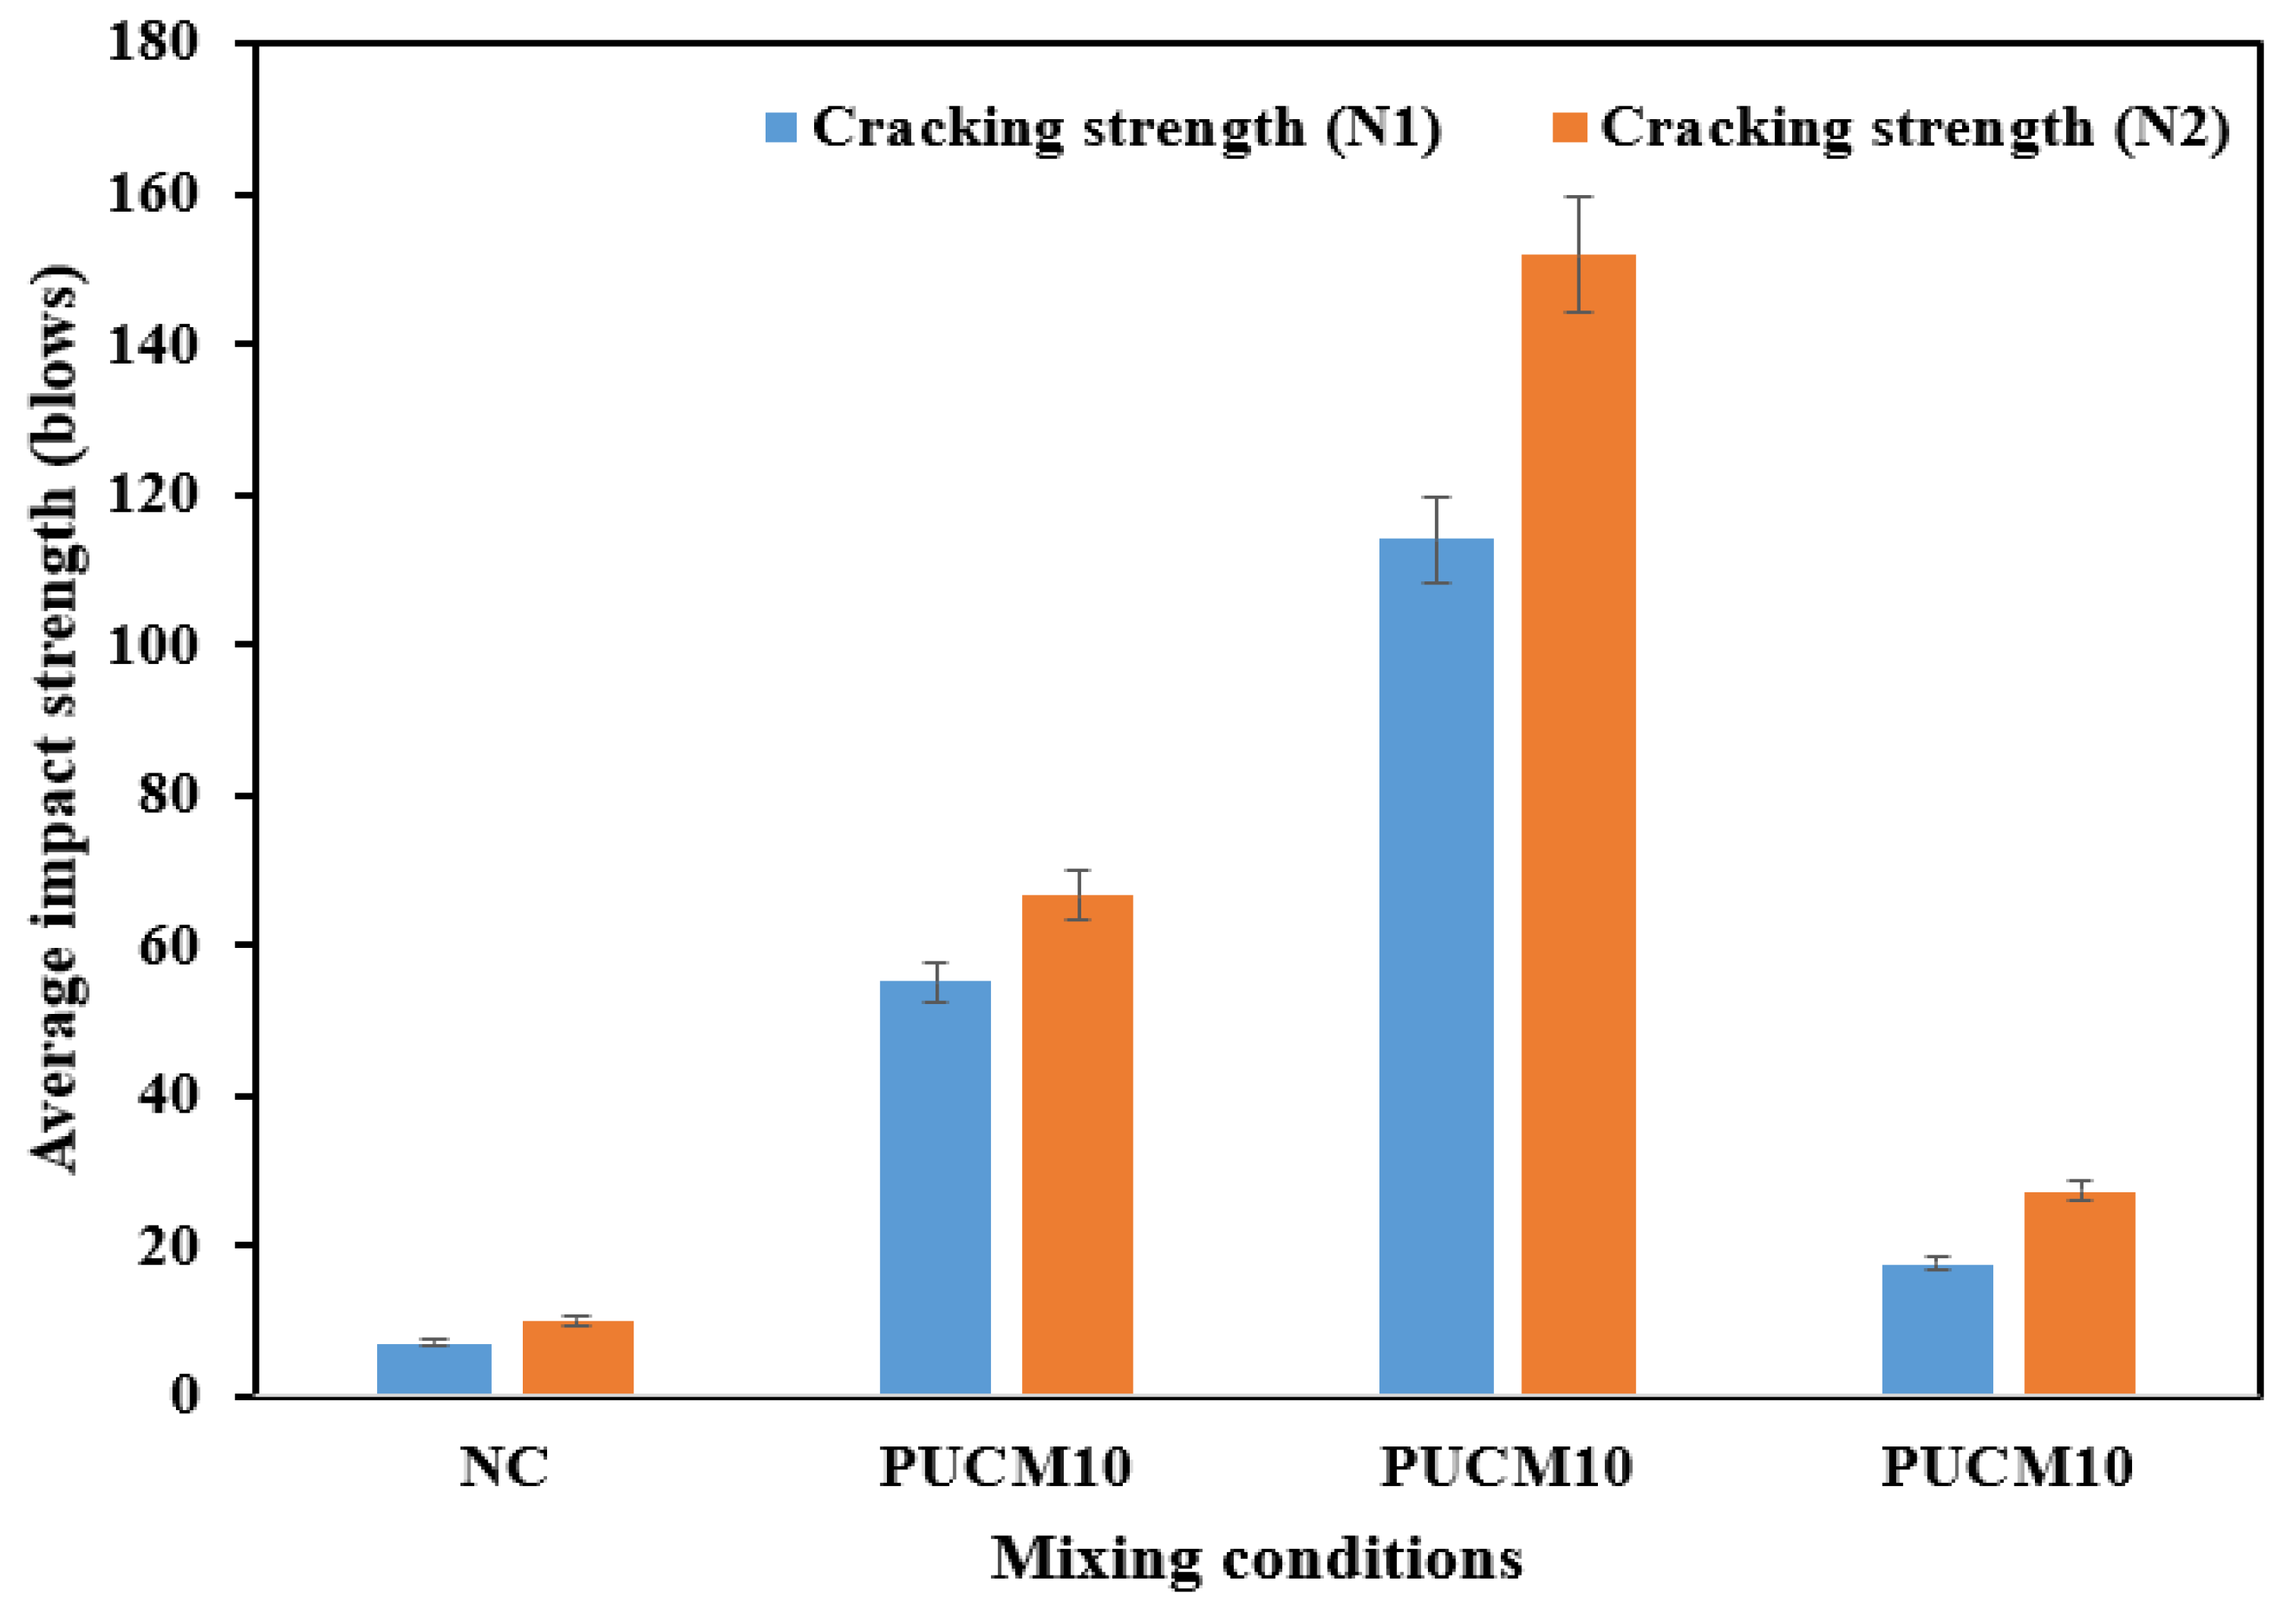
- PUMC20 specimens exhibited superior impact resistance, requiring an average of 151.9 blows to reach failure N2 compared to 27.3 blows for 30% PU and 10.1 for unmodified concrete. This optimal PU content improved energy absorption and delayed crack initiation. As captured by DIC, the enhanced strain distribution in PU20 specimens validated its efficacy in mitigating brittle failure.
- In PUMC30, mechanical performance declined significantly. Crack widths increased to 1.278 mm under impact loading, exceeding even unmodified concrete (1.236 mm). The strain localization observed in DIC analysis indicated reduced matrix cohesion, highlighting the importance of maintaining PU content below 20% to avoid compromising structural integrity.
- InceptionV3 outperformed other CNNs, achieving 96.67% accuracy, 98.44% precision for advanced cracks N2, and near-perfect AUC scores (1.00 for all classes). MobileNet and DenseNet121 demonstrated competitive but lower accuracies (94.56% and 90.03%, respectively), with DenseNet121 struggling to classify subtle N1 cracks (81.39% F1-score). The ability of the models to distinguish between pre-crack N0, initial crack N1, and advanced failure N2 stages underscores their potential for automating infrastructure inspections.
- DIC analysis revealed stark contrasts in failure modes; unmodified concrete exhibited abrupt, single-crack propagation (brittle failure), while PUMC showed distributed microcracking and gradual strain evolution. PUMC specimens demonstrated the most uniform strain distribution.
- The integration of DIC and CNNs effectively addresses key limitations of traditional inspection methods, such as subjectivity and time consumption. The proposed framework enables quantitative, real-time crack monitoring and classification through portable systems equipped with high-resolution imaging and lightweight CNN models deployed on edge devices. This offers a faster, more objective, and safer alternative for periodic inspections of structures such as bridges, sidewalks, and dams.
- The current study is limited to seventeen U-shaped specimens from each group; the behavior of polyurethane can vary based on formulation and curing conditions, which are not fully accounted for, and the DIC captured surface deformations. Generally, this study used an idealized impact load test. It is therefore recommended for future studies to focus on testing more specimens with varying PU compositions, conducting parametric numerical simulations (FEAs), and microstructure analysis to validate the experimental result.
Author Contributions
Funding
Institutional Review Board Statement
Data Availability Statement
Acknowledgments
Conflicts of Interest
References
- Anjali, R.; Venkatesan, G. Optimization of mechanical properties and composition of M-sand and pet particle added concrete using hybrid deep neural network-horse herd optimization algorithm. Constr. Build. Mater. 2022, 347, 128334. [Google Scholar] [CrossRef]
- Koch, C.; Georgieva, K.; Kasireddy, V.; Akinci, B.; Fieguth, P. A review on computer vision based defect detection and condition assessment of concrete and asphalt civil infrastructure. Adv. Eng. Inform. 2015, 29, 196–210. [Google Scholar] [CrossRef]
- Han, X.; Zhao, Z.; Chen, L.; Hu, X.; Tian, Y.; Zhai, C.; Wang, L.; Huang, X. Structural damage-causing concrete cracking detection based on a deep-learning method. Constr. Build. Mater. 2022, 337, 127562. [Google Scholar] [CrossRef]
- Laxman, K.; Ross, A.; Ai, L.; Henderson, A.; Elbatanouny, E.; Bayat, M.; Ziehl, P. Determination of vehicle loads on bridges by acoustic emission and an improved ensemble artificial neural network. Constr. Build. Mater. 2023, 364, 129844. [Google Scholar]
- Tan, X.; Bao, Y. Measuring crack width using a distributed fiber optic sensor based on optical frequency domain reflectometry. Measurement 2021, 172, 108945. [Google Scholar] [CrossRef]
- Reis, J.; Ferreira, A. Assessment of fracture properties of epoxy polymer concrete reinforced with short carbon and glass fibers. Constr. Build. Mater. 2004, 18, 523–528. [Google Scholar] [CrossRef]
- Laqsum, S.A.; Zhu, H.; Haruna, S.I.; Ibrahim, Y.E.; Al-shawafi, A. Mechanical and Impact Strength Properties of Polymer-Modified Concrete Supported with Machine Learning Method: Microstructure Analysis (SEM) Coupled with EDS. J. Compos. Sci. 2025, 9, 101. [Google Scholar] [CrossRef]
- Al-kahtani, M.; Zhu, H.; Ibrahim, Y.E.; Haruna, S. Experimental study on the strength and durability-related properties of ordinary Portland and rapid hardening Portland cement mortar containing polyurethane binder. Case Stud. Constr. Mater. 2022, 17, e01530. [Google Scholar] [CrossRef]
- Laqsum, S.A.; Zhu, H.; Haruna, S.; Bo, Z.; Al-shawafi, A.; Amer, M. Impact resistance properties of U-shaped fiber-reinforced concrete modified with PU binder. J. Build. Eng. 2023, 80, 108068. [Google Scholar] [CrossRef]
- Haruna, S.I.; Ibrahim, Y.E.; Han, Z.; Farouk, A.I.B. Flexural response of concrete specimen retrofitted with PU grout material: Experimental and numerical modeling. Polymers 2023, 15, 4114. [Google Scholar] [CrossRef]
- Liu, D.; Wang, C.; Gonzalez-Libreros, J.; Guo, T.; Cao, J.; Tu, Y.; Elfgren, L.; Sas, G. A review of concrete properties under the combined effect of fatigue and corrosion from a material perspective. Constr. Build. Mater. 2023, 369, 130489. [Google Scholar] [CrossRef]
- Poonguzhali, A.; Shaikh, H.; Dayal, R.; Khatak, H. A review on degradation mechanism and life estimation of civil structures. Corros. Rev. 2008, 26, 215–294. [Google Scholar] [CrossRef]
- Valença, J.; Puente, I.; Júlio, E.; González-Jorge, H.; Arias-Sánchez, P. Assessment of cracks on concrete bridges using image processing supported by laser scanning survey. Constr. Build. Mater. 2017, 146, 668–678. [Google Scholar] [CrossRef]
- Tan, X.; Fan, L.; Huang, Y.; Bao, Y. Detection visualization; quantification, and warning of pipe corrosion using distributed fiber optic sensors. Autom. Constr. 2021, 132, 103953. [Google Scholar] [CrossRef]
- Al-shawafi, A.; Zhu, H.; Laqsum, S.A.; Haruna, S.; Ibrahi, Y.E. Improved static and impact properties of UHPFRC retrofitted with PU grout materials: Experiments and ML algorithms. Results Eng. 2024, 23, 102655. [Google Scholar] [CrossRef]
- Imjai, T.; Wattanapanich, C.; Sridhar, R.; Garcia, R.; Thomas, B.S. Optimizing Recycled Aggregate Concrete for Severe Conditions Through Machine Learning Techniques: A Review. Eng. Sci. 2024, 31, 1191. [Google Scholar]
- Kefyalew, F.; Imjai, T.; Aosai, P.; Garcia, R.; Kim, B.; Abdalla, H.M.; Raman, S.N. A new equation to predict the shear strength of recycled aggregate concrete Z push-off specimens. Cem. Concr. Res. 2023, 169, 107181. [Google Scholar]
- Hemalatha, K.; Prasad, D.R. Assessment of flexural behaviour and a novel deformability approach of concrete beams reinforced with GFRP and steel bars—A digital image correlation technique. Structures 2025, 73, 108412. [Google Scholar] [CrossRef]
- Li, X.; Ma, F.; Chen, X.; Hu, J.; Wang, J. Fracture behavior investigation of self-compacting rubberized concrete by DIC and mesoscale modeling. J. Clean. Prod. 2023, 384, 135503. [Google Scholar] [CrossRef]
- Haruna, S.I.; Ibrahim, Y.E.; Al-Shawafi, A. Evaluation of Bond Strength of Concrete Repaired Using Polyurethane Grout Material under Static and Impact Loads Coupled with Statistical Analysis. Polymers 2024, 16, 2729. [Google Scholar] [CrossRef]
- Hadinata, P.N.; Simanta, D.; Eddy, L.; Nagai, K. Crack detection on concrete surfaces using Deep Encoder-Decoder Convolutional Neural Network: A comparison study between U-Net and DeepLabV3+. J. Civ. Eng. Forum 2021, 7, 323–334. [Google Scholar] [CrossRef]
- Nishikawa, T.; Yoshida, J.; Sugiyama, T.; Fujino, Y. Concrete crack detection by multiple sequential image filtering. Comput.-Aided Civ. Infrastruct. Eng. 2012, 27, 29–47. [Google Scholar] [CrossRef]
- Metni, N.; Hamel, T. A UAV for bridge inspection: Visual servoing control law with orientation limits. Autom. Constr. 2017, 17, 3–10. [Google Scholar] [CrossRef]
- Teng, S.; Liu, Z.; Chen, G.; Cheng, L. Concrete crack detection based on well-known feature extractor model and the YOLO_v2 network. Appl. Sci. 2021, 11, 813. [Google Scholar] [CrossRef]
- Geetha, G.K.; Yang, H.-J.; Sim, S.-H. Fast detection of missing thin propagating cracks during deep-learning-based concrete crack/non-crack classification. Sensors 2023, 23, 1419. [Google Scholar] [CrossRef]
- Laxman, K.; Tabassum, N.; Ai, L.; Cole, C.; Ziehl, P. Automated crack detection and crack depth prediction for reinforced concrete structures using deep learning. Constr. Build. Mater. 2023, 370, 130709. [Google Scholar] [CrossRef]
- Zhou, S.X.; Pan, Y.; Guan, J.; Wang, Q. Multi-band Feature Images Concrete Crack Segmentation Framework Using Deep Learning. KSCE J. Civ. Eng. 2024, 28, 3902–3912. [Google Scholar] [CrossRef]
- Abdel-Qader, I.; Abudayyeh, O.; Kelly, M.E. Analysis of edge-detection techniques for crack identification in bridges. J. Comput. Civ. Eng. 2003, 17, 255–263. [Google Scholar] [CrossRef]
- Yamaguchi, T.; Hashimoto, S. Improved percolation-based method for crack detection in concrete surface images. In Proceedings of the 2008 19th International Conference on Pattern Recognition, Tampa, FL, USA, 8–11 December 2008; pp. 1–4. [Google Scholar]
- Liu, J.; Yang, Z.; Qi, H.; Jiao, T.; Li, D.; Wu, Z.; Zheng, N.; Xu, S. Deep learning-assisted automatic quality assessment of concrete surfaces with cracks and bugholes. Adv. Eng. Inform. 2024, 62, 102577. [Google Scholar] [CrossRef]
- Ojeda, J.M.P.; Cayatopa-Calderón, B.A.; Huatangari, L.Q.; Tineo, J.L.P.; Pino, M.E.M.; Pintado, W.R. Convolutional neural network for predicting failure type in concrete cylinders during compression testing. Civ. Eng. J. 2023, 9, 2105–2119. [Google Scholar] [CrossRef]
- Islam, M.M.; Hossain, M.B.; Akhtar, M.N.; Moni, M.A.; Hasan, K.F. CNN based on transfer learning models using data augmentation and transformation for detection of concrete crack. Algorithms 2022, 15, 287. [Google Scholar] [CrossRef]
- Zhang, K.; Li, H.; Wang, Z.; Zhao, X. Feature recognition and detection for road damage based on intelligent inspection terminal. In Proceedings of the Smart Structures and NDE for Industry 4.0, Smart Cities, and Energy Systems, Online, 27 April–8 May 2020; Volume 11382, pp. 117–129. [Google Scholar]
- Ye, W.; Deng, S.; Ren, J.; Xu, X.; Zhang, K.; Du, W. Deep learning-based fast detection of apparent concrete crack in slab tracks with dilated convolution. Constr. Build. Mater. 2022, 329, 127157. [Google Scholar] [CrossRef]
- Zhu, X.-C.; Zhu, H.; Li, H.-R. Drop-weight impact test on U-shape concrete specimens with statistical and regression analyses. Materials 2015, 8, 5877–5890. [Google Scholar] [CrossRef] [PubMed]
- GB 175-2007; 2007: Common Portland Cements. Standardization Administration of China: Beijing, China, 2007.
- Demir, M.M.; Yilgor, I.; Yilgor, E.; Erman, B. Electrospinning of polyurethane fibers. Polymer 2002, 43, 3303–3309. [Google Scholar] [CrossRef]
- Carrera, V.; Garcia-Morales, M.; Partal, P.; Gallegos, C. Novel bitumen/isocyanate-based reactive polymer formulations for the paving industry. Rheol. Acta 2010, 49, 563–572. [Google Scholar] [CrossRef]
- Al-shawafi, A.; Zhu, H.; Haruna, S.; Bo, Z.; Laqsum, S.A.; Borito, S.M. Impact resistance of ultra-high-performance concrete retrofitted with polyurethane grout material: Experimental investigation and statistical analysis. Structures 2023, 55, 185–200. [Google Scholar] [CrossRef]
- Al-kahtani, M.; Zhu, H.; Ibrahim, Y.E.; Haruna, S.; Al-qahtani, S. Study on the Mechanical Properties of Polyurethane-Cement Mortar Containing Nanosilica: RSM and Machine Learning Approach. Appl. Sci. 2023, 13, 13348. [Google Scholar] [CrossRef]
- Hepburn, C. Polyurethane Elastomers; Springer Science & Business Media: Berlin/Heidelberg, Germany, 2012. [Google Scholar]
- Yilin, P.; Wenhua, Z.; Wanting, Z.; Yunsheng, Z. Study on the mechanical behaviors and failure mechanism of polyurethane cement composites under uniaxial compression and tension. Arch. Civ. Mech. Eng. 2021, 22, 18. [Google Scholar] [CrossRef]
- Haruna, S.I.; Zhu, H.; Jiang, W.; Shao, J. Evaluation of impact resistance properties of polyurethane-based polymer concrete for the repair of runway subjected to repeated drop-weight impact test. Constr. Build. Mater. 2021, 309, 125152. [Google Scholar] [CrossRef]
- Al-shawafi, A.; Zhu, H.; Haruna, S.; Bo, Z.; Laqsum, S.A. Experimental study and machine learning algorithms for evaluating the performance of U-shaped ultra-high performance reinforced fiber concrete under static and impact loads. J. Build. Eng. 2023, 70, 106389. [Google Scholar] [CrossRef]
- Laqsum, S.A.; Zhu, H.; Bo, Z.; Haruna, S.; Al-shawafi, A.; Borito, S.M. Static properties and impact resistance performance of U-shaped PU-modified concrete under repeated drop-weight impact load. Arch. Civ. Mech. Eng. 2023, 23, 227. [Google Scholar] [CrossRef]
- GB/T 50081-2019; Standard for Test Method of Mechanical Properties on Ordinary Concrete. Ministry of Construction of the People’s Republic of China: Beijing, China, 2019.
- Ali, R.; Chuah, J.H.; Talip, M.S.A.; Mokhtar, N.; Shoaib, M.A. Structural crack detection using deep convolutional neural networks. Autom. Constr. 2022, 133, 103989. [Google Scholar] [CrossRef]
- Wijaya, I.G.P.S.; Dwitama, A.P.J.; Widiartha, I.B.K.; Putra, S.A. Classification of building cracks image using the convolutional neural network method. In Proceedings of the 2020 International Conference on Advancement in Data Science, E-Learning and Information Systems (ICADEIS), Lombok, Indonesia, 20–21 October 2020; pp. 1–6. [Google Scholar]
- Shorten, C.; Khoshgoftaar, T.M. A survey on image data augmentation for deep learning. J. Big Data 2019, 6, 60. [Google Scholar] [CrossRef]
- Rawat, W.; Wang, Z. Deep convolutional neural networks for image classification: A comprehensive review. Neural Comput. 2017, 29, 2352–2449. [Google Scholar] [CrossRef]
- Howard, A.G. Mobilenets: Efficient convolutional neural networks for mobile vision applications. arXiv 2017, arXiv:1704.04861. [Google Scholar]
- Huang, G.; Liu, Z.; Van Der Maaten, L.; Weinberger, K.Q. Densely connected convolutional networks. In Proceedings of the IEEE Conference on Computer Vision and Pattern Recognition, Honolulu, HI, USA, 21–26 July 2017; pp. 4700–4708. [Google Scholar]
- Nguyen, L.D.; Lin, D.; Lin, Z.; Cao, J. Deep CNNs for microscopic image classification by exploiting transfer learning and feature concatenation. In Proceedings of the 2018 IEEE International Symposium on Circuits and Systems (ISCAS), Florence, Italy, 27–30 May 2018; pp. 1–5. [Google Scholar]
- Saeik, F.; Avgeris, M.; Spatharakis, D.; Santi, N.; Dechouniotis, D.; Violos, J.; Leivadeas, A.; Mitton, N.; Athanasopoulos, N.; Papavassiliou, S. Task offloading in Edge and Cloud Computing: A survey on mathematical, artificial intelligence and control theory solutions. Comput. Netw. 2021, 195, 108177. [Google Scholar] [CrossRef]
- Vujović, Z. Classification model evaluation metrics. Int. J. Adv. Comput. Sci. Appl. 2021, 12, 599–606. [Google Scholar] [CrossRef]
- Tang, J.; Liu, J.; Yu, C.; Wang, R. Influence of cationic polyurethane on mechanical properties of cement-based materials and its hydration mechanism. Constr. Build. Mater. 2017, 137, 494–504. [Google Scholar] [CrossRef]
- ASTM C78-09; Standard Test Method for Flexural Strength of Concrete (Using Simple Beam with Third-Point Loading). ASTM: West Conshohocken, PA, USA, 2010.
- Hussain, Z.; Pu, Z.; Hussain, A.; Ahmed, S.; Shah, A.U.; Ali, A.; Ali, A. Effect of fiber dosage on water permeability using a newly designed apparatus and crack monitoring of steel fiber–reinforced concrete under direct tensile loading. Struct. Health Monit. 2021, 21, 2083–2096. [Google Scholar] [CrossRef]
- Omondi, B.; Aggelis, D.G.; Sol, H.; Sitters, C. Improved crack monitoring in structural concrete by combined acoustic emission and digital image correlation techniques. Struct. Health Monit. 2016, 15, 359–378. [Google Scholar] [CrossRef]


| PU Binder | Viscosity (CPS) | Appearance | Curing Time (h) | Tensile Strength(MPa) | |
|---|---|---|---|---|---|
| Initial | Final | ||||
| Castor oil | 35,000 | Gray-white and sticky | - | - | - |
| PAPI | 250 | Brown and transparent | - | - | - |
| PU binder | - | - | 3.5 | 72 | 5.5 |
| Specimen ID | Cement | Sand | Coarse Aggregate | Water | PU Binder |
|---|---|---|---|---|---|
| NC-PU0 | 425 | 718 | 966 | 170 | 0.00 |
| PUMC10 | 425 | 718 | 966 | 170 | 42.5 |
| PUMC20 | 425 | 718 | 966 | 170 | 85.0 |
| PUMC30 | 425 | 718 | 966 | 170 | 127.5 |
| Matric | Equation | Definition |
|---|---|---|
| Accuracy | Accuracy refers to the ratio of correctly classified cases (both positive and negative) to the total number of cases. | |
| Precision | Measures the proportion of true positive predictions out of all instances predicted as positive, indicating how well the model avoids false positives. | |
| Recall | Measures the proportion of true positive cases that were correctly identified by the model. | |
| F1-score | The F1-score represents the harmonic mean of precision and recall. It is commonly used to assess a model’s balance between these two metrics. |
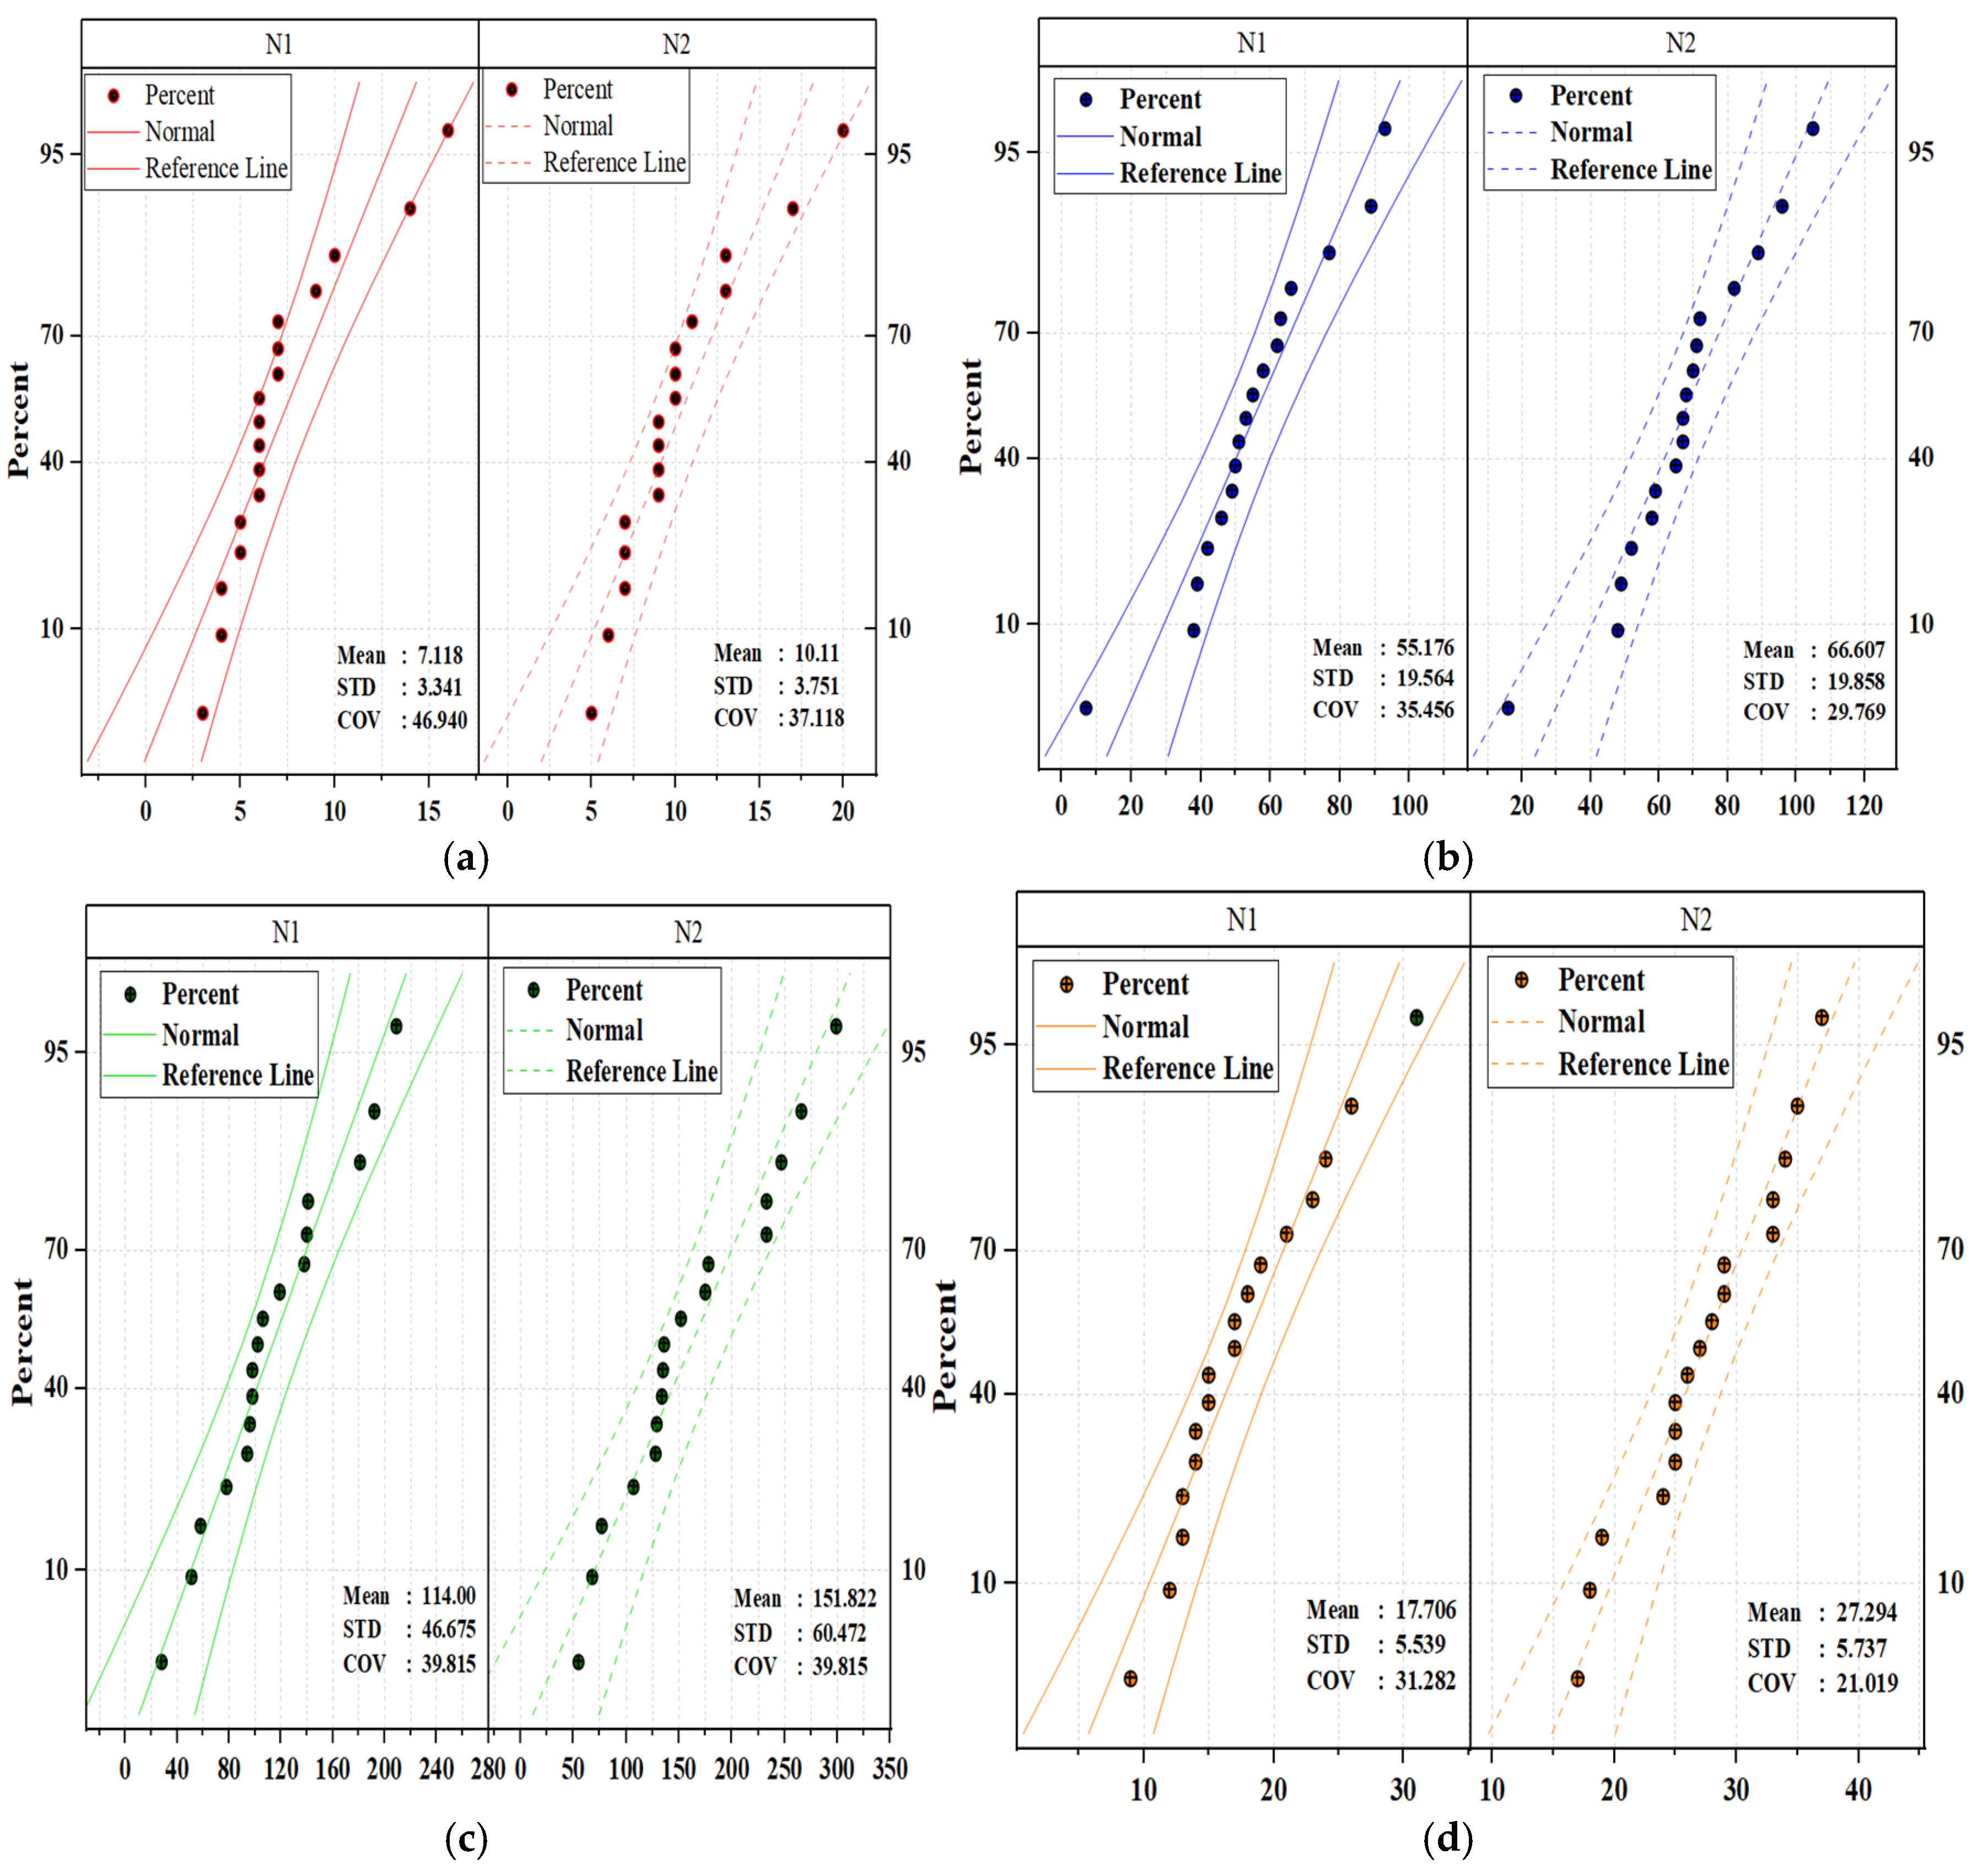
| Parameter | NC | PUMC10 | PUMC20 | PUMC30 | ||||
|---|---|---|---|---|---|---|---|---|
| N1 | N2 | N1 | N2 | N1 | N2 | N1 | N2 | |
| Mean | 7 | 10 | 55 | 66 | 114 | 151 | 17 | 27 |
| STD | 3 | 3 | 19 | 19 | 46 | 60 | 5 | 5.7 |
| COV (%) | 46 | 37 | 35 | 29 | 40 | 39 | 31 | 21 |
| Type | Precision | Recall | F1-Score | Support | Model |
|---|---|---|---|---|---|
| N0 | 94.87 | 99.10 | 96.94 | 111 | InceptionV3 |
| N1 | 96.47 | 92.13 | 94.25 | 110 | |
| N2 | 98.44 | 97.69 | 98.06 | 110 | |
| accuracy | 96.67 | 96.67 | 96.67 | 96 | |
| macro-avg | 96.59 | 96.31 | 96.42 | 331 | |
| weighted avg | 96.70 | 96.67 | 96.66 | 331 |
| Type | Precision | Recall | F1-Score | Support | Model |
|---|---|---|---|---|---|
| N0 | 90.98 | 99.10 | 94.87 | 111 | MobileNet |
| N1 | 93.90 | 86.51 | 90.05 | 110 | |
| N2 | 98.42 | 96.15 | 97.27 | 110 | |
| Accuracy | 94.56 | 94.56 | 94.56 | 94 | |
| Macro-average | 94.43 | 93.92 | 94.06 | 331 | |
| Weighted average | 94.69 | 94.56 | 94.52 | 331 |
| Type | Precision | Recall | F1-Score | Support | Model |
|---|---|---|---|---|---|
| N0 | 86.4 | 96.42 | 91.13 | 111 | DenseNet121 |
| N1 | 84.33 | 78.65 | 81.39 | 110 | |
| N2 | 97.56 | 92.30 | 94.86 | 110 | |
| accuracy | 90.03 | 90.03 | 90.03 | 90 | |
| macro-avg | 89.43 | 89.12 | 89.13 | 331 | |
| weighted avg | 90.22 | 90.03 | 89.98 | 331 |
| Class | ROC InceptionV3 | ROC MobileNet | ROC DenseNet121 |
|---|---|---|---|
| N0 | 1 | 1 | 98 |
| N1 | 1 | 0.98 | 96 |
| N2 | 1 | 1 | 99 |
Disclaimer/Publisher’s Note: The statements, opinions and data contained in all publications are solely those of the individual author(s) and contributor(s) and not of MDPI and/or the editor(s). MDPI and/or the editor(s) disclaim responsibility for any injury to people or property resulting from any ideas, methods, instructions or products referred to in the content. |
© 2025 by the authors. Licensee MDPI, Basel, Switzerland. This article is an open access article distributed under the terms and conditions of the Creative Commons Attribution (CC BY) license (https://creativecommons.org/licenses/by/4.0/).
Share and Cite
Laqsum, S.A.; Zhu, H.; Haruna, S.I.; Ibrahim, Y.E.; Amer, M.; Al-Shawafi, A.; Ahmed, O.S. Impact and Failure Analysis of U-Shaped Concrete Containing Polyurethane Materials: Deep Learning and Digital Imaging Correlation-Based Approach. Polymers 2025, 17, 1245. https://doi.org/10.3390/polym17091245
Laqsum SA, Zhu H, Haruna SI, Ibrahim YE, Amer M, Al-Shawafi A, Ahmed OS. Impact and Failure Analysis of U-Shaped Concrete Containing Polyurethane Materials: Deep Learning and Digital Imaging Correlation-Based Approach. Polymers. 2025; 17(9):1245. https://doi.org/10.3390/polym17091245
Chicago/Turabian StyleLaqsum, Saleh Ahmad, Han Zhu, Sadi I. Haruna, Yasser E. Ibrahim, Mohammed Amer, Ali Al-Shawafi, and Omar Shabbir Ahmed. 2025. "Impact and Failure Analysis of U-Shaped Concrete Containing Polyurethane Materials: Deep Learning and Digital Imaging Correlation-Based Approach" Polymers 17, no. 9: 1245. https://doi.org/10.3390/polym17091245
APA StyleLaqsum, S. A., Zhu, H., Haruna, S. I., Ibrahim, Y. E., Amer, M., Al-Shawafi, A., & Ahmed, O. S. (2025). Impact and Failure Analysis of U-Shaped Concrete Containing Polyurethane Materials: Deep Learning and Digital Imaging Correlation-Based Approach. Polymers, 17(9), 1245. https://doi.org/10.3390/polym17091245