

Correlation Between Conditions of Polyaniline Interlayer Formation and the Structure and Performance of Thin-Film Composite Membranes for Nanofiltration Prepared via Interfacial Polymerization

 ,
,  ,
,  ,
, 

Abstract
1. Introduction
2. Materials and Methods
2.1. Materials
2.2. Methods
2.2.1. Membrane Preparation
2.2.2. Membrane Characterization
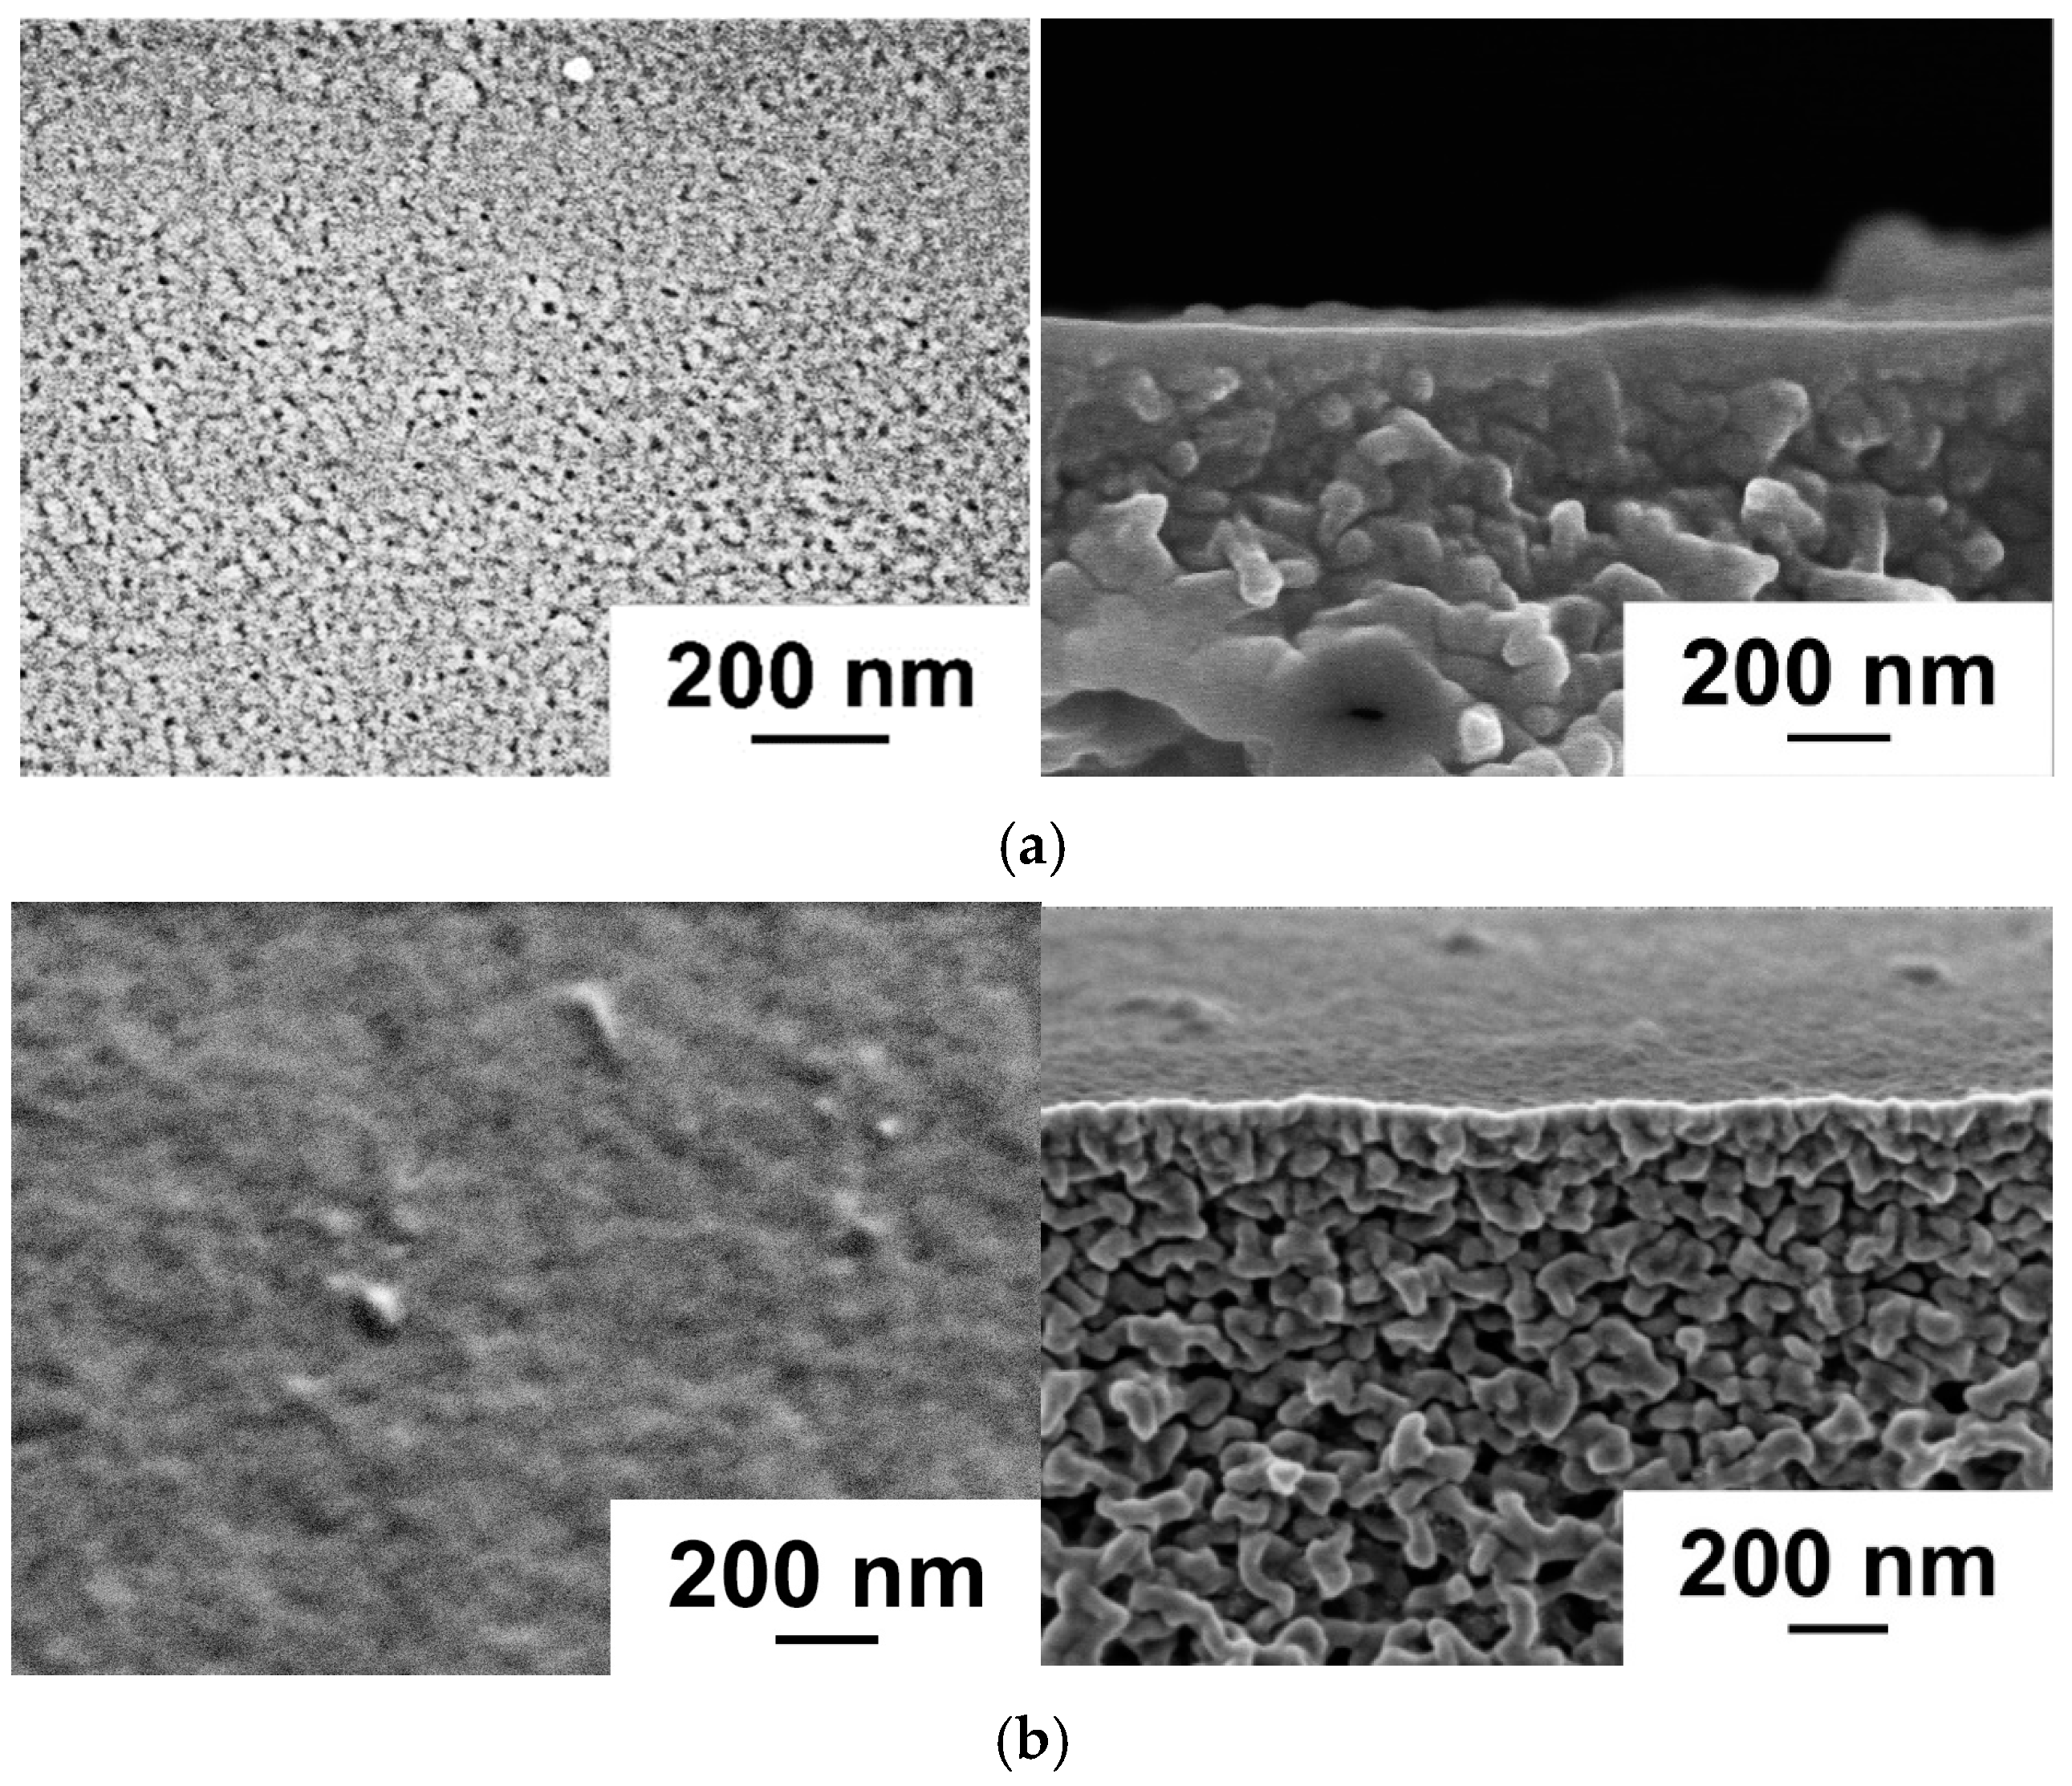
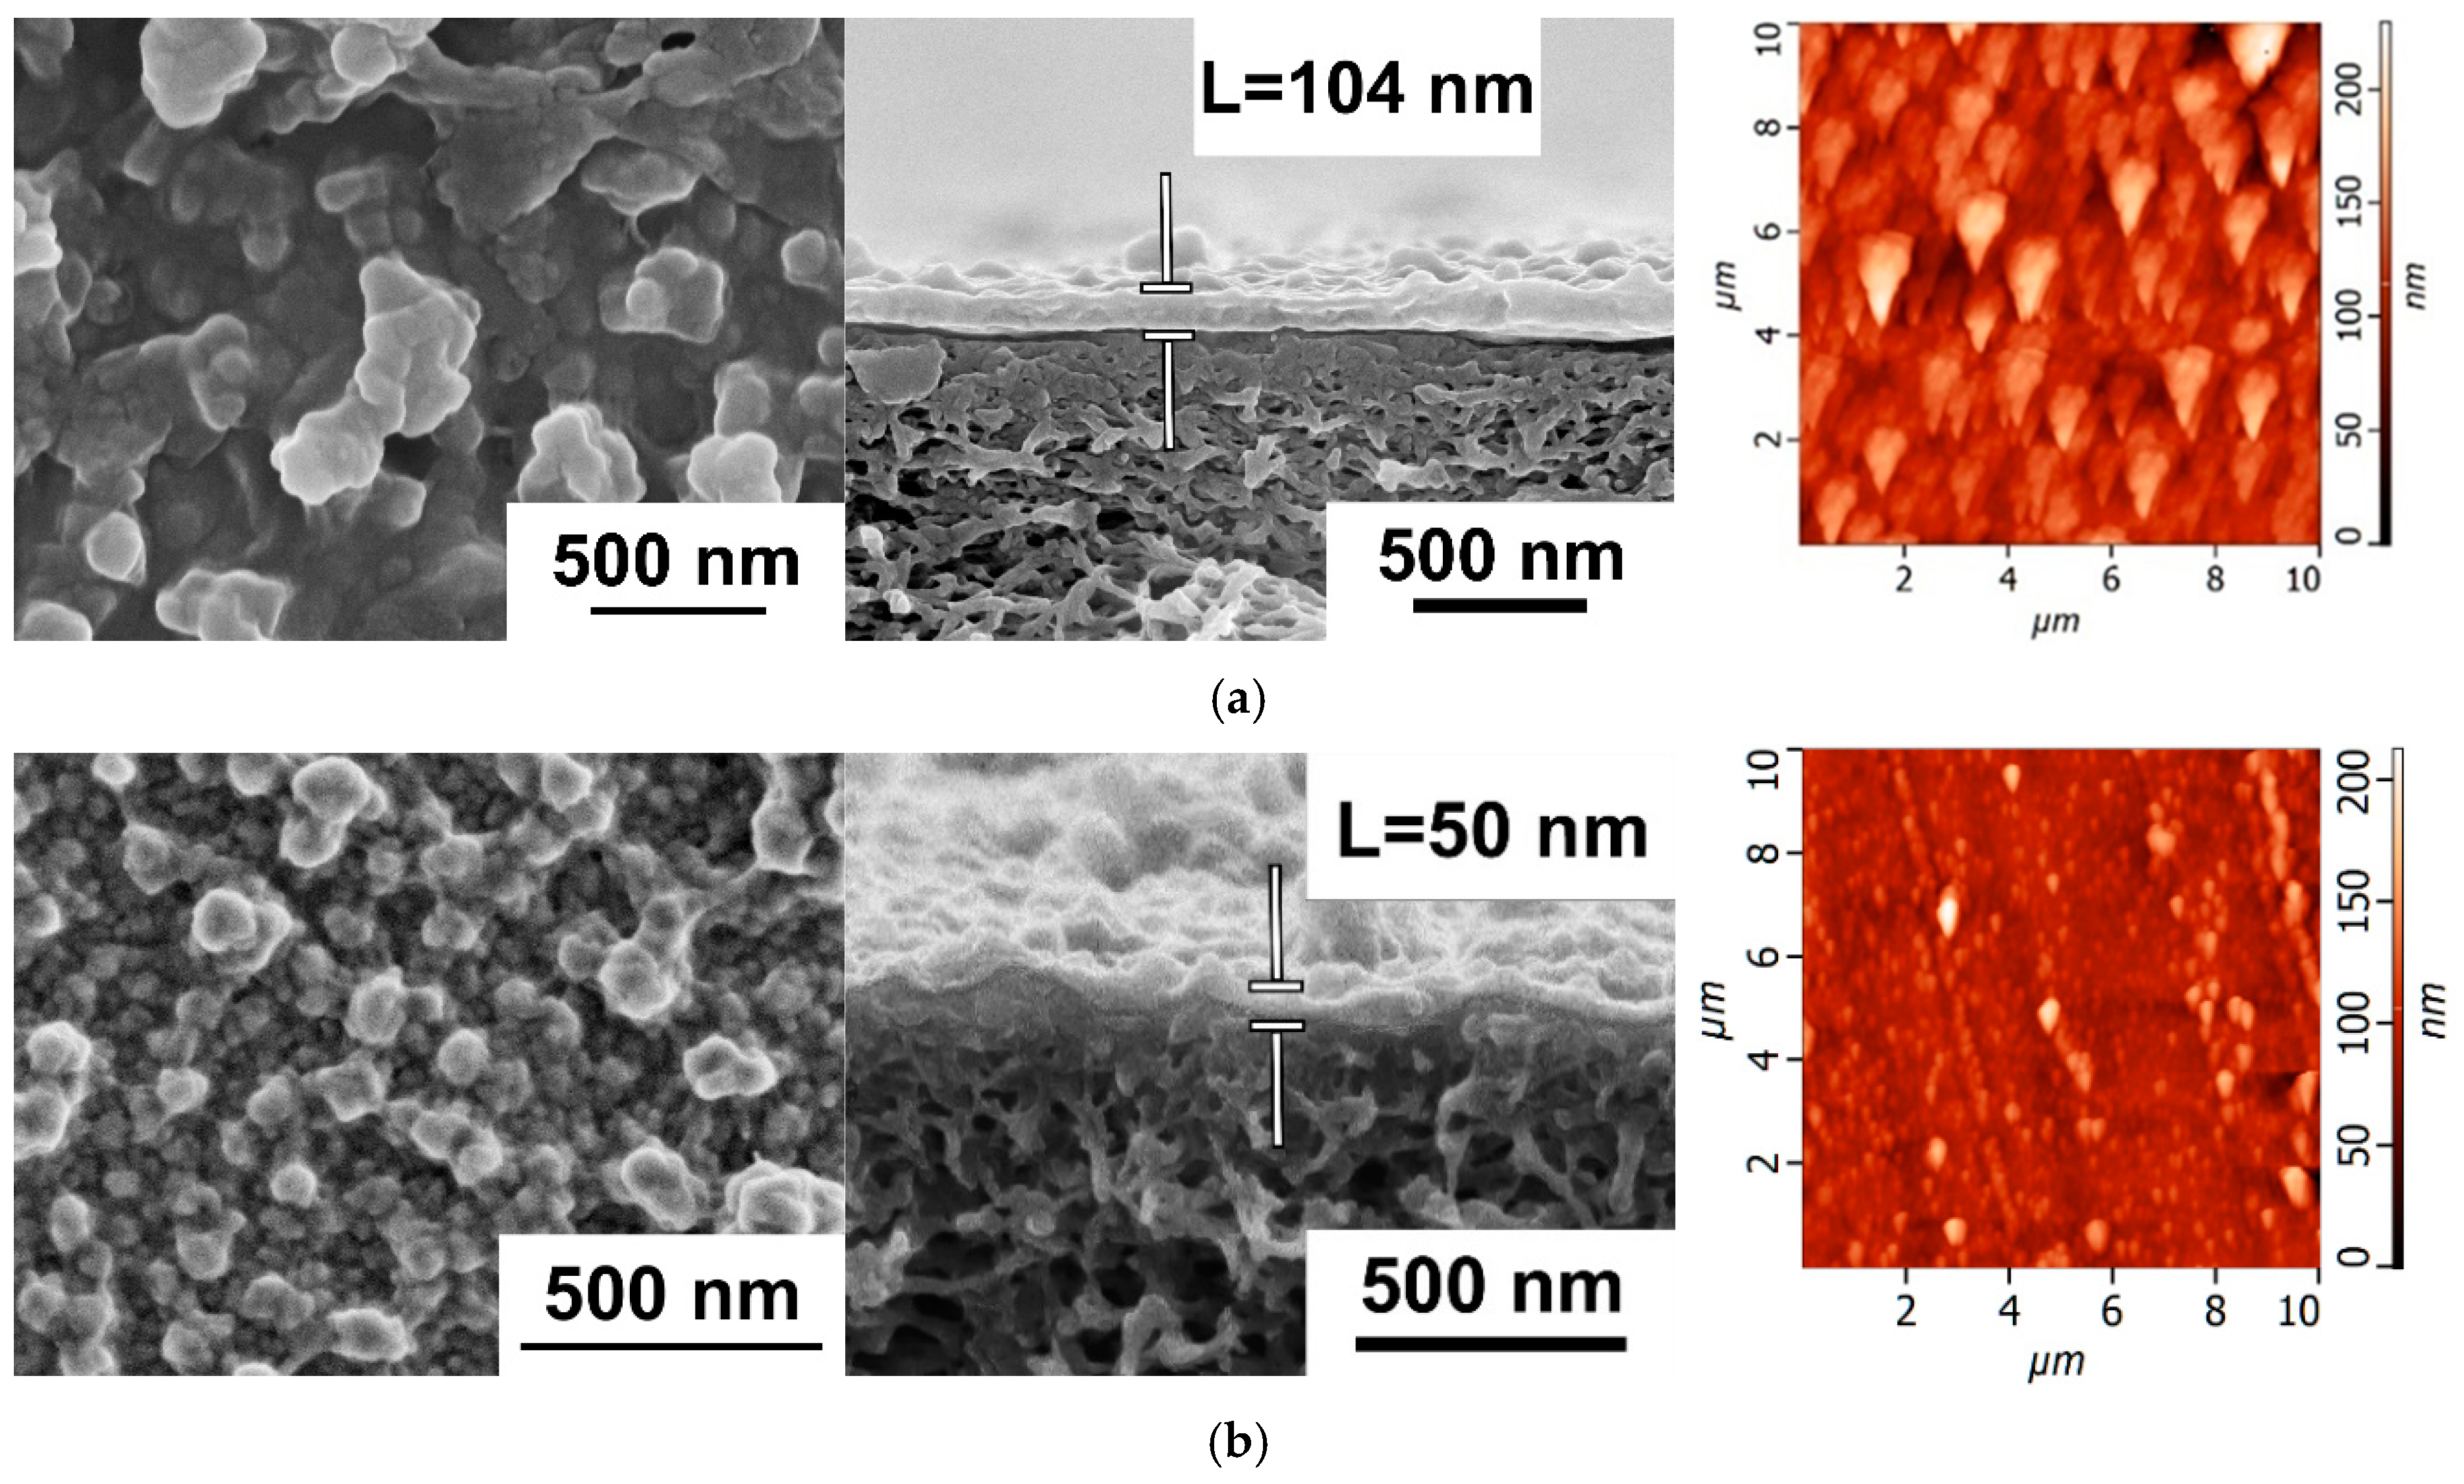
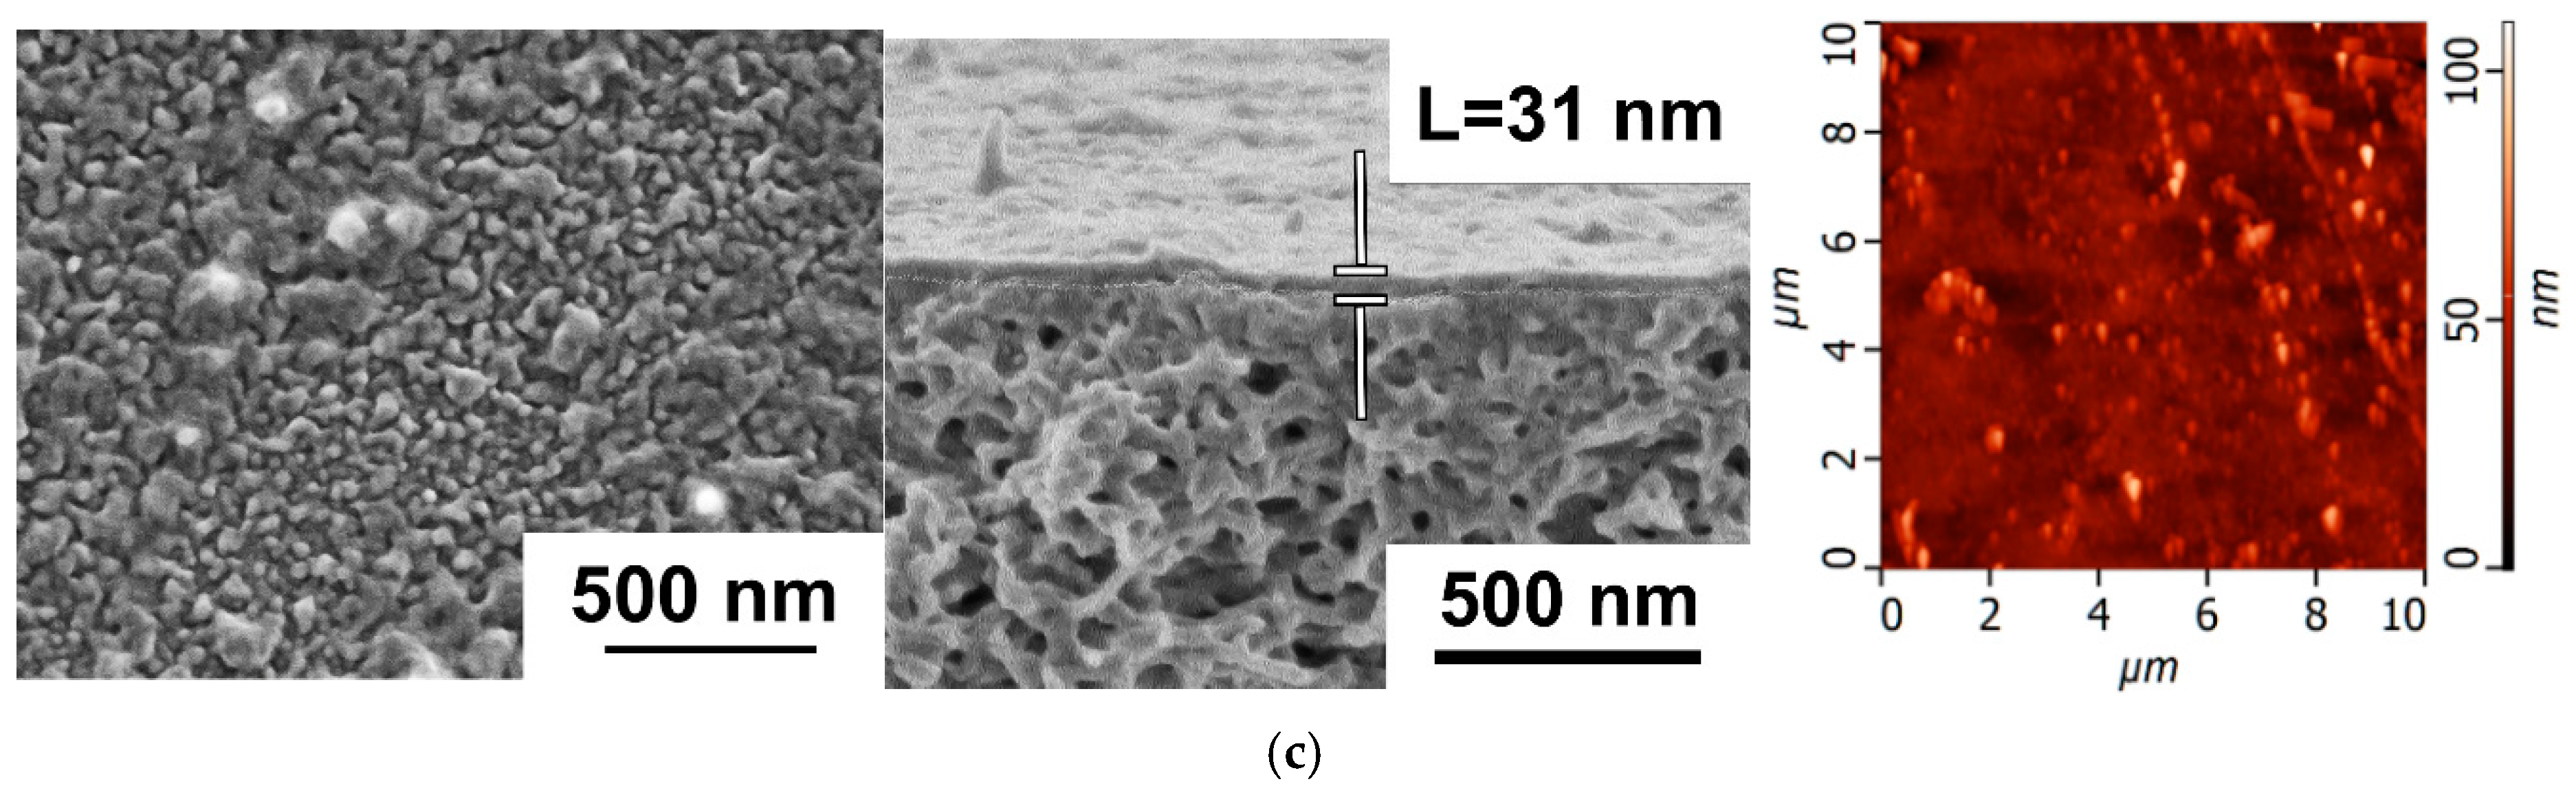
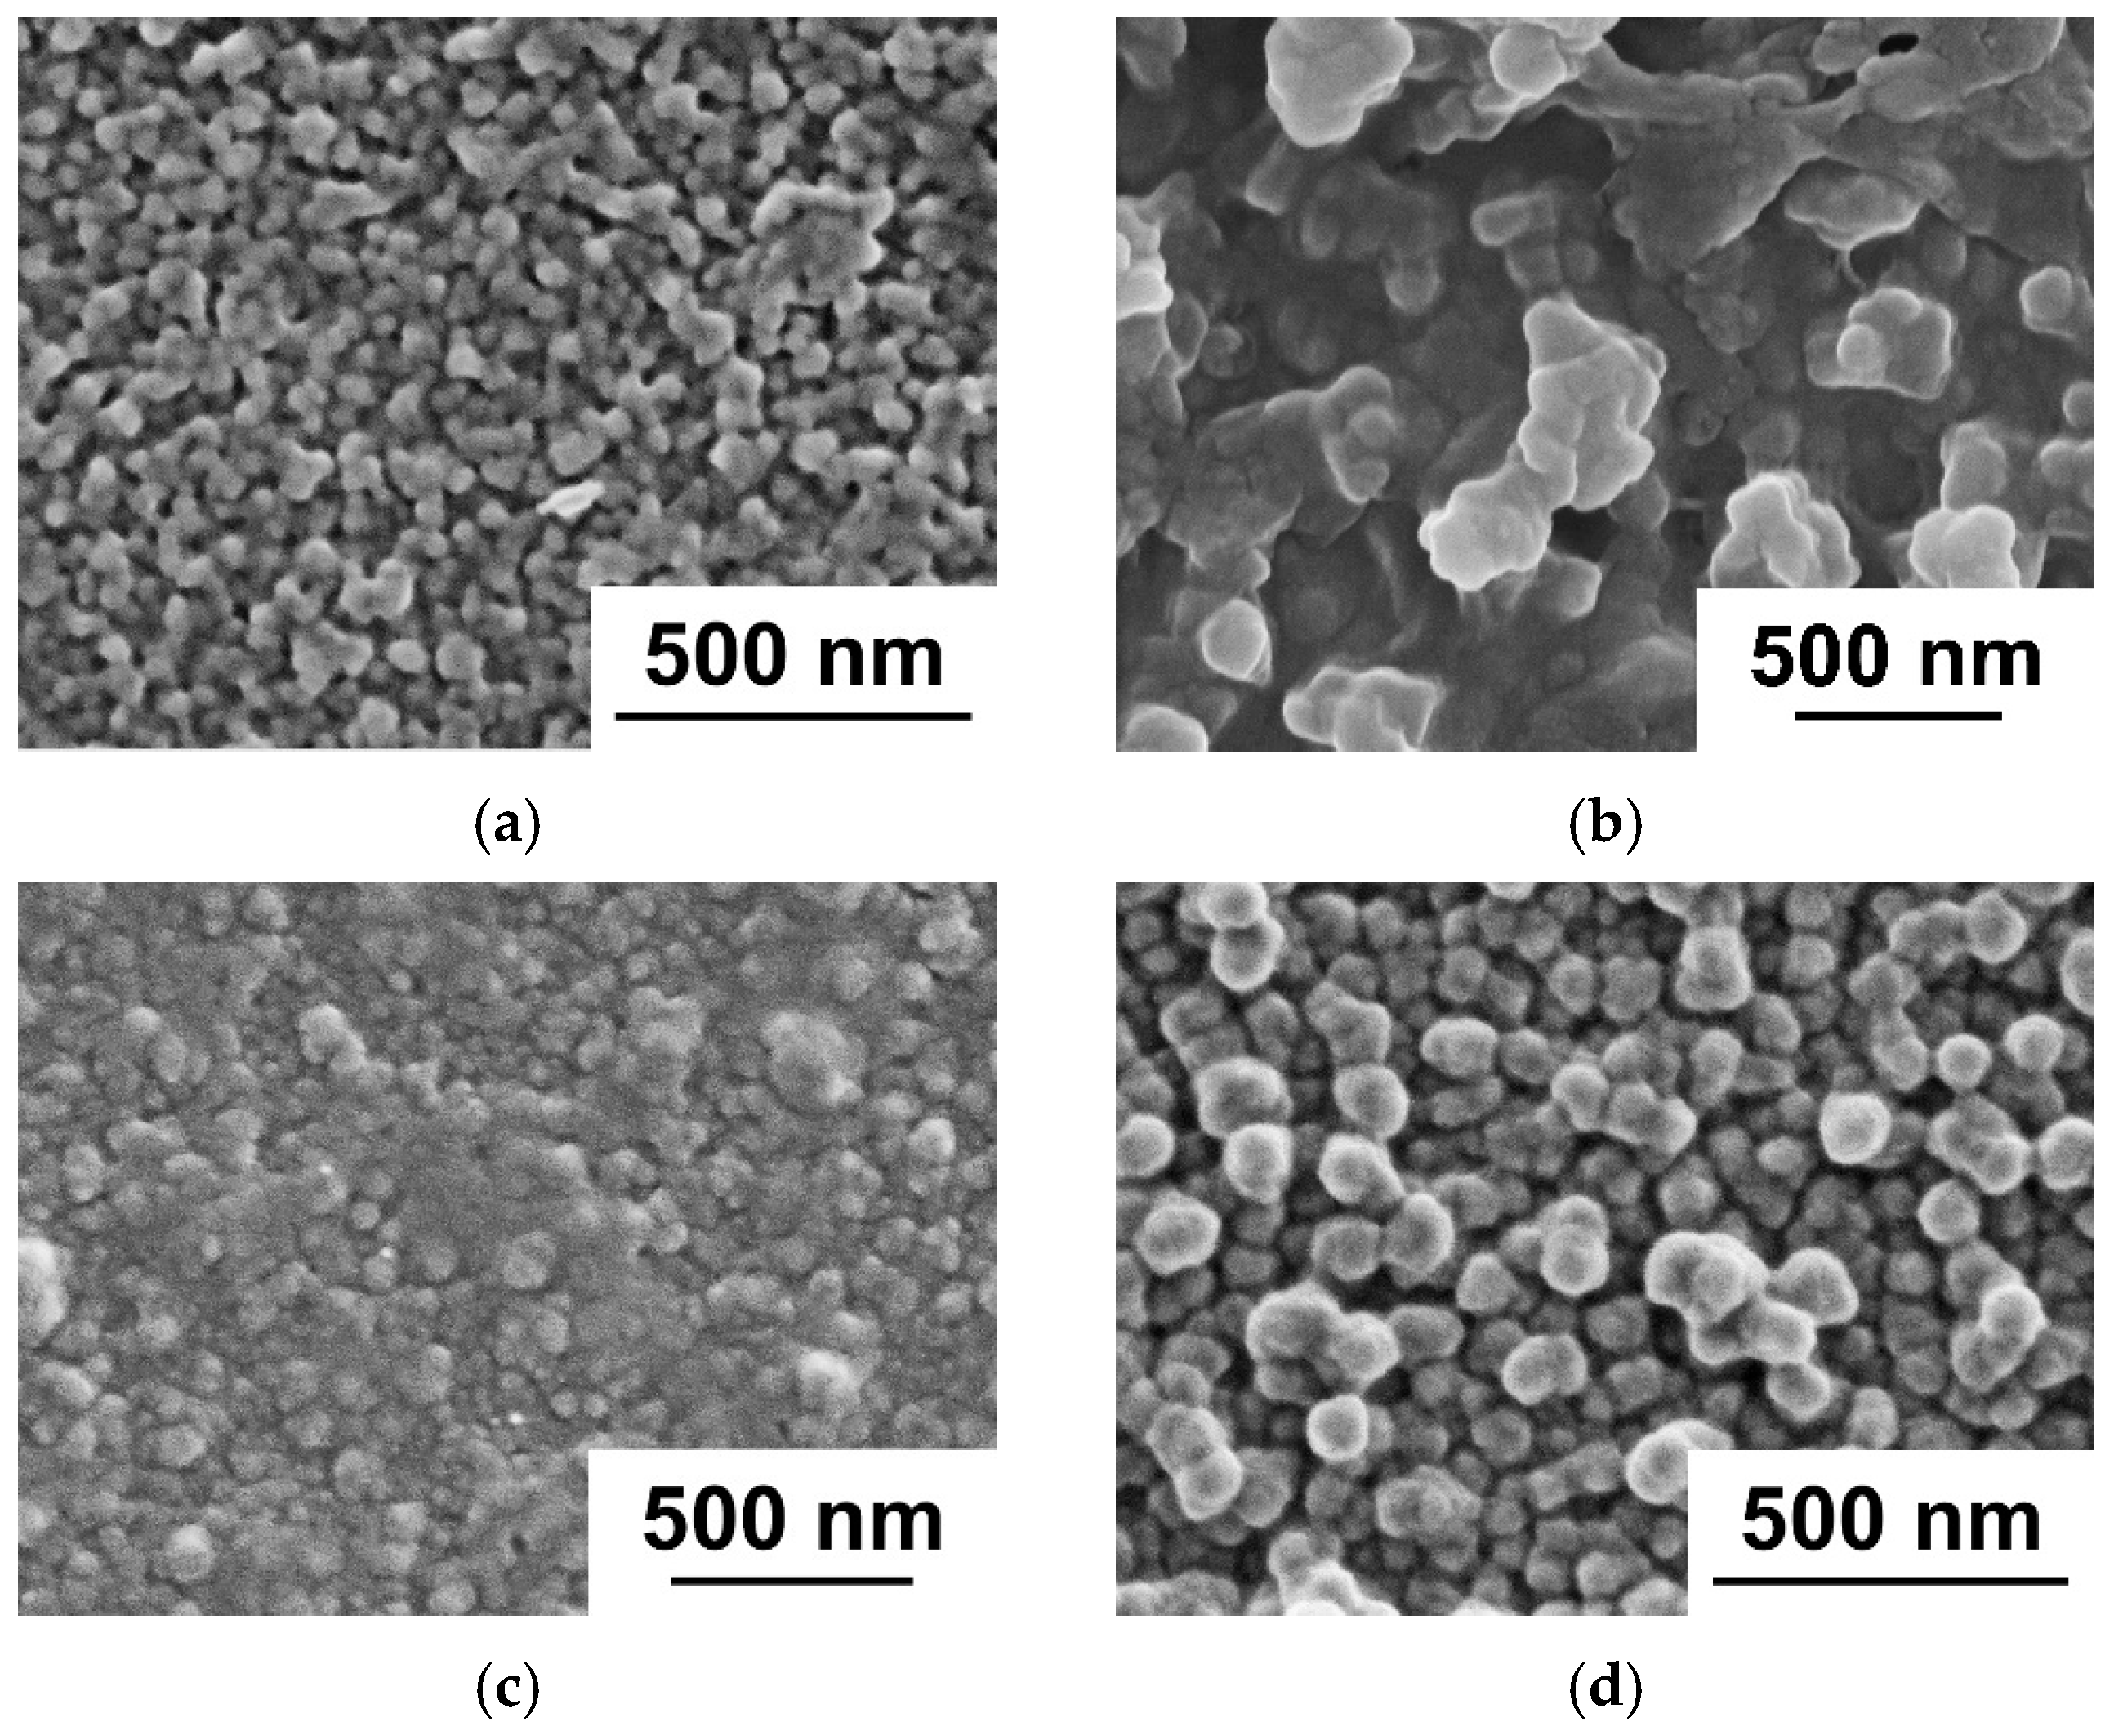
Study of Membrane Structure by Scanning Electron Microscopy (SEM)
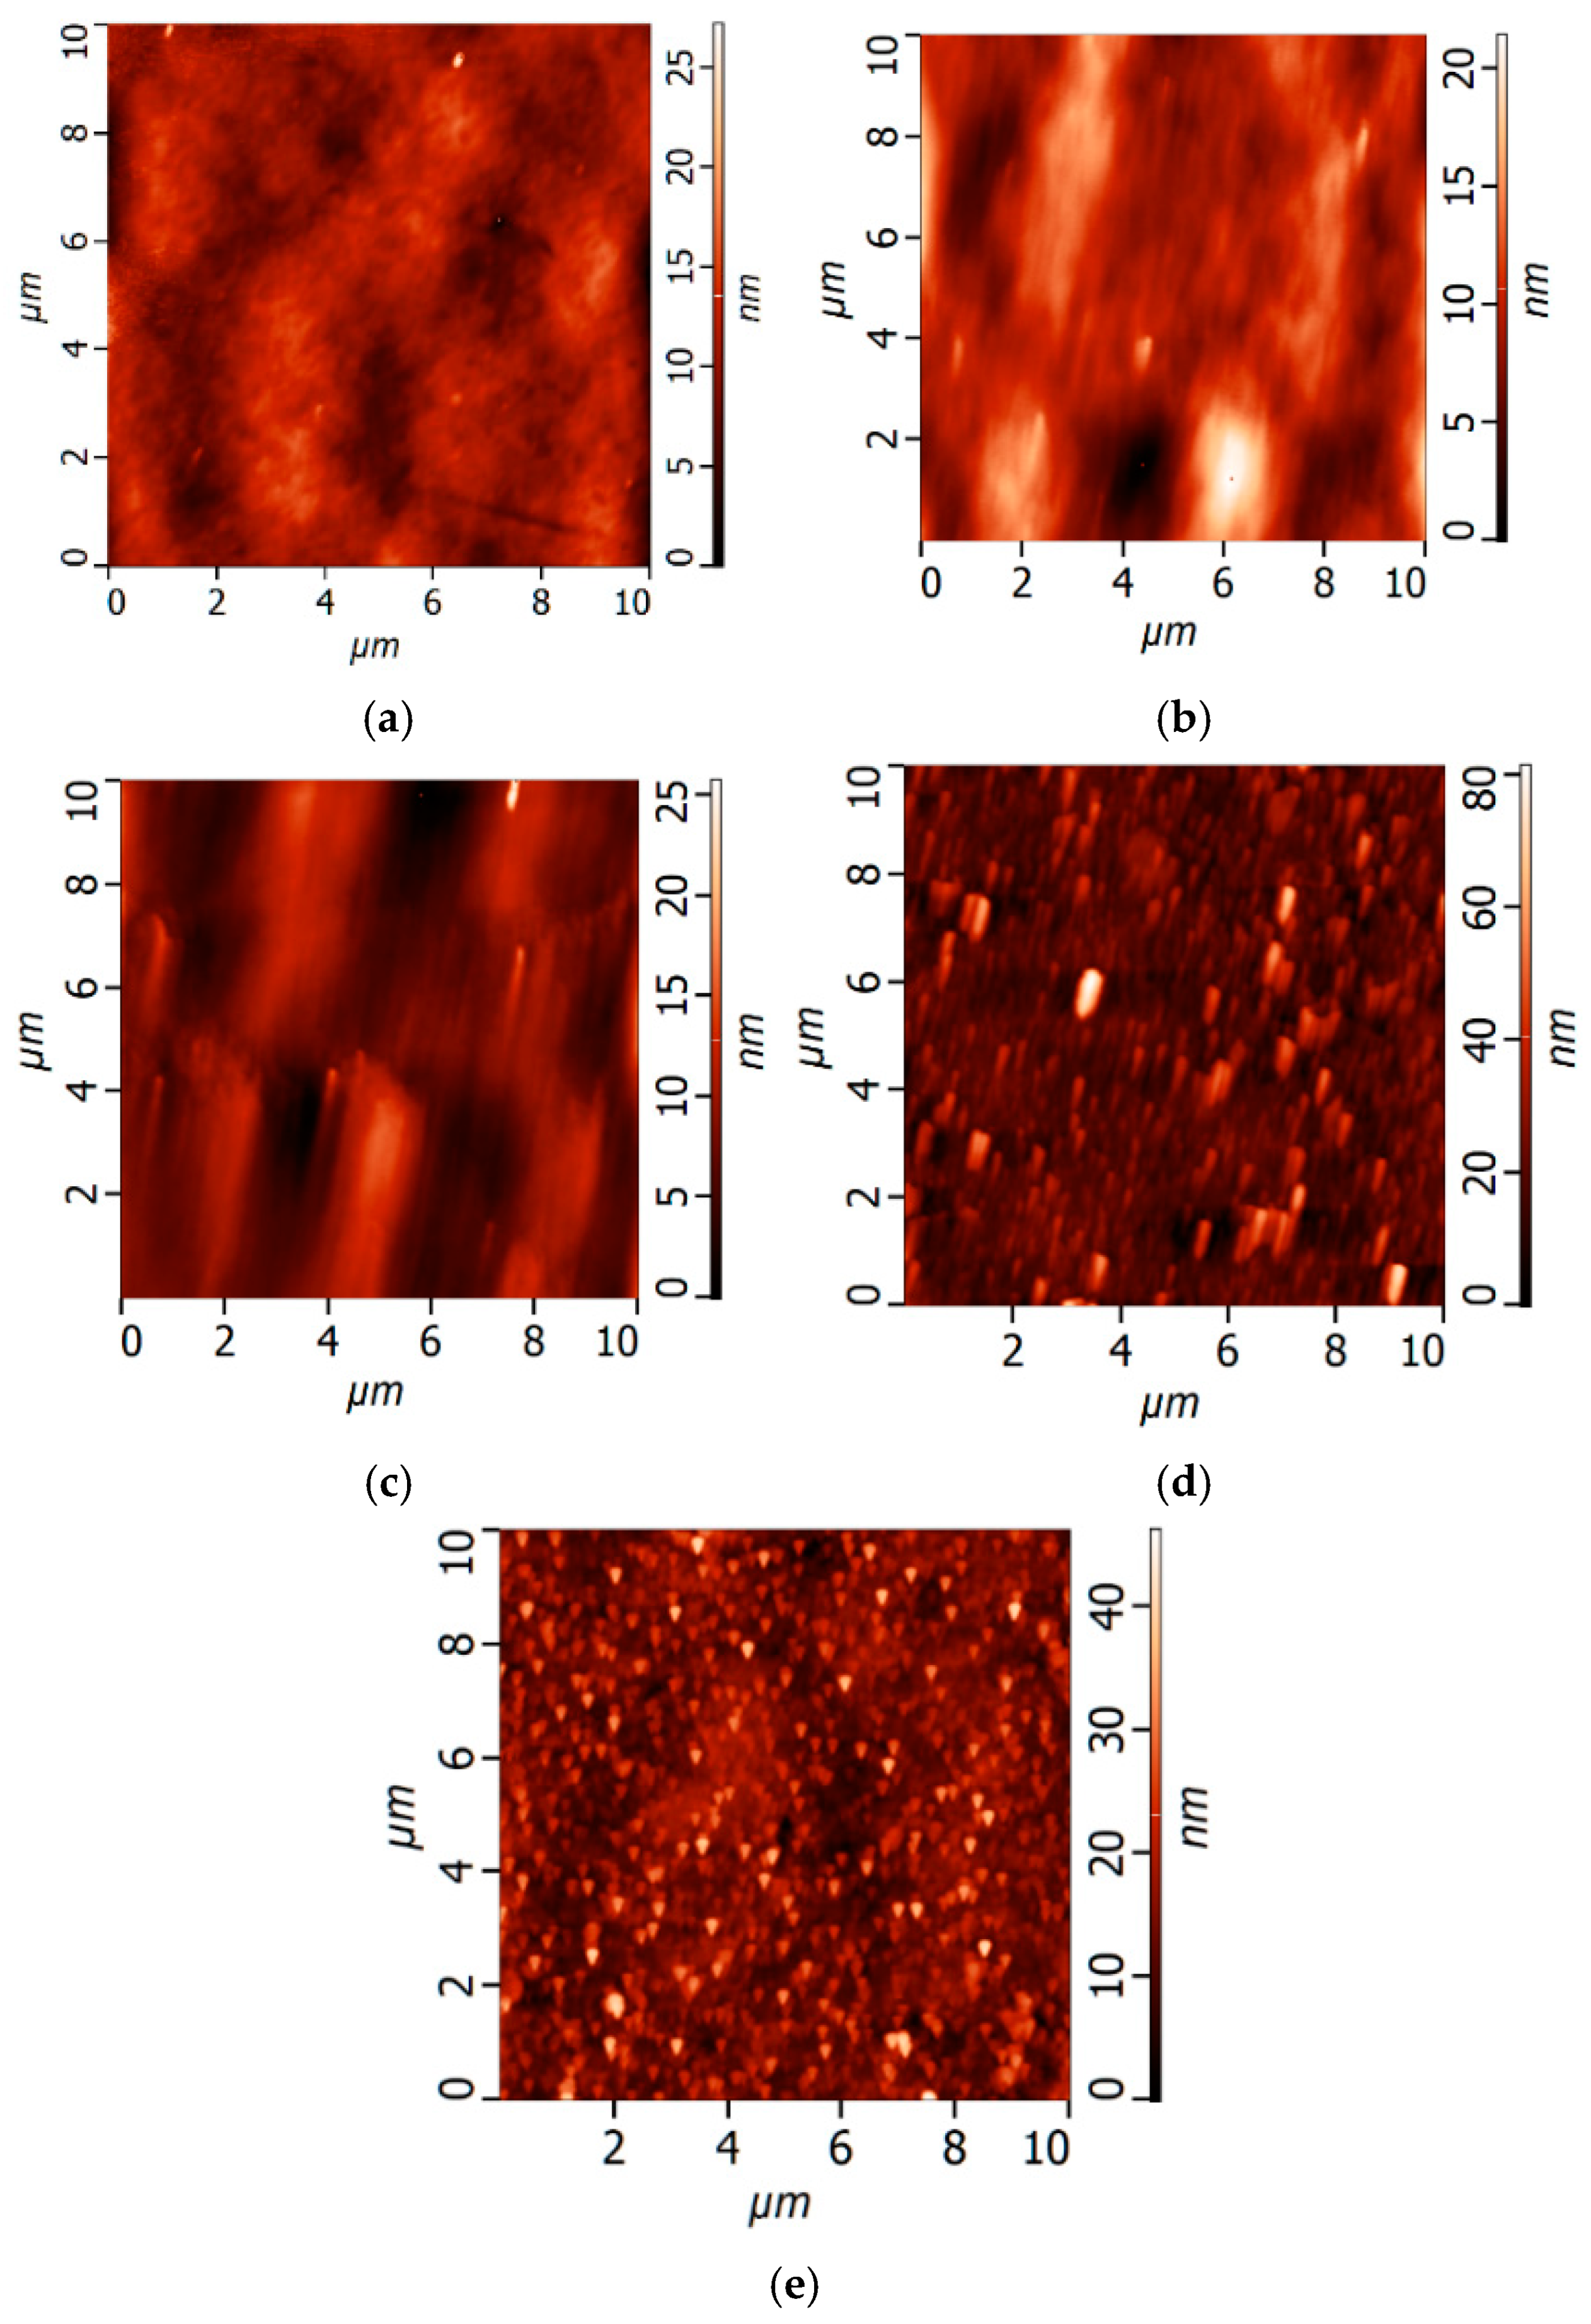
Study of Membrane Surface Structure by Atomic Force Microscopy (AFM)
Fourier-Transform Infrared (FTIR) Spectroscopy
X-Ray Photoelectron Spectroscopy (XPS)
- -
- A crosslinked domain (m) formed when all three acyl chloride functionalities of TMC react with PIP amine groups;
- -
- A linear domain (n) resulting from partial reaction where only two acyl chlorides participate in amide bond formation [32].
Zeta Potential of the TFC NF Membrane Delective Layer
Contact Angle
Preparation of the Solutions of Test Substances
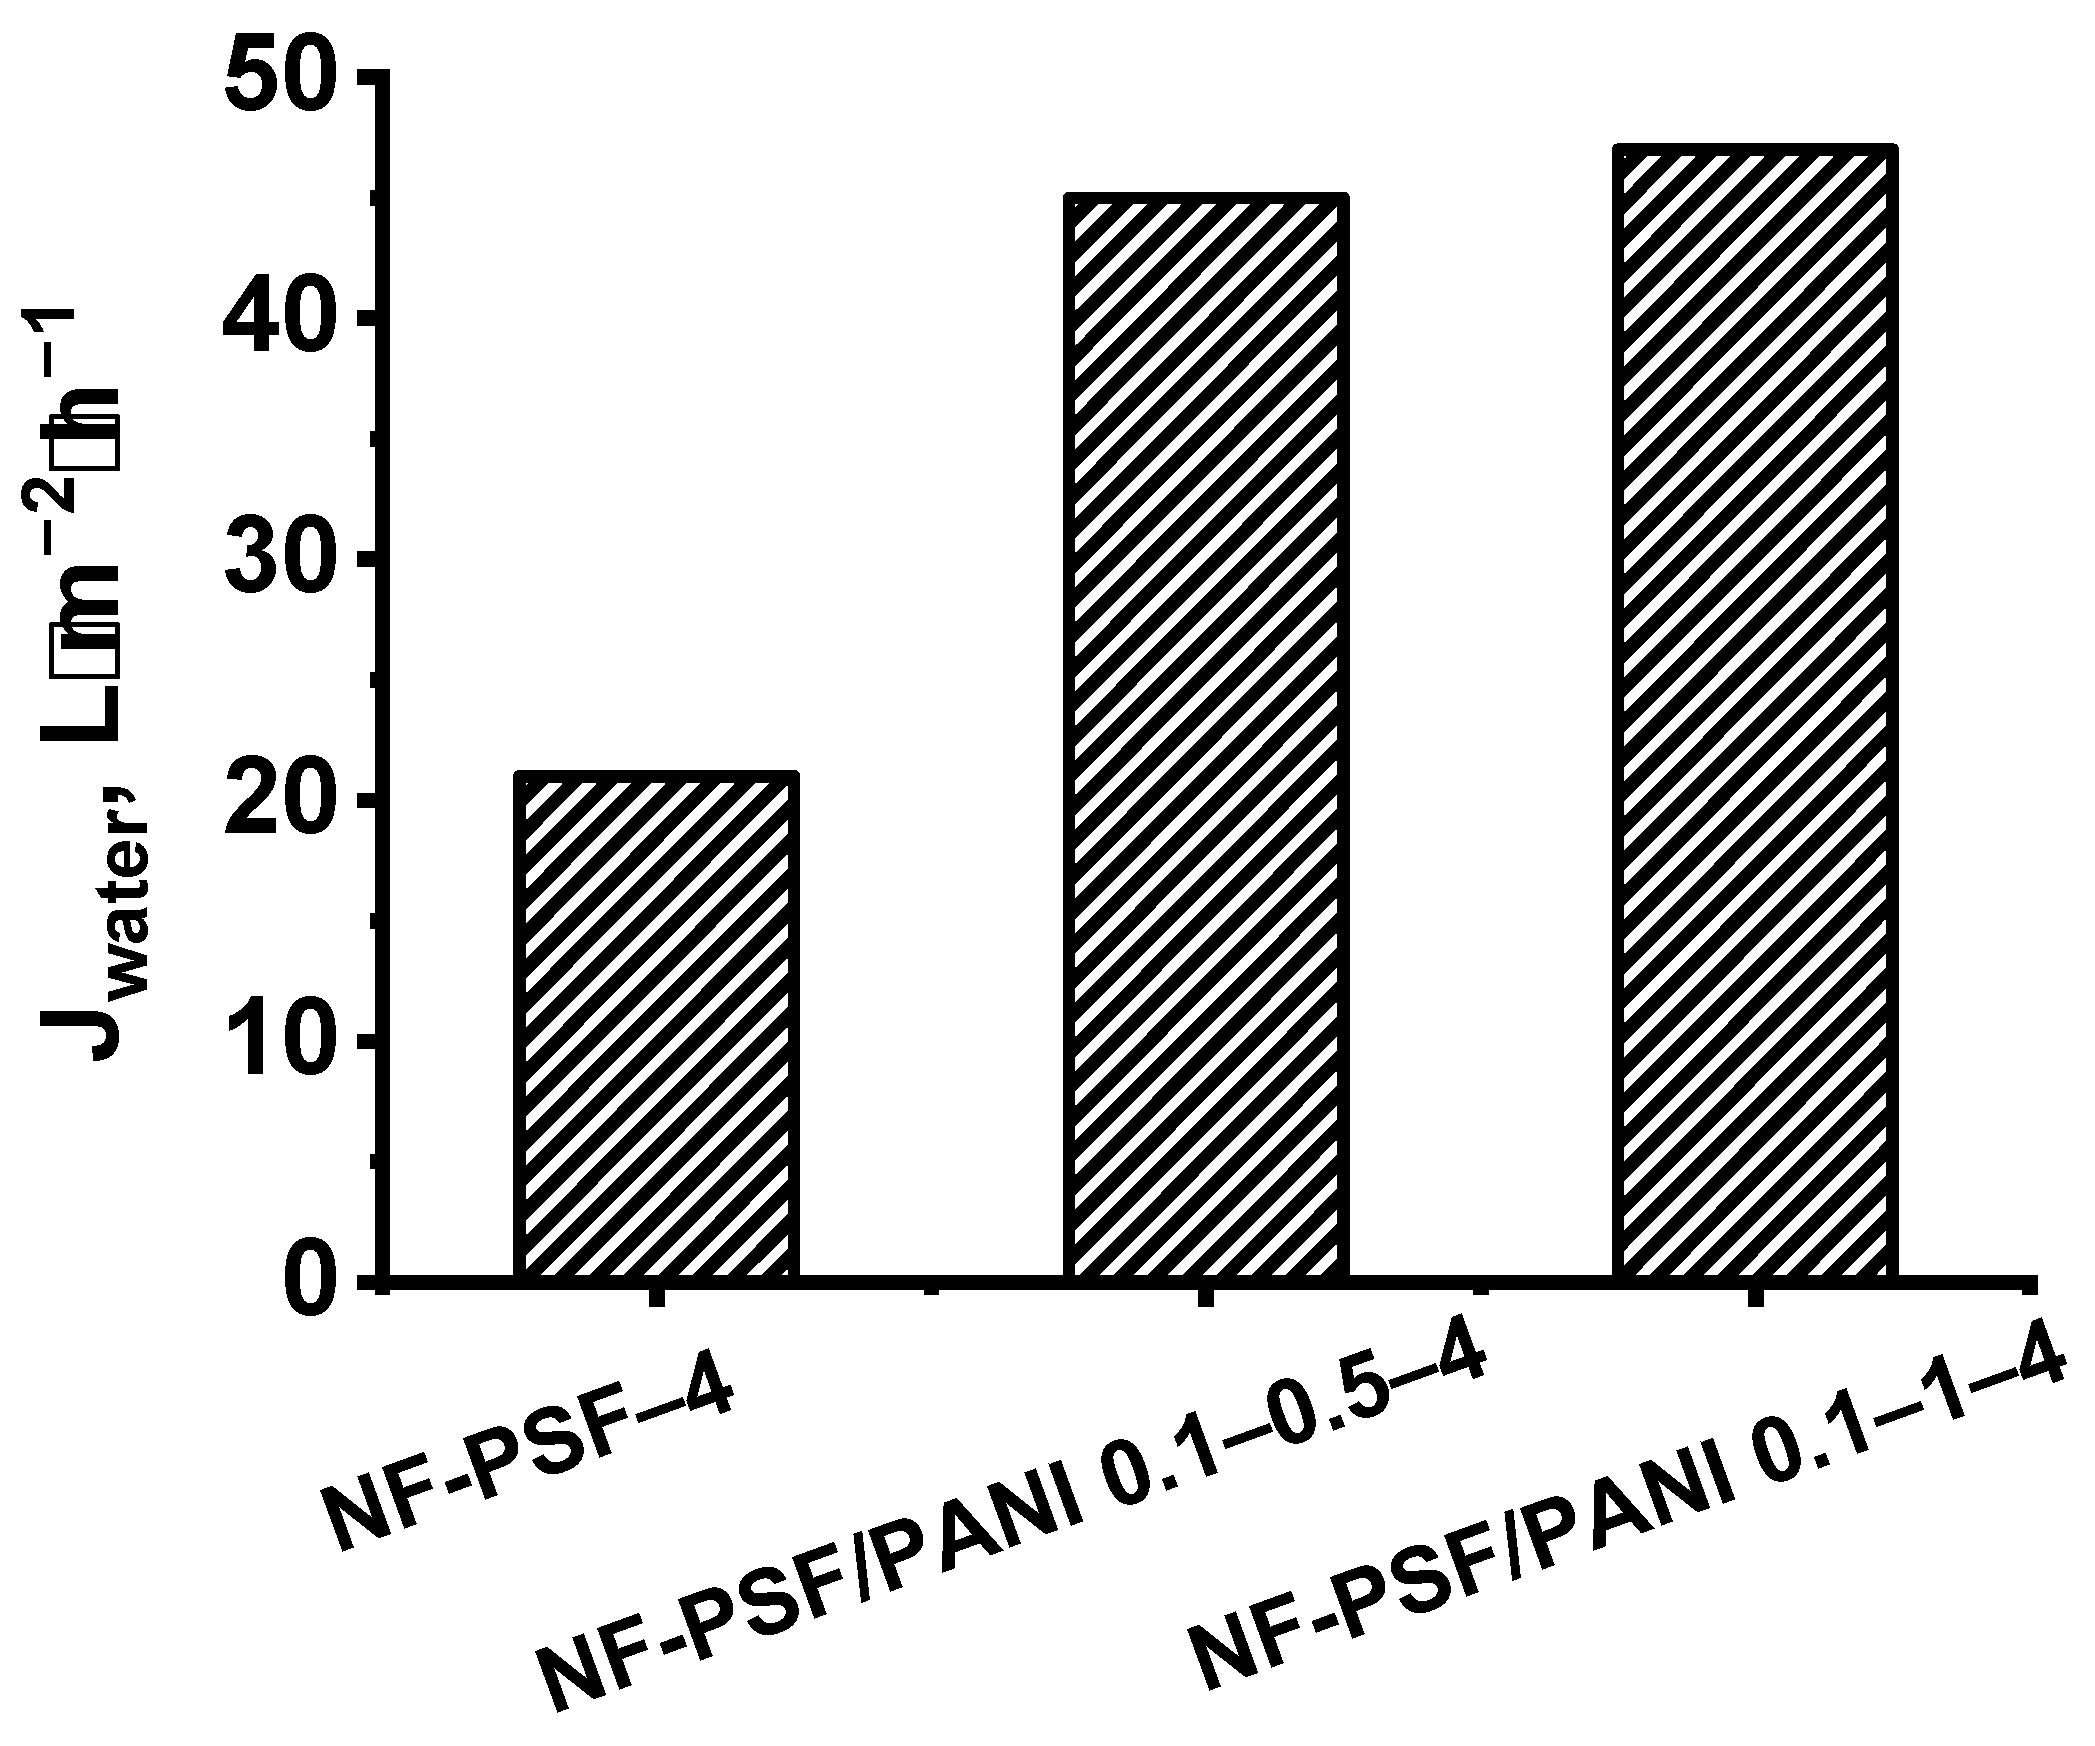
Membrane Performance
- -
- Water permeation flux determination;
- -
- Quantitative evaluation of salt rejection efficiency;
- -
- Antibiotic removal capacity analysis.
- -
- Total dissolved salt concentration: 5 g·L−1;
- -
- Mg2+/Li+ mass ratio: 18:1.
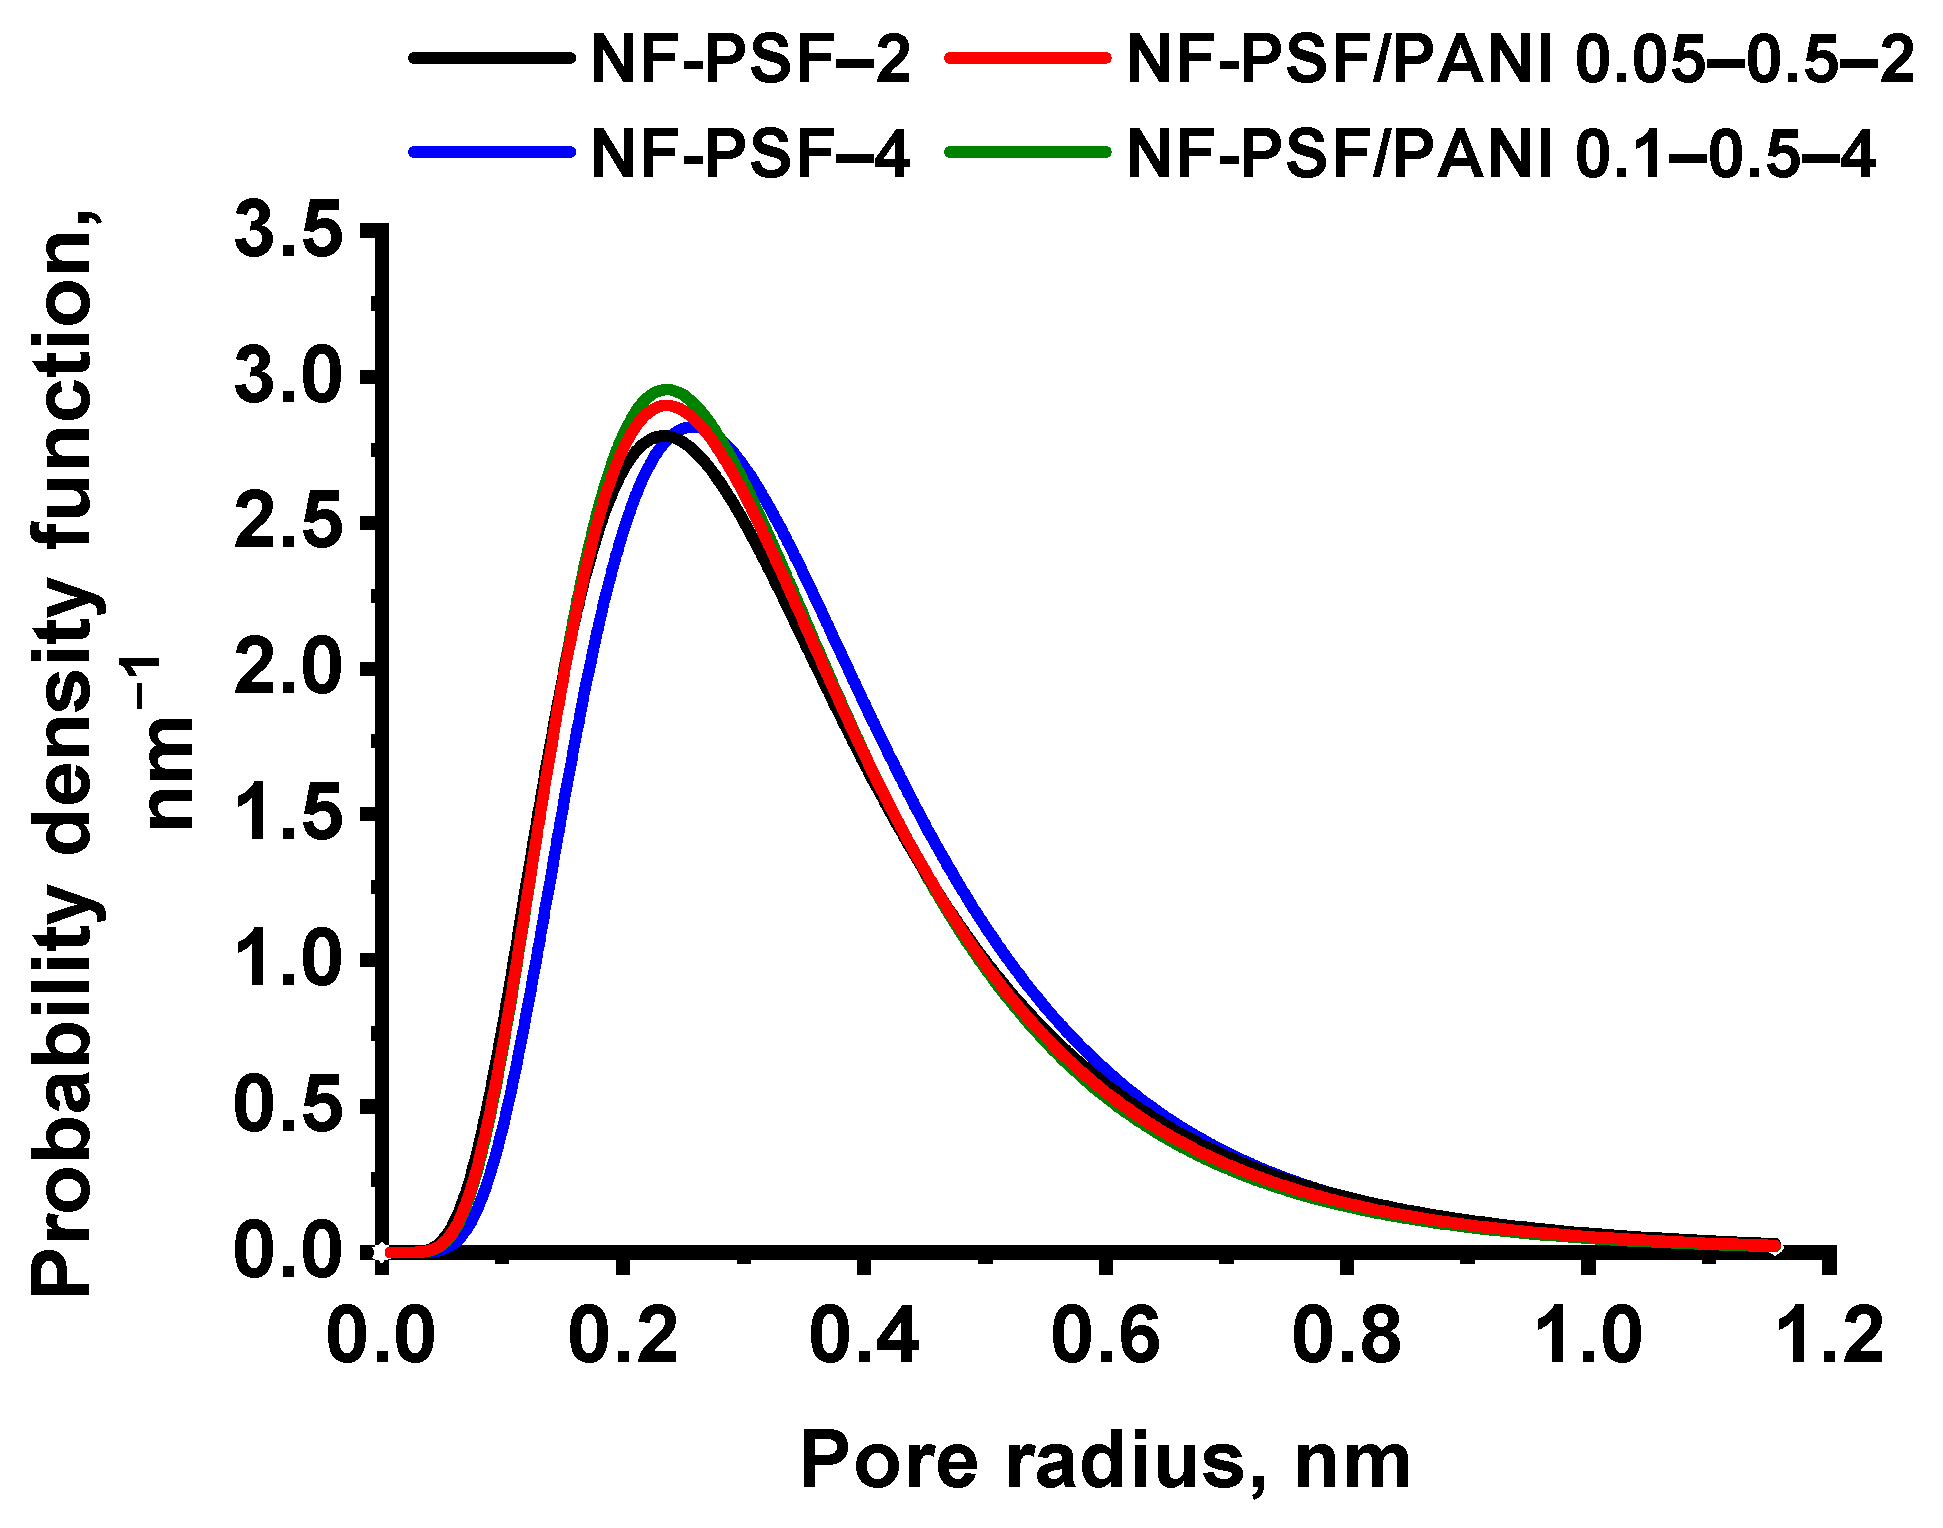
Pore Size Distribution of TFC NF Membranes
- -
- Construction of a semi-logarithmic probability plot of solute rejection versus Stokes radius;
- -
- Determination of μp as the intercept at 50% rejection from the fitted curve;
- -
- Calculation of the geometric standard deviation (σg) from the ratio of solute radii at 84.13% and 50% rejection thresholds.
Determination of the Molecular Weight Cut-Off (MWCO) of TFC NF Membranes
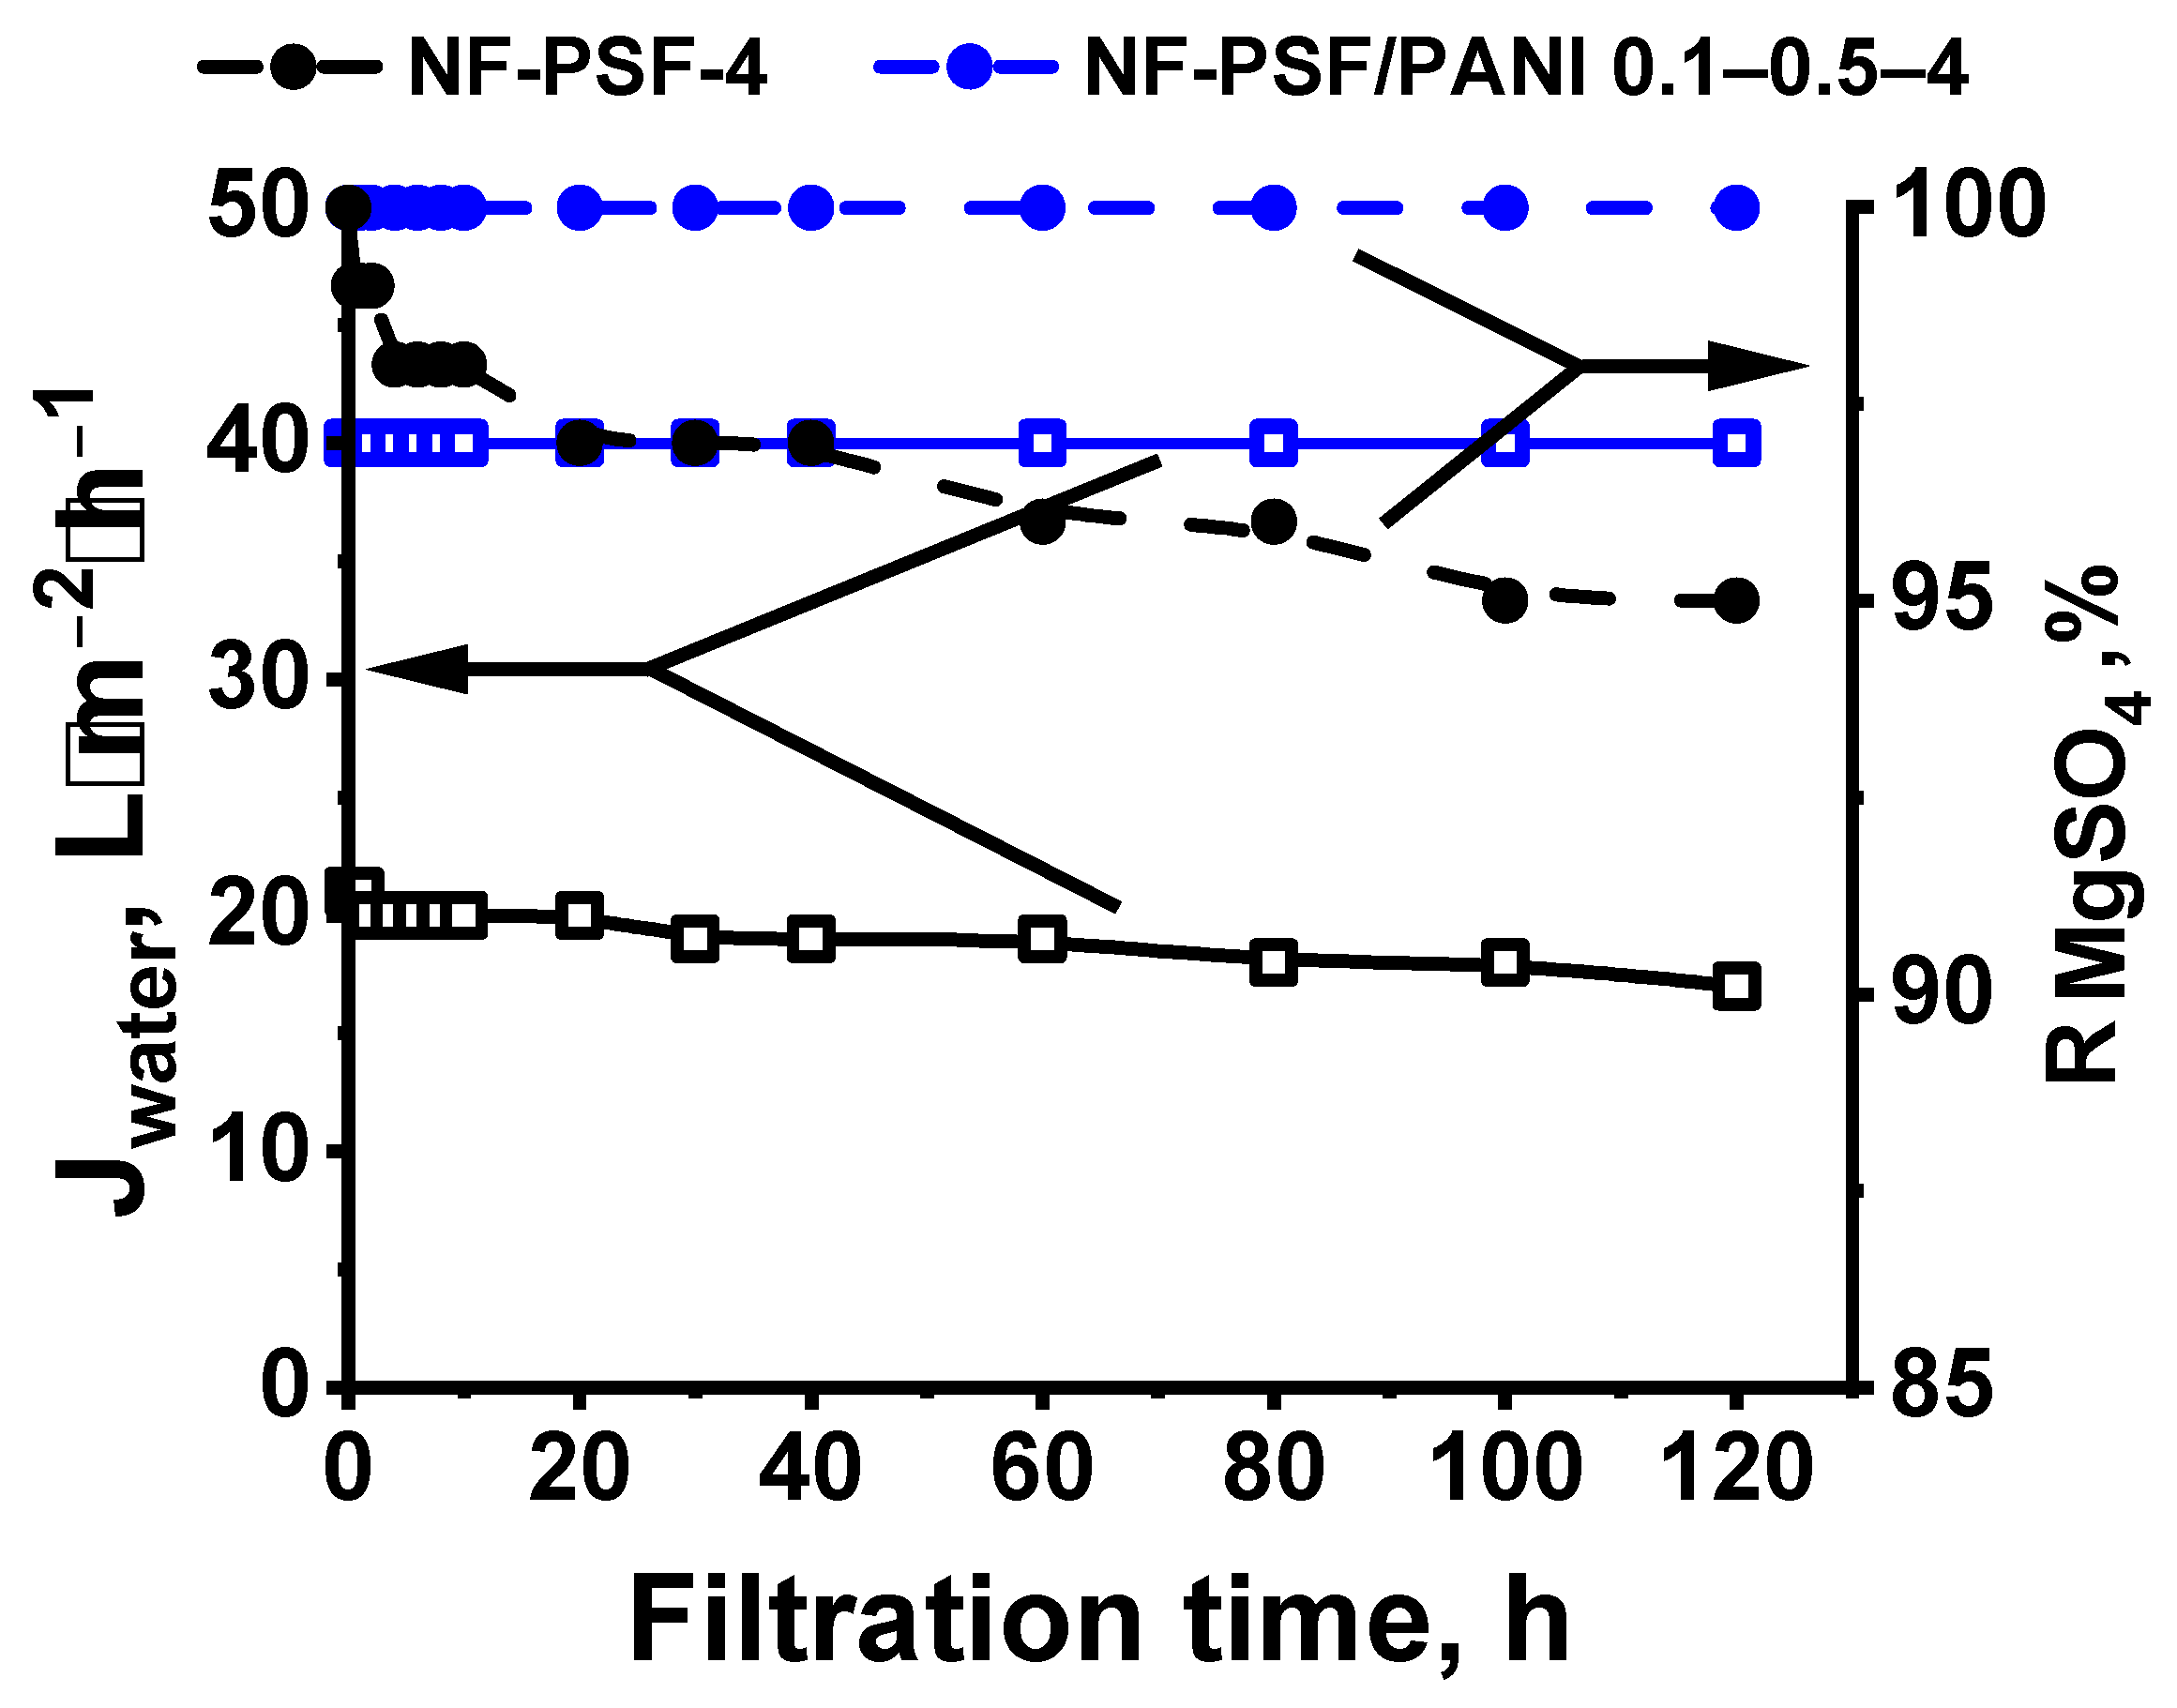
Study of TFC NF Membrane Chemical Stability
3. Results
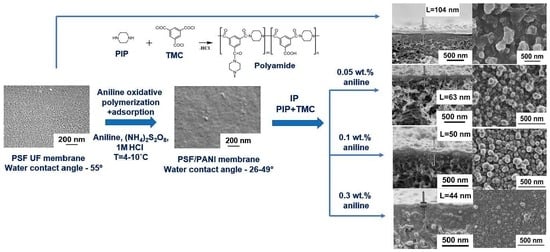
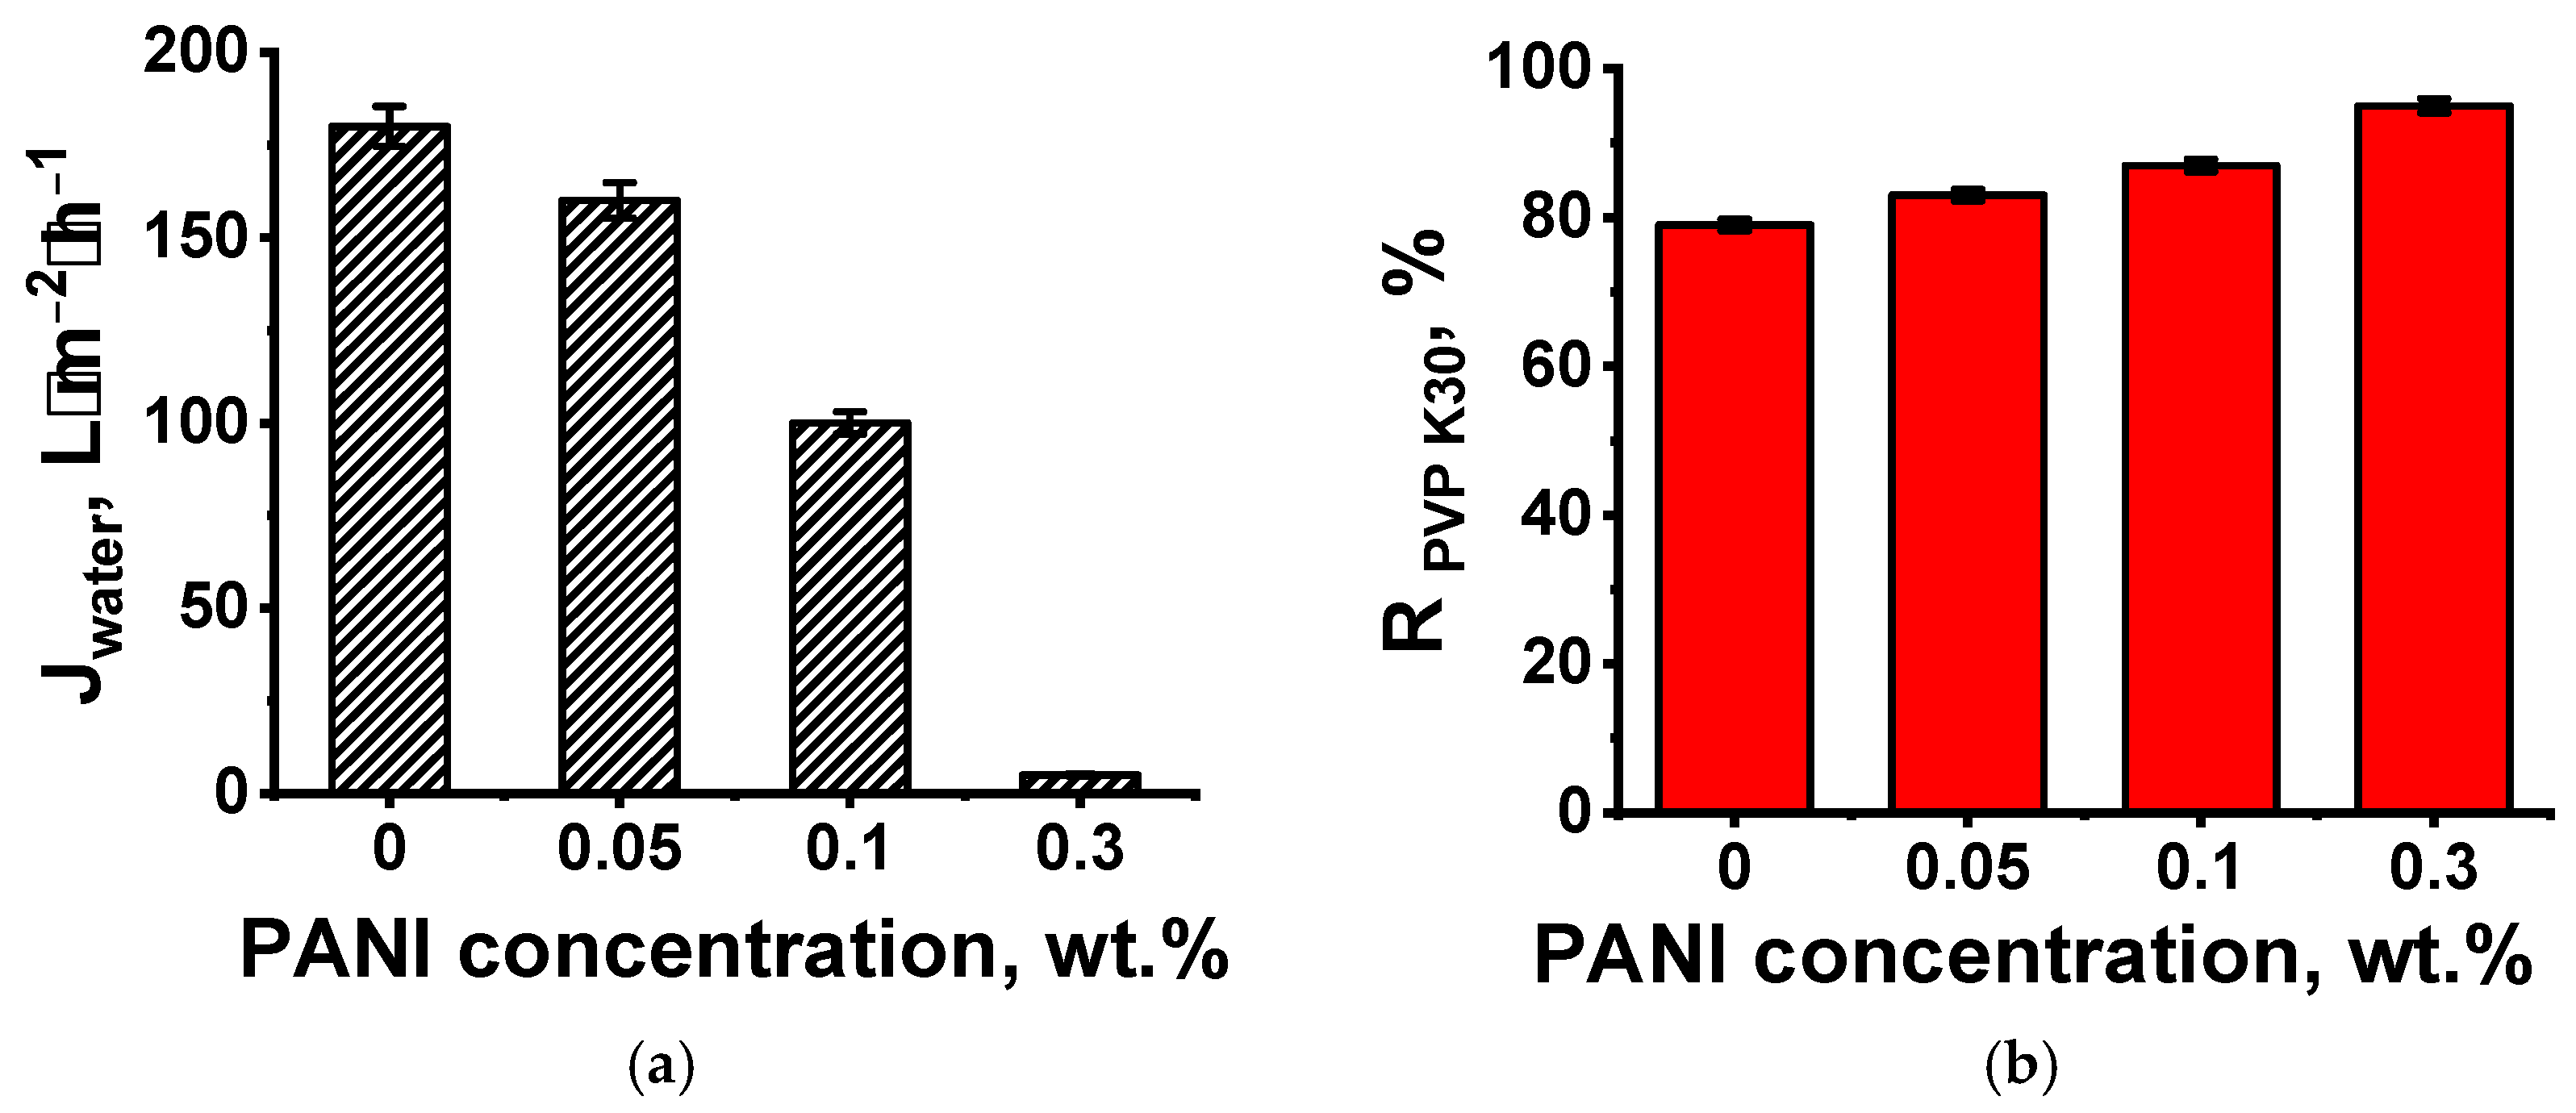
3.1. Effect of PANI Layer Deposition at Different Aniline Concentrations During Oxidative Polymerization on the UF PSF Membrane Structure and Performance
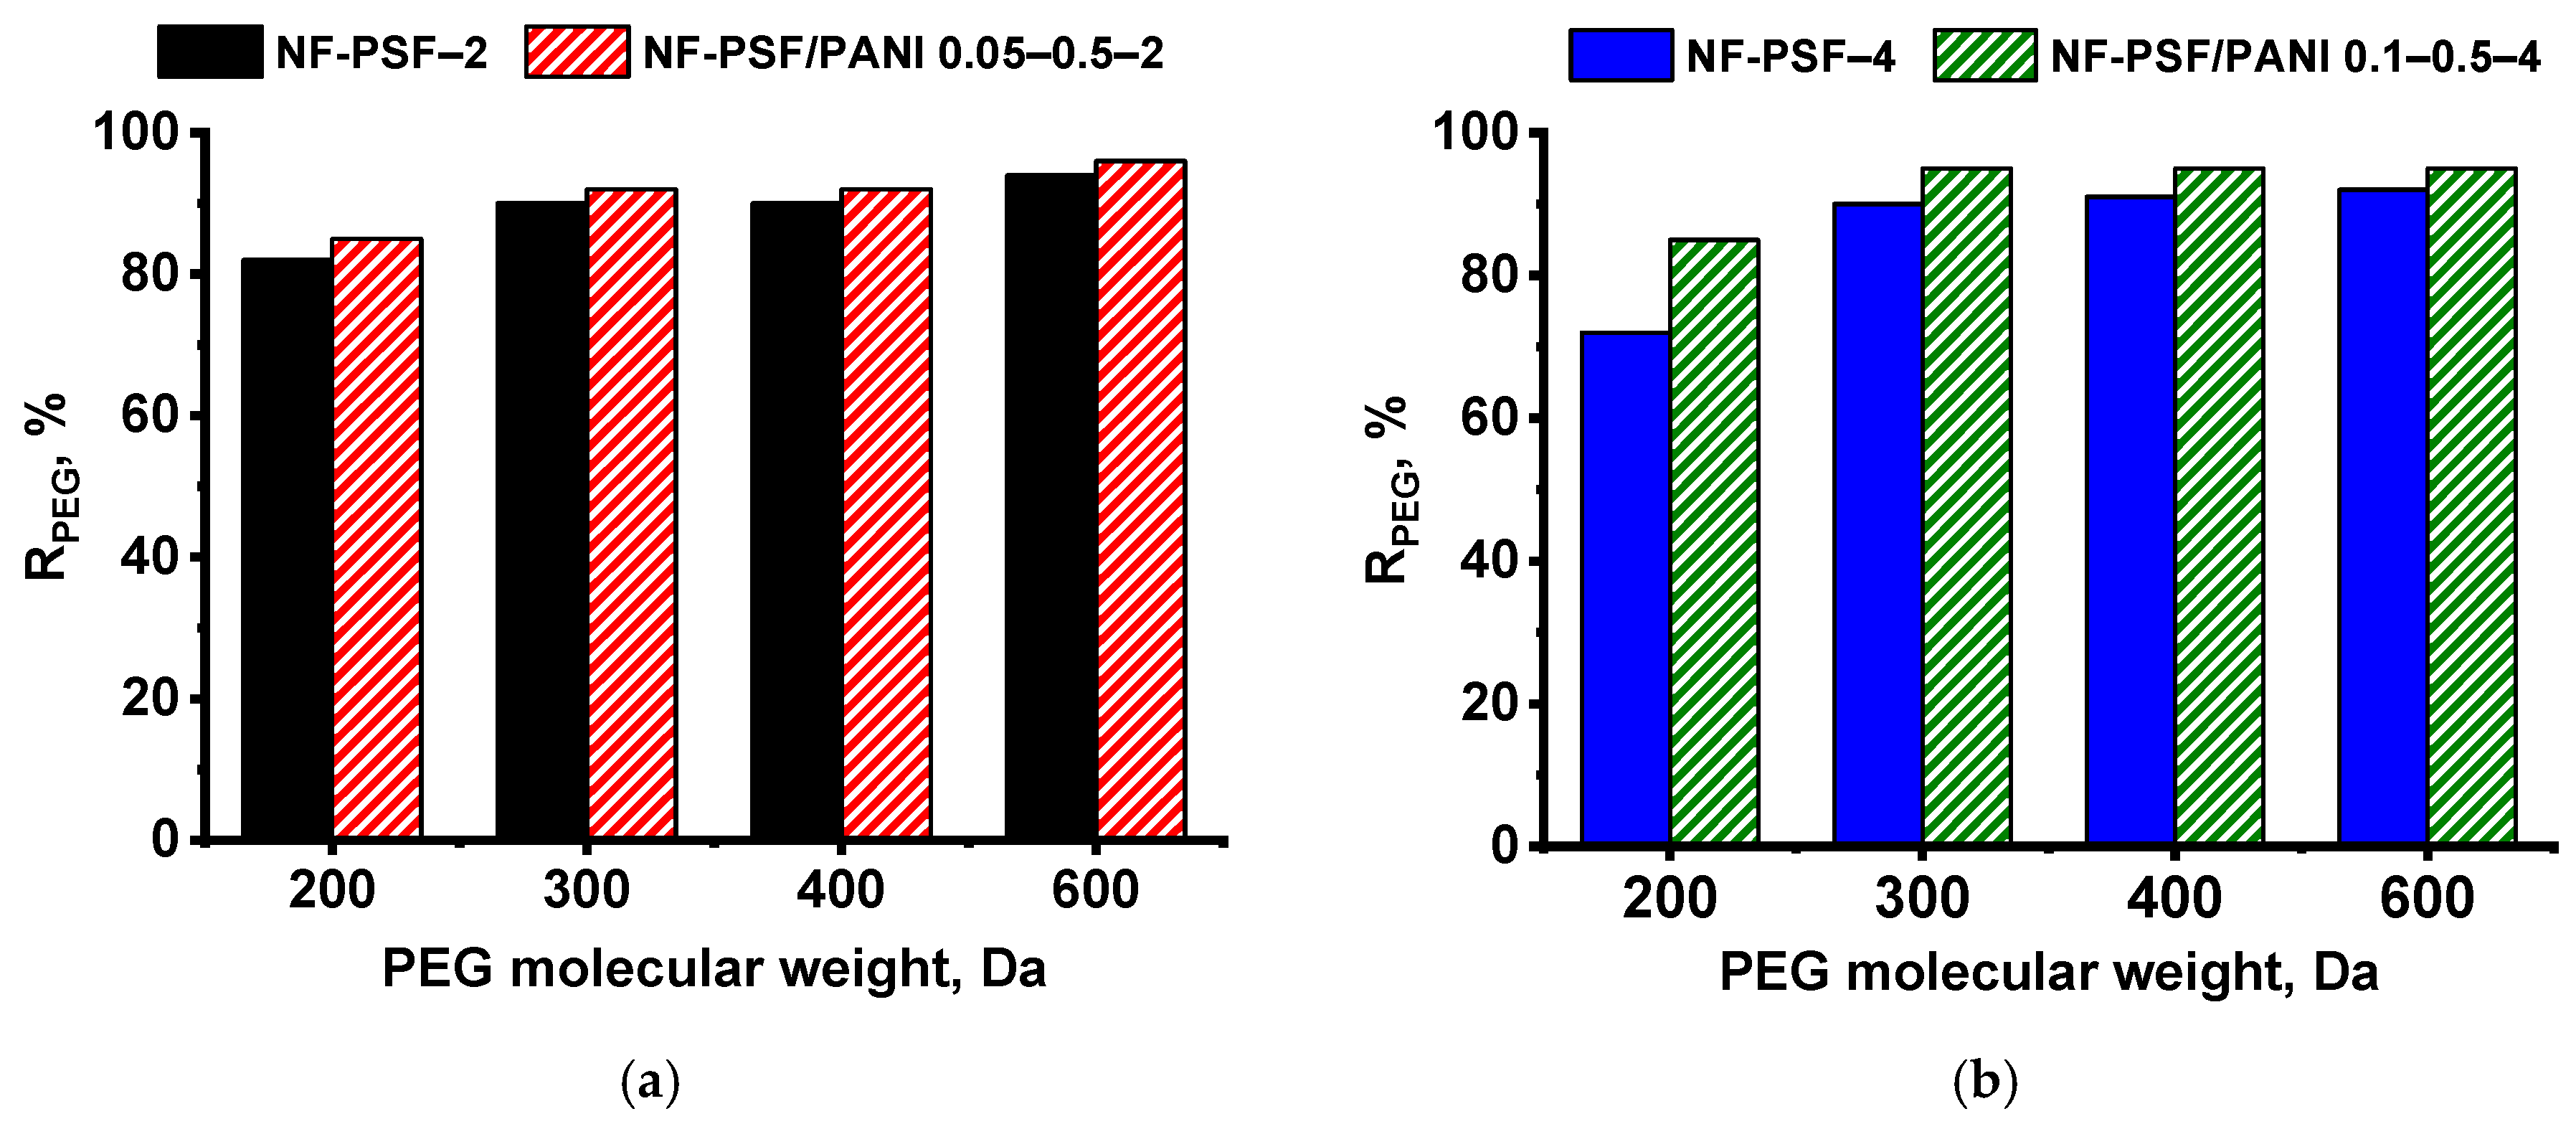
3.2. Effect of PANI Interlayer Formation on the Structure and Performance of TFC Membranes for Nanofiltration Prepared via IP
3.2.1. The Effect of Time of PANI Interlayer Deposition on the Structure and Performance of TFC NF Membranes
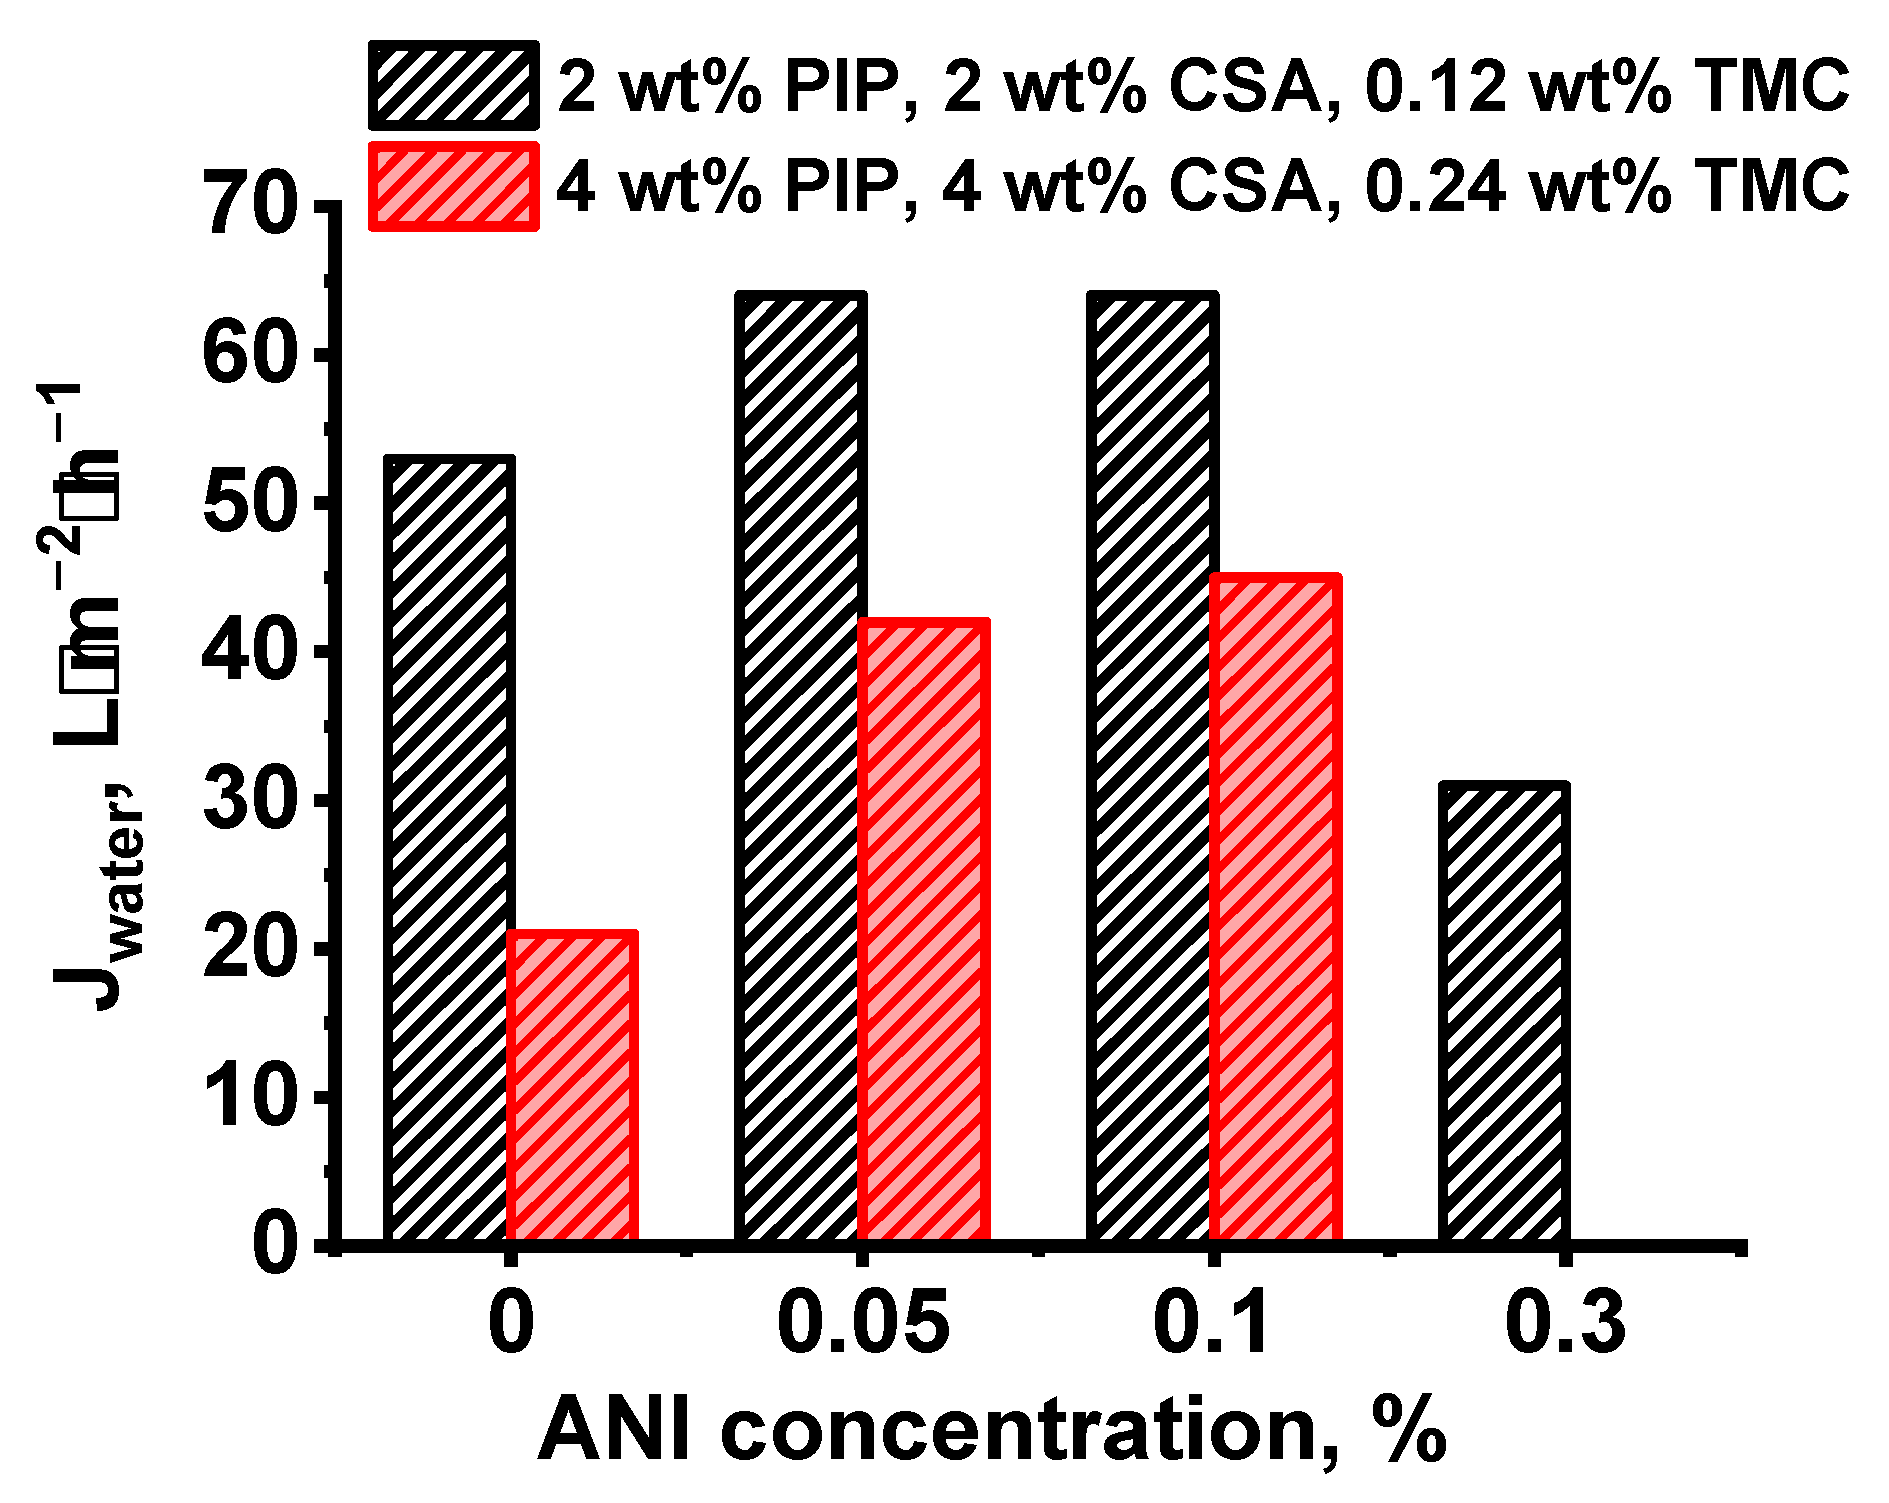
3.2.2. The Effect of the Concentration of ANI, PIP, and TMC on the Structure and Properties of TFC NF Membranes
4. Conclusions
Supplementary Materials
Author Contributions
Funding
Institutional Review Board Statement
Data Availability Statement
Acknowledgments
Conflicts of Interest
References
- Chen, Y.; Liu, X.; Zhang, R.; Wang, W.; Wang, H.; Ren, Y.; Duan, X. Engineering Mineralized Interlayers for Enhanced Nanofiltration: Synergistic Modulation of Polyamide Layer Structure and Catalytic Self-Cleaning Performance. J. Membr. Sci. 2025, 713, 123319. [Google Scholar] [CrossRef]
- Gui, H.; Chen, Z.; Sun, Z.; Sun, L.; Peng, S.; Wang, Y.; Wang, Y.; Tang, J.; Huang, L. GO-PANI Nanofiltration Membrane with pH Response for High Efficiency Water Purification. J. Water Process Eng. 2025, 69, 106889. [Google Scholar] [CrossRef]
- Athinarayanan, B.; Jeong, D.-Y.; Kang, J.-H.; Koo, B.-H. Fabrication of nanoporous aluminum-oxide composite membranes. J. Korean Phys. Soc. 2015, 67, 1970–1976. [Google Scholar] [CrossRef]
- Du, J.; Xue, Y.; Xu, Y.; Zhan, X.; Zhang, D. High Water Permeability Interfacial Polymerized PVDF/EAA Composite Nanofiltration Membrane for Dye Separation. ACS Appl. Polym. Mater. 2024, 6, 13102–13109. [Google Scholar] [CrossRef]
- Abdullahi, A.A.; Saleh, T.A. Amine Grafted Graphene Oxide Embedded in Polyamide Membranes for Simultaneous Removal of Oil, Metals, and Salts from Oily Water. J. Mol. Liq. 2024, 408, 125352. [Google Scholar] [CrossRef]
- Ang, M.B.M.Y.; Wu, Y.-L.; Chu, M.-Y.; Wu, P.-H.; Chiao, Y.-H.; Millare, J.C.; Huang, S.-H.; Tsai, H.-A.; Lee, K.-R. Nanofiltration Membranes Formed through Interfacial Polymerization Involving Cycloalkane Amine Monomer and Trimesoyl Chloride Showing Some Tolerance to Chlorine during Dye Desalination. Membranes 2022, 12, 333. [Google Scholar] [CrossRef]
- Huang, S.; Wu, M.-B.; Zhu, C.-Y.; Ma, M.-Q.; Yang, J.; Wu, J.; Xu, Z.-K. Polyamide Nanofiltration Membranes Incorporated with Cellulose Nanocrystals for Enhanced Water Flux and Chlorine Resistance. ACS Sustain. Chem. Eng. 2019, 7, 12315–12322. [Google Scholar] [CrossRef]
- Liu, S.; Wang, M.; Dong, L.; Cui, Z.; He, B.; Li, J.; Yan, F. Incorporation of Crown Ether into PEI-Polyamide Nanofiltration Membrane for Efficient Mg2+/Li+ Separation. Sep. Purif. Technol. 2025, 360, 131054. [Google Scholar] [CrossRef]
- Liu, J.; Li, Q.; Ji, Y.; Cui, Z.; Mohammad, Y.; Li, J.; He, B. Double Polyamide Layers with CaCO3 Nanoparticles as Scaffolds for High Performance Nanofiltration Membranes. ACS Appl. Nano Mater. 2022, 5, 8279–8287. [Google Scholar] [CrossRef]
- Yu, S.; Ma, M.; Liu, J.; Tao, J.; Liu, M.; Gao, C. Study on Polyamide Thin-Film Composite Nanofiltration Membrane by Interfacial Polymerization of Polyvinylamine (PVAm) and Isophthaloyl Chloride (IPC). J. Membr. Sci. 2011, 379, 164–173. [Google Scholar] [CrossRef]
- Kong, P.; Sun, Z.; Gui, H.; Chen, Z.; Song, Y.; Wang, Y.; Wang, Y.; Kipper, M.J.; Tang, J.; Huang, L. Advances in the Application of Graphene Oxide Composite Loose Nanofiltration Membranes for Dye and Salt Separation. J. Environ. Chem. Eng. 2024, 12, 114278. [Google Scholar] [CrossRef]
- Li, H.; Xiao, S.; Zhao, X.; Yuan, J.; Yu, S. Preparation of High-Flux Loose Nanofiltration Membranes for Efficient Dye/Salt Separation by Controlling Interface Polymerization through Physical and Chemical Dual Constraints. Sep. Purif. Technol. 2025, 362, 131720. [Google Scholar] [CrossRef]
- Xu, G.-R.; An, Z.-H.; Zhao, H.-L.; Liu, Q. Polyamide Layer Modulation for PA-TFC Membranes Optimization: Developments, Mechanisms, and Implications. Sep. Purif. Technol. 2023, 311, 123200. [Google Scholar] [CrossRef]
- Zhang, J.; Yang, X.; Zhang, N.; Tao, Z.; Han, L.; Wei, B.; Qi, R.; Fu, Y.; Wang, Z. Polyamide Membrane Based on Hydrophilic Intermediate Layer for Simultaneous Wetting and Fouling Resistance in Membrane Distillation. J. Membr. Sci. 2025, 717, 123596. [Google Scholar] [CrossRef]
- Xu, G.; Chiao, Y.-H.; Fu, W.; Deng, L.; Hu, M.; Guan, K.; Gonzales, R.R.; Matsuyama, H. Temperature-Modulated Formation of Polyamide Layer for Enhanced Organic Solvent Reverse Osmosis (OSRO) Performance. J. Membr. Sci. 2023, 682, 121793. [Google Scholar] [CrossRef]
- Xiao, F.; Wang, B.; Hu, X.; Nair, S.; Chen, Y. Thin Film Nanocomposite Membrane Containing Zeolitic Imidazolate Framework-8 via Interfacial Polymerization for Highly Permeable Nanofiltration. J. Taiwan Inst. Chem. Eng. 2018, 83, 159–167. [Google Scholar] [CrossRef]
- Li, Y.; You, X.; Li, R.; Li, Y.; Yang, C.; Long, M.; Zhang, R.; Su, Y.; Jiang, Z. Loosening Ultrathin Polyamide Nanofilms through Alkali Hydrolysis for High-Permselective Nanofiltration. J. Membr. Sci. 2021, 637, 119623. [Google Scholar] [CrossRef]
- Minhas, F.T.; Bhanger, M.I. Interfacial Polymerization: A Facile Technique for Developing Solvent Resistant Nanofiltration (SRNF) Membrane. Procedia Manuf. 2018, 17, 680–687. [Google Scholar] [CrossRef]
- Burts, K.; Plisko, T.; Makarava, M.; Krasnova, M.; Penkova, A.; Ermakov, S.; Grigoryev, E.; Komolkin, A.; Bildyukevich, A. The Effect of PEG-Content and Molecular Weight of PEG-PPG-PEG Block Copolymers on the Structure and Performance of Polyphenylsulfone Ultra- and Nanofiltration Membranes. J. Membr. Sci. 2024, 704, 122869. [Google Scholar] [CrossRef]
- Al-Nahari, A.; Liu, S.; Zhang, Q.; Su, B. Ultraselective and Highly Permeable Thin-Film Composite Nanofiltration Membrane Enhanced by Hydrophilic Polydopamine Interlayer. J. Membr. Sci. 2025, 718, 123686. [Google Scholar] [CrossRef]
- Zhao, K.; Cheng, J.; Wang, P.; Hou, H.; An, L.; Yao, J.; Han, Y.; Liu, D.; Ma, J.; Liu, J.; et al. Constructing High-Performance Nanofiltration Membranes Using Nanofiber Supports: Effects of Structural Stability and Polyvinyl Alcohol Interlayers. Sep. Purif. Technol. 2024, 345, 127445. [Google Scholar] [CrossRef]
- Zhang, L.-L.; Zaoui, A.; Sekkal, W. Exfoliated Montmorillonite Nanofillers Role on the High Performance and the Permeability of Polyamide Nanofiltration Membrane. J. Membr. Sci. 2025, 713, 123303. [Google Scholar] [CrossRef]
- Jia, M.-M.; Feng, J.-H.; Shao, W.; Chen, Z.; Yu, J.-R.; Sun, J.-J.; Wu, Q.-Y.; Li, Y.; Xue, M.; Chen, X.-M. In-Situ Interfacial Synthesis of Metal-Organic Framework/Polyamide Thin-Film Nanocomposite Membranes with Elevated Nanofiltration Performances. J. Membr. Sci. 2024, 694, 122418. [Google Scholar] [CrossRef]
- Ahmad, H.; Waheed, A.; Chrystie, R.; Aljundi, I.H. Effect of Surfactants on the Permeation Rate and Selectivity of Polyamide Composite Membranes for Organic Solvent Nanofiltration. Process Saf. Environ. Prot. 2024, 190, 1052–1066. [Google Scholar] [CrossRef]
- Liu, Z.; Wang, Z.; Zhao, L.; Xu, J.; Chen, J.P.; Niu, Q.J. Rod-Coated PVA Interlayer Induced Nanofiltration Membrane: Method Development and Application for Separation of Dye/NaCl with Greater Performance. J. Membr. Sci. 2024, 694, 122406. [Google Scholar] [CrossRef]
- Chi, M.; Zheng, P.; Wei, M.; Zhu, A.; Zhong, L.; Zhang, Q.; Liu, Q. Polyamide Composite Nanofiltration Membrane Modified by Nanoporous TiO2 Interlayer for Enhanced Water Permeability. J. Ind. Eng. Chem. 2022, 115, 230–240. [Google Scholar] [CrossRef]
- Li, W.-L.; Lin, W.-T.; Zhu, C.-Y.; Fu, P.; Zhou, D.; Huang, X.-J.; Xu, Z.-K.; Wan, L.-S. High-Performance Thin Film Composite Nanofiltration Membranes with MoS2 Nanosheet Interlayer. J. Membr. Sci. 2023, 685, 121956. [Google Scholar] [CrossRef]
- Gao, J.; Zhang, M.; Wang, J.; Liu, G.; Liu, H.; Jiang, Y. Bioinspired Modification of Layer-Stacked Molybdenum Disulfide (MoS2) Membranes for Enhanced Nanofiltration Performance. ACS Omega 2019, 4, 4012–4022. [Google Scholar] [CrossRef]
- Fang, Y.; Zhu, C.-Y.; Han, X.; Ma, Z.-Y.; Yang, H.-C.; Zhang, C.; Liang, H.-Q.; Yang, X.; Xu, Z.-K. Tailoring Polyamide Nanofiltration Membranes by Switching Charge of Nanocellulose Interlayers. Langmuir 2024, 40, 18233–18241. [Google Scholar] [CrossRef]
- Zhu, C.; Zhang, X.; Xu, Z. Polyamide-based Membranes Consisting of Nanocomposite Interlayers for High Performance Nanofiltration. J. Appl. Polym. Sci. 2021, 138, 49940. [Google Scholar] [CrossRef]
- Li, J.; Gong, J.-L.; Fang, S.-Y.; Cao, W.-C.; Tang, S.-Q.; Qin, M.; Wang, Y.-W.; Zhou, H.-Y.; Long, M. Antifouling and Chemical-Resistant Nanofiltration Membrane Modulated by a Functionalized MWCNT Interlayer for Efficient Dye/Salt Separation at High Salinity. ACS Appl. Mater. Interfaces 2023, 15, 34272–34289. [Google Scholar] [CrossRef]
- Long, L.; Wu, C.; Yang, Z.; Tang, C.Y. Carbon Nanotube Interlayer Enhances Water Permeance and Antifouling Performance of Nanofiltration Membranes: Mechanisms and Experimental Evidence. Environ. Sci. Technol. 2022, 56, 2656–2664. [Google Scholar] [CrossRef] [PubMed]
- Gong, G.; Wang, P.; Zhou, Z.; Hu, Y. New Insights into the Role of an Interlayer for the Fabrication of Highly Selective and Permeable Thin-Film Composite Nanofiltration Membrane. ACS Appl. Mater. Interfaces 2019, 11, 7349–7356. [Google Scholar] [CrossRef] [PubMed]
- Cheng, P.; Zhu, T.; Wang, X.; Fan, K.; Liu, Y.; Wang, X.; Xia, S. Enhancing Nanofiltration Selectivity of Metal–Organic Framework Membranes via a Confined Interfacial Polymerization Strategy. Environ. Sci. Technol. 2023, 57, 12879–12889. [Google Scholar] [CrossRef] [PubMed]
- Yao, A.; Hua, D.; Hong, Y.; Pan, J.; Cheng, X.; Tan, K.B.; Zhan, G. Using Cu-TCPP Nanosheets as Interlayers for High-Performance Organic Solvent Nanofiltration Membranes. ACS Appl. Nano Mater. 2022, 5, 18718–18729. [Google Scholar] [CrossRef]
- Cui, X.; Kong, G.; Wei, S.; Zhang, Z.; Kang, Z.; Guo, H. PolyMOF Interlayers Modulated Interfacial Polymerization of Ultra-Thin Nanofiltration Membranes with Efficient and Stable Desalination Performance. J. Membr. Sci. 2024, 702, 122780. [Google Scholar] [CrossRef]
- Fang, Y.-X.; Lin, Y.-F.; Xu, Z.-L.; Pandaya, D.; Xu, S.-J. Interfacial Polymerization Modulated by COFs Interlayer to Fabricate Efficient Mono/Divalent Ions Separation Nanofiltration Membrane. Desalination 2024, 588, 117977. [Google Scholar] [CrossRef]
- Fang, Y.-X.; Xu, Z.-L.; Xu, S.-J. Polyamide Nanofiltration Membrane Modified with Defective Covalent Organic Framework Interlayer for Selective Ion Sieving. Sep. Purif. Technol. 2025, 355, 129747. [Google Scholar] [CrossRef]
- Wang, L.; Fang, M.; Liu, J.; He, J.; Li, J.; Lei, J. Layer-by-Layer Fabrication of High-Performance Polyamide/ZIF-8 Nanocomposite Membrane for Nanofiltration Applications. ACS Appl. Mater. Interfaces 2015, 7, 24082–24093. [Google Scholar] [CrossRef]
- Khandge, R.S.; Nguyen, T.-T.; Qiang, Z.; Yu, H.-K.; Ma, X. Polyamide-Crystalline Covalent Organic Framework Dual-Layer Nanofiltration Membrane with Improved Ion Selectivity. ACS Appl. Polym. Mater. 2024, 6, 13877–13885. [Google Scholar] [CrossRef]
- Jiang, H.; Yang, N.; Hao, Y.; Zhang, L.; Xiao, X.; Sun, Y.; Jiang, B.; Zhang, L. Highly Permeable Polyamide Nanofiltration Membranes Fabricated via the Construction of Anionic Covalent Organic Frameworks/Polydopamine Composite Interlayer. Sep. Purif. Technol. 2024, 347, 127590. [Google Scholar] [CrossRef]
- Zhong, Z.; Li, L.; Yu, S.; Li, X.; Li, H.; Jia, J.; Huang, J.; Cai, M.; Huang, W. Investigation on the Enhancement of solvent-resistant Nanofiltration Membrane Performance Utilizing PDA-UiO-66@ CNT as an Interlayer. J. Appl. Polym. Sci. 2024, 141, e55274. [Google Scholar] [CrossRef]
- Yang, Z.; Wang, F.; Guo, H.; Peng, L.E.; Ma, X.; Song, X.; Wang, Z.; Tang, C.Y. Mechanistic Insights into the Role of Polydopamine Interlayer toward Improved Separation Performance of Polyamide Nanofiltration Membranes. Environ. Sci. Technol. 2020, 54, 11611–11621. [Google Scholar] [CrossRef] [PubMed]
- Zhang, X.; Zhang, X.; Xu, L.; Zhang, G.; Meng, Q. Amphiphilic Interlayer Regulated Interfacial Polymerization for Constructing Polyamide Nanofiltration Membranes with High Perm-Selectivity of Mono-/Divalent Salts. ACS Appl. Mater. Interfaces 2024, 16, 14321–14332. [Google Scholar] [CrossRef]
- He, T.; Chen, F. Enhanced Separation Performance of Composite Nanofiltration Membranes via Electrostatic Air Spray PSS/PEI Interlayer. Desalination 2024, 573, 117221. [Google Scholar] [CrossRef]
- Hui, H.; Ding, H.; Liu, Q.; Zhao, H.; Hou, J.; Zhang, L.; Pei, H.; Li, X. Enhanced Nanofiltration Membranes for Mg2+/Li+ Separation: Development of a Polyethyleneimine Positively Charged Interlayer. Sep. Purif. Technol. 2025, 361, 131337. [Google Scholar] [CrossRef]
- Tian, R.; Zhang, H.; Wang, J.; Dilxat, D.; Xie, T.; Qi, Q.; Wang, Y. Nanofiltration Membrane Functionalization with Enhanced Hardness Cation Removal Using a Mono-Component Interlayer. Desalination 2024, 586, 117870. [Google Scholar] [CrossRef]
- Chen, K.; Li, F.; Wei, T.; Zhou, H.; Zhang, T.; Zhao, S.; Xie, T.; Sun, H.; Li, P.; Niu, Q.J. An Interlayer-Based Positive Charge Compensation Strategy for the Preparation of Highly Selective Mg2+/Li+ Separation Nanofiltration Membranes. J. Membr. Sci. 2023, 684, 121882. [Google Scholar] [CrossRef]
- Yang, X. Controllable Interfacial Polymerization for Nanofiltration Membrane Performance Improvement by the Polyphenol Interlayer. ACS Omega 2019, 4, 13824–13833. [Google Scholar] [CrossRef]
- Zhang, X.; Lv, Y.; Yang, H.-C.; Du, Y.; Xu, Z.-K. Polyphenol Coating as an Interlayer for Thin-Film Composite Membranes with Enhanced Nanofiltration Performance. ACS Appl. Mater. Interfaces 2016, 8, 32512–32519. [Google Scholar] [CrossRef]
- Zha, Z.; He, P.; Zhao, S.; Guo, R.; Wang, Z.; Wang, J. Interlayer-Modulated Polyamide Composite Membrane for Organic Solvent Nanofiltration. J. Membr. Sci. 2022, 647, 120306. [Google Scholar] [CrossRef]
- Peng, H.; Chen, P.; Wu, Y.; Chen, C.; Wang, D. Synergistic Preparation of Organic Solvent Nanofiltration Membranes from Polydopamine/Polyethyleneimine Interlayers with Aminated Attapulgite. Sep. Purif. Technol. 2025, 355, 129503. [Google Scholar] [CrossRef]
- Yang, X.; Du, Y.; Zhang, X.; He, A.; Xu, Z.-K. Nanofiltration Membrane with a Mussel-Inspired Interlayer for Improved Permeation Performance. Langmuir 2017, 33, 2318–2324. [Google Scholar] [CrossRef]
- Wang, T.; Wang, J.; Zhao, Z.; Zheng, X.; Li, J.; Liu, H.; Zhao, Z. Bio-Inspired Fabrication of Anti-Fouling and Stability of Nanofiltration Membranes with a Poly(Dopamine)/Graphene Oxide Interlayer. Ind. Eng. Chem. Res. 2021, 60, 14868–14883. [Google Scholar] [CrossRef]
- Wu, Y.; Yao, C.; Wang, Y.; Ding, M.; Xu, H.; Yan, X.; Gao, L. Water Recovery from the High Salinity Brine: Effect of the Interlayer Structure in the Polyamide Nanofiltration Membrane. J. Environ. Chem. Eng. 2024, 12, 111963. [Google Scholar] [CrossRef]
- Liang, C.; Wang, Q.; Pan, Z.; Yu, S.; Wu, D.; Gao, C. Enhancing Nanofiltration Performance with Tannic Acid and Polyvinyl Alcohol Interlayers for Improved Water Permeability and Selective Solute Rejection. Desalination 2025, 594, 118277. [Google Scholar] [CrossRef]
- Jia, R.; Jin, X.-G.; Xu, Z.-L.; Wu, L.-K.; Tong, Y.-H.; Li, H.-X.; Ping, H.-H.; Ma, X.-H.; Xu, S.-J. Surfactant-Interlayer Assisted Interfacial Polymerization for Constructing Janus Nanofiltration Membranes: Enhanced Li+/Mg2+ Separation Efficiency. J. Membr. Sci. 2024, 712, 123235. [Google Scholar] [CrossRef]
- Wang, X.; Mao, Y.; Gao, N.; Liao, Y.; Zhang, Y. Ceramic Supported Polyamide Composite Nanofiltration Membrane with a Glutaraldehyde Cross-Linked Chitosan Interlayer. J. Water Process Eng. 2024, 68, 106566. [Google Scholar] [CrossRef]
- Guo, Y.; Ji, C.; Ye, Y.; Chen, Y.; Yang, Z.; Xue, S.; Niu, Q.J. High Performance Nanofiltration Membrane Using Self-Doping Sulfonated Polyaniline. J. Membr. Sci. 2022, 652, 120441. [Google Scholar] [CrossRef]
- Guo, Y.; Wei, S.; Chen, Y.; Ye, H.; Xue, S.; Niu, Q.J. Sulfonated Polyaniline Interlayer with Controllable Doping Conditions for High-Performance Nanofiltration. J. Membr. Sci. 2023, 672, 121478. [Google Scholar] [CrossRef]
- Zhang, X.; Zhang, Y.; Zhao, G.; Zhang, Y.; Zhang, Y.; Chang, Y.; Zhang, X.; Yuan, B.; Hu, P.; Zhao, K.; et al. Super Li+/Mg2+ sieving and regenerable potentials of a nanofiltration membrane with intermediate layers of positively-charged hyperbranched polyamide. Desalination 2025, 604, 118737. [Google Scholar] [CrossRef]
- Burts, R.S.; Plisko, T.V.; Davydova, M.V.; Makarava, M.S.; Yuan, B.; Penkova, A.V.; Ermakov, S.S.; Bildyukevich, A.V. The effect of polydiallyldimethylammonium chloride molecular weight in the intermediate layer on the structure and performance of thin film composite membranes for nanofiltration prepared via interfacial polymerization. Colloids Surf. A Physicochem. Eng. Asp. 2025, 716, 136752. [Google Scholar] [CrossRef]
- Wang, Z.; Liang, S.; Kang, Y.; Zhao, W.; Xia, Y.; Yang, J.; Wang, H.; Zhang, X. Manipulating Interfacial Polymerization for Polymeric Nanofilms of Composite Separation Membranes. Prog. Polym. Sci. 2021, 122, 101450. [Google Scholar] [CrossRef]
- Karan, S.; Jiang, Z.; Livingston, A.G. Sub–10 Nm Polyamide Nanofilms with Ultrafast Solvent Transport for Molecular Separation. Science 2015, 348, 1347–1351. [Google Scholar] [CrossRef]
- Fang, S.; Guan, K.; Zhou, S.; Song, Q.; Shi, Y.; Fu, W.; Li, Z.; Xu, P.; Hu, M.; Mai, Z.; et al. Ternary-Coordination-Regulated Polyamide Nanofiltration Membranes for Li+/Mg2+ Separation. Desalination 2024, 581, 117577. [Google Scholar] [CrossRef]
- Li, H.; Li, Y.; Li, M.; Jin, Y.; Kang, G.; Cao, Y. Improving Mg2+/Li+ Separation Performance of Polyamide Nanofiltration Membrane by Swelling-Embedding-Shrinking Strategy. J. Membr. Sci. 2023, 669, 121321. [Google Scholar] [CrossRef]
- Liu, M.; Chen, W.; Fu, J.; Wang, A.; Ding, M.; Zhang, L.; Han, L.; Gao, L. Hyaluronic Acid-Modified Nanofiltration Membrane for Ultrahigh Water Permeance and Efficient Rejection of PFASs. Process Saf. Environ. Prot. 2022, 166, 214–221. [Google Scholar] [CrossRef]
- Guo, C.; Li, N.; Qian, X.; Shi, J.; Jing, M.; Teng, K.; Xu, Z. Ultra-Thin Double Janus Nanofiltration Membrane for Separation of Li+ and Mg2+: “Drag” Effect from Carboxyl-Containing Negative Interlayer. Sep. Purif. Technol. 2020, 230, 115567. [Google Scholar] [CrossRef]
- Yang, L.; Zhang, K.; Zhao, F.; Li, Z.; Chen, H.; Wang, K. Customized Polyamide Nanofiltration Membranes with Hyperbranched Polyamide-Amine-Modified Graphene Oxide Interlayer for Desalination. Desalination 2025, 600, 118496. [Google Scholar] [CrossRef]


| Membrane Code | PANI Interlayer | PA Selective Layer | ||
|---|---|---|---|---|
| ANI Concentration, wt.% | Duration of PANI Layer Application, h | PIP Concentration, wt.% | TMC Concentration, wt.% | |
| UF-PSF | - | |||
| UF-PSF/PANI 0.05 | 0.05 | 0.5 | - | |
| UF-PSF/PANI 0.1 | 0.1 | - | ||
| UF-PSF/PANI 0.3 | 0.3 | - | ||
| UF-PSF/PANI 0.1–1 | 0.1 | 1.0 | - | |
| NF-PSF–2 | - | 2.0 | 0.12 | |
| NF-PSF–4 | 4.0 | 0.24 | ||
| NF-PSF/PANI 0.05–0.5–2 | 0.5 | 0.5 | 2.0 | 0.12 |
| NF-PSF/PANI 0.05–0.5–4 | 4.0 | 0.24 | ||
| NF-PSF/PANI 0.1–0.5–1 | 0.1 | 1.0 | 0.06 | |
| NF-PSF/PANI 0.1–0.5–2 | 2.0 | 0.12 | ||
| NF-PSF/PANI 0.1–0.5–4 | 4.0 | 0.24 | ||
| NF-PSF/PANI 0.1–1–4 | 1.0 | |||
| NF-PSF/PANI 0.3–0.5–2 | 0.3 | 0.5 | 2.0 | 0.12 |
| NF-PSF/PANI 0.3–0.5–4 | 4.0 | 0.24 | ||
| NF-PSF/PANI 0.5–0.5–4 | 0.5 | |||
| Membrane Code | Roughness Parameters | Water Contact Angle, ° | |
|---|---|---|---|
| Ra, nm | Rq, nm | ||
| UF-PSF | 1.87 | 2.32 | 65 ± 2 |
| UF-PSF/PANI 0.05 | 2.25 | 2.95 | 49 ± 2 |
| UF-PSF/PANI 0.1 | 2.19 | 2.74 | 38 ± 2 |
| UF-PSF/PANI 0.3 | 5.46 | 7.88 | 26 ± 2 |
| UF-PSF/PANI 0.1–1 | 3.94 | 5.24 | 30 ± 2 |
| Membrane Code | Roughness Parameters | Water Contact Angle, ° | |
|---|---|---|---|
| Ra, nm | Rq, nm | ||
| NF-PSF–4 | 18.95 | 25.10 | 28 ± 2 |
| NF-PSF/PANI 0.1–0.5–4 | 10.98 | 15.48 | <10 |
| NF-PSF/PANI 0.1–1–4 | 5.54 | 8.20 | <10 |
| Salt | Rejection | ||
|---|---|---|---|
| NF-PSF–4 | NF-PSF/PANI 0.1–0.5–4 | NF-PSF/PANI 0.1–1–4 | |
| MgSO4 | 92 | 99.99 | 93 |
| Na2SO4 | 90 | 90 | 90 |
| MgCl2 | 91 | 99 | 92 |
| CaCl2 | 91 | 92 | 91 |
| NaCl | 28 | 25 | 22 |
| LiCl | 28 | 25 | 22 |
| SDM | 95 | 96 | 83 |
| Membrane Code | Roughness Parameters | Water Contact Angle, ° | |
|---|---|---|---|
| Ra, nm | Rq, nm | ||
| NF-PSF–2 | 10.51 | 13.54 | 28 ± 2 |
| NF-PSF–4 | 18.95 | 25.10 | 30 ± 2 |
| NF-PSF/PANI 0.05–0.5–2 | 6.87 | 8.58 | <10 |
| NF-PSF/PANI 0.05–0.5–4 | 12.35 | 17.56 | <10 |
| NF-PSF/PANI 0.1–0.5–2 | 6.53 | 9.07 | <10 |
| NF-PSF/PANI 0.1–0.5–4 | 10.98 | 15.48 | <10 |
| NF-PSF/PANI 0.3–0.5–2 | 5.68 | 7.85 | <10 |
| NF-PSF/PANI 0.3–0.5–4 | 8.39 | 11.05 | <10 |
| NF-PSF/PANI 0.1–0.5–1 | 4.07 | 5.60 | <10 |
| Membrane | Atom Content in the Selective Layer of TFC NF Membranes, % | Ratio of Peak Intensities | Crosslinking Degree, % | |||
|---|---|---|---|---|---|---|
| O | N | C | N–C=O/ O–C=O | N–C=O/ N–H | ||
| NF-PSF–4 | 19 | 12 | 69 | 3.67 | 5.82 | 31.33 |
| NF-PSF/PANI 0.1–0.5–4 | 20 | 14 | 66 | 3.93 | 97.9 | 47.06 |
| Membrane Code | Zeta-Potential of Membrane Surface, mV | Isoelectric Point, pH | ||
|---|---|---|---|---|
| pH 3 | pH 7 | pH 10 | ||
| NF-PSF–2 | 8.71 | −32.55 | −34.68 | 4.4 |
| NF-PSF/PANI 0.05–0.5–2 | 15.06 | −45.38 | −52.22 | 4.5 |
| NF-PSF–4 | 5.68 | −32.49 | −34.32 | 4.0 |
| NF-PSF/PANI 0.1–0.5–4 | 14.94 | −40.53 | −46.67 | 4.4 |
| Membrane Code | Rejection, % | ||||||
|---|---|---|---|---|---|---|---|
| MgSO4 | Na2SO4 | MgCl2 | CaCl2 | NaCl | LiCl | SDM | |
| NF-PSF–2 | 82 | 70 | 90 | 86 | 16 | 6 | 83 |
| NF-PSF/PANI 0.05–0.5–2 | >99.99 | 84 | 96 | 79 | 10 | 5 | 80 |
| NF-PSF/PANI 0.1–0.5–2 | >99.99 | 76 | 84 | 59 | 24 | 10 | 78 |
| NF-PSF/PANI 0.3–0.5–2 | 71 | 54 | 73 | 74 | 22 | 22 | 80 |
| NF-PSF–4 | 92 | 90 | 91 | 91 | 28 | 28 | 95 |
| NF-PSF/PANI 0.05–0.5–4 | >99.99 | 90 | 99 | 92 | 25 | 13 | 96 |
| NF-PSF/PANI 0.1–0.5–4 | >99.99 | 90 | 99 | 92 | 25 | 25 | 96 |
| NF-PSF/PANI 0.1–0.5–1 | >99.99 | 69 | 73 | 45 | 23 | 4 | 69 |
| Membrane Code | SMg/Li |
|---|---|
| NF-PSF–2 | 9 |
| NF-PSF/PANI 0.05–0.5–2 | 37 |
| NF-PSF–4 | 8 |
| NF-PSF/PANI 0.1–0.5–4 | 58 |
| Membrane Code | MWCO, Da | Average Pore Size, nm |
|---|---|---|
| NF-PSF–2 | 300 | 310 |
| NF-PSF/PANI 0.05–0.5–2 | 260 | 307 |
| NF-PSF–4 | 300 | 326 |
| NF-PSF/PANI 0.1–0.5–4 | 240 | 305 |
| Membrane Code | Water Permeation (ΔP = 0.5 MPa), L·m−2h−1 | Rejection of MgSO4, % | ||||
|---|---|---|---|---|---|---|
| Before | After Chlorine Treatment | After Acid Treatment | Before | After Chlorine Treatment | After Acid Treatment | |
| NF-PSF–2 | 64 | 65 | 67 | >99.99 | 99 | 98 |
| NF-PSF/PANI 0.05–0.5–2 | 64 | 64 | 64 | >99.99 | >99.99 | >99.99 |
| NF-PSF–4 | 21 | 23 | 25 | >99.99 | 99 | 99 |
| NF-PSF/PANI 0.1–0.5–4 | 40 | 40 | 40 | >99.99 | >99.99 | >99.99 |
| Composition | Membrane Permeance, L·m−2·h−1·bar−1 | R (MgSO4), % | R (Na2SO4), % | S (Mg2+/Li+) | Ref. | ||
| Membrane Support | Interlayer | PA Layer | |||||
| PSF | PDA/PEI | PIP/TMC | 7.5 | 95 | 97 | - | [53] |
| PSF | TA | PEI/TMC | 1.7 | 95 | 72 | 22 | [65] |
| TA-Cu | 2.9 | 97 | 76 | 26.5 | |||
| PSF | PEI | TMC/DETA | 3.2 | 94 | - | 11 | [66] |
| PES | COF-A | MPD + PIP/ Tp + TMC | 16.3 | 98 | 98 | 40.4 | [38] |
| PES | Hyaluronic acid | PIP/TMC | 29.5 | 91 | 95 | - | [67] |
| PES | PDADMAC+ carboxylated cellulose nanocrystal | PEI/TMC | 3.4 | - | - | 5.8 | [68] |
| PES/PVP/PEG 400 | GO-hyperbranched polyamide-amine | PIP/TMC | 14.3 | 88 | 97 | - | [69] |
| PSF/PVP K30 | PANI | PIP/TMC | 12.8 | >99.99 | 84 | 37 | This work |
| 8 | >99.99 | 90 | 58 | ||||
Disclaimer/Publisher’s Note: The statements, opinions and data contained in all publications are solely those of the individual author(s) and contributor(s) and not of MDPI and/or the editor(s). MDPI and/or the editor(s) disclaim responsibility for any injury to people or property resulting from any ideas, methods, instructions or products referred to in the content. |
© 2025 by the authors. Licensee MDPI, Basel, Switzerland. This article is an open access article distributed under the terms and conditions of the Creative Commons Attribution (CC BY) license (https://creativecommons.org/licenses/by/4.0/).
Share and Cite
Burts, K.S.; Plisko, T.V.; Penkova, A.V.; Yuan, B.; Ermakov, S.S.; Bildyukevich, A.V. Correlation Between Conditions of Polyaniline Interlayer Formation and the Structure and Performance of Thin-Film Composite Membranes for Nanofiltration Prepared via Interfacial Polymerization. Polymers 2025, 17, 1199. https://doi.org/10.3390/polym17091199
Burts KS, Plisko TV, Penkova AV, Yuan B, Ermakov SS, Bildyukevich AV. Correlation Between Conditions of Polyaniline Interlayer Formation and the Structure and Performance of Thin-Film Composite Membranes for Nanofiltration Prepared via Interfacial Polymerization. Polymers. 2025; 17(9):1199. https://doi.org/10.3390/polym17091199
Chicago/Turabian StyleBurts, Katsiaryna S., Tatiana V. Plisko, Anastasia V. Penkova, Bingbing Yuan, Sergey S. Ermakov, and Alexandr V. Bildyukevich. 2025. "Correlation Between Conditions of Polyaniline Interlayer Formation and the Structure and Performance of Thin-Film Composite Membranes for Nanofiltration Prepared via Interfacial Polymerization" Polymers 17, no. 9: 1199. https://doi.org/10.3390/polym17091199
APA StyleBurts, K. S., Plisko, T. V., Penkova, A. V., Yuan, B., Ermakov, S. S., & Bildyukevich, A. V. (2025). Correlation Between Conditions of Polyaniline Interlayer Formation and the Structure and Performance of Thin-Film Composite Membranes for Nanofiltration Prepared via Interfacial Polymerization. Polymers, 17(9), 1199. https://doi.org/10.3390/polym17091199