Article

Cure Kinetics-Driven Compression Molding of CFRP for Fast and Low-Cost Manufacturing

1
School of Advanced Manufacturing, Nanchang University, Nanchang 330031, China
2
Nanchang Jardine Advanced Composite Material Co., Ltd., Nanchang 330029, China
3
College of Mechanical and Electrical Engineering, Lanzhou Jiaotong University, Lanzhou 730070, China
4
State Key Laboratory of Precision Manufacturing for Extreme Service Performance, Central South University, Changsha 410083, China
*
Authors to whom correspondence should be addressed.
Polymers 2025, 17(15), 2154; https://doi.org/10.3390/polym17152154
Submission received: 5 July 2025 / Revised: 31 July 2025 / Accepted: 4 August 2025 / Published: 6 August 2025
(This article belongs to the Special Issue Advances in High-Performance Polymer Materials, 2nd Edition)

Abstract

Carbon fiber-reinforced polymer (CFRP) composites are widely used in aerospace due to their excellent strength-to-weight ratio and tailorable properties. However, these properties critically depend on the CFRP curing cycle. The commonly adopted manufacturer-recommended curing cycle (MRCC), designed to accommodate the most conservative conditions, involves prolonged curing times and high energy consumption. To overcome these limitations, this study proposes an efficient and adaptable method to determine the optimal curing cycle. The effects of varying heating rates on resin dynamic and isothermal–exothermic behavior were characterized via reaction kinetics analysis using differential scanning calorimetry (DSC) and rheological measurements. The activation energy of the reaction system was substituted into the modified Sun–Gang model, and the parameters were estimated using a particle swarm optimization algorithm. Based on the curing kinetic behavior of the resin, CFRP compression molding process orthogonal experiments were conducted. A weighted scoring system incorporating strength, energy consumption, and cycle time enabled multidimensional evaluation of optimized solutions. Applying this curing cycle optimization method to a commercial epoxy resin increased efficiency by 247.22% and reduced energy consumption by 35.7% while meeting general product performance requirements. These results confirm the method’s reliability and its significance for improving production efficiency.

1. Introduction

CFRP composites have become irreplaceable structural materials in aerospace and high-end manufacturing due to their exceptional specific strength, corrosion resistance, and customizable mechanical properties [1,2,3,4]. Their customizable mechanical properties can meet the various requirements for material performance in different high-end manufacturing scenarios. However, to fully realize the potential of this material, an appropriate and efficient curing cycle is an essential prerequisite. The industry currently relies predominantly on the MRCC as the standard protocol [5]. Despite its widespread adoption, the MRCC is severely constrained by its need to accommodate the most conservative scenarios, such as maximum-thickness components, forcing it to employ excessively long curing cycles that severely impede production efficiency [6]. Moreover, the continuous high-temperature and high-pressure conditions of the MRCC result in extremely high energy consumption. This contradicts global green manufacturing goals and hinders sustainable industrial growth. Optimizing the curing cycle is therefore not merely an academic pursuit but a crucial engineering challenge with direct implications for cost competitiveness, production capacity, and sustainability in CFRP manufacturing.
To optimize the curing cycle of epoxy-based CFRP while balancing efficiency, material performance, and energy conservation, researchers have pursued two primary pathways through extensive investigation. For the first approach, some researchers focus on resin formulation design to accelerate curing through chemical composition modifications. Eom et al. [7] investigated the impact of various curing agents on the curing behavior of epoxy resins to reduce curing time and improve efficiency. Meanwhile, Tarafdar et al. [8] employed an improved ultraviolet-assisted frontal polymerization (UV-FP) method, utilizing ultraviolet-triggered self-exothermic reactions to complete the curing process. This approach reduced curing time from 15 h to less than 2 min, achieving mechanical properties comparable to or surpassing those of traditional curing methods. However, this method may cause non-uniform temperature distribution due to self-sustained exothermic reactions during the frontal polymerization process, potentially leading to adverse effects. For the second approach, some researchers are dedicated to achieving accelerated curing by coupling external energy fields. For example, Tang et al. [9] achieved highly efficient and energy-saving curing of epoxy resins through electro-curing, reducing energy consumption by 90% and shortening curing time by 40% compared to autoclave processing. Nevertheless, this method significantly increased porosity and substantially decreased mechanical properties, rendering it unsuitable for high-performance applications. Similarly, Xu et al. [10] employed microwave curing to enhance the compressive strength of CFRP composites while reducing curing time by 39%. However, the intricate multiphase dynamics during microwave curing demand further comprehensive study in composite manufacturing. Additionally, Muc et al. [11] described the influence of resin flow and curing dynamics on residual stresses in composite structures and optimized the curing process through numerical analysis and genetic algorithms. Researchers have increasingly employed curing kinetics and rheological models to understand and predict the complex interplay of heat transfer, chemical reactions, and resin flow during curing. The phenomenological Kamal model and autocatalytic models are widely used [12,13,14,15].
Although the aforementioned studies demonstrate potential in specific scenarios, a universal method for CFRP curing cycle optimization remains absent due to the intrinsic complexities of thermoset composites. CFRP components with different geometries each require their own unique optimal curing process parameters to balance the trade-offs between efficiency, performance, and energy consumption. The intrinsic design–manufacturing interdependency of CFRP necessitates that cure parameters (e.g., heating rate, temperature, dwell time) simultaneously satisfy multi-objective constraints: high performance, high efficiency, and low energy consumption. However, conventional parameter determination methods can only characterize curing cycles under isolated conditions, failing to systematically evaluate interactive effects of multivariate combinations on comprehensive outcomes. The urgent need to establish novel methodologies to overcome the limitations of the MRCC has become a critical challenge in CFRP manufacturing.
This study aims to develop an optimized, rapid, and low-energy compression molding cure cycle for epoxy resin prepreg systems. Although the MRCC provides a safe baseline, its inefficiency is particularly pronounced for this widely used material. The core limitation of current practice lies in the reliance on empirical trial-and-error or isolated DSC analysis to formulate cure cycles, lacking a systematic, model-driven approach to efficiently explore the vast process parameter space. This study proposes a dynamic optimization strategy: by elucidating the curing kinetics and rheological behavior of resins and systematically investigating the impact of curing process parameter combinations on mechanical properties through orthogonal experiments, a weighted scoring system encompassing performance, energy consumption, and compression molding time is established to conduct a multidimensional comprehensive evaluation of the MRCC and optimized alternatives. This approach enables the customization of the optimal process route on demand. Compared to the MRCC, the curing cycle routes formulated by this method are more flexible and realistic, effectively reducing unnecessary energy consumption and minimizing wasted compression molding time.

2. Materials and Methods

2.1. Materials

This study employs T700/2626 prepreg provided by Nanchang Jardine Advanced Composite Material Company, Nanchang, China. It features an epoxy resin system with significant toughening effects. The carbon fibers are PAN-based, are prepared by wet spinning, and exhibit strong adhesion between fiber and matrix. The prepreg has a fiber volume fraction of 67% and a single-layer thickness of approximately 0.125 mm.

2.2. DSC Measurements

In this study, the thermal behavior of the epoxy system was investigated using the DSC 3500 Sirius manufactured by NETZSCH, Selb, Bavaria, Germany. An aluminum crucible with a volume of 40 μL was used, and the mass of the resin was controlled to be 5–10 mg. A nitrogen purge flow rate of 40 mL/min was selected, following similar procedures and verified to effectively maintain an inert atmosphere without adversely affecting the specimen [16]. The dynamic experimental temperature range was 300–550 K, with heating rates of 1 K/min, 2 K/min, 3 K/min, 4 K/min, 5 K/min, 10 K/min, 15 K/min, and 20 K/min. In order to investigate the isothermal DSC behavior of the sample under different heating rates, the crucible containing the sample was placed into the furnace and heated to the target temperatures of 393 K, 413 K, and 433 K at various heating rates of 1 K/min, 5 K/min, 10 K/min, and 20 K/min, with the heat flow signal being recorded simultaneously [17]. To guarantee the reliability of the experimental data, the DSC was calibrated using indium and zinc. After each experiment, all sample crucibles were reweighed to detect any possible leakage during the experimental process. Moreover, all DSC tests were conducted in triplicate to verify the reproducibility of the results.

2.3. Rheological Measurements

In this study, the rheological properties of thermosetting materials were systematically investigated under both non-isothermal and isothermal conditions using steady-state shear flow measurement techniques [18]. Prior to the experiments, a series of preliminary tests were conducted to optimize the experimental parameters. The final parameters were determined as follows: a gap of 1 mm, an angular frequency of 10 rad/s, and a strain of 1%. Under non-isothermal experimental conditions, the heating rates were set at 1 K/min, 5 K/min, 10 K/min, 15 K/min, and 20 K/min, covering a temperature range of 300–550 K. Under isothermal experimental conditions, the selected temperatures were 373 K, 393 K, 413 K, 433 K, and 453 K. Analysis of the isothermal rheological curves further explores the mechanism of the curing reaction and the key role of viscosity during the curing cycle.

2.4. Compression Molding Process

This study employs a compression molding technique with manual layup of 20 layers in a [0]20 configuration, embedding temperature detection equipment at layers 0, 10, and 20, as shown in Figure 1. The process includes the following steps: First, the carbon fiber/epoxy prepreg is removed from −18 °C storage and thawed at approximately 25 °C for six hours. Once moisture-free, it is cut into 300 mm × 300 mm pieces. Next, the fiber direction is defined as 0°, and 20 layers of prepreg are laid up manually. Each layer is compacted using tools such as rubber rollers or scrapers to ensure tight bonding and remove air bubbles, while temperature sensors are embedded at layers 0, 10, and 20. Subsequently, the laid-up prepreg stack is placed into the mold of a BL-6170-B flat-plate press and the curing program is executed at a forming pressure of 0.6 MPa. Finally, after curing, the mold is cooled to below 60 °C at a rate of 2 K/min. The mold is then opened, and the cured composite laminate sample is removed.

2.5. Interlaminar Shear Strength Test

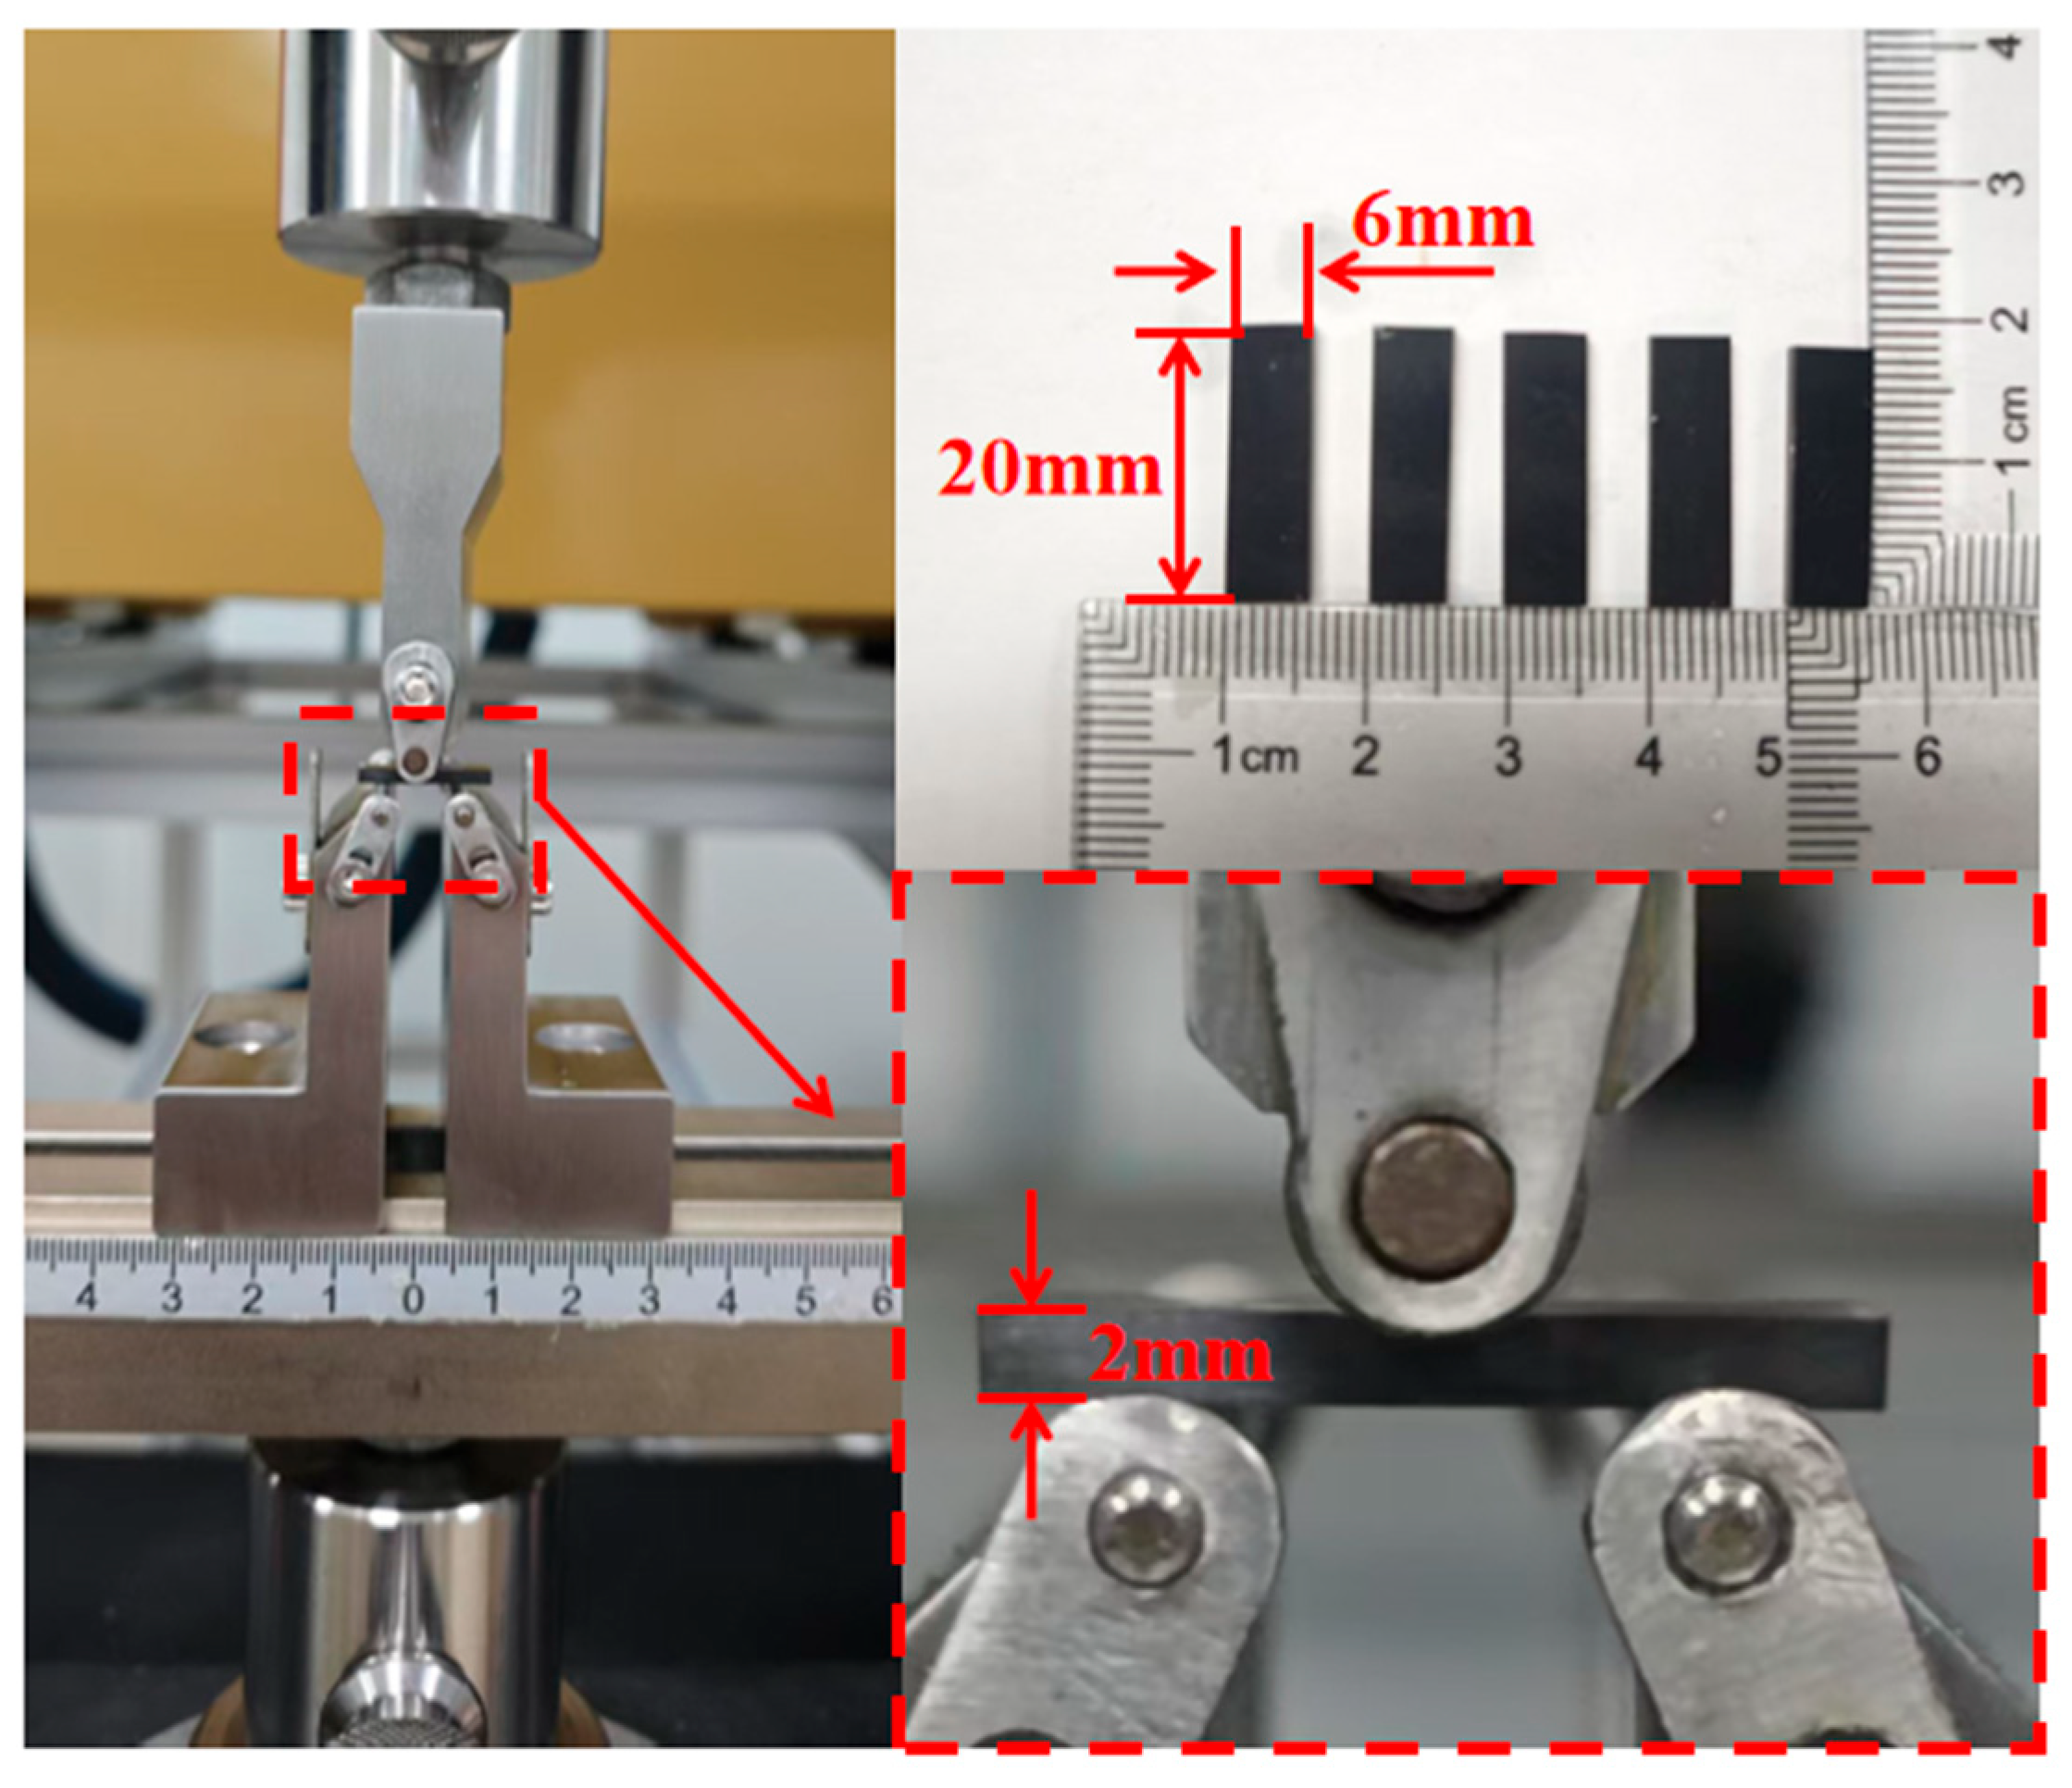
Interlaminar shear strength (ILSS) is a critical mechanical test for evaluating the interlaminar bonding performance of composite materials. This experiment assesses the structural integrity and durability of materials by measuring their resistance to shear failure between layers. ILSS exhibits greater sensitivity to the curing degree of CFRP than tensile or flexural properties. Therefore, ILSS is adopted for CFRP evaluation. The short beam shear test was conducted in accordance with GB/T 30969–2014 [19]. The standard specimen dimensions are 20 mm × 6 mm × 2 mm (length × width × thickness), as shown in Figure 2. These specimens were cut from a unidirectional laminate measuring 300 mm × 300 mm, fabricated from 20 layers of T700/2626 prepreg. During the test, a Zwick testing machine applied a loading rate of 1.0 mm/min to the specimen and measured the applied load. The short beam three-point bending strength (interlaminar shear strength, ILSS) was calculated using Equation (1) [20]:
τ s b s = 0.75 × P m a x W h
where τsbs, Pmax, W, and h represent the shear strength, the maximum load observed during the test, the specimen width, and the specimen thickness, respectively. Metallographic examination was employed to determine the porosity of compression-molded carbon fiber/epoxy composites. The advanced image processing software “image Pro plus 6.0” was used to calculate the pore area ratio in the metallographic image of the polished sample, so as to quantify the porosity parameters [21,22].

3. Results

3.1. Epoxy Curing Behavior Analysis

3.1.1. Dynamic Curing Kinetics Characterization and Modeling

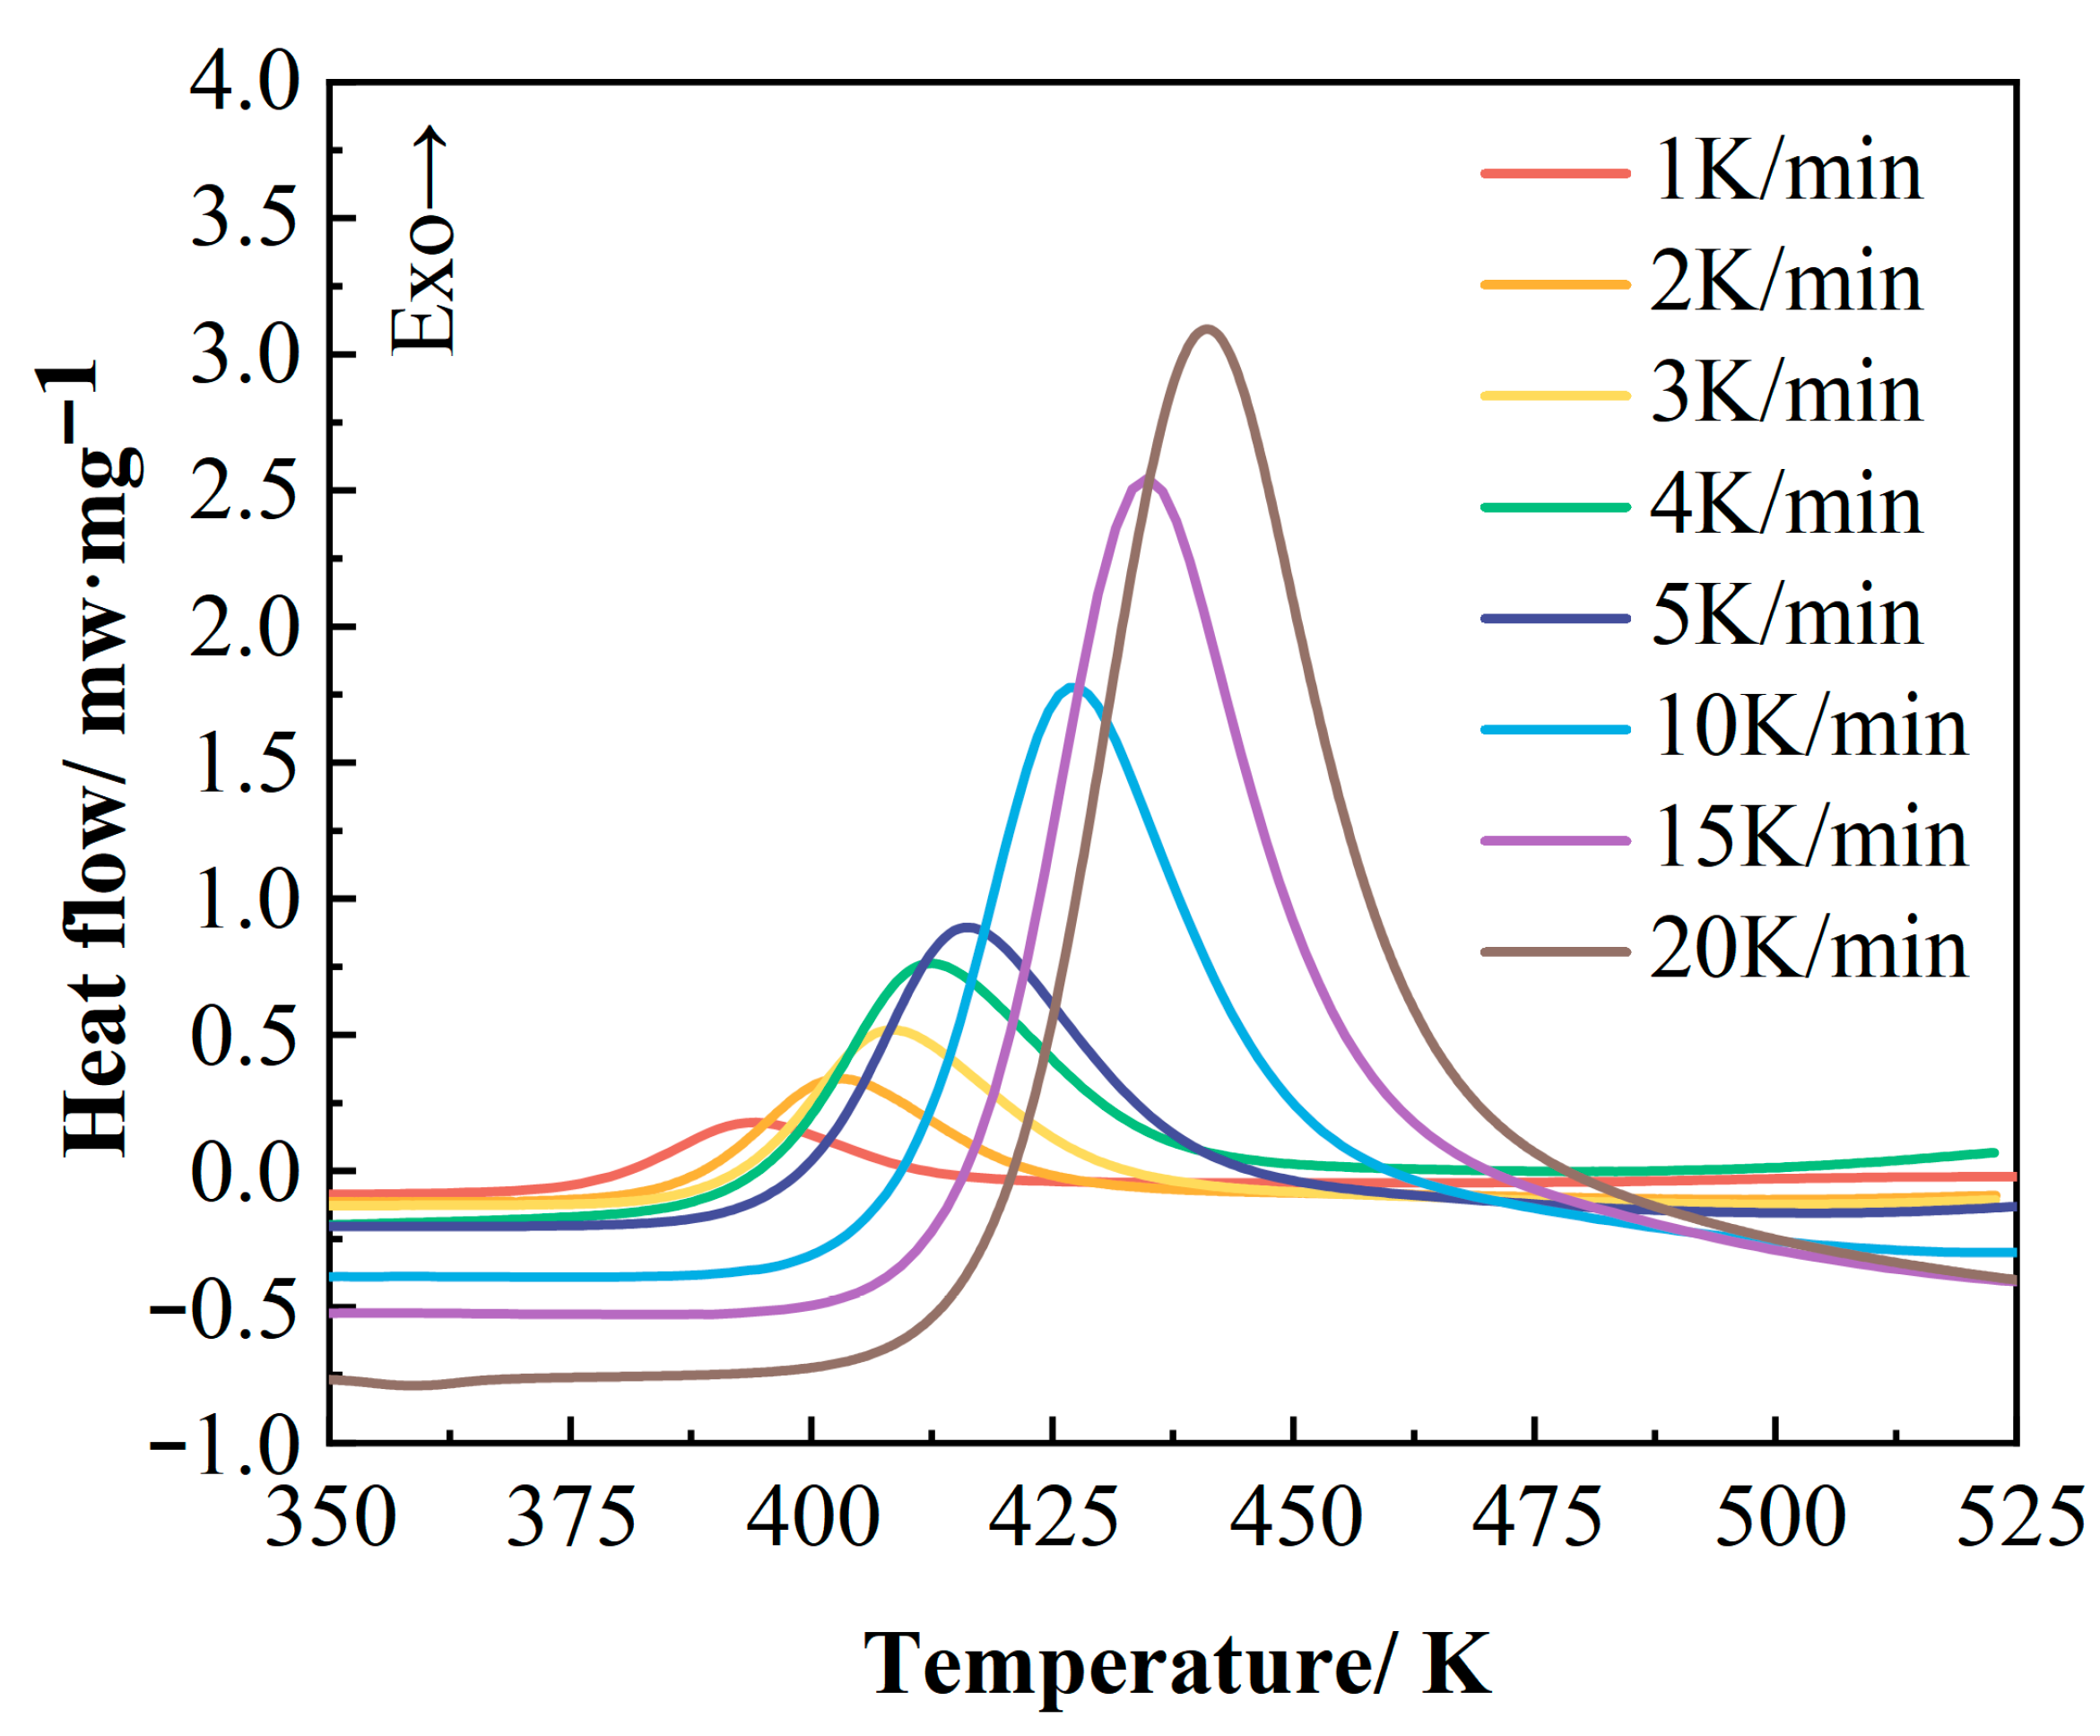
Thermal analysis was performed using DSC to determine the curing temperature range of the 2626 epoxy resin. Figure 3 presents the DSC curves of this epoxy resin obtained at different heating rates (1, 2, 3, 4, 5, 10, 15, and 20 K/min). From these curves, the onset temperature (Ti), peak temperature (Tp), and termination temperature (Tf) of the curing reaction were determined; specific values are listed in Table 1. The resin exhibits only a single exothermic peak throughout the entire curing process. Furthermore, its characteristic temperatures (Ti, Tp, Tf) increase with higher heating rates, and the corresponding exothermic peak shifts entirely towards higher temperatures [23,24]. This phenomenon is primarily attributed to the increased thermal effect per unit time at higher heating rates, which intensifies thermal lag within the system [25].
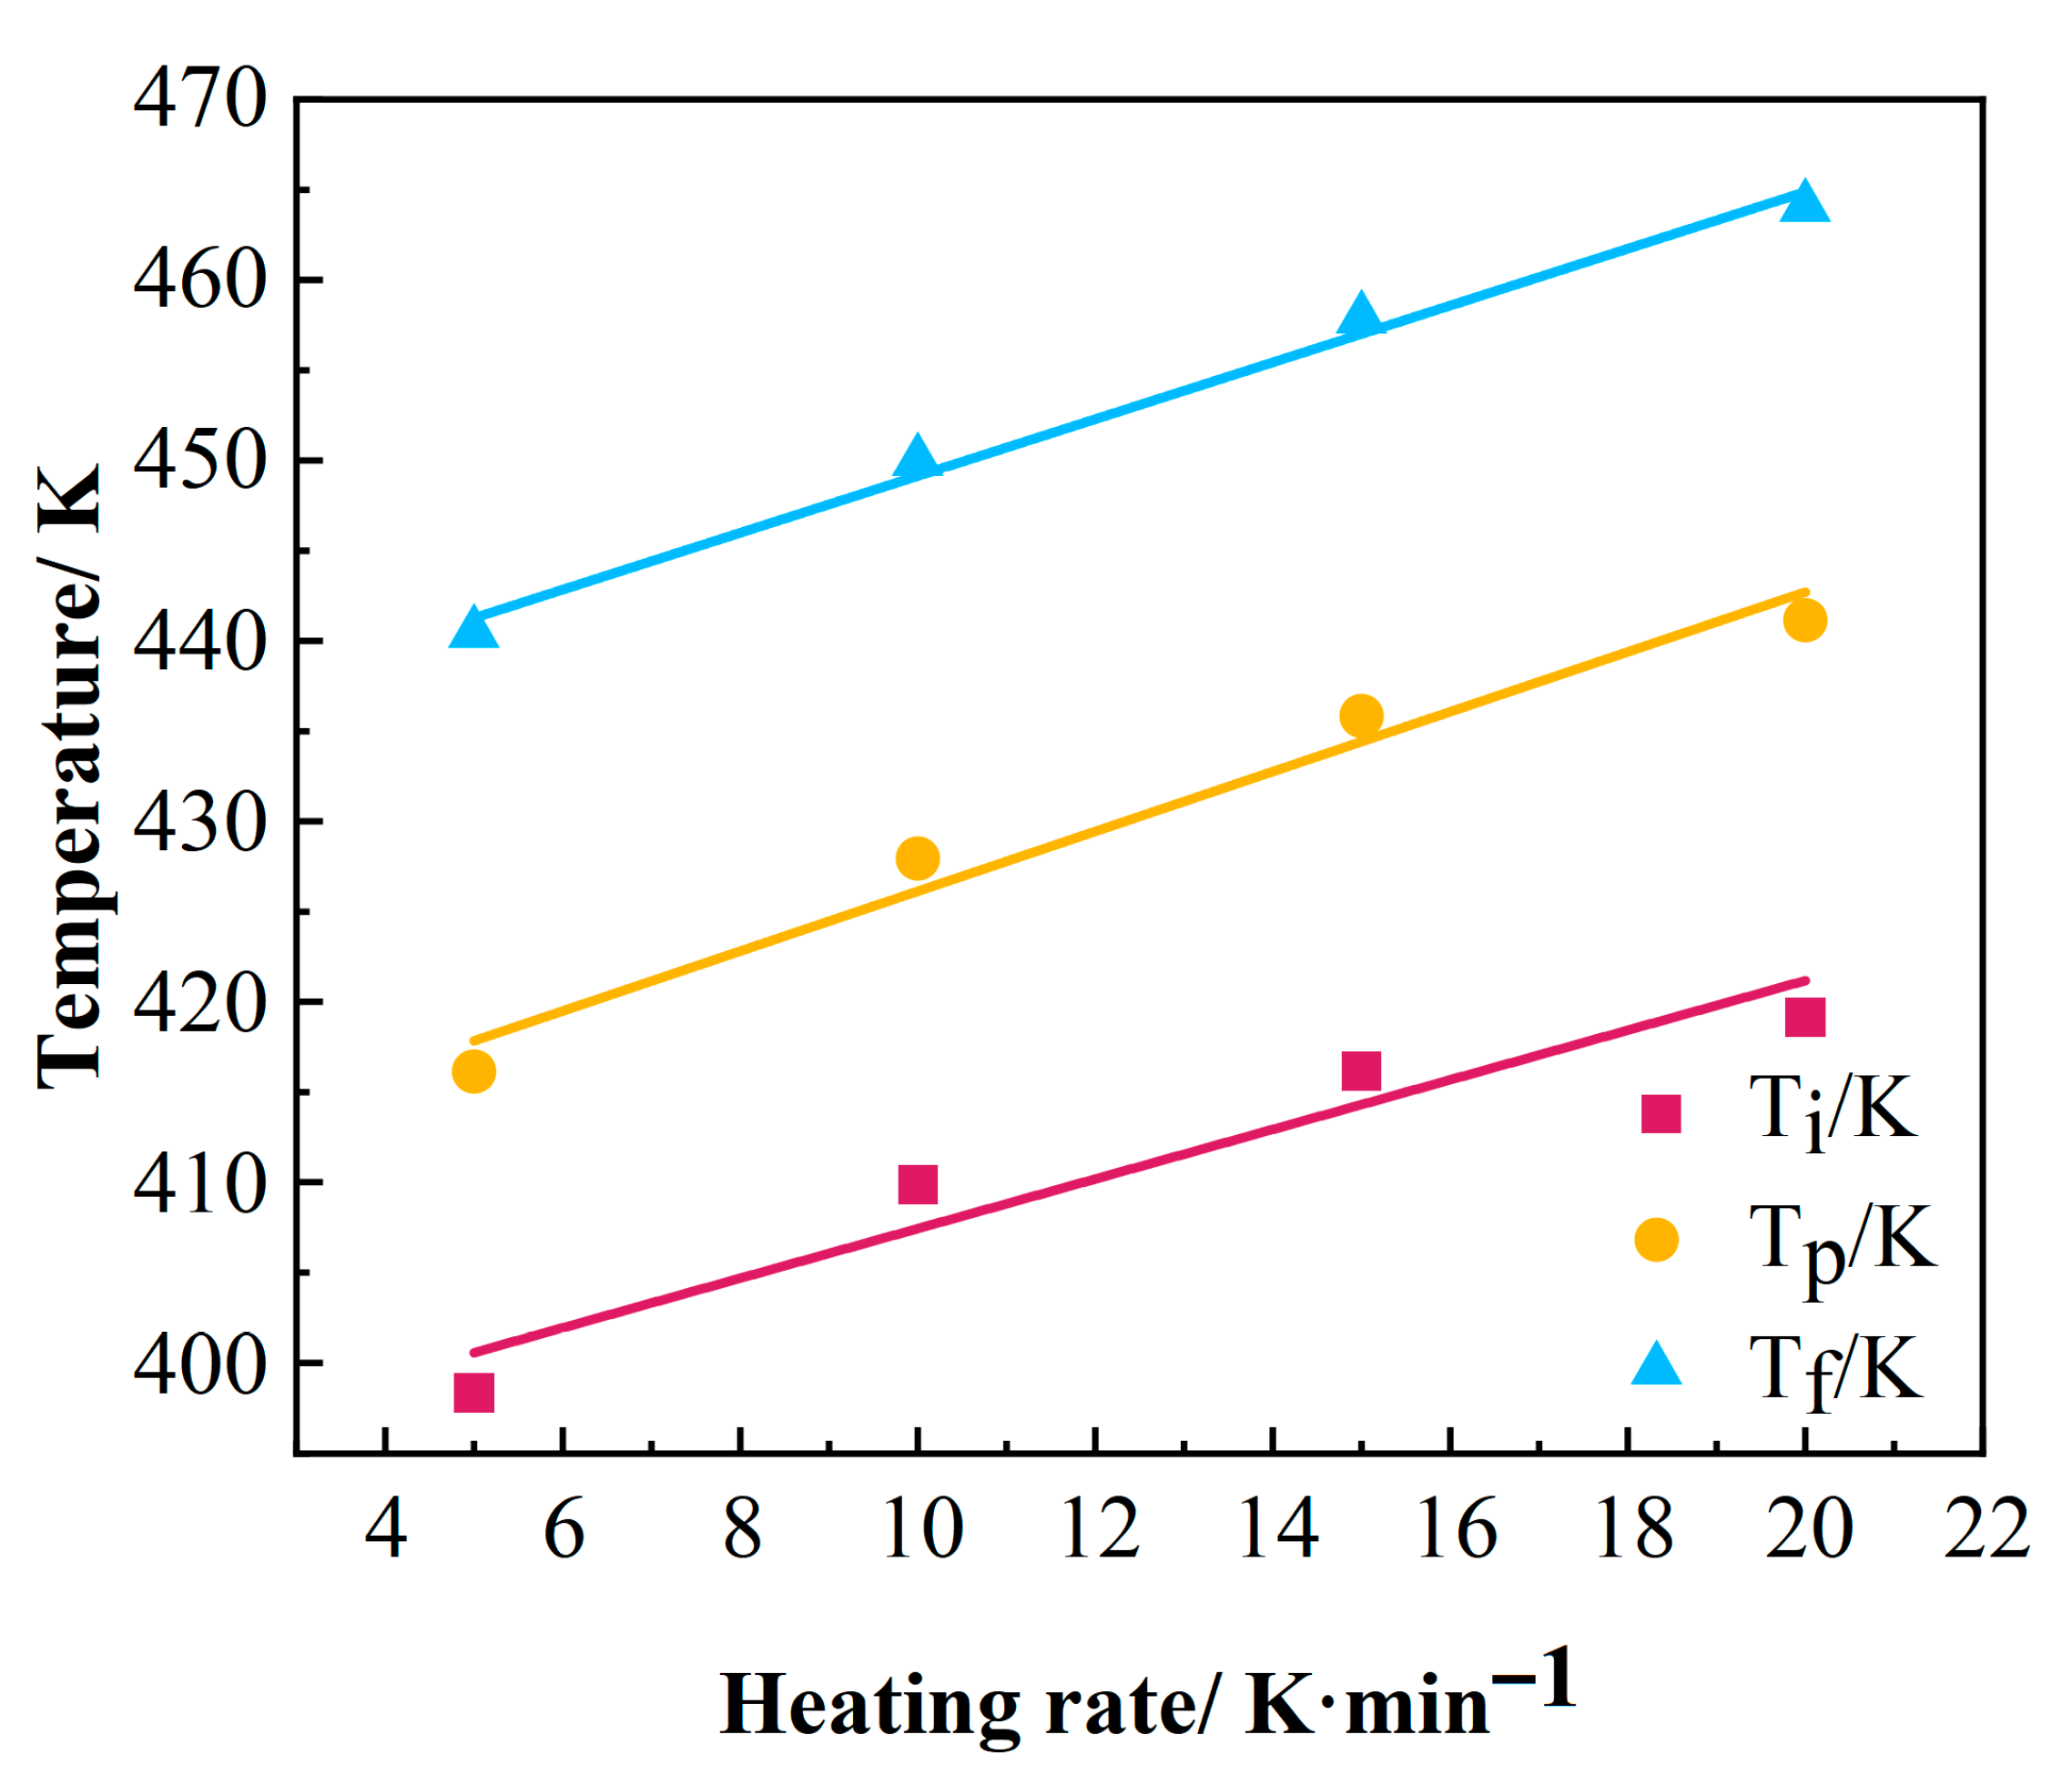
To determine the characteristic curing temperatures—onset temperature (Ti), peak temperature (Tp), and termination temperature (Tf)—of the epoxy resin, the characteristic temperature data obtained at different heating rates (β) were subjected to linear regression [26]. These fitted lines were extrapolated to a heating rate of β = 0 K/min, as illustrated in Figure 4. The results indicate a strong linear relationship between the characteristic temperatures and the heating rate. Consequently, the intercept values of each linear regression curve on the y-axis (corresponding to β = 0) represent the extrapolated characteristic temperatures for the curing process under quasi-static conditions [27]. Based on this analysis, the characteristic curing temperatures of the resin were determined as follows: Ti = 393 K, Tp = 413 K, Tf = 433 K.
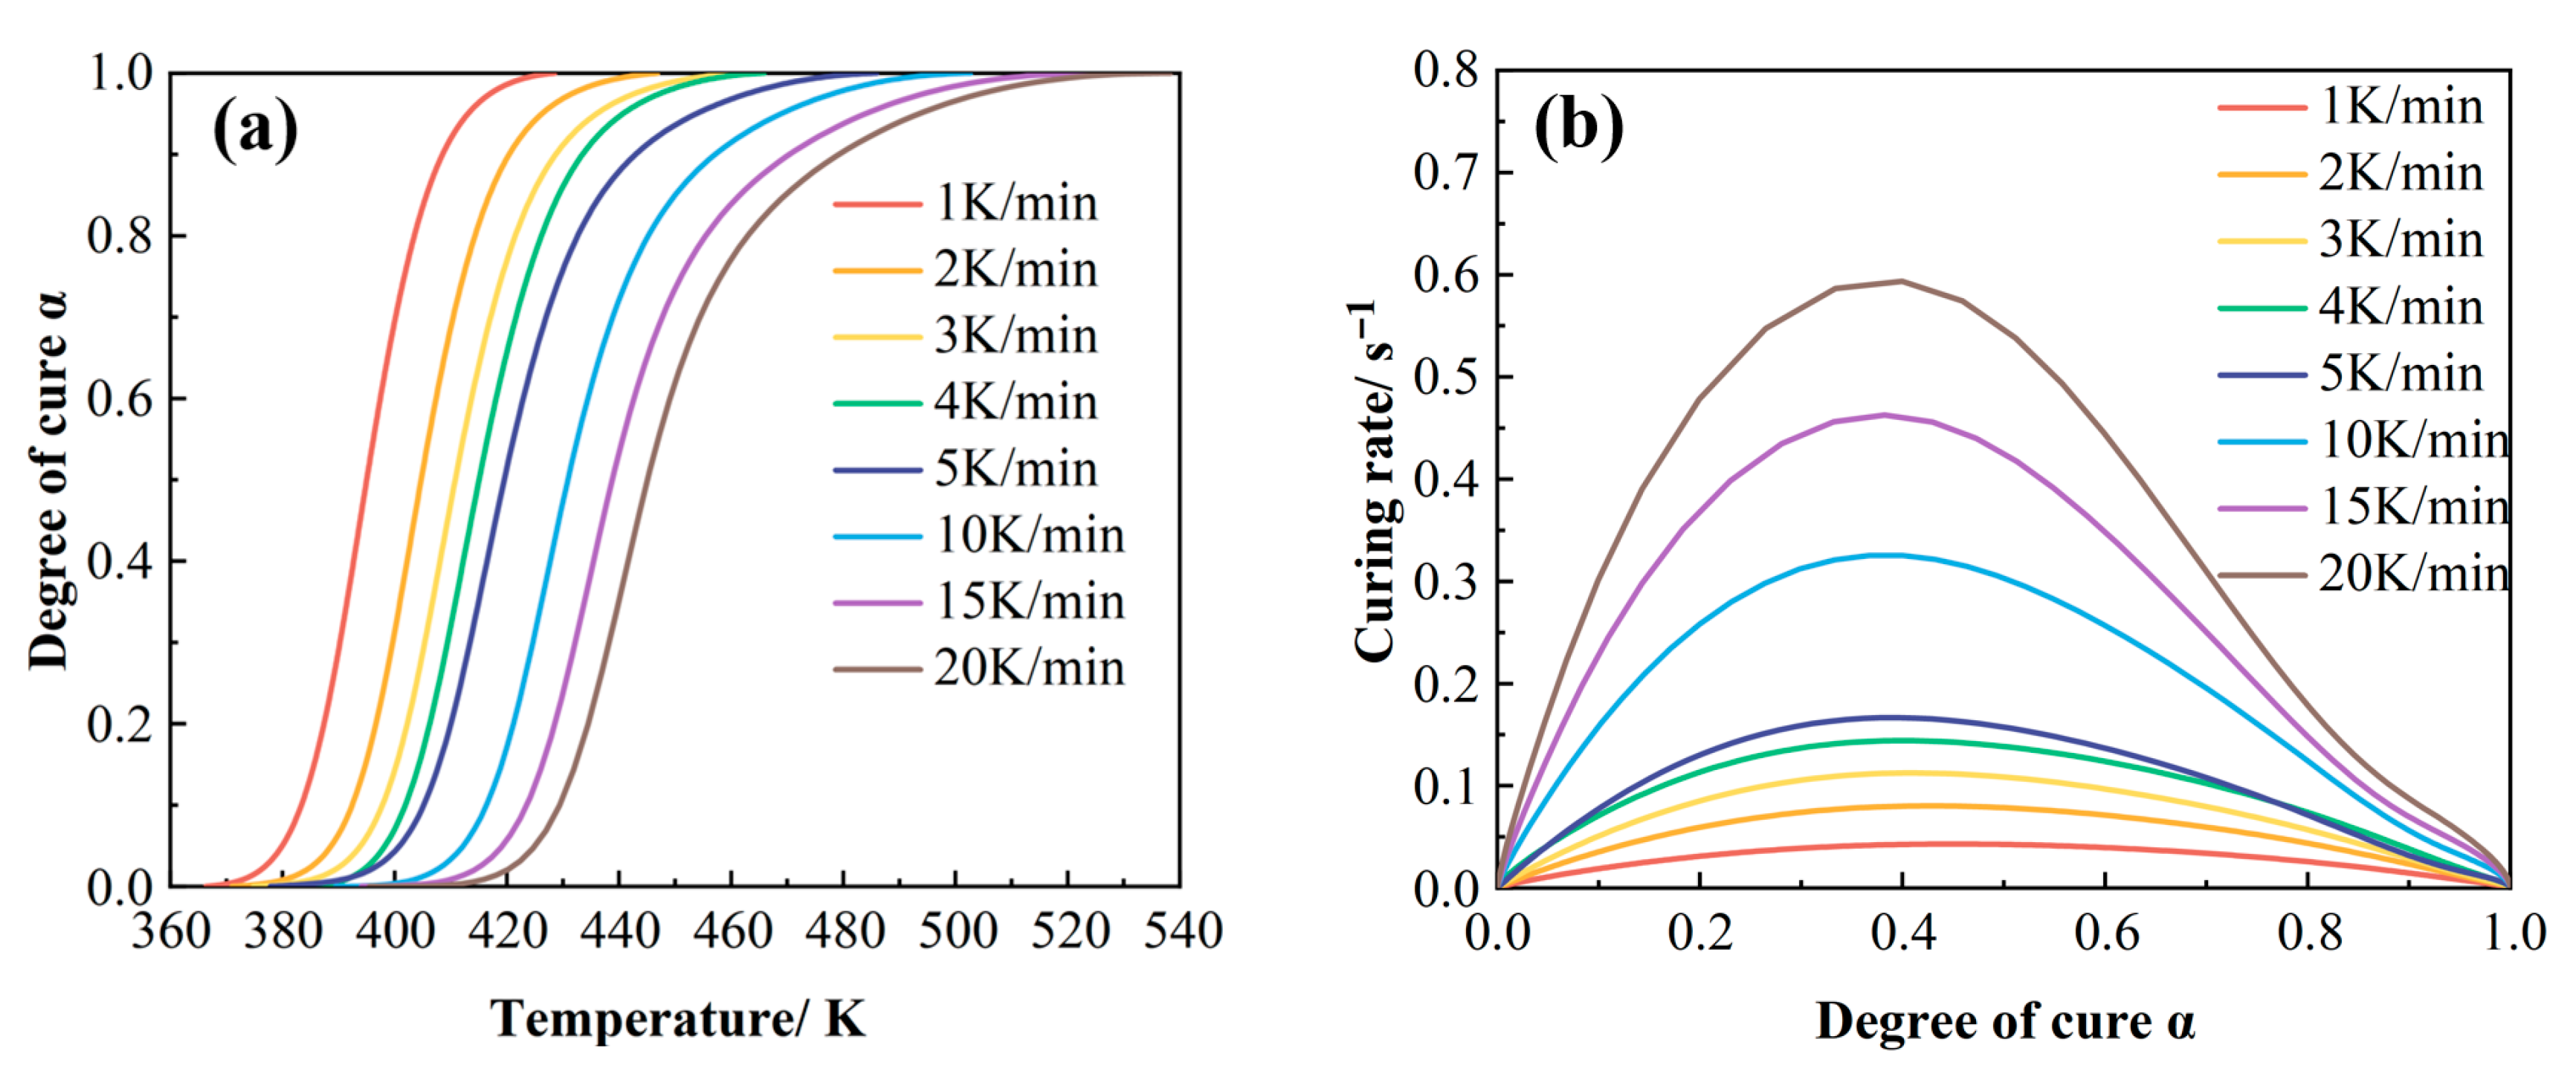
The degree of cure as a function of temperature (Figure 5a) was obtained by calculating the peak area of the non-isothermal DSC curves and normalizing the partial peak area at various temperatures with respect to the total peak area according to Equation (2) [28,29].
α T = H t H 0
where α T is the curing degree at T, H t is the heat release at T, and H 0 is the total heat release of the curing reaction.
The results demonstrate that the temperature required to achieve the same degree of cure increases with higher heating rates [30]. This phenomenon arises from the competition between two opposing effects induced by higher heating rates: (1) a reduction in system viscosity, which facilitates resin flow and void removal, and (2) an acceleration of the curing reaction kinetics, which rapidly increases viscosity and gelation, thereby limiting the time available for resin flow and consolidation [31]. Furthermore, increased heating rates lead to higher onset (Ti) and peak (Tp) temperatures, causing the entire curve to shift towards higher temperatures. This phenomenon stems from delayed molecular chain mobility in response to temperature changes, postponing the initiation of crosslinking reactions and consequently requiring higher temperatures to trigger the curing process [32].
The curing reaction rate was obtained by differentiating the degree-of-cure curve with respect to time [33,34]. Figure 5b illustrates the variation in the curing rate as a function of the degree of cure at different heating rates. It can be seen that the curing rate reaches its maximum at a degree of cure of approximately 0.4, subsequently decreasing as the degree of cure increases. This behavior is consistent with the characteristics of an autocatalytic reaction mechanism [35]. Furthermore, at any given degree of cure, a higher heating rate corresponds to a greater curing reaction rate.
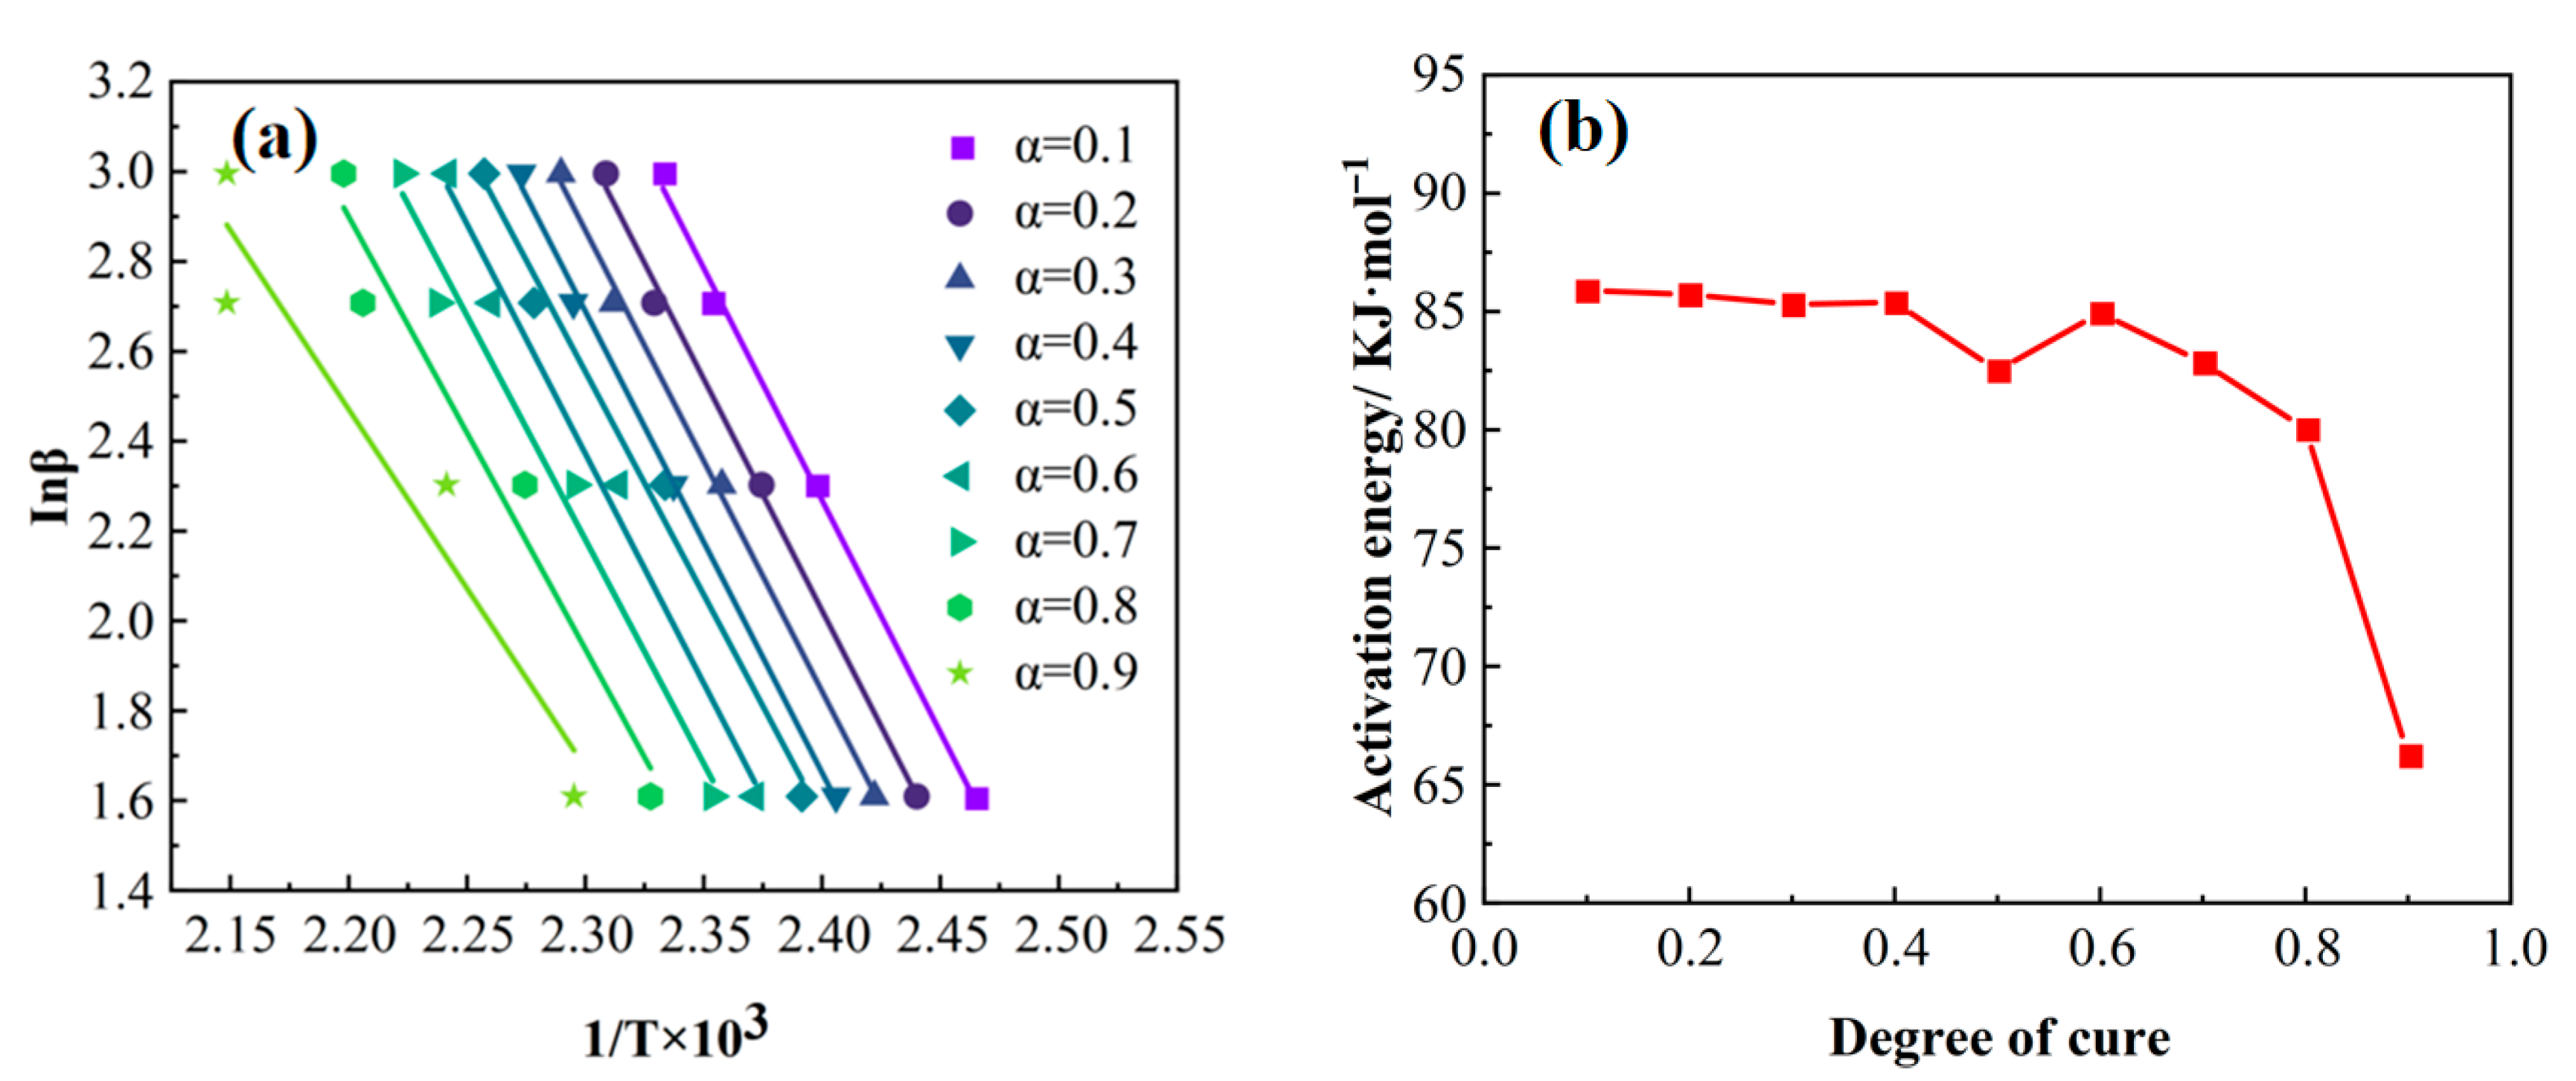
The activation energy (Ea) corresponding to different degrees of cure (α) during the curing process was calculated using the Flynn–Wall–Ozawa (FWO) methods [36]. Figure 6 presents the corresponding linear fitting curves and the variation in the activation energy (Ea) as a function of the degree of cure (α). Analysis revealed a significant change in activation energy when the degree of cure exceeded 0.4. Based on this characteristic variation in Ea, a variable activation energy model—specifically, the modified Sun–Gang model—was selected to describe the curing kinetics of this epoxy resin, whose general form is given by Equation (3) [37].
β d α d T = e x p p 1 + p 2 α + p 3 α 2 + p 4 α 3 e x p p 5 + p 6 α + p 7 α 2 + p 8 α 3 R T α m ( 1 α ) n
where β is the heating rate, d α d T is the curing rate, P1–P8 is the model parameter, R is the universal gas constant, m and n are the reaction order, and T is the thermodynamic temperature.
Using the degree of cure (α) and temperature (T) as independent variables and the curing reaction rate (dα/dt) as the dependent variable, the model parameters were globally optimized and fitted via the particle swarm optimization (PSO) algorithm [38]. The resulting optimal parameters are listed in Table 2.
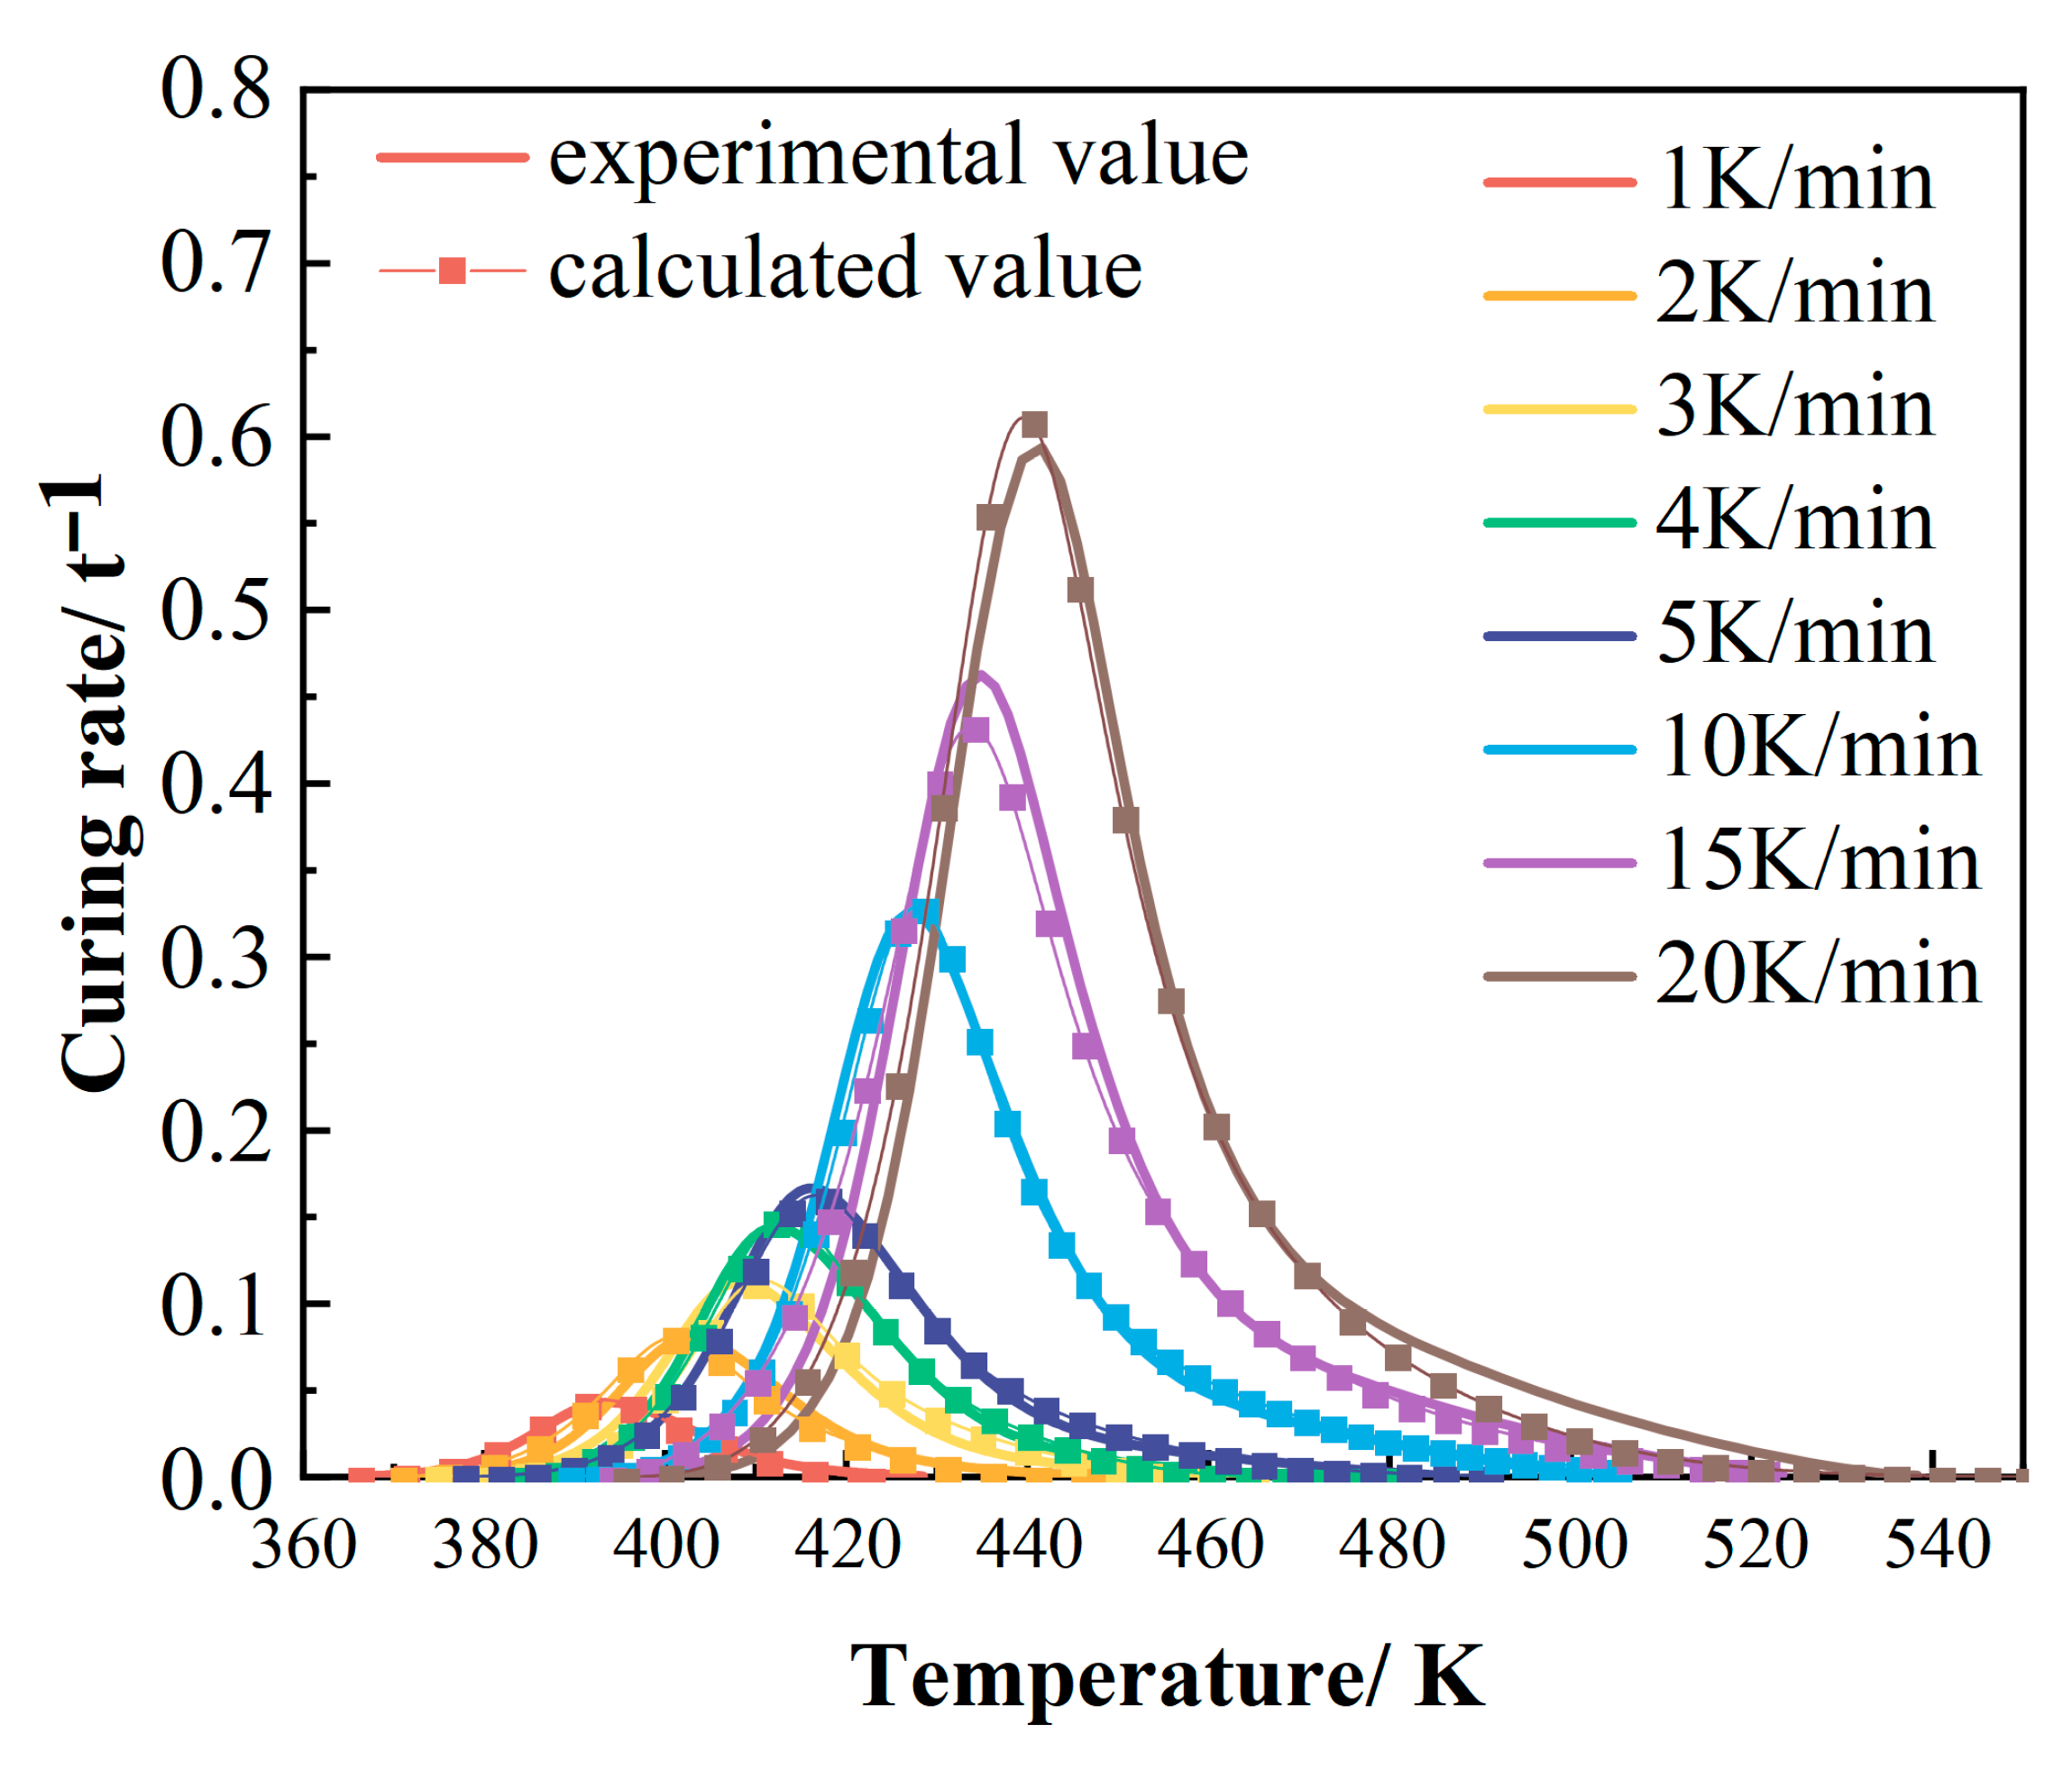
To validate the compatibility of the kinetic model with experimental data, the model-predicted curing reaction rates were compared against the DSC experimental results. As shown in Figure 7, the computational results of the model demonstrate good agreement with the experimental data, indicating high consistency. This confirms that the modified Sun–Gang model accurately describes the curing process of this epoxy resin [39,40].

3.1.2. Isothermal Curing Kinetics Considering the Heating Process

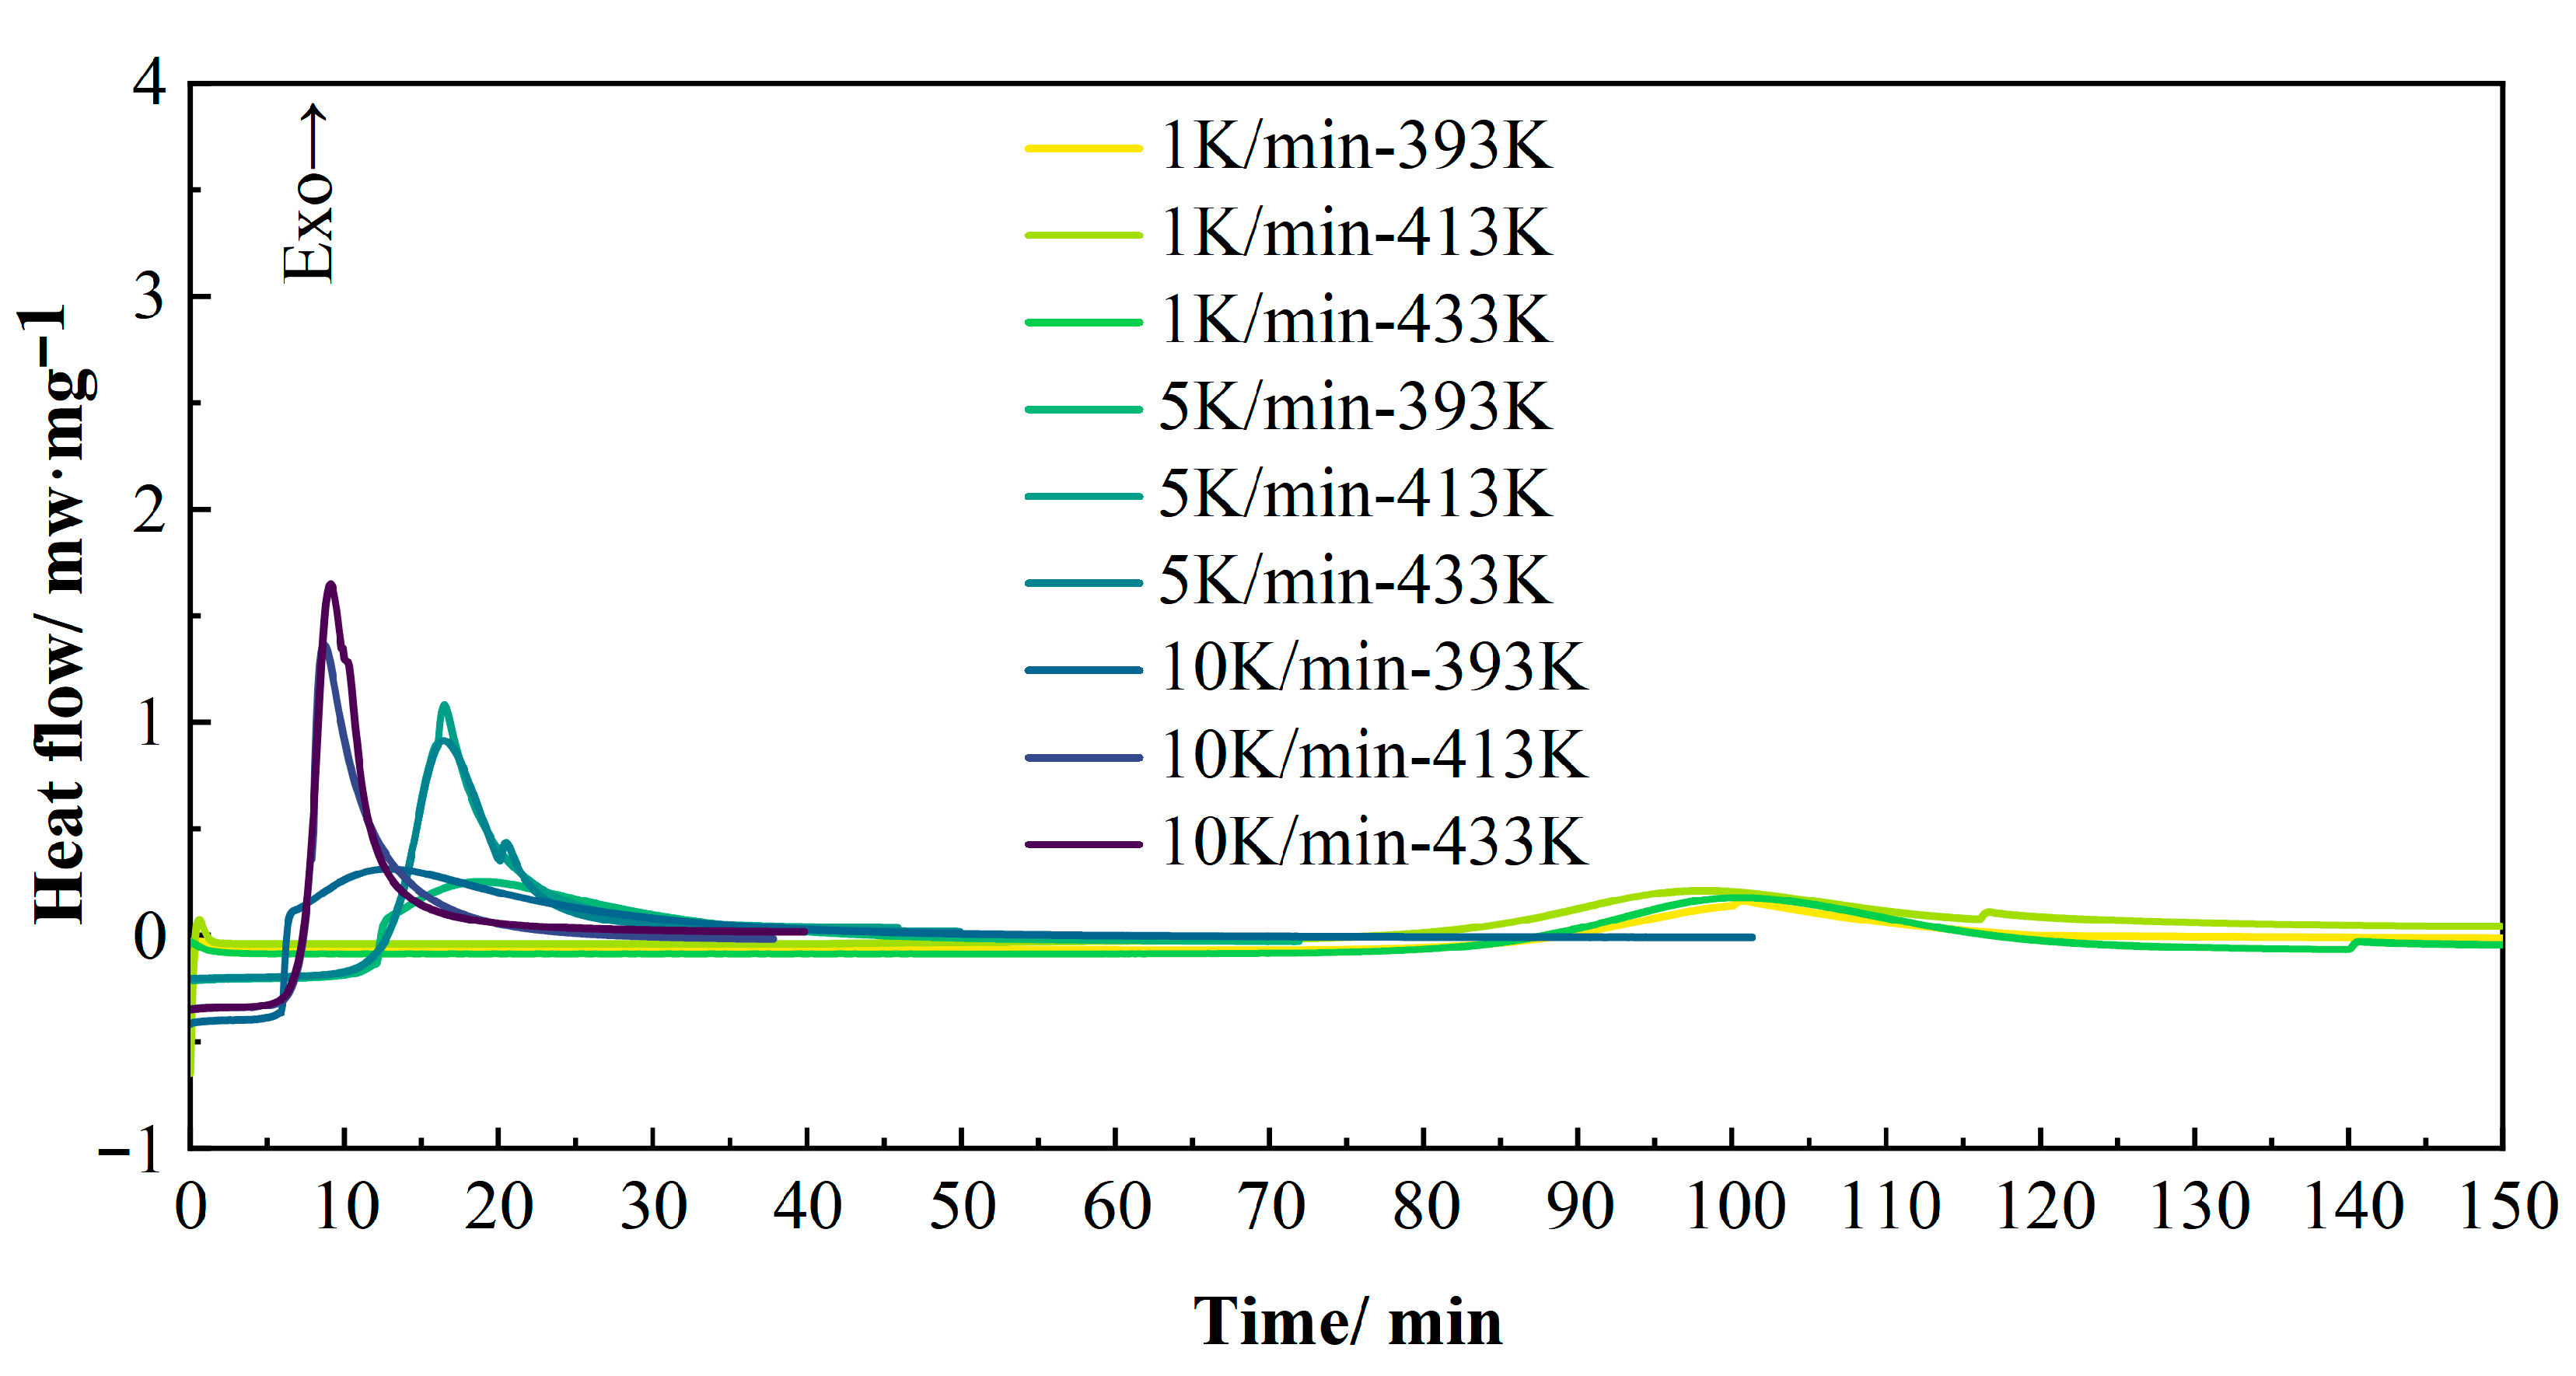
To optimize the curing process and minimize hold time during compression molding, isothermal DSC measurements were conducted by heating samples to temperatures of 393 K, 413 K, and 433 K at rates of 1, 5, and 10 K/min. The samples were held at each temperature for sufficient durations to ensure complete curing. This experiment aimed to evaluate the degree of cure and curing rates, thereby determining the minimum time required for optimal curing and identifying the corresponding temperature/time conditions for near-complete curing. As shown in Figure 8, the overall curing time decreased significantly with increasing heating rates. At higher heating rates (5 and 10 K/min), elevated hold temperatures resulted in intensified exothermic peaks, while the total curing completion time exhibited negligible variation.
The relationship between the degree of cure and time was further obtained from the isothermal DSC curves. Figure 9 shows the α-t curves at different heating rates. At high heating rates (5 and 10 K/min), the total curing time at 393 K was significantly longer than at 413 K and 433 K, while the difference between 413 K and 433 K was negligible. However, at low heating rates, increasing the hold temperature paradoxically extended the total curing time.

3.1.3. Dynamic Versus Isothermal Viscosity Test

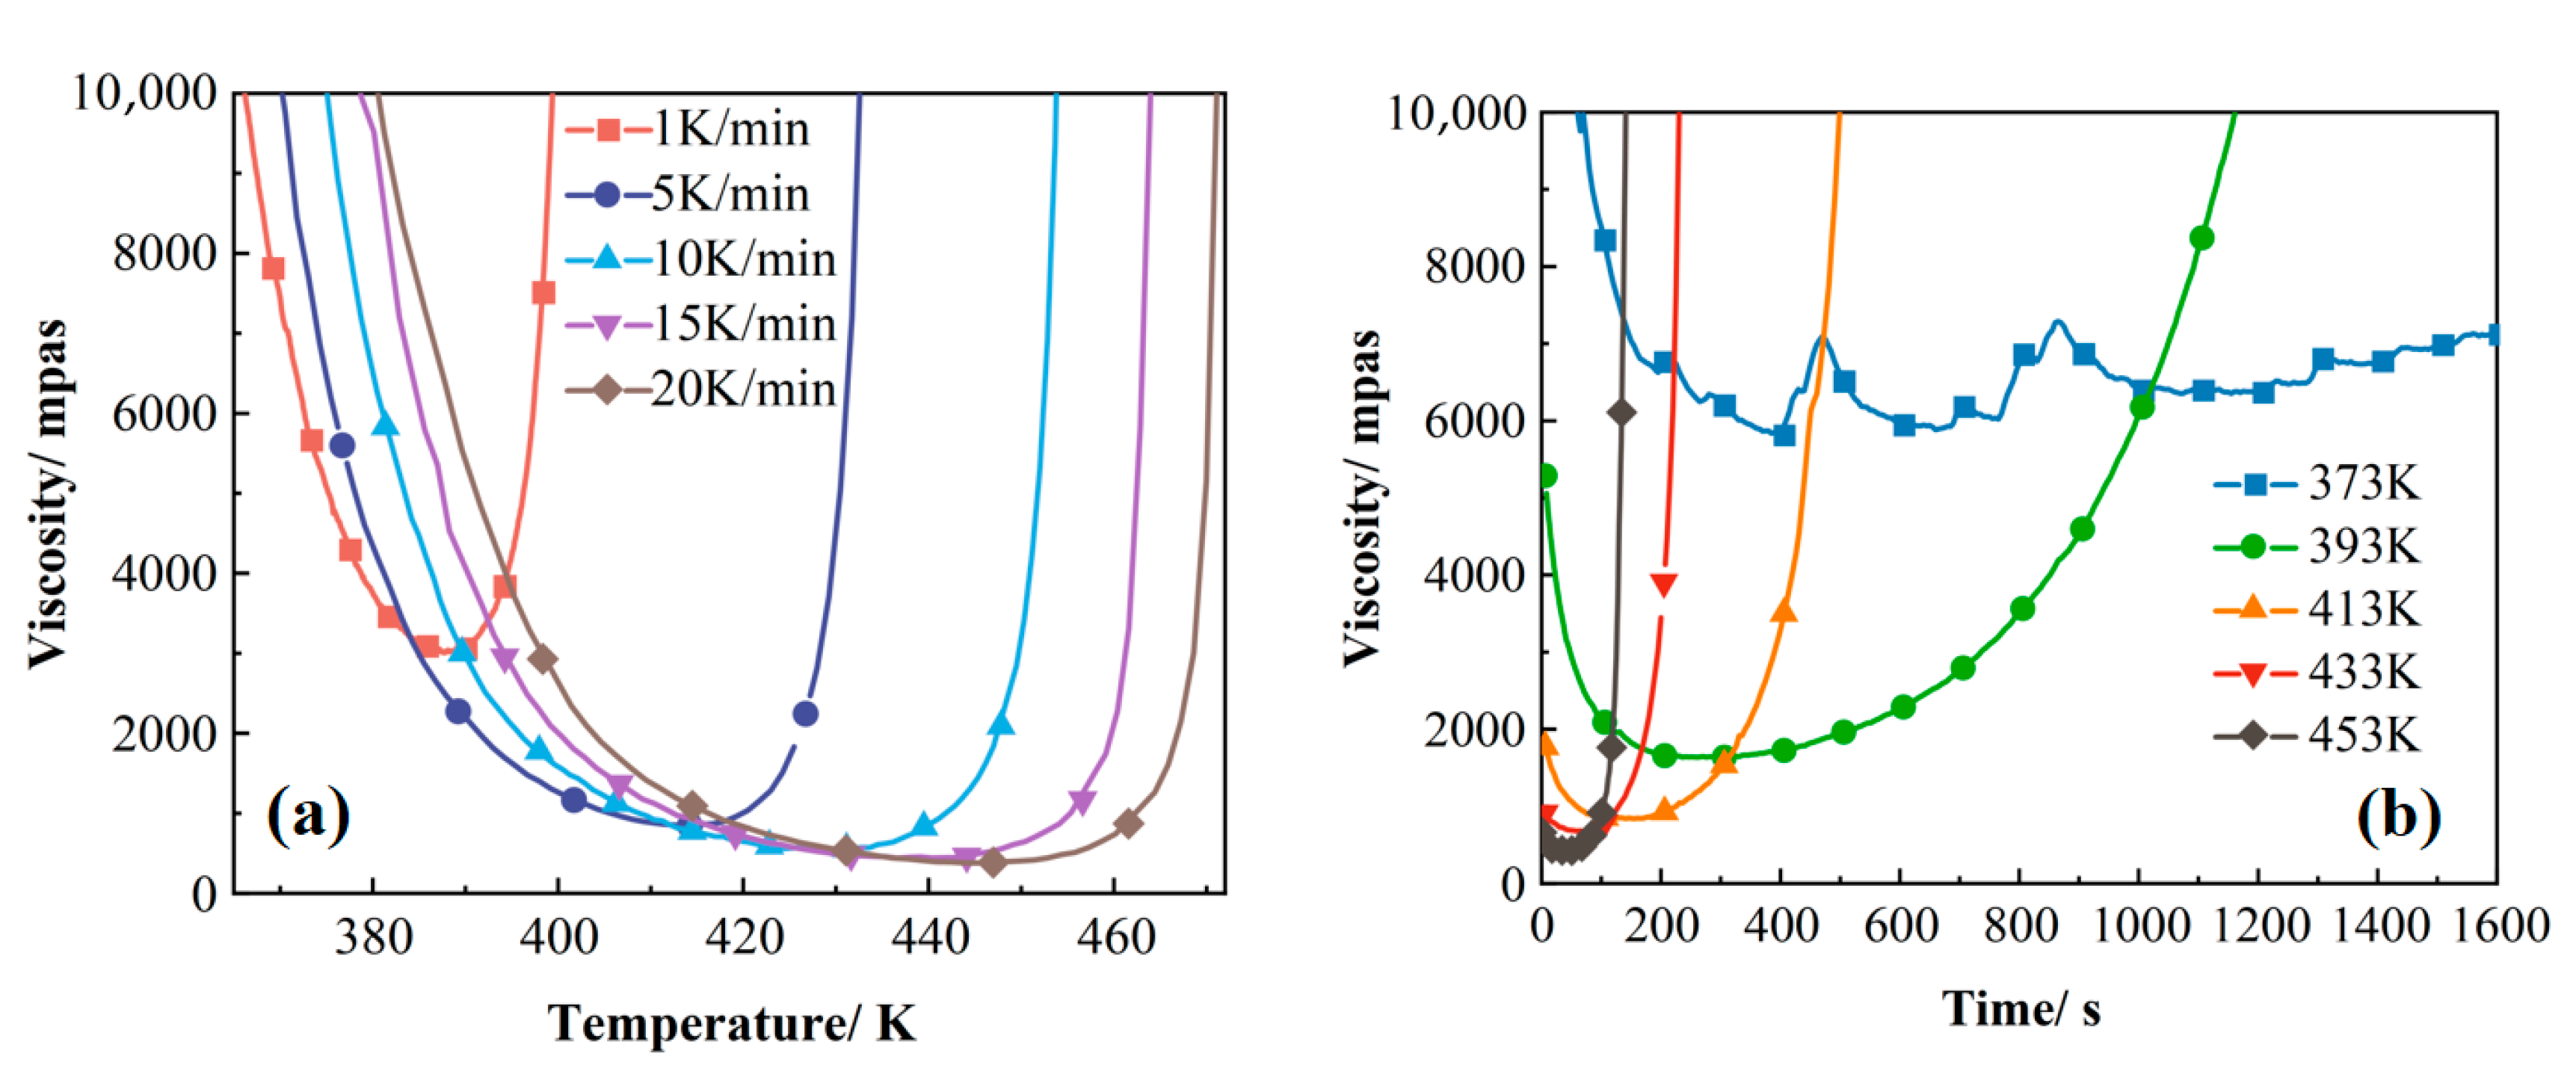
To further validate the curing process, rheological tests were conducted on the 2626 epoxy resin under varying heating rates and hold temperatures, with the results presented in Figure 10. Analysis indicates that the temperature range corresponding to specific rheological states (e.g., gel point) broadens with increasing heating rates, a phenomenon consistent with the peak-shift trend in non-isothermal DSC curves [41]. This fundamentally stems from intensified thermal hysteresis at higher heating rates, causing increased lag between actual sample temperature and the programmed temperature. Concurrently, the minimum viscosity decreases significantly with elevated heating rates due to synergistic control of viscosity evolution by chemical reactions (crosslink network formation) and viscous flow (enhanced molecular/segment mobility from weakened intermolecular forces at higher temperatures). At rapid heating rates, these mechanisms exhibit asymmetric competition: accelerated heating delays crosslinking, preserving more unreacted monomers/oligomers at elevated temperatures, thereby prolonging the viscous flow-dominated stage and further reducing minimum viscosity—a trend aligning with the literature reports. At fixed heating rates, increased hold temperatures substantially shorten the duration of low-viscosity states (processing window) and accelerate viscosity rise, primarily because the temperature-enhanced curing kinetics outweighs its viscosity-reducing effect. These rheological patterns (minimum viscosity variation, processing window modulation) provide critical guidance for optimizing compression molding in diverse applications, such as manufacturing large or geometrically complex components.

3.2. Curing Cycle Optimization Analysis

3.2.1. Process Orthogonal Experiment Optimization

Curing process parameters—heating rate, hold temperature, and hold time—significantly influence the compression molding of T700/2626 epoxy composites. Consequently, this study established an orthogonal experimental design with these three factors as variables to optimize the curing cycle. A three-factor, three-level orthogonal array was designed, with factors and levels provided in Table 3. Composite mechanical properties served as evaluation metrics. The optimal curing cycle was selected based on experimental results [42]. Specific experimental designs and outcomes are presented in Table 4 (where K1, K2, and K3 denote the summed values of mechanical properties across all combinations for each corresponding level; for example, K1 represents the total ILSS value when the heating rate is 1 K/min under all associated conditions; lowercase k1, k2, and k3 indicate the average values of K1, K2, and K3, respectively; the R-value reflects the range of k-values) [43].
To mitigate the influence of porosity variations in composite materials—caused by factors such as layup processes and incomplete curing—on mechanical properties, metallographic methods were employed to examine samples from different regions of the molded composites, thereby evaluating the porosity of each experimental group. Figure 11 presents metallographic micrographs of the MRCC and orthogonal experimental groups, with pore area fraction analyzed using Image Pro Plus 6.0 software. The results indicate that all porosity values fall within the range of 0.3–0.4%, well below the 1% threshold deemed acceptable in aerospace-grade manufacturing standards [44]. Experimental observations confirm minimal variation in porosity levels, with a maximum deviation of merely 0.13%, resulting in consistently negligible impact on interlaminar strength performance [45,46].
Figure 12 presents the interlaminar shear strength (ILSS) results of CFRP under different curing parameters. Specimens processed with lower hold temperature and shorter hold time exhibited significantly reduced ILSS (62.88 MPa), showing a marked deviation from the 90.88 MPa achieved under MRCC conditions. In orthogonal testing, the significant variations between experimental groups indicate that process parameters significantly influence curing behavior and mechanical properties.
Based on the L9 (33) orthogonal experimental design, the main effects of heating rate (A), curing temperature (B), and dwell time (C) on the interlaminar shear strength (ILSS) were quantified using range analysis (Table 5). The results show that the significance ranking of the factors is as follows: dwell time (range R = 9.92 MPa) > curing temperature (R = 8.22 MPa) > heating rate (R = 6.52 MPa). This indicates that dwell time is the dominant controlling factor for ILSS. The optimal level combination is as follows: heating rate of 10 K/min (A3), curing temperature of 413 K (B2), and dwell time of 80 min (C3). The predicted ILSS under this combination exceeds 86.15 MPa.

3.2.2. Weighted Scoring for Compression Molding Process

To adapt to compression molding requirements across diverse scenarios and optimize curing cycles according to different needs, this study implemented a weighted scoring method incorporating energy consumption (electricity usage) and cycle time factors [47]. This approach enables rapid comprehensive evaluation for further optimization of curing cycles, enhancing production efficiency while reducing energy consumption. The mechanical properties, energy consumption, and compression molding time are listed in Table 6.
To eliminate dimensional discrepancies among parameters and normalize raw data to the [0,1] range, data standardization was systematically performed [48].
Positive indicators (mechanical properties):
Z p = x i x m i n x m a x x m i n
Negative indicators (total time, energy consumption):
Z N = x m a x x i x m a x x m i n
where Xmax and Xmin represent the maximum and minimum values of each indicator, respectively.
To scientifically quantify the relative importance of each evaluation index, this study uses the Analytic Hierarchy Process (AHP) to determine the weights. Based on expert consultation and literature analysis, an evaluation system with “process parameter optimization” as the goal layer is constructed. The criterion layer includes three core indicators: mechanical properties (C1), curing time (C2), and energy consumption (C3). The 1-9 Saaty scale was used to construct the judgment matrix (Table 7) through pairwise comparisons of criterion layer indicators [49,50,51].
The comprehensive score for each experimental group was calculated using the linear weighting method:
S c o r e i = j = 1 3 w j · z i j
The results are shown in Table 8.
Considering mechanical properties as the primary factor and compression molding time and energy consumption as secondary factors, the optimal curing process route is as follows: heating at 10 K/min to 413 K and holding for 20 min. Under this curing process, compared with the MRCC, the mechanical properties are reduced by 7.35%, the compression molding time is shortened by 71.2%, and the energy consumption is reduced by 35.7%, significantly improving production efficiency. Moreover, this method can be extended to include consideration of resin flowability, thereby better formulating the curing cycle for large-sized components.

4. Conclusions

In this study, the curing kinetics, rheological properties, and ILSS of 2626 epoxy resin and its CFRP were systematically characterized using DSC, a rheometer, and a universal testing machine. The results show that the DSC analysis reveals the curing process is significantly controlled by the heating rate and dwell time. At higher heating rates (5, 10 K/min), when the dwell temperature is set within 393 K to 433 K, the dwell time required to reach the target degree of cure can be shortened by 15 to 35 min. The activation energy of the curing reaction calculated using the FWO method shows significant variation as the degree of cure increases. Rheological analysis monitored the viscosity evolution of the system at three temperature points of 393 K, 413 K, and 433 K. The results show that after holding for about 950 s, 450 s, and 210 s at the above temperatures, respectively, the system viscosity rises sharply. ILSS analysis, based on the orthogonal experimental design, clarifies the influence weight order of the curing process parameters (heating rate, dwell temperature, dwell time) on the interlaminar shear strength of T700/2626 epoxy resin CFRP: dwell time > dwell temperature > heating rate. Using the weighted scoring method, a new curing cycle route was developed for the T700/2626 epoxy resin system. Compared with the MRCC, the optimized process achieved significant comprehensive improvement while ensuring material performance: the interlaminar shear strength was reduced by 7.35% (meeting general product requirements), the total compression molding time was shortened by 71.2%, and the process energy consumption was reduced by 35.7%.

Author Contributions

Conceptualization, X.W. and X.Y.; methodology, X.W.; software, M.Z. and Y.Z.; validation, Z.L. and X.F.; formal analysis, M.Z. and H.L.; investigation, X.W., M.Z. and X.Y.; resources, X.W.; writing—original draft preparation, M.Z., X.W. and X.Y.; writing—review and editing, X.W. All authors have read and agreed to the published version of the manuscript.

Funding

This research was funded by Jiangxi Provincial Natural Science Foundation under Grant No. 20232BAB214008, Jiangxi Province Contract System Pilot Project under Grant No. ZBG20230428005, Nanchang University Innovation Fund under Grant No. XX202506030031, the National Science Foundation of China under Grant No. 52305369, the Project of State Key Laboratory of Precision Manufacturing for Extreme Service Performance under Grant No. Kfkt2022-02, the Gansu Provincial Science and Technology Plan Project under Grant No. 23JRRA859, and Nanchang Major Science and Technology Research Project under Grant No. 2024zdxm018.

Institutional Review Board Statement

Not applicable.

Informed Consent Statement

Not applicable.

Data Availability Statement

The data presented in this study are available on request from the corresponding author.

Acknowledgments

The authors thank Zhan from Central South University for insightful discussions on curing kinetics modeling.

Conflicts of Interest

Authors Zhongling Liu and Xin Fu were employed by the Nanchang Jardine Advanced Composite Material Co., Ltd. The remaining authors declare that the research was conducted in the absence of any commercial or financial relationships that could be construed as potential conflicts of interest.

Abbreviations

The following abbreviations are used in this manuscript:
CFRPCarbon fiber-reinforced polymer
MRCCManufacturer-recommended curing cycle
UV-FPUltraviolet-assisted frontal polymerization
DSCDifferential scanning calorimetry
FWOFlynn–Wall–Ozawa
PSOParticle swarm optimization
ILSSInterlaminar shear strength
AHPAnalytic Hierarchy Process

References

  1. Gutkin, R.; Green, C.J.; Vangrattanachai, S.; Pinho, S.T.; Robinson, P.; Curtis, P.T. On acoustic emission for failure investigation in CFRP: Pattern recognition and peak frequency analyses. Mech. Syst. Signal Process. 2011, 25, 1393–1407. [Google Scholar] [CrossRef]
  2. Friedrich, K.; Almajid, A.A. Manufacturing Aspects of Advanced Polymer Composites for Automotive Applications. Appl. Compos. Mater. 2013, 20, 107–128. [Google Scholar] [CrossRef]
  3. Aamir, M.; Tolouei-Rad, M.; Giasin, K.; Nosrati, A. Recent advances in drilling of carbon fiber-reinforced polymers for aerospace applications: A review. Int. J. Adv. Manuf. Technol. 2019, 105, 2289–2308. [Google Scholar] [CrossRef]
  4. Al-Lami, A.; Hilmer, P.; Sinapius, M. Eco-efficiency assessment of manufacturing carbon fiber reinforced polymers (CFRP) in aerospace industry. Aerosp. Sci. Technol. 2018, 79, 669–678. [Google Scholar] [CrossRef]
  5. Ahmad, F.; Al Awadh, M.; Abas, M.; Noor, S.; Hameed, A. Optimization of Carbon Fiber Reinforced Plastic Curing Parameters for Aerospace Application. Appl. Sci. 2022, 12, 4307. [Google Scholar] [CrossRef]
  6. Gonzalez, J.A.; Farjas, J.; Blanco, N.; Costa, J.; Gascons, M.; Sanchez-Rodriguez, D. Towards time-reduced cure cycles of epoxy resins for mass production of composites maintaining the thermo-mechanical properties. J. Therm. Anal. Calorim. 2025, 150, 1205–1215. [Google Scholar] [CrossRef]
  7. Eom, S.Y.; Seo, S.B.; Lee, K.Y. Study on Cure Behavior of Low Temperature and Fast Cure Epoxy with Mercaptan Hardener. Polym.-Korea 2013, 37, 240–248. [Google Scholar] [CrossRef]
  8. Tarafdar, A.; Lin, W.; Naderi, A.; Wang, X.; Fu, K.; Hosein, I.D.; Wang, Y. UV-induced frontal polymerization for optimized in-situ curing of epoxy resin for excellent tensile and flexural properties. Compos. Commun. 2024, 46, 101832. [Google Scholar] [CrossRef]
  9. Tang, Y.; Fairclough, J.P.A. Electrical curing of carbon fibre composites with conductive epoxy resins. Compos. Part A Appl. Sci. Manuf. 2024, 185, 108296. [Google Scholar] [CrossRef]
  10. Xu, X.; Wang, X.; Cai, Q.; Wang, X.; Wei, R.; Du, S. Improvement of the Compressive Strength of Carbon Fiber/Epoxy Composites via Microwave Curing. J. Mater. Sci. Technol. 2016, 32, 226–232. [Google Scholar] [CrossRef]
  11. Muc, A.; Romanowicz, P.; Chwal, M. Description of the Resin Curing ProcessFormulation and Optimization. Polymers 2019, 11, 127. [Google Scholar] [CrossRef]
  12. de Calbiac, J.; Olivier, P.; Zbed, R.S.; Torres, M.; Broutelle, M.; Destarac, M.; Guerre, M. Assessing the Impact of the Off-Stoichiometric Epoxy/Amine Ratio on the Curing Kinetics and Properties of Space-Grade Disulfide-Based Vitrimer Resins. ACS Appl. Polym. Mater. 2025, 7, 5271–5279. [Google Scholar] [CrossRef]
  13. Farzanehfar, N.; Taheri, A.; Rafiemanzelat, F.; Jazani, O.M. Impact of multi-function SiO2-nanoscale ionic materials on the curing kinetics of epoxy resin: New approach to improve curing characteristics of thermoset polymers. Polym. Compos. 2025, 46, 7858–7881. [Google Scholar] [CrossRef]
  14. Yang, Y.; Lou, C.; Wang, H.; Yu, J. Synthesis and curing kinetics of O-aminoacetophenone-modified dicyandiamide curing agents for epoxy resin. Thermochim. ACTA 2025, 747, 179963. [Google Scholar] [CrossRef]
  15. Zeng, Z.; Zhao, T.; Gong, Y.; Yu, Z. Synthesis, curing kinetics and properties of novel aromatic multifunctional epoxy resin. Eur. Polym. J. 2024, 219, 113375. [Google Scholar] [CrossRef]
  16. Jia, H.L.; Zhu, Y.D.; Yan, C.; Chen, M.D.; Chen, G.; Liu, D. Reliability evaluation of a new method developed for DSC curing kinetic model of epoxy resin. J. Appl. Polym. Sci. 2023, 140, e53986. [Google Scholar] [CrossRef]
  17. Yan, S.; Verestek, W.; Zeizinger, H.; Schmauder, S. Characterization of Cure Behavior in Epoxy Using Molecular Dynamics Simulation Compared with Dielectric Analysis and DSC. Polymers 2021, 13, 3085. [Google Scholar] [CrossRef] [PubMed]
  18. Ma, Z.; Qi, L.; He, W.; He, L. A novel approach on the study of cure kinetics for rheological isothermal and non-isothermal methods. Compos. Part B Eng. 2019, 162, 242–249. [Google Scholar] [CrossRef]
  19. GB/T 30969-2014; Test Method for Short-Beam Shear Strength of Polymer Matrix Composite Materials. General Administration of Quality Supervision, Inspection and Quarantine of the People’s Republic of China: Beijing, China, 2014.
  20. Yang, X.; Zhan, L.; Jiang, C.; Zhao, X.; Guan, C.; Chang, T. Evaluating random vibration assisted vacuum processing of carbon/epoxy composites in terms of interlaminar shear strength and porosity. J. Compos. Mater. 2019, 53, 2367–2376. [Google Scholar] [CrossRef]
  21. Monticeli, F.M.; Montoro, S.R.; Voorwald, H.J.C.; Cioffi, M.O.H. Porosity Characterization of Carbon Fiber/Epoxy Composite Using Hg Porosimetry and Other Techniques. Polym. Eng. Sci. 2020, 60, 841–849. [Google Scholar] [CrossRef]
  22. Monticeli, F.M.; Ornaghi, H.L.; Voorwald, H.J.C.; Cioffi, M.O.H. Three-dimensional porosity characterization in carbon/glass fiber epoxy hybrid composites. Compos. Part A Appl. Sci. Manuf. 2019, 125, 105555. [Google Scholar] [CrossRef]
  23. Zhang, J.; Xu, Y.C.; Huang, P. Effect of cure cycle on curing process and hardness for epoxy resin. Express Polym. Lett. 2009, 3, 534–541. [Google Scholar] [CrossRef]
  24. Zhang, F.; Zhang, L.; Guo, X.; Cai, Z.; Huang, K. Study on curing kinetics of epoxy system and DFT simulation. J. Therm. Anal. Calorim. 2023, 148, 11069–11079. [Google Scholar] [CrossRef]
  25. Hardis, R.Z. Cure Kinetics Characterization and Monitoring of an Epoxy Resin for Thick Composite Structures. Master’s Thesis, Iowa State University, Ames, IA, USA, 2012. [Google Scholar]
  26. Liang, J.; Liu, L.; Qin, Z.; Zhao, X.; Li, Z.; Emmanuel, U.; Feng, J. Experimental Study of Curing Temperature Effect on Mechanical Performance of Carbon Fiber Composites with Application to Filament Winding Pressure Vessel Design. Polymers 2023, 15, 982. [Google Scholar] [CrossRef] [PubMed]
  27. Corcione, C.E.; Freuli, F.; Frigione, M. Cold-Curing Structural Epoxy Resins: Analysis of the Curing Reaction as a Function of Curing Time and Thickness. Materials 2014, 7, 6832–6842. [Google Scholar] [CrossRef]
  28. Puhurcuoglu, N.; Arman, Y. Parameter estimation of epoxy resin cure kinetics by dynamics DSC data. Polym. Adv. Technol. 2024, 35, e6498. [Google Scholar] [CrossRef]
  29. Tao, R.; Phansalkar, S.P.; Forster, A.M.; Han, B. Investigation of Cure Kinetics of Advanced Epoxy Molding Compound Using Dynamic Heating Scan: An Overlooked Second Reaction. In Proceedings of the 2023 IEEE 73rd Electronic Components and Technology Conference, ECTC, Orlando, FL, USA, 30 May–2 June 2023; pp. 1319–1326. [Google Scholar]
  30. Marotta, A.; Faggio, N.; Brondi, C. Curing Kinetics of Bioderived Furan-Based Epoxy Resins: Study on the Effect of the Epoxy Monomer/Hardener Ratio. Polymers 2022, 14, 5322. [Google Scholar] [CrossRef]
  31. Wu, F.; Zhou, X.; Yu, X. Reaction mechanism, cure behavior and properties of a multifunctional epoxy resin, TGDDM, with latent curing agent dicyandiamide. RSC Adv. 2018, 8, 8248–8258. [Google Scholar] [CrossRef] [PubMed]
  32. Korotkov, R.; Shutov, V.; Orlov, A.; Bornosuz, N.; Kulemza, D.; Onuchin, D.; Shcherbina, A.; Gorbunova, I.; Sirotin, I. The Kinetic Study of the Influence of Common Modifiers on the Curing Process of Epoxy Vitrimers. Polymers 2024, 16, 392. [Google Scholar] [CrossRef]
  33. Anagwu, F.I.; Skordos, A.A. Cure kinetics, glass transition advancement and chemo-rheological modelling of an epoxy vitrimer based on disulphide metathesis. Polymer 2023, 288, 126427. [Google Scholar] [CrossRef]
  34. Bernath, A.; Kaerger, L.; Henning, F. Accurate Cure Modeling for Isothermal Processing of Fast Curing Epoxy Resins. Polymers 2016, 8, 390. [Google Scholar] [CrossRef] [PubMed]
  35. Xu, H.; Fang, Y.; Zhou, A.; Jiang, P.; Shu, S.; Chen, L.; Wang, S.; Wei, L. Curing Kinetics and Mechanism Research of E44/T31 Insulation Paint. Mater. Sci.-Medzg. 2019, 25, 478–484. [Google Scholar] [CrossRef]
  36. Zheng, T.; Wang, X.; Lu, C.; Zhang, X.; Ji, Y.; Bai, C.; Chen, Y.; Qiao, Y. Studies on Curing Kinetics and Tensile Properties of Silica-Filled Phenolic Amine/Epoxy Resin Nanocomposite. Polymers 2019, 11, 680. [Google Scholar] [CrossRef] [PubMed]
  37. Liu, Z.; Wang, H.; Chen, Y.; Kang, G.; Hua, L.; Feng, J. Study on Curing Kinetics and the Mechanism of Ultrasonic Curing of an Epoxy Adhesive. Polymers 2022, 14, 512. [Google Scholar] [CrossRef]
  38. Ren, Y.; Zhang, Y.; Meng, Q.; Zhang, L. Hyperspectral Image Classification based on Multiple Improved Particle Swarm Cooperative Optimization and SVM. In Proceedings of the 2012 21st International Conference on Pattern Recognition (ICPR 2012), Tsukuba, Japan, 11–15 November 2012; pp. 2274–2277. [Google Scholar]
  39. Politi, M.; Breuer, O.; Cohen, Y. Simulation and Experimental Validation of the Cure Process of an Epoxy-Based Encapsulant. Exp. Mech. 2023, 63, 1429–1444. [Google Scholar] [CrossRef]
  40. Wu, X.; Zhan, L.; Li, S.; Li, W. Study on the Cure Kinetics of Epoxy Resin Prepreg in Fiber Metal Laminates. In Proceedings of the 2016 International Conference on Biomaterials, Nanomaterials and Composite Materials (CBNCM 2016), Chengdu, China, 4–6 November 2016. [Google Scholar]
  41. Zhang, S.; Tang, H.; Tang, D.; Liu, T.; Liao, W. Effect of fabrication process on the microstructure and mechanical performance of carbon fiber reinforced PEEK composites via selective laser sintering. Compos. Sci. Technol. 2024, 246, 110396. [Google Scholar] [CrossRef]
  42. Davies, L.W.; Day, R.J.; Bond, D.; Nesbitt, A.; Ellis, J.; Gardon, E. Effect of cure cycle heat transfer rates on the physical and mechanical properties of an epoxy matrix composite. Compos. Sci. Technol. 2007, 67, 1892–1899. [Google Scholar] [CrossRef]
  43. Seretis, G.; Kouzilos, G.; Manolakos, D.; Provatidis, C. Multi-Objective Curing Cycle Optimization for Glass Fabric/Epoxy Composites Using Poisson Regression and Genetic Algorithm. Mater. Res. Ibero-Am. J. Mater. 2018, 21, e20170815. [Google Scholar] [CrossRef]
  44. Yang, X.; Zhan, L.; Jiang, C.; Zhao, X.; Guan, C. Effect of random vibration processing on void content in composite laminates. Polym. Compos. 2019, 40, 3122–3130. [Google Scholar] [CrossRef]
  45. Ashir, M.; Nocke, A.; Bulavinov, A.; Pinchuk, R.; Cherif, C. Influence of Defined Amount of Voids on the Mechanical Properties of Carbon Fiber-Reinforced Plastics. Polym. Compos. 2019, 40, E1049–E1056. [Google Scholar] [CrossRef]
  46. Shi, J.; Wang, W.; Liu, F.; Xun, G.; Yang, P. Effects of porosity on ultrasonic attenuation coefficient, shear properties and failure mechanisms of CF/EP laminates. Heliyon 2024, 10, e25288. [Google Scholar] [CrossRef] [PubMed]
  47. Oktora, D.; Ting, Y.-H.; Sukoyo. Multi-Objective Optimization of Injection Parameters and Energy Consumption Based on ANN-Differential Evolution. Appl. Sci. 2025, 15, 826. [Google Scholar] [CrossRef]
  48. Li, F.; Chu, M.; Tang, J.; Feng, C. Optimization of High Chromium Vanadium-Titanium Magnetite Electric Melting Process by Comprehensive Weighted Scoring Method. J. Northeast. Univ. Nat. Sci. 2016, 37, 1327–1331. [Google Scholar]
  49. Dhurkari, R.K. Improving the Prescriptive Power of Analytic Hierarchy Process. IEEE Trans. Eng. Manag. 2023, 71, 7456–7466. [Google Scholar] [CrossRef]
  50. Moragues, S.; Lenzano, M.G.; Lanfri, M.; Moreiras, S.; Lannutti, E.; Lenzano, L. Analytic hierarchy process applied to landslide susceptibility mapping of the North Branch of Argentino Lake, Argentina. Nat. Hazards 2021, 105, 915–941. [Google Scholar] [CrossRef]
  51. Li, Z.-R.; Jiang, M.-G.; Feng, X.-L.; Wang, S.-Y.; Zeng, Q.-T.; Chen, C.; Liu, W.-L.; Sun, W. Analysis of energy consumption characteristics and fracture characteristics of moraine grouting solidified body under uniaxial compression. Front. Earth Sci. 2023, 11, 1223785. [Google Scholar] [CrossRef]
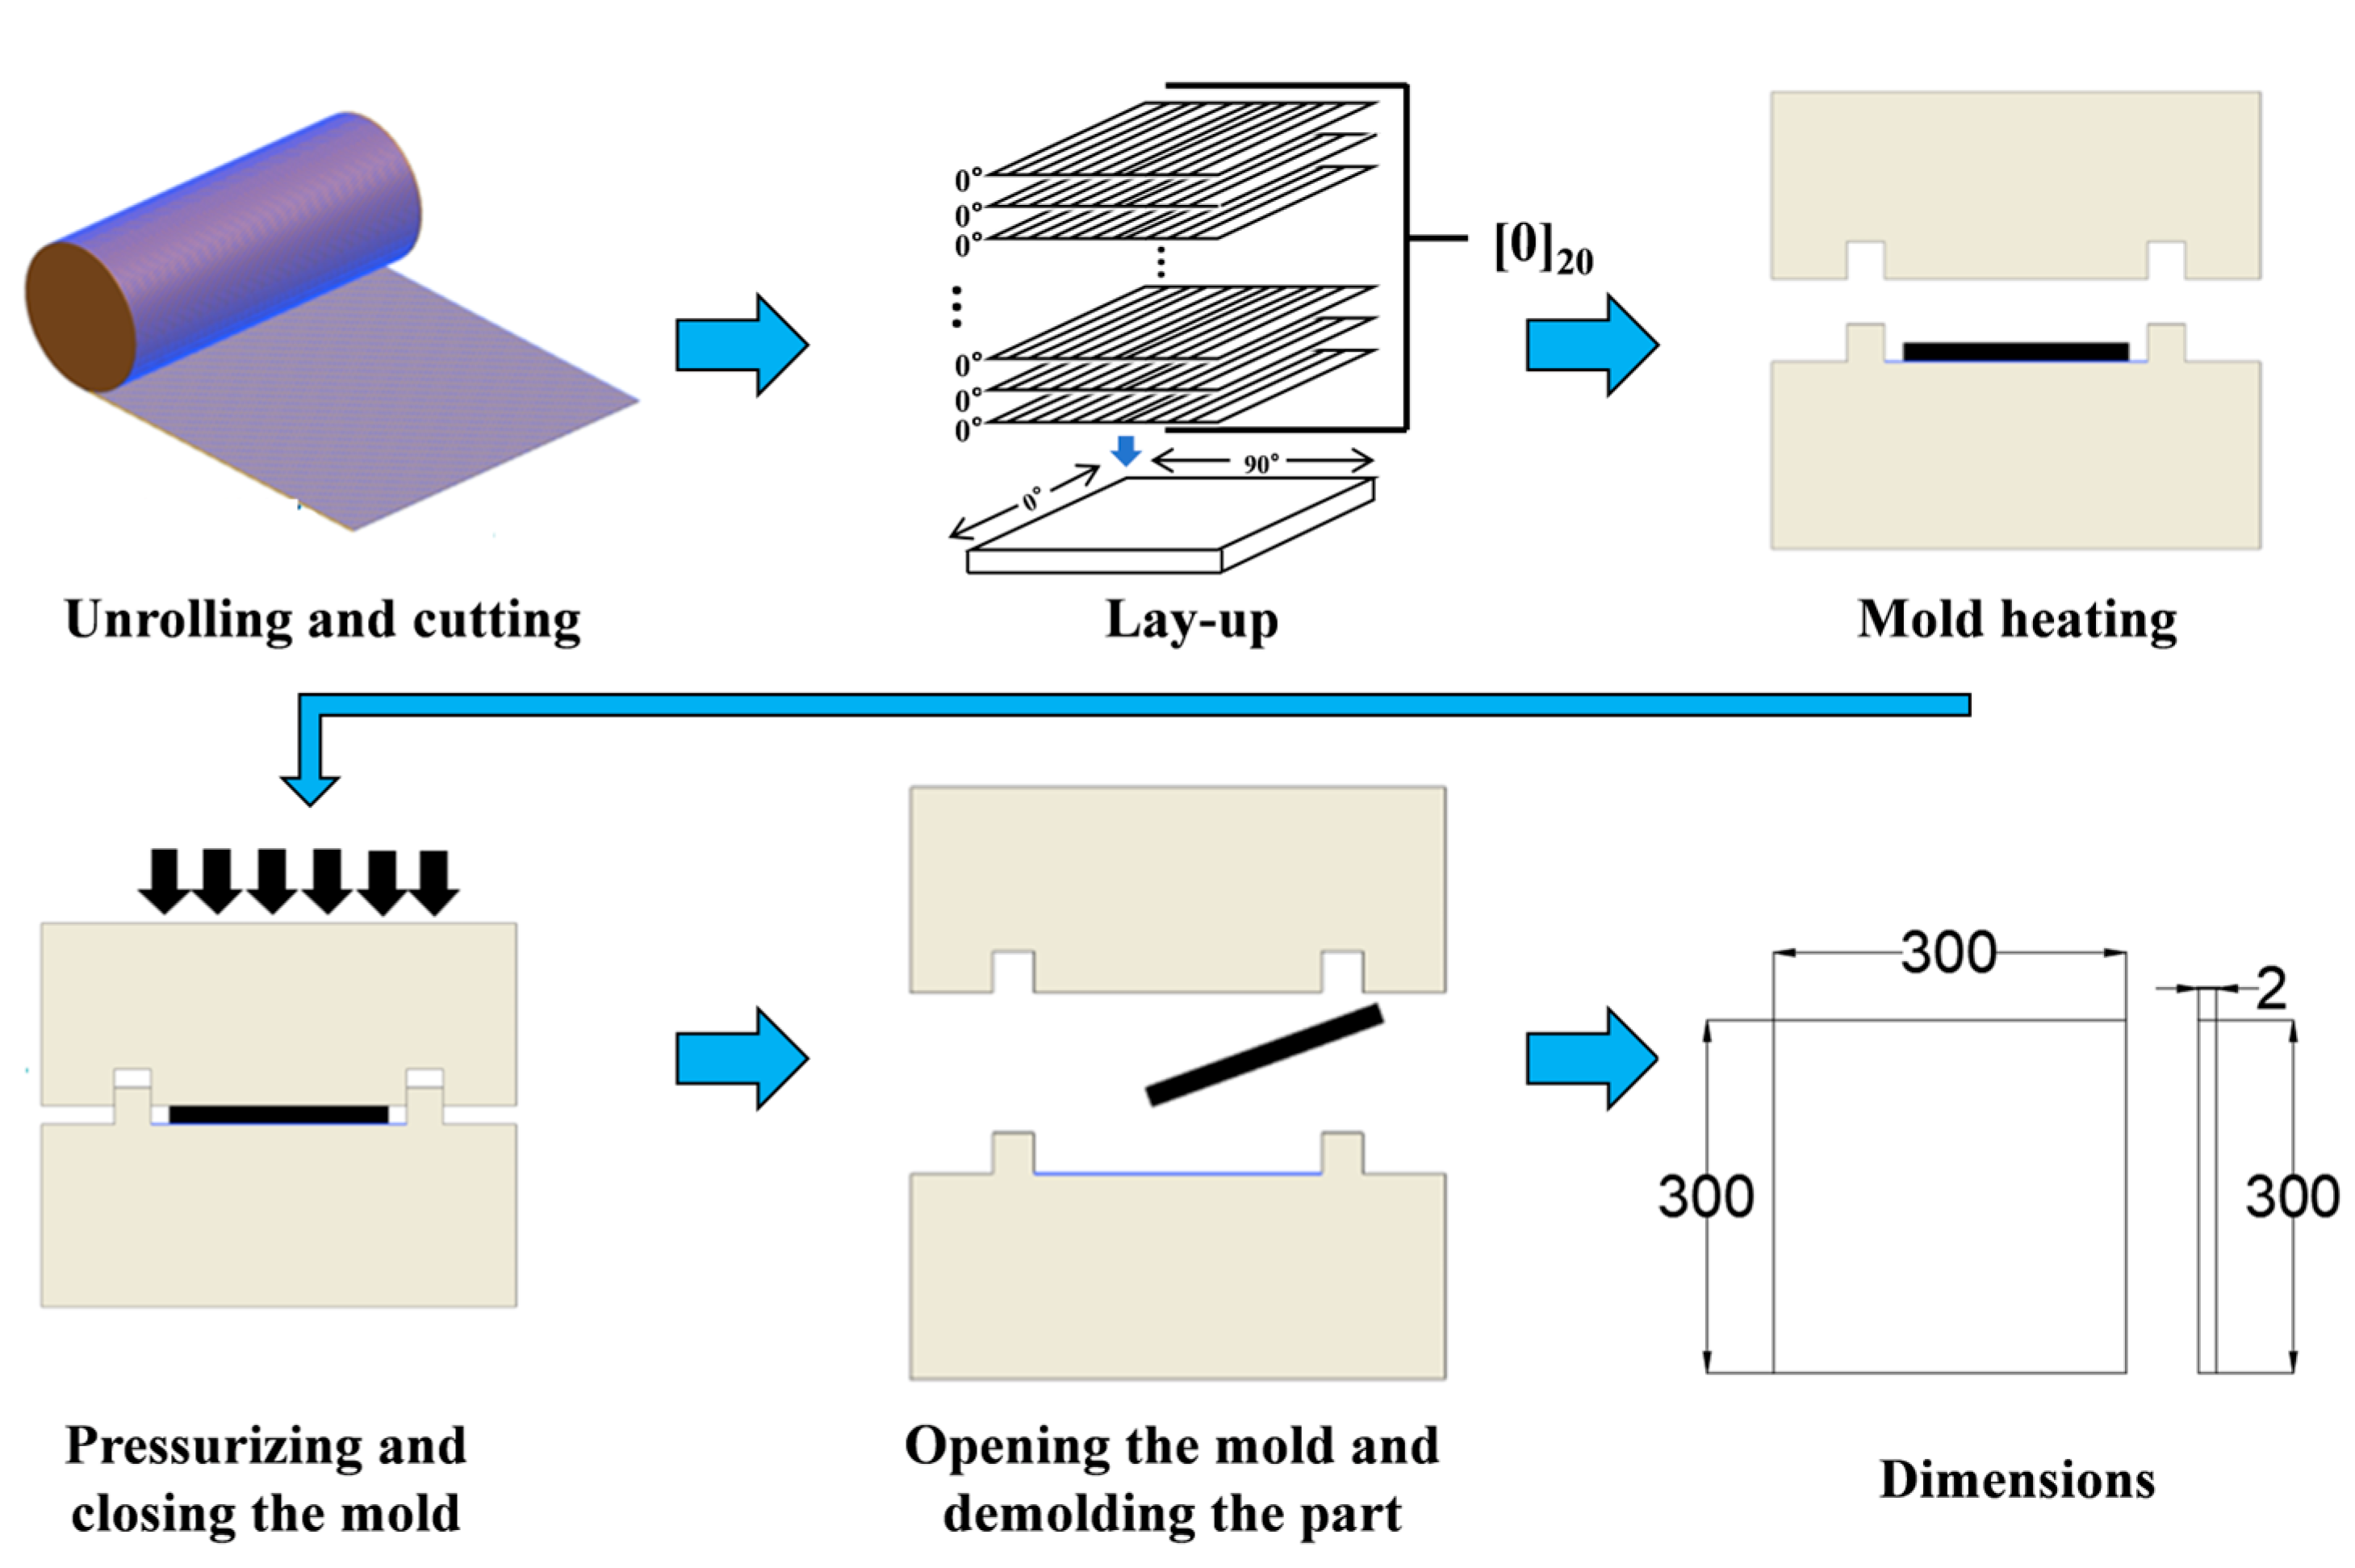
Figure 1. Schematic diagram of compression molding.
Polymers 17 02154 g001
Figure 2. A schematic of the short beam three-point bending test.
Polymers 17 02154 g002
Figure 3. Dynamic DSC curves of epoxy resin at different heating rates.
Polymers 17 02154 g003
Figure 4. Extrapolation curves of curing temperature for the resin.
Polymers 17 02154 g004
Figure 5. (a) Curves of the relationship between degree of cure and temperature at different heating rates; (b) curves of the relationship between reaction rate and degree of cure.
Polymers 17 02154 g005
Figure 6. (a) FWO method fitting curves for resin at different degrees of cure; (b) variation in resin activation energy with degree of cure (FWO method).
Polymers 17 02154 g006
Figure 7. Comparison curves of experimental and calculated values of dα/dT~T at different heating rates.
Polymers 17 02154 g007
Figure 8. Isothermal DSC curves at different heating rates.
Polymers 17 02154 g008
Figure 9. α-t curves from isothermal DSC at various heating rates (showing the degree of cure versus time).
Polymers 17 02154 g009
Figure 10. (a) Viscosity variation curves at different heating rates; (b) viscosity variation curves at different temperatures.
Polymers 17 02154 g010
Figure 11. Metallographic micrograph of the composite material after compression molding: (a) 0-MRCC; (b) 1-A1B1C1; (c) 2-A1B2C2; (d) 3-A1B3C3; (e) 4-A2B1C2; (f) 5-A2B2C3; (g) 6-A2B3C1; (h) 7-A3B1C3; (i) 8-A3B2C1; (j) 9-A3B3C2.
Polymers 17 02154 g011
Figure 12. ILSS of CFRP under different curing process parameters.
Polymers 17 02154 g012
Table 1. Thermodynamic parameters of non-isothermal DSC scans for the resin at different heating rates.
Heating Rate (K/min)Ti (K)Tp (K)Tf (K)∆HR (J/g)
1371.06394.29422.105.52
2380.63403.15437.0610.06
3382.37408.45441.5314.67
4386.53412.10446.6722.45
5398.35416.15440.4528.80
10409.85427.95449.9564.72
15416.15435.85457.8594.84
20419.15441.15464.05124.58
Table 2. Kinetic parameters and correlation coefficients of the modified Sun–Gang variable activation energy model.
A (min−1)Energy (KJ/mol)Order of Reaction
P1 = 18.25P5 = 62.67m = 0.546
P2 = 3.29P6 = 9.58
P3 = −1.26P7 = 0.53n = 1.192
P4 = −0.08P8 = 3.84
Table 3. Orthogonal experiment table with 3 factors, 3 levels, and 9 experimental groups.
LevelA Heating Rate (K/min)B Temperature (K)C Time (min)
1139320
2541350
31043380
Table 4. Results of the orthogonal experiment.
ExperimentHeating Rate (K/min)Temperature (K)Holding Time (min)Interlaminar Shear Strength (MPa)
0-MRCC139312090.88 ± 2.11
1-A1B1C113932062.28 ± 4.15
2-A1B2C214135084.36 ± 2.90
3-A1B3C314338085.71 ± 2.68
4-A2B1C253935083.33 ± 2.95
5-A2B2C354138086.15 ± 3.05
6-A2B3C154332080.08 ± 2.54
7-A3B1C3103938084.45 ± 2.64
8-A3B2C1104132084.20 ± 2.38
9-A3B3C2104335083.26 ± 2.31
Table 5. Factor analysis table.
FactorHeating Rate (K/min)Temperature (K)Time (min)
K1232.35230.06226.56
K2249.56254.71250.95
K3251.91249.05256.31
k177.4576.6975.52
k283.1984.9083.65
k383.9783.0285.44
R6.528.229.92
C > B > A
Table 6. Mechanical properties, energy consumption (electricity usage), and compression molding time.
ExperimentInterlaminar Shear Strength (MPa)Total Time (min)Power Consumption (kWh)
MRCC90.88 ± 2.112502.10
1-A1B1C162.28 ± 4.151501.20
2-A1B2C284.36 ± 2.902101.65
3-A1B3C385.71 ± 2.682702.10
4-A2B1C283.33 ± 2.951001.50
5-A2B2C386.15 ± 3.051441.95
6-A2B3C180.08 ± 2.54981.50
7-A3B1C384.45 ± 2.641201.80
8-A3B2C184.20 ± 2.38721.35
9-A3B3C283.26 ± 2.311141.80
Table 7. Criterion layer judgment matrix.
C1C2C3
C1135
C21/312
C31/51/21
The weight vector calculated using the eigenvector method is W = [0.63,0.26,0.11]. Consistency check:   C I = λ m a x n / n 1 = 0.02 ,   C R = C I / R I = 0.03 < 0.1 (Passing).
Table 8. Calculation results and ranking of comprehensive scores.
ExperimentMechanical Property (Score)Total Time (Score)Energy Consumption (Score)Synthesis ScoreRanking
MRCC1.000.100.000.667
1-A1B1C10.000.611.000.2710
2-A1B2C20.770.300.500.628
3-A1B3C30.820.000.000.529
4-A2B1C20.740.860.670.762
5-A2B2C30.830.640.170.714
6-A2B3C10.620.870.670.696
7-A3B1C30.780.760.330.723
8-A3B2C10.771.000.830.831
9-A3B3C20.730.790.330.705
Disclaimer/Publisher’s Note: The statements, opinions and data contained in all publications are solely those of the individual author(s) and contributor(s) and not of MDPI and/or the editor(s). MDPI and/or the editor(s) disclaim responsibility for any injury to people or property resulting from any ideas, methods, instructions or products referred to in the content.