
Impact of Adverse Mobility Ratio on Oil Mobilization by Polymer Flooding

 , , and
Abstract
1. Introduction
2. Materials and Methods
2.1. Fluids
2.2. Porous Medium
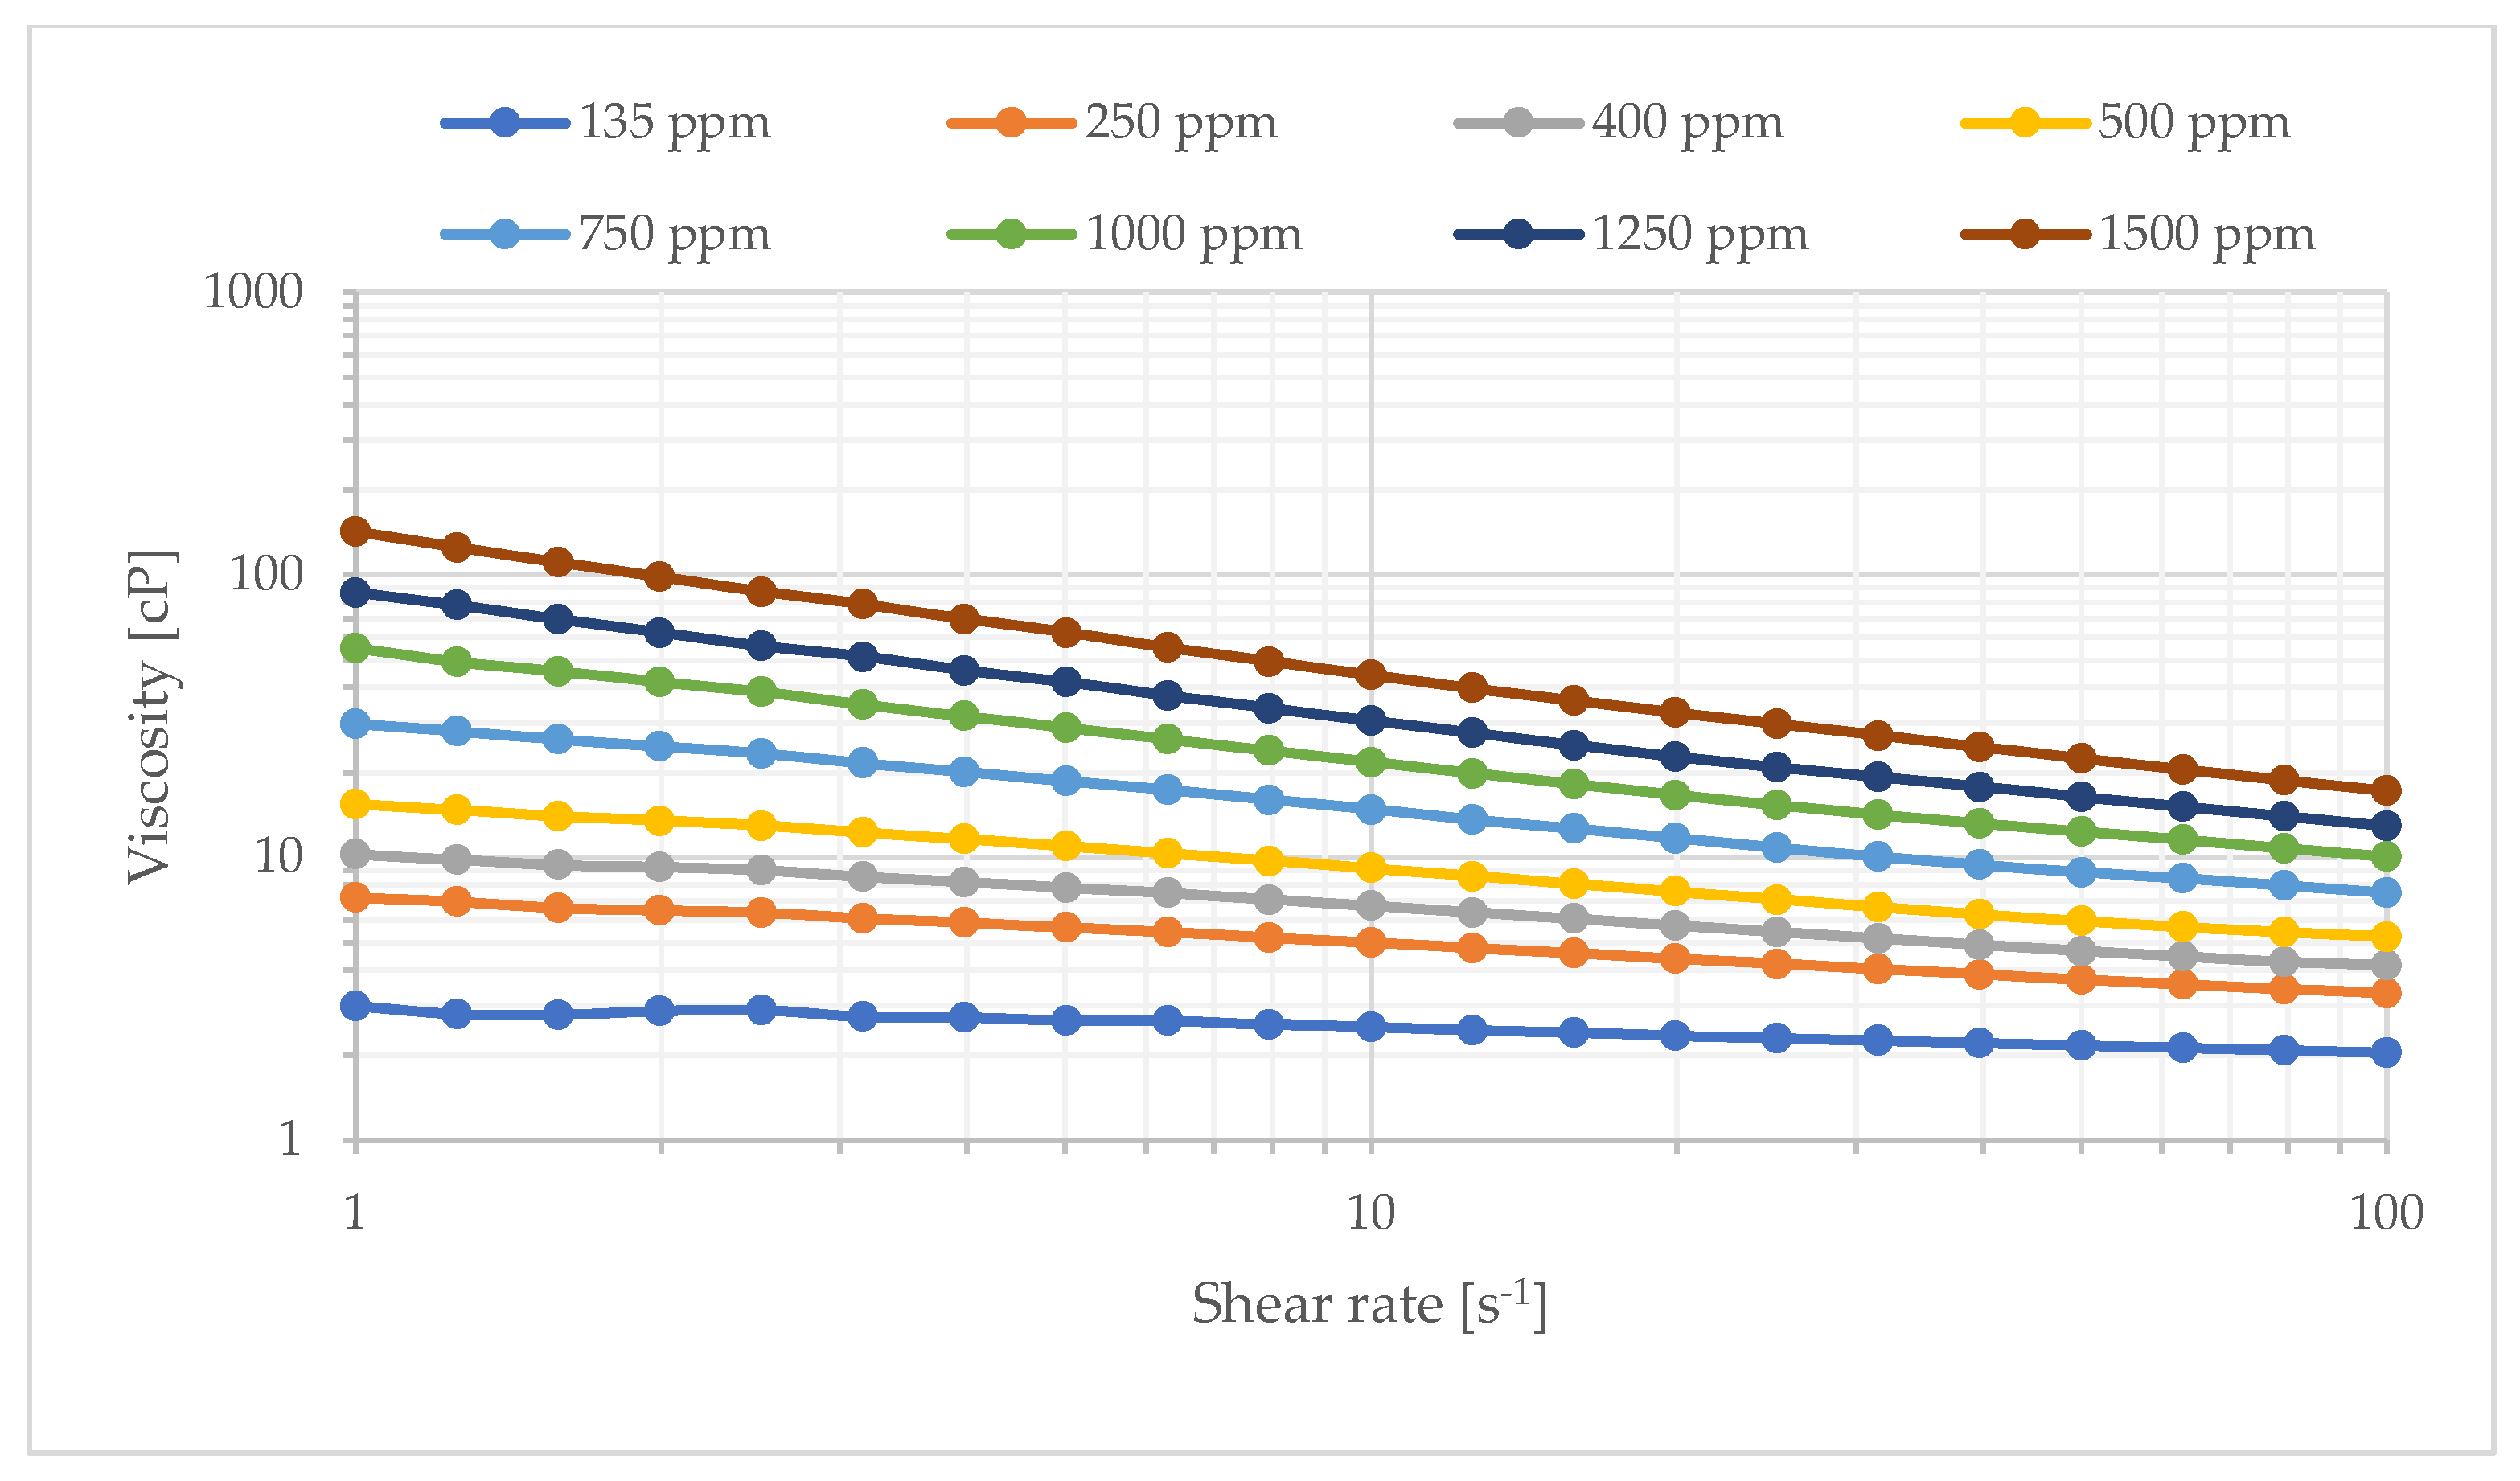
2.3. Polymer
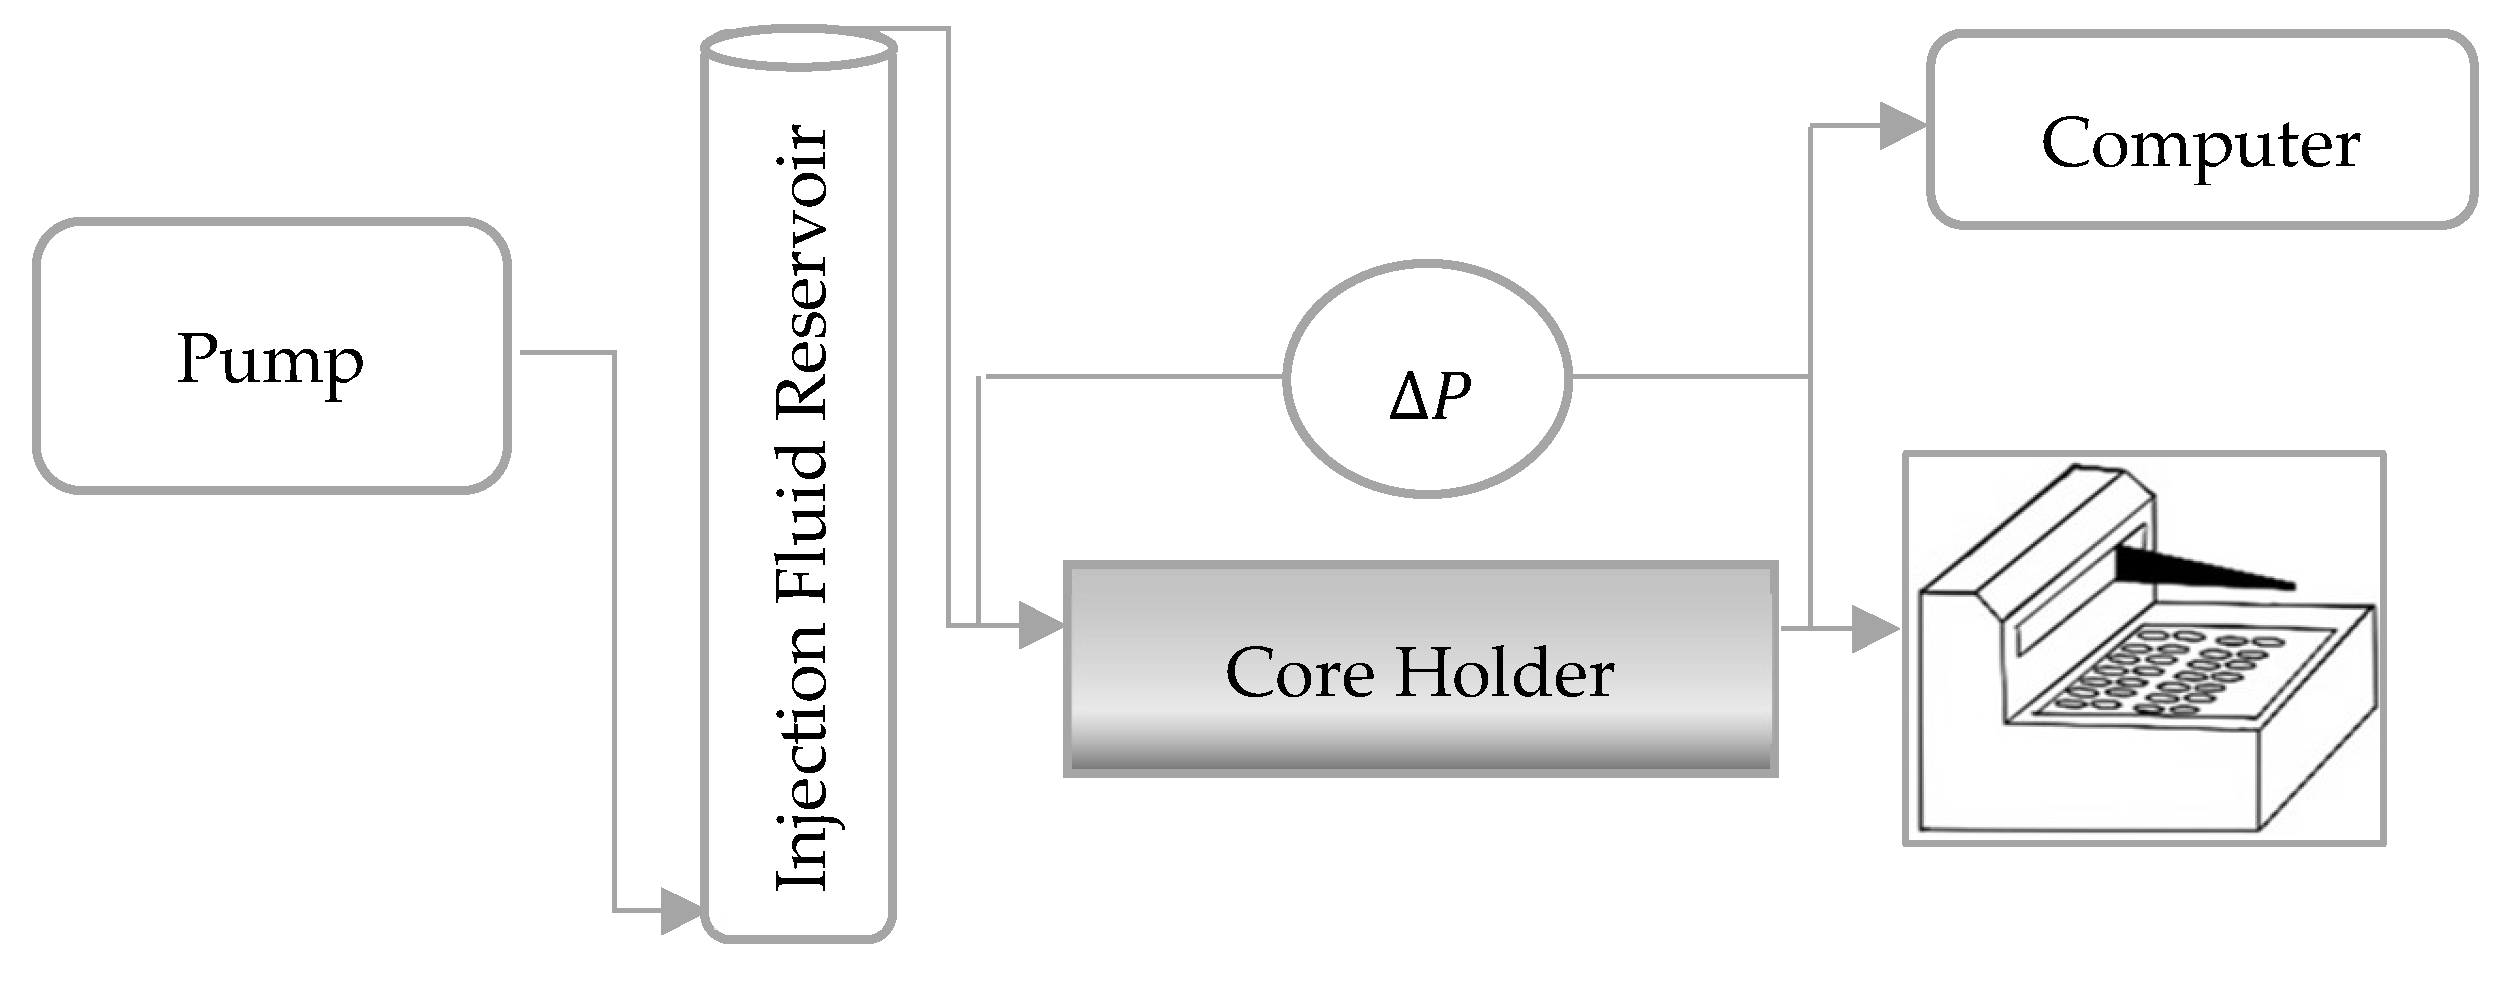
2.4. Experimental Setup
3. Results and Discussion
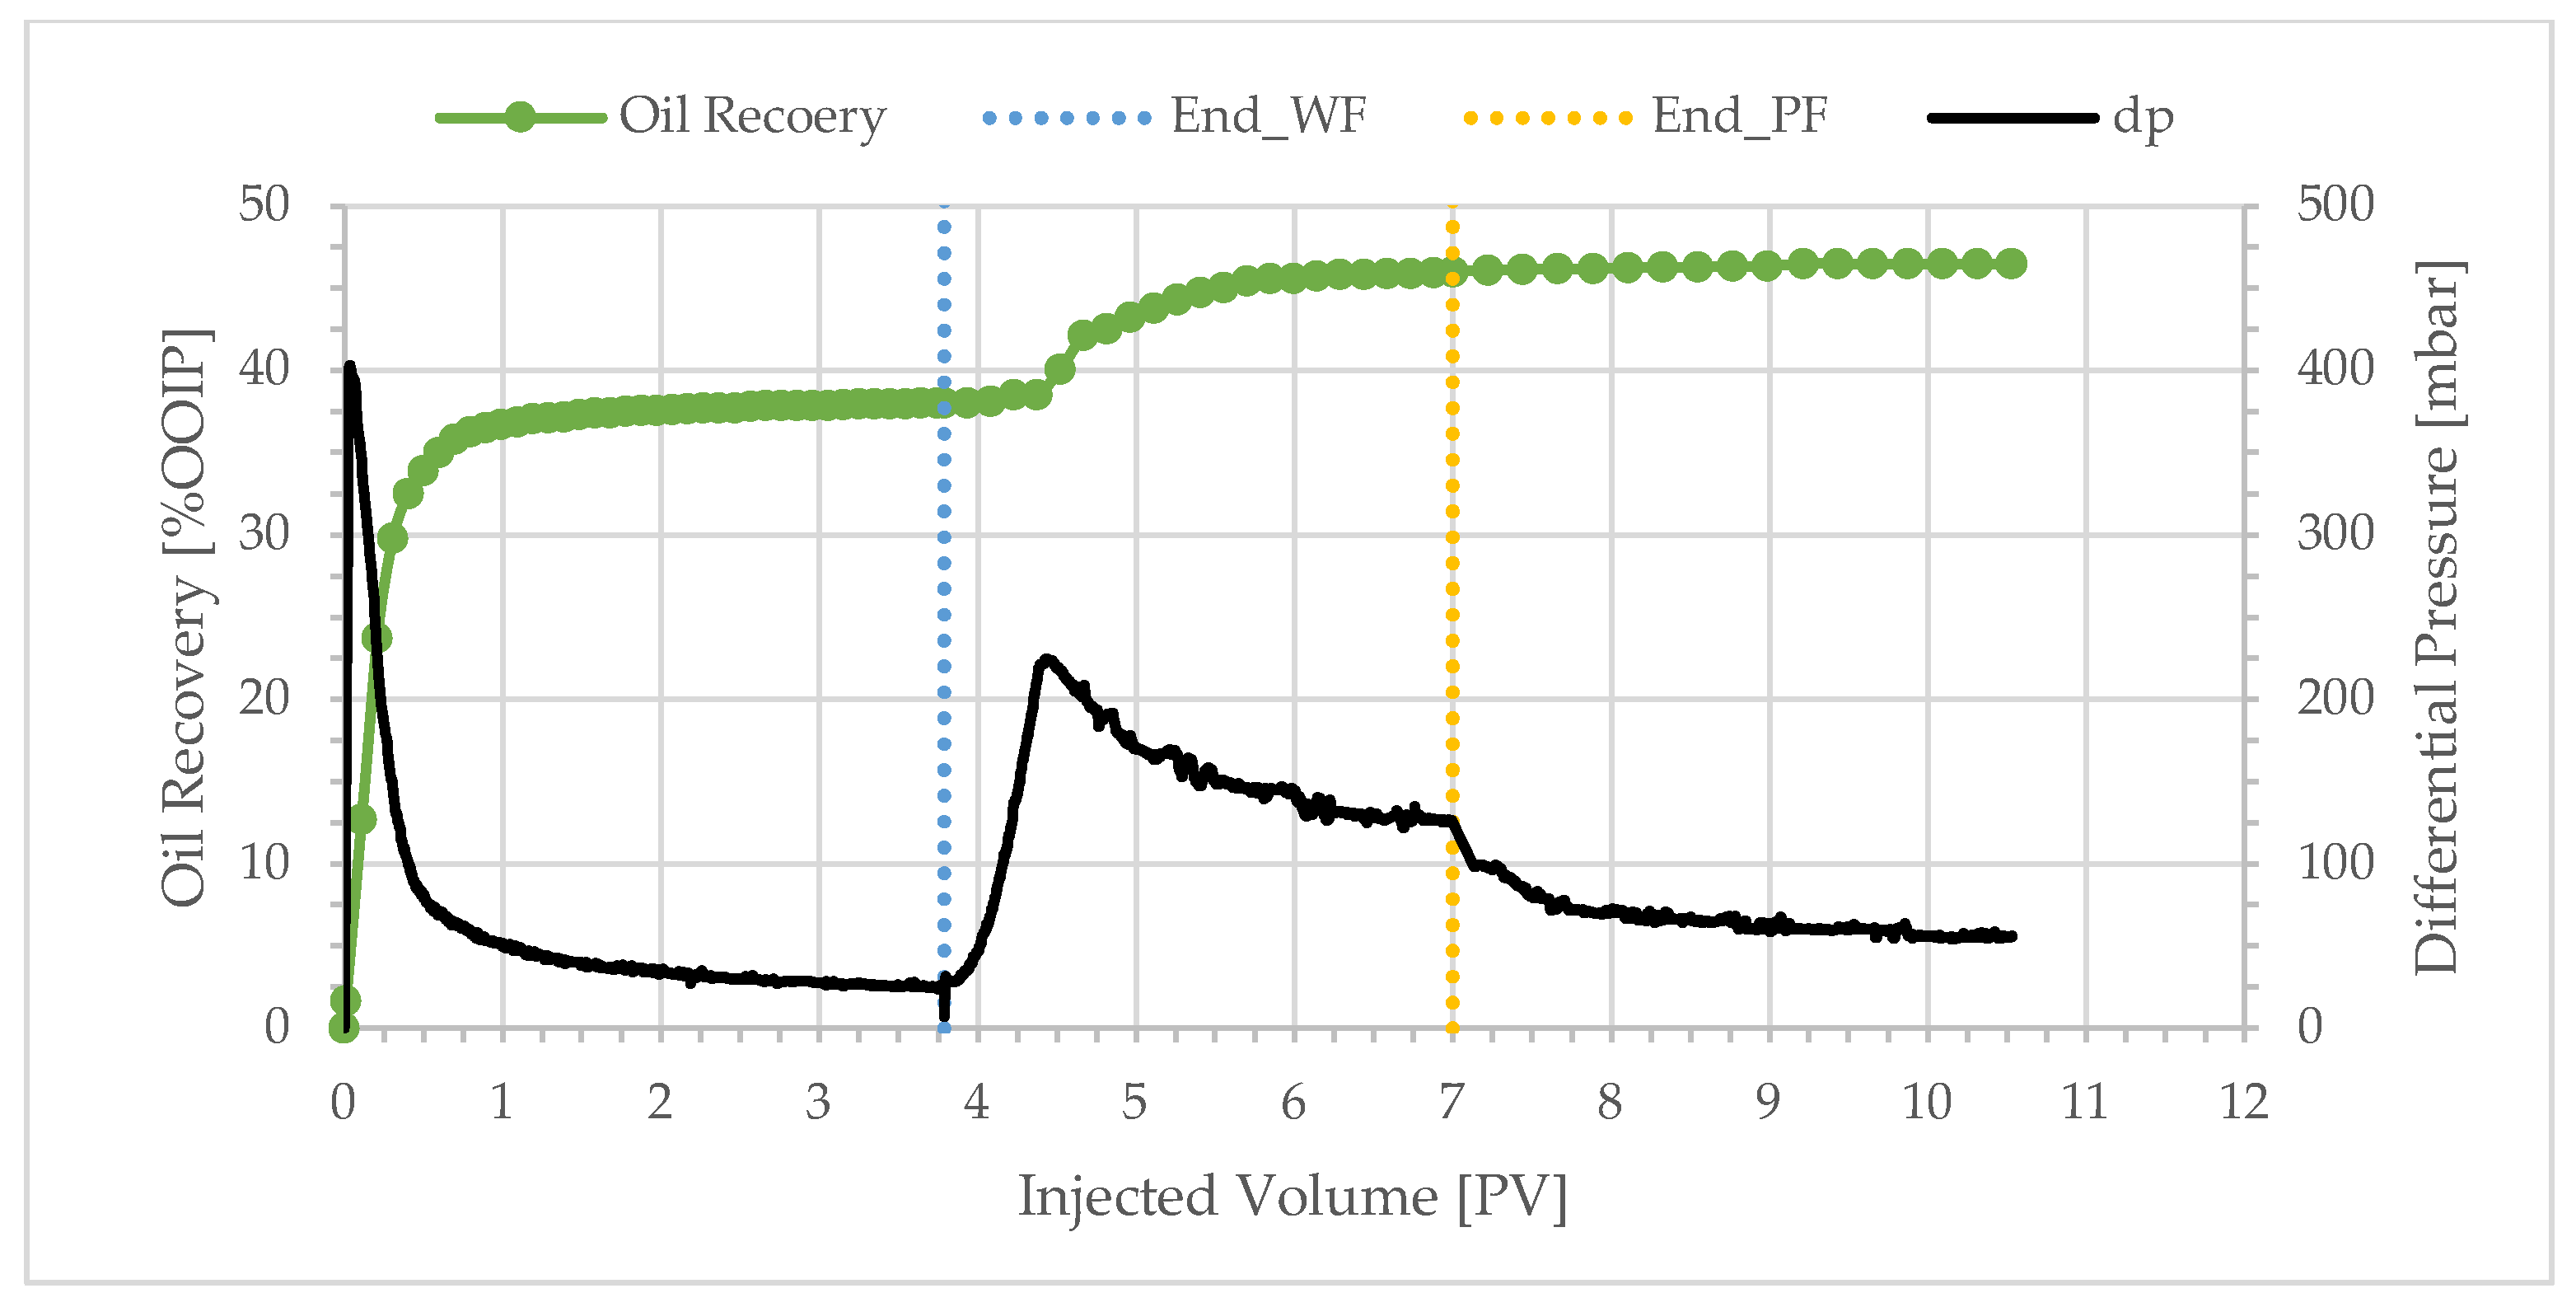
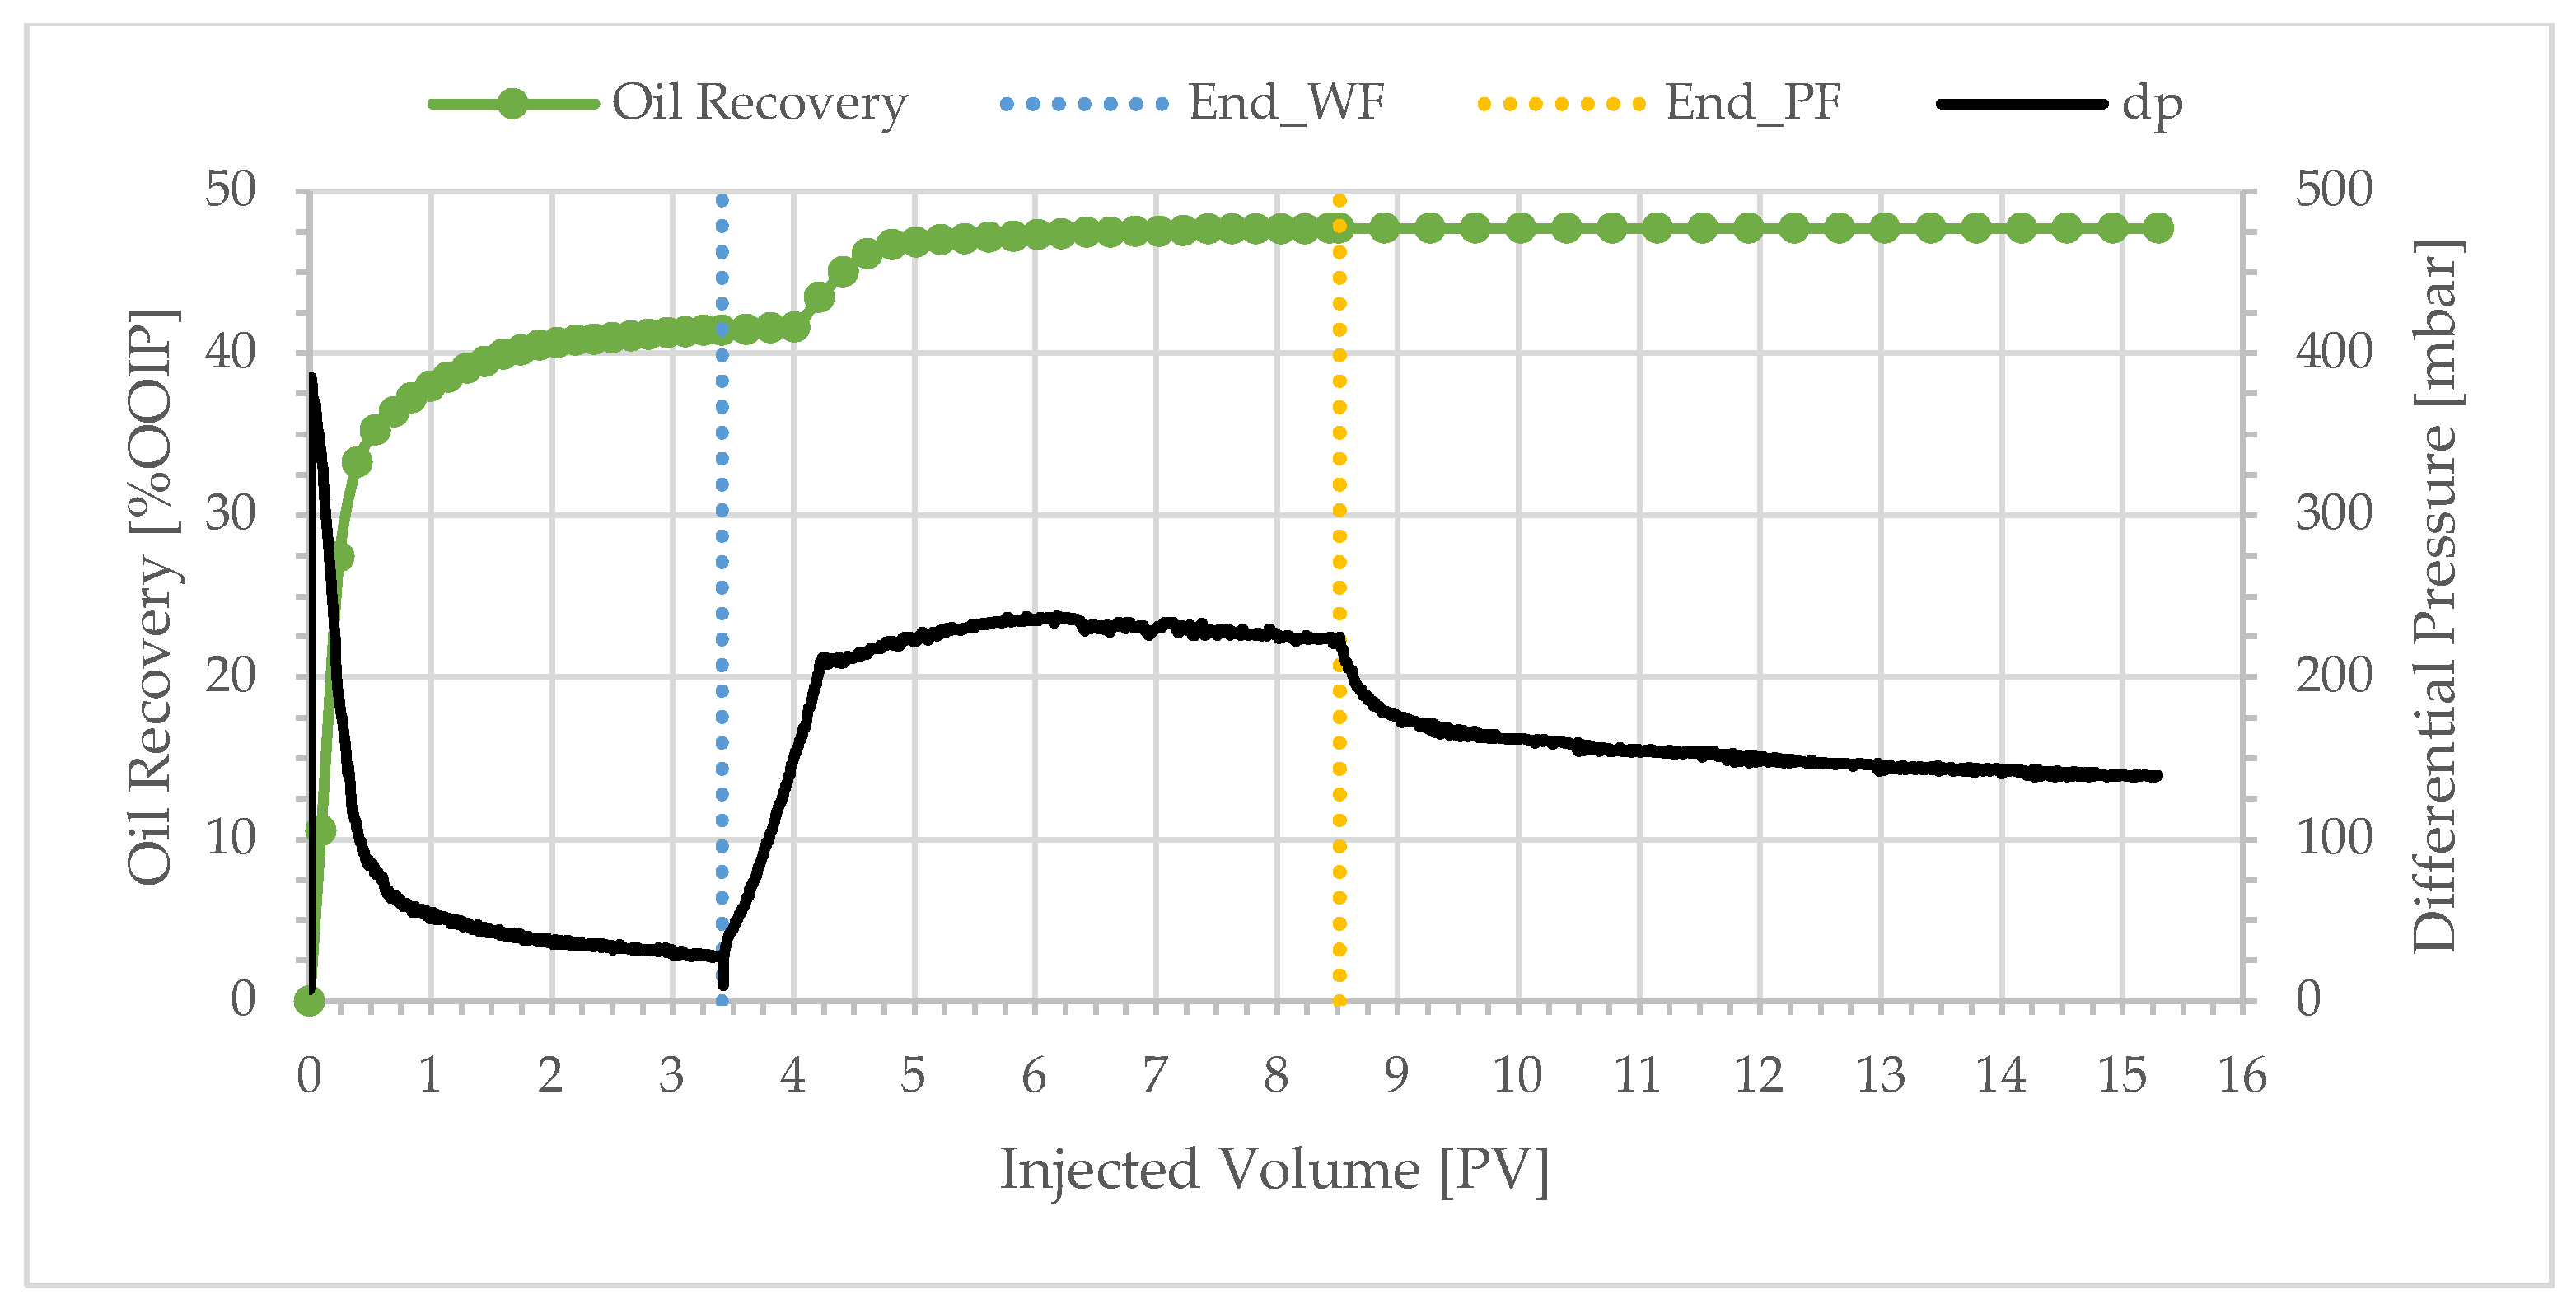
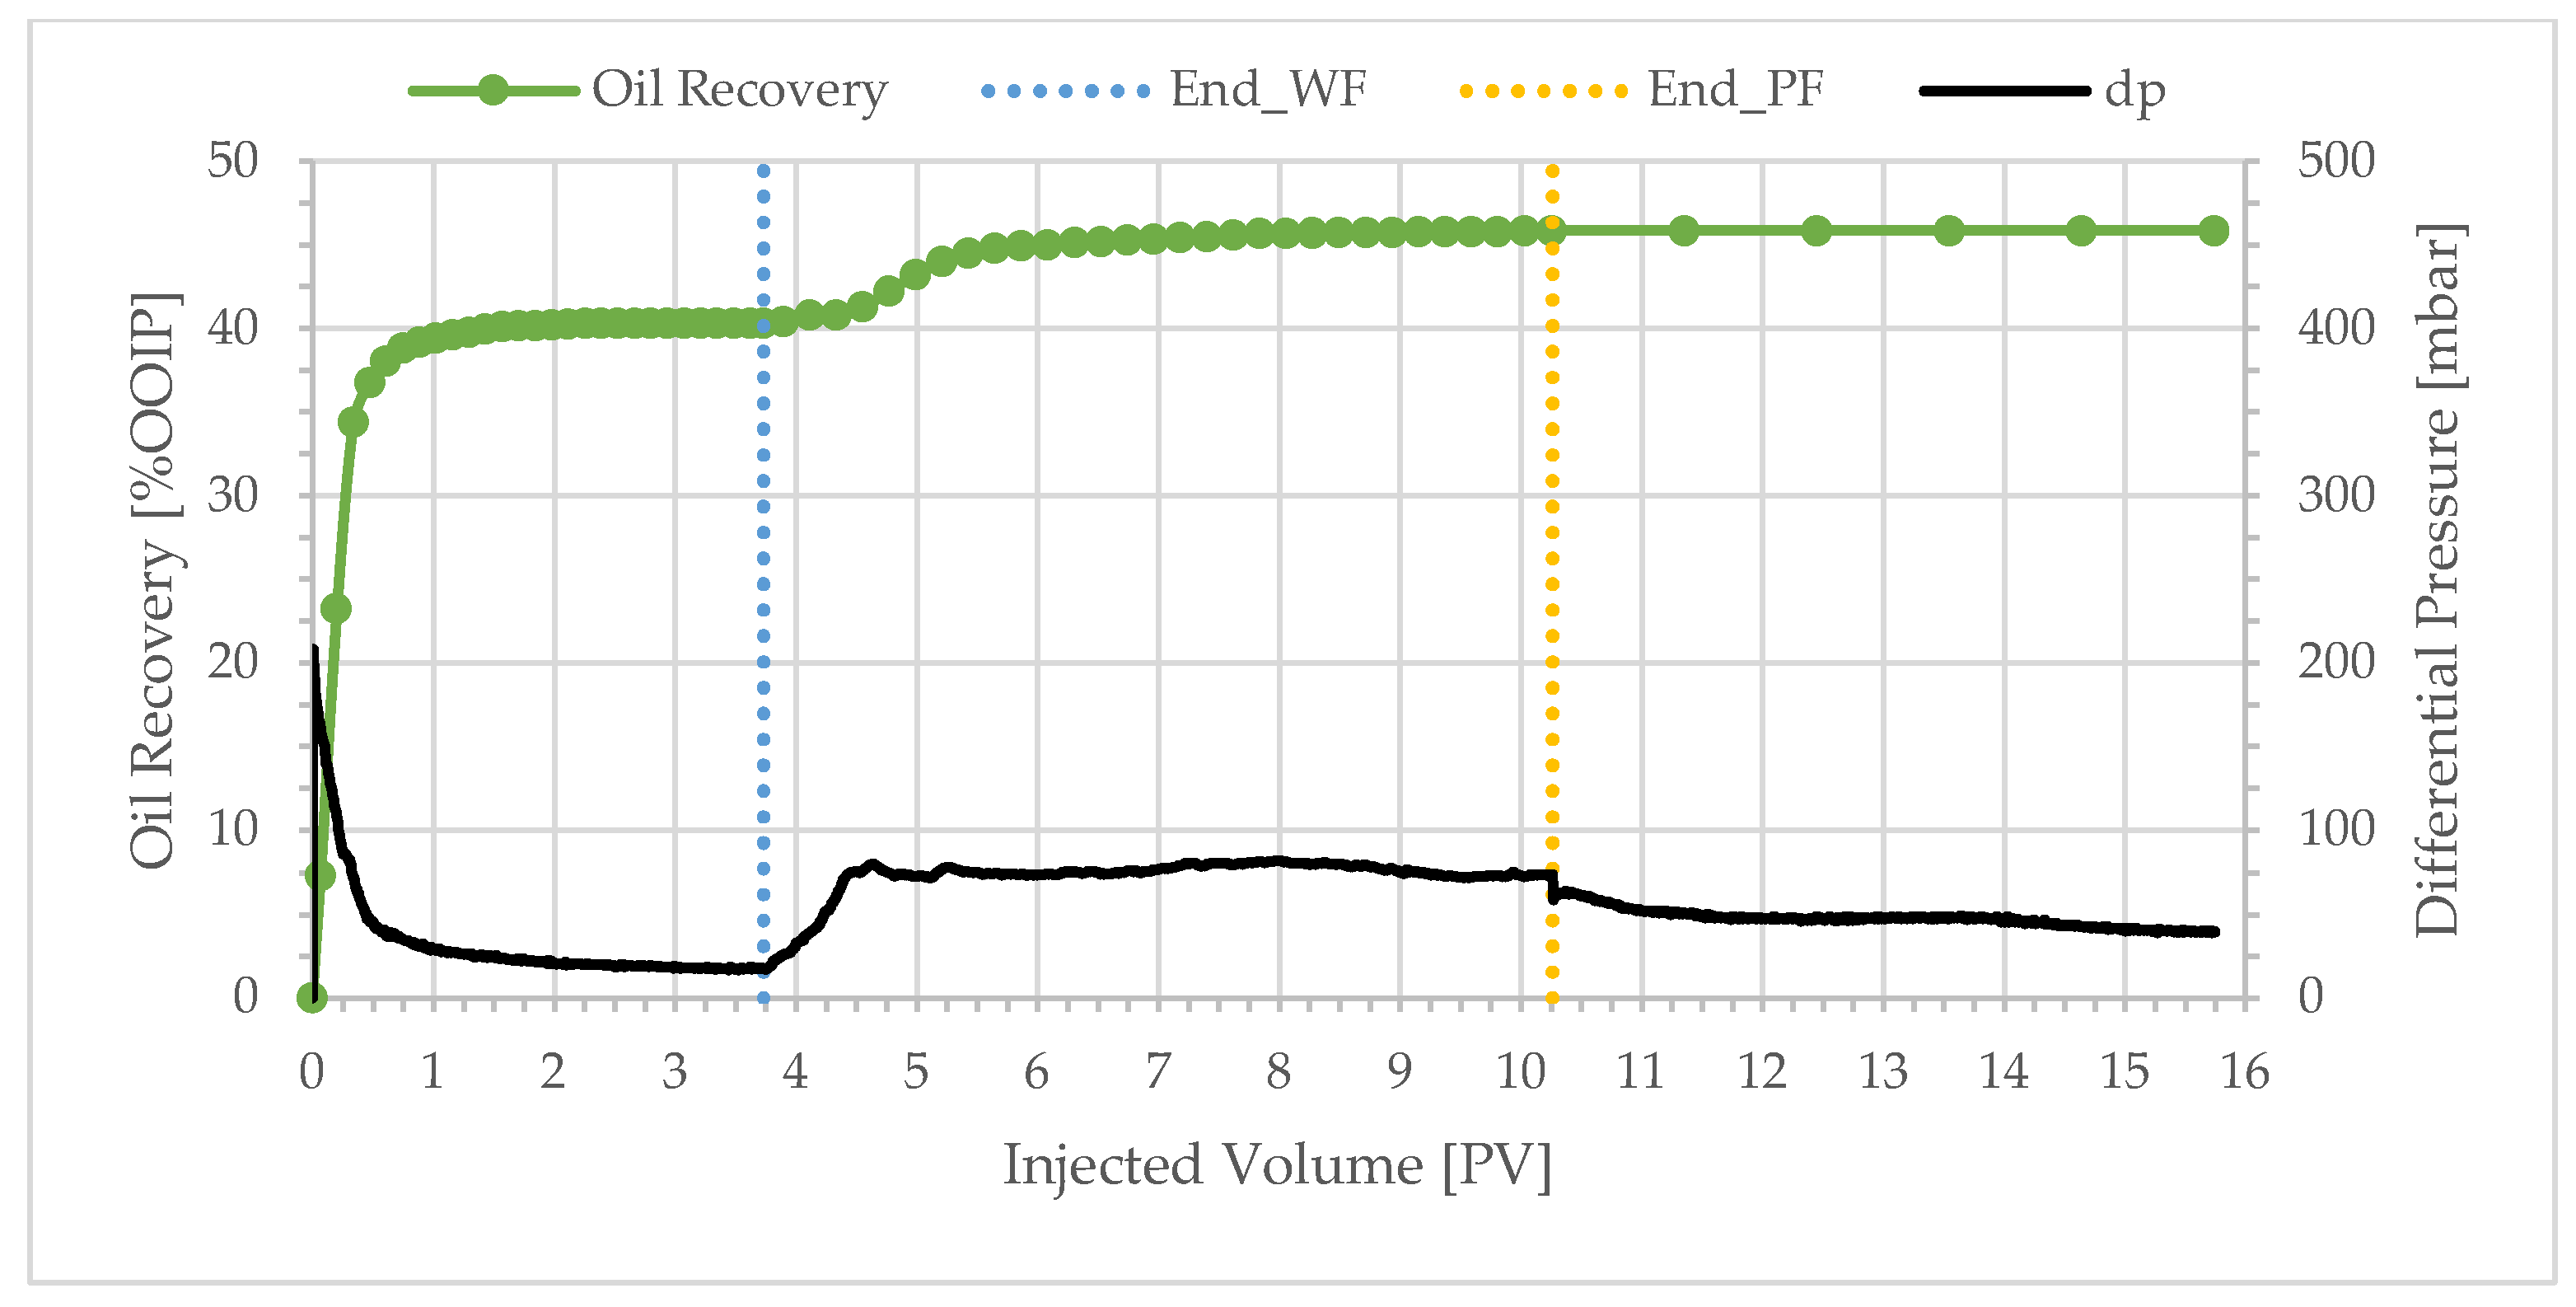
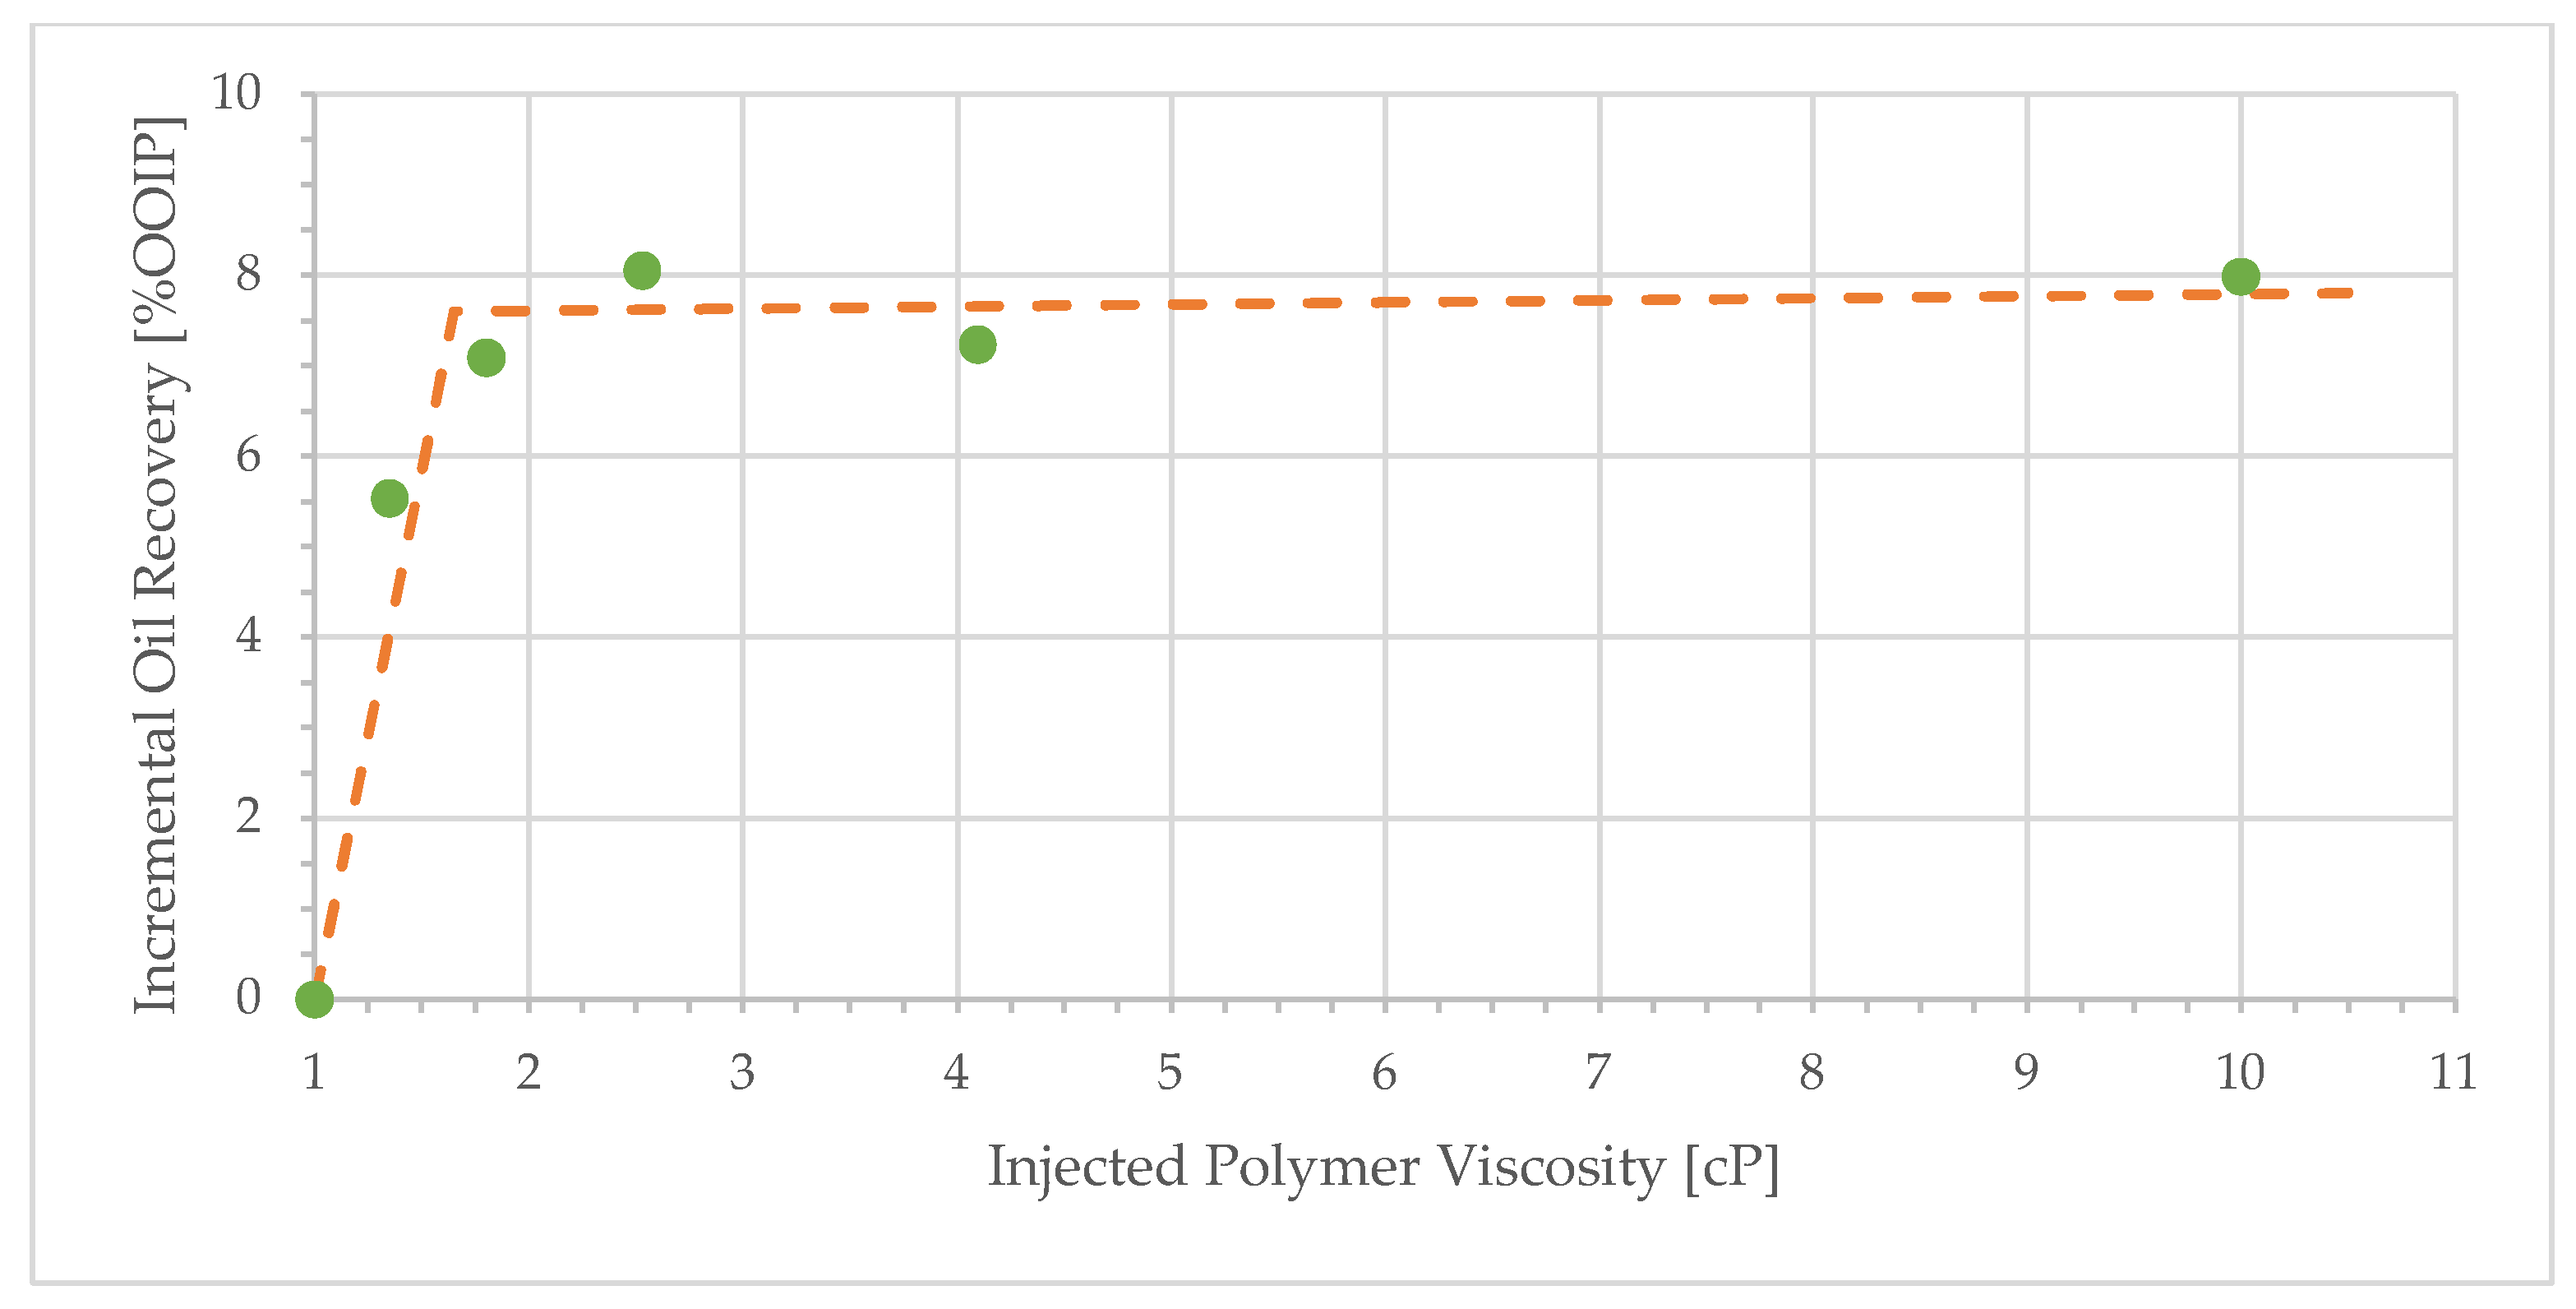
3.1. Effect of Polymer Solution Viscosity
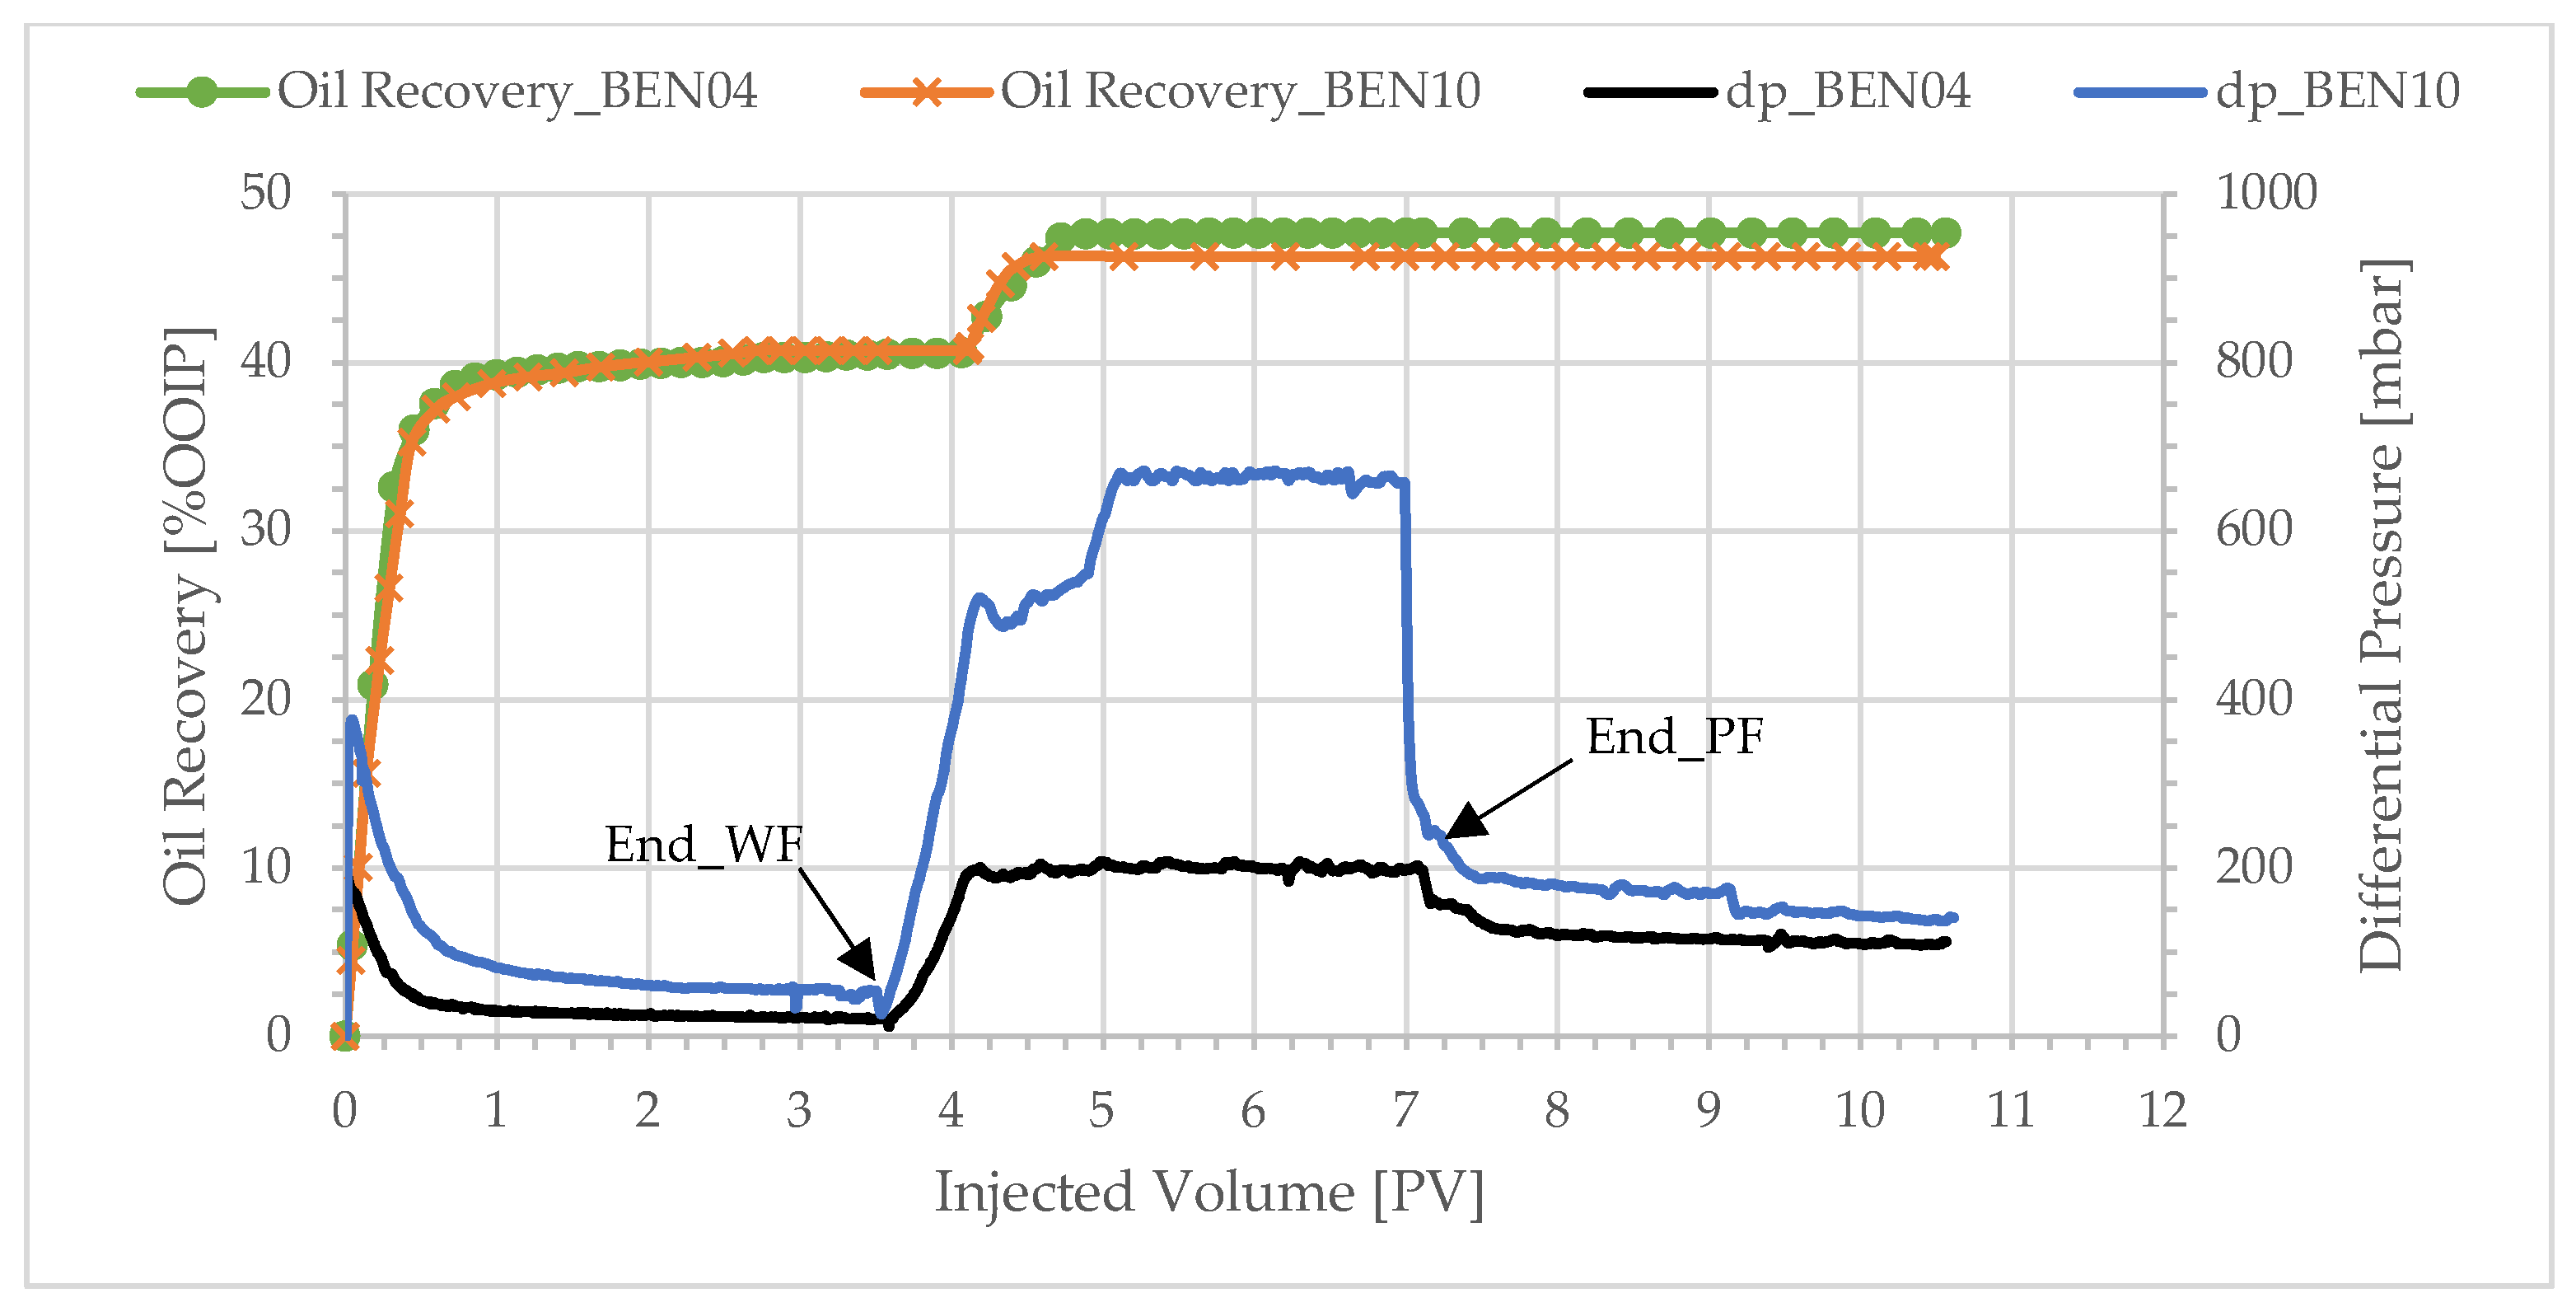
3.2. Effect of Wettability Change
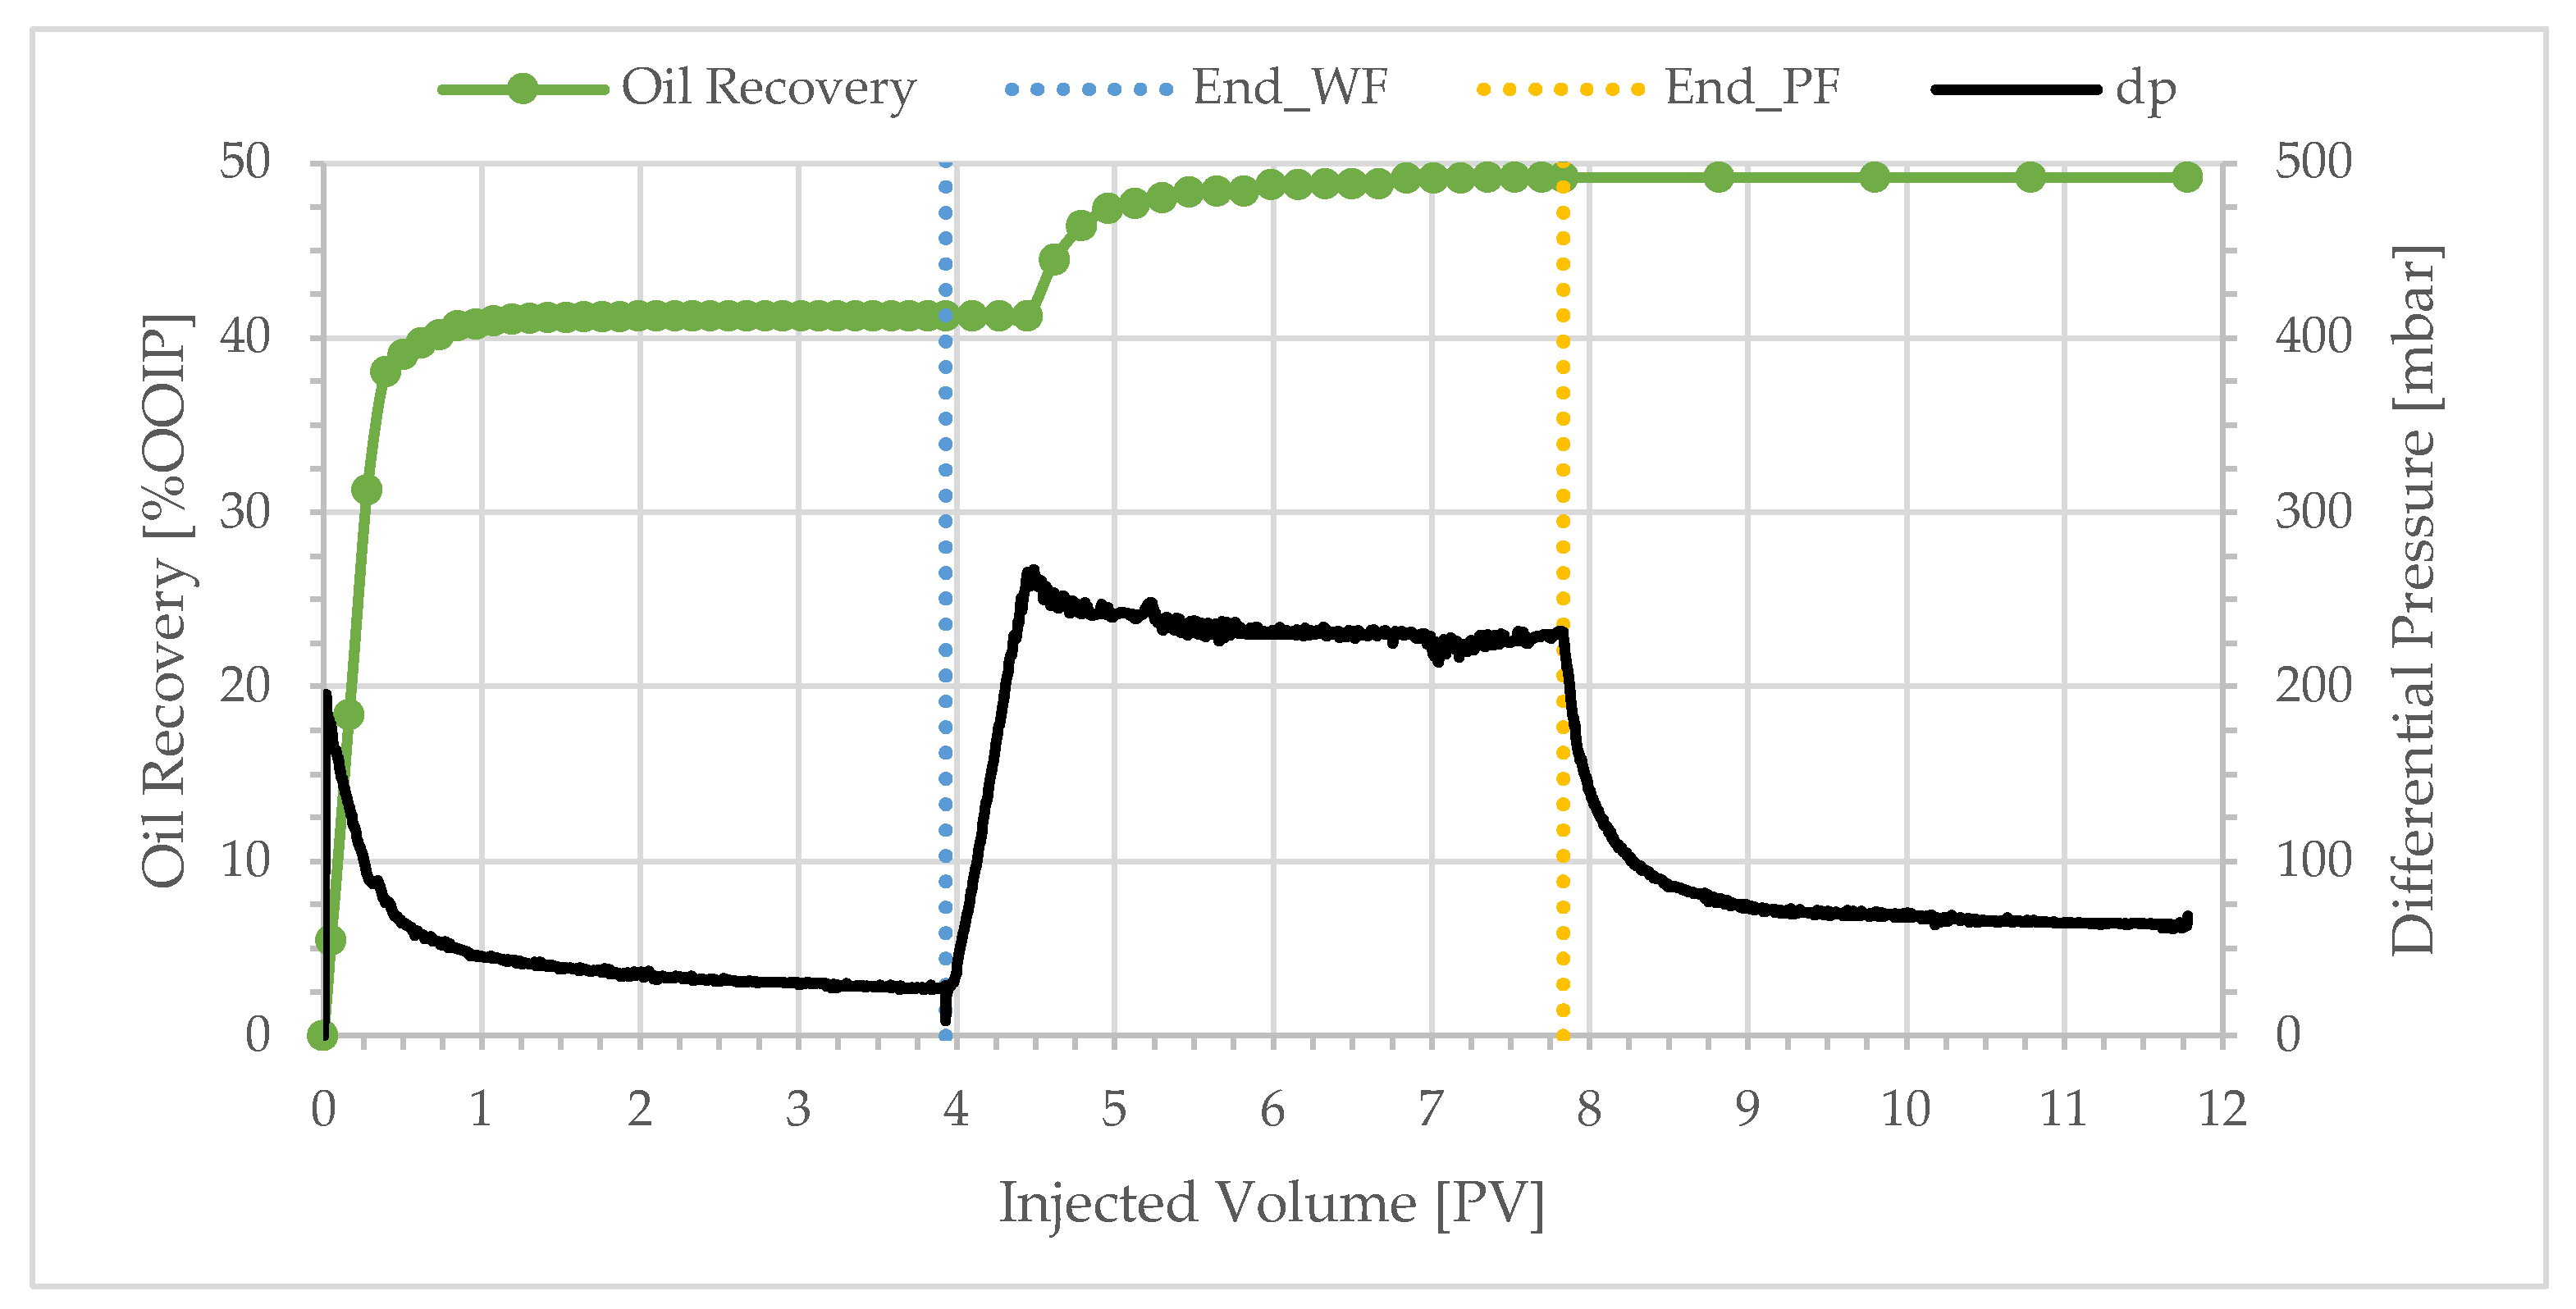
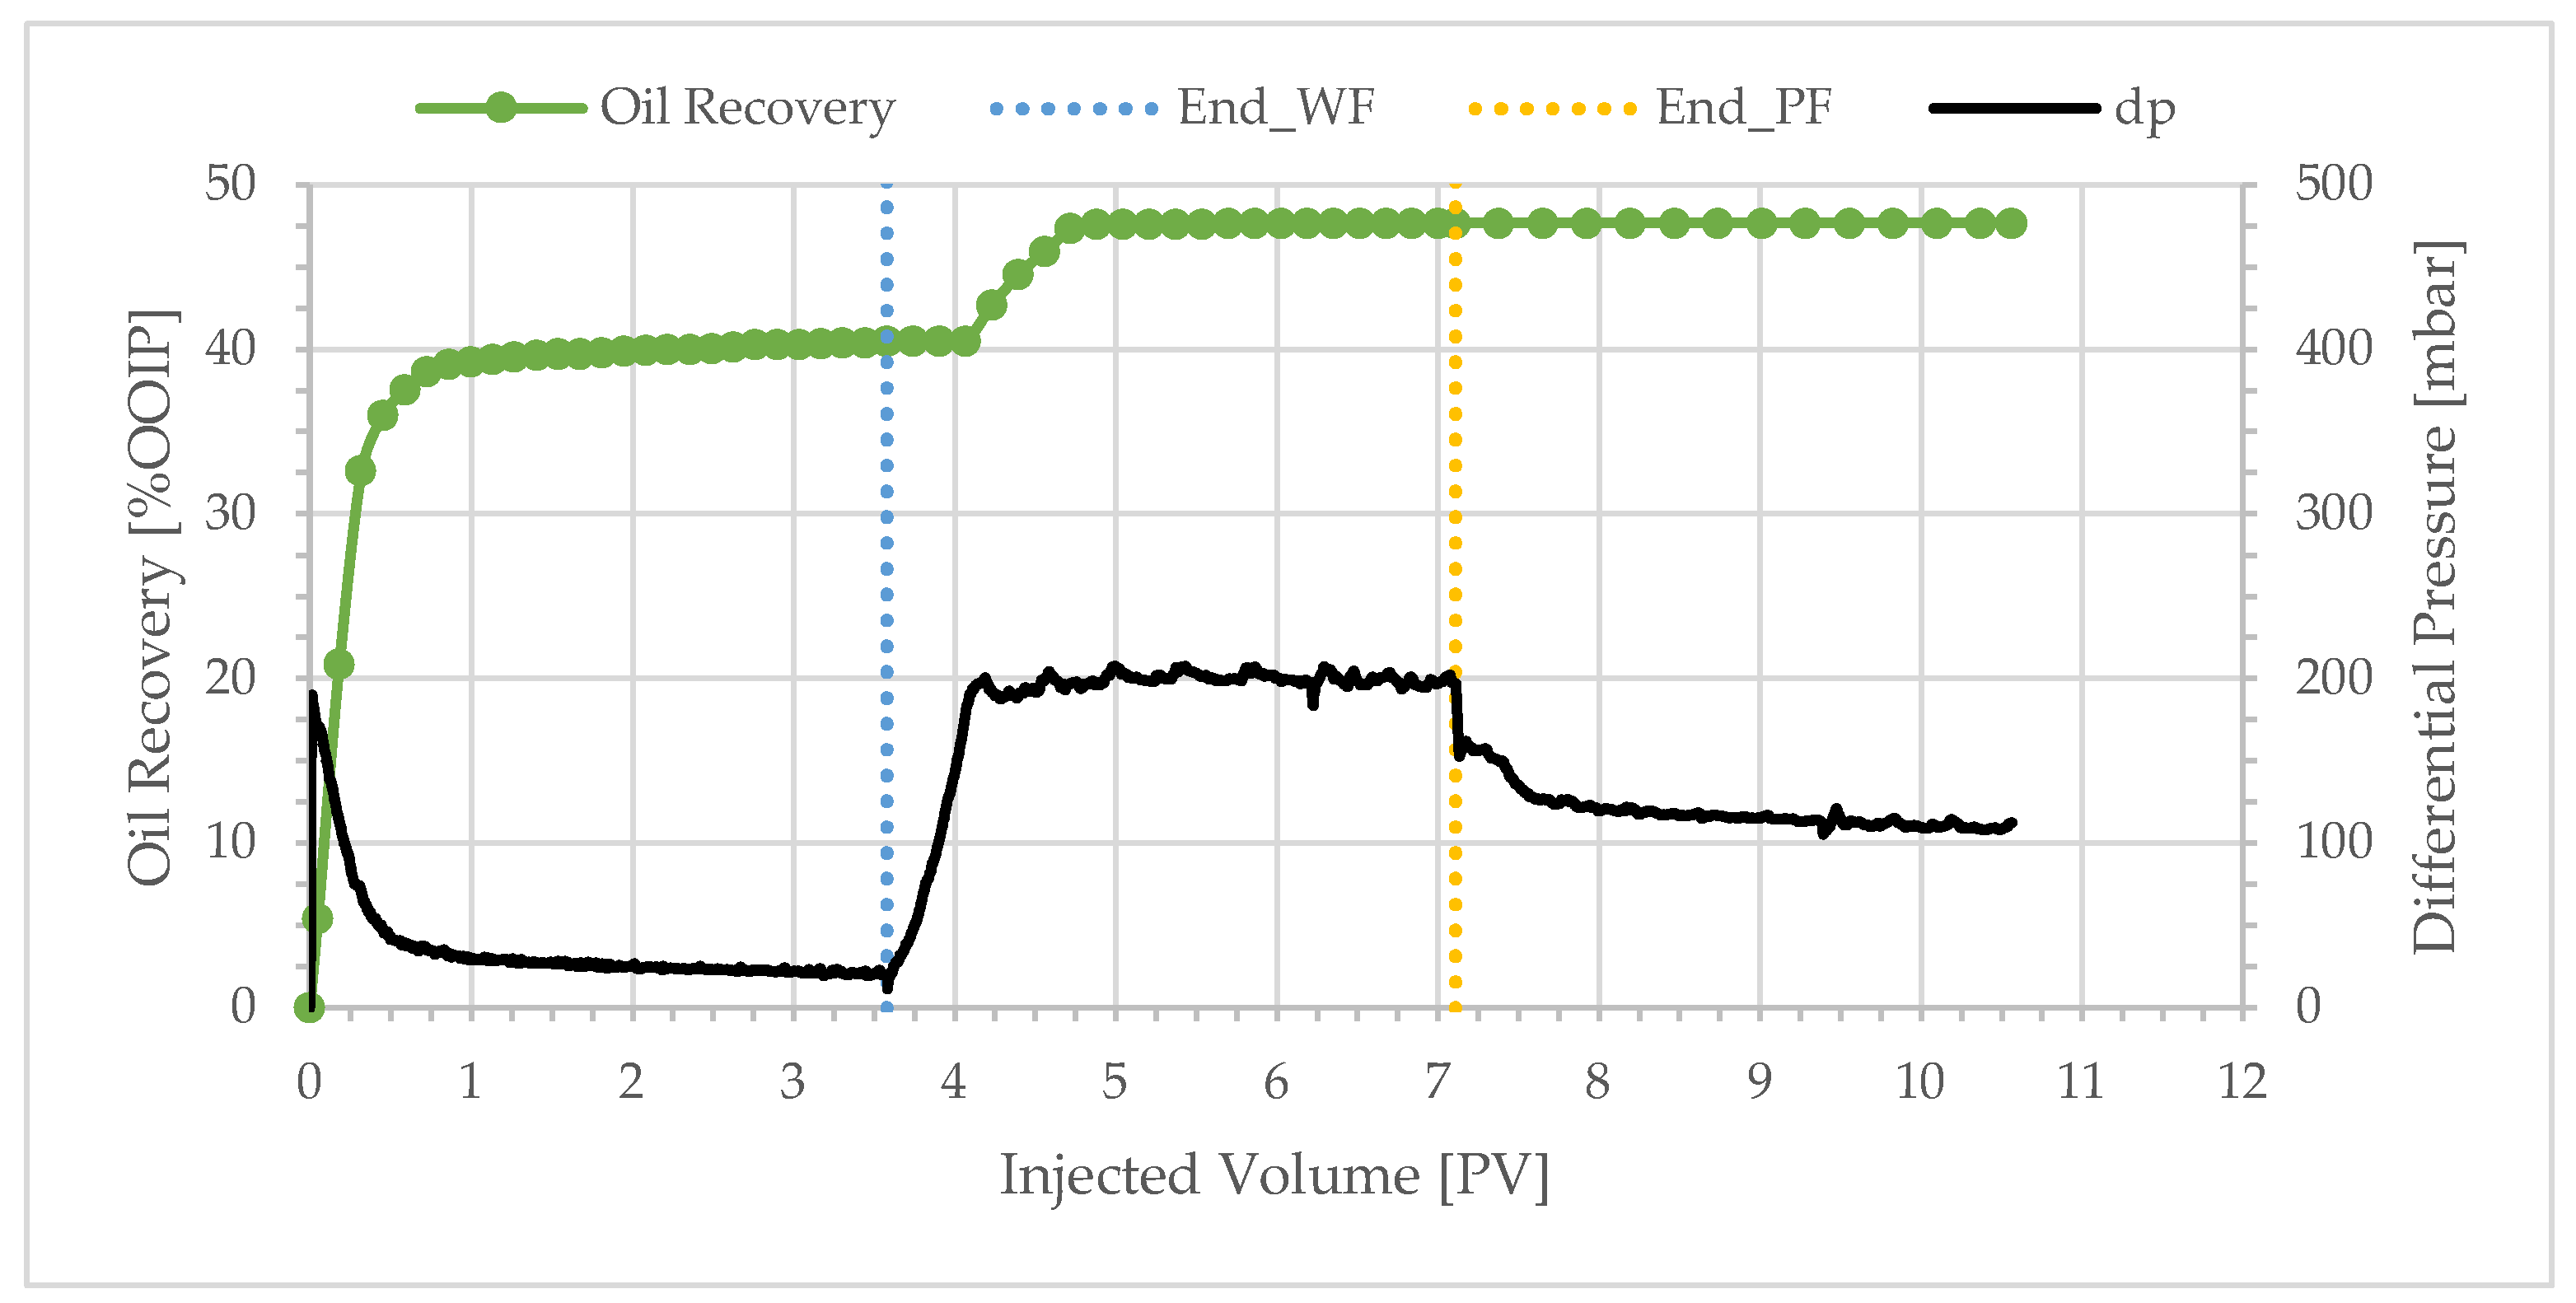
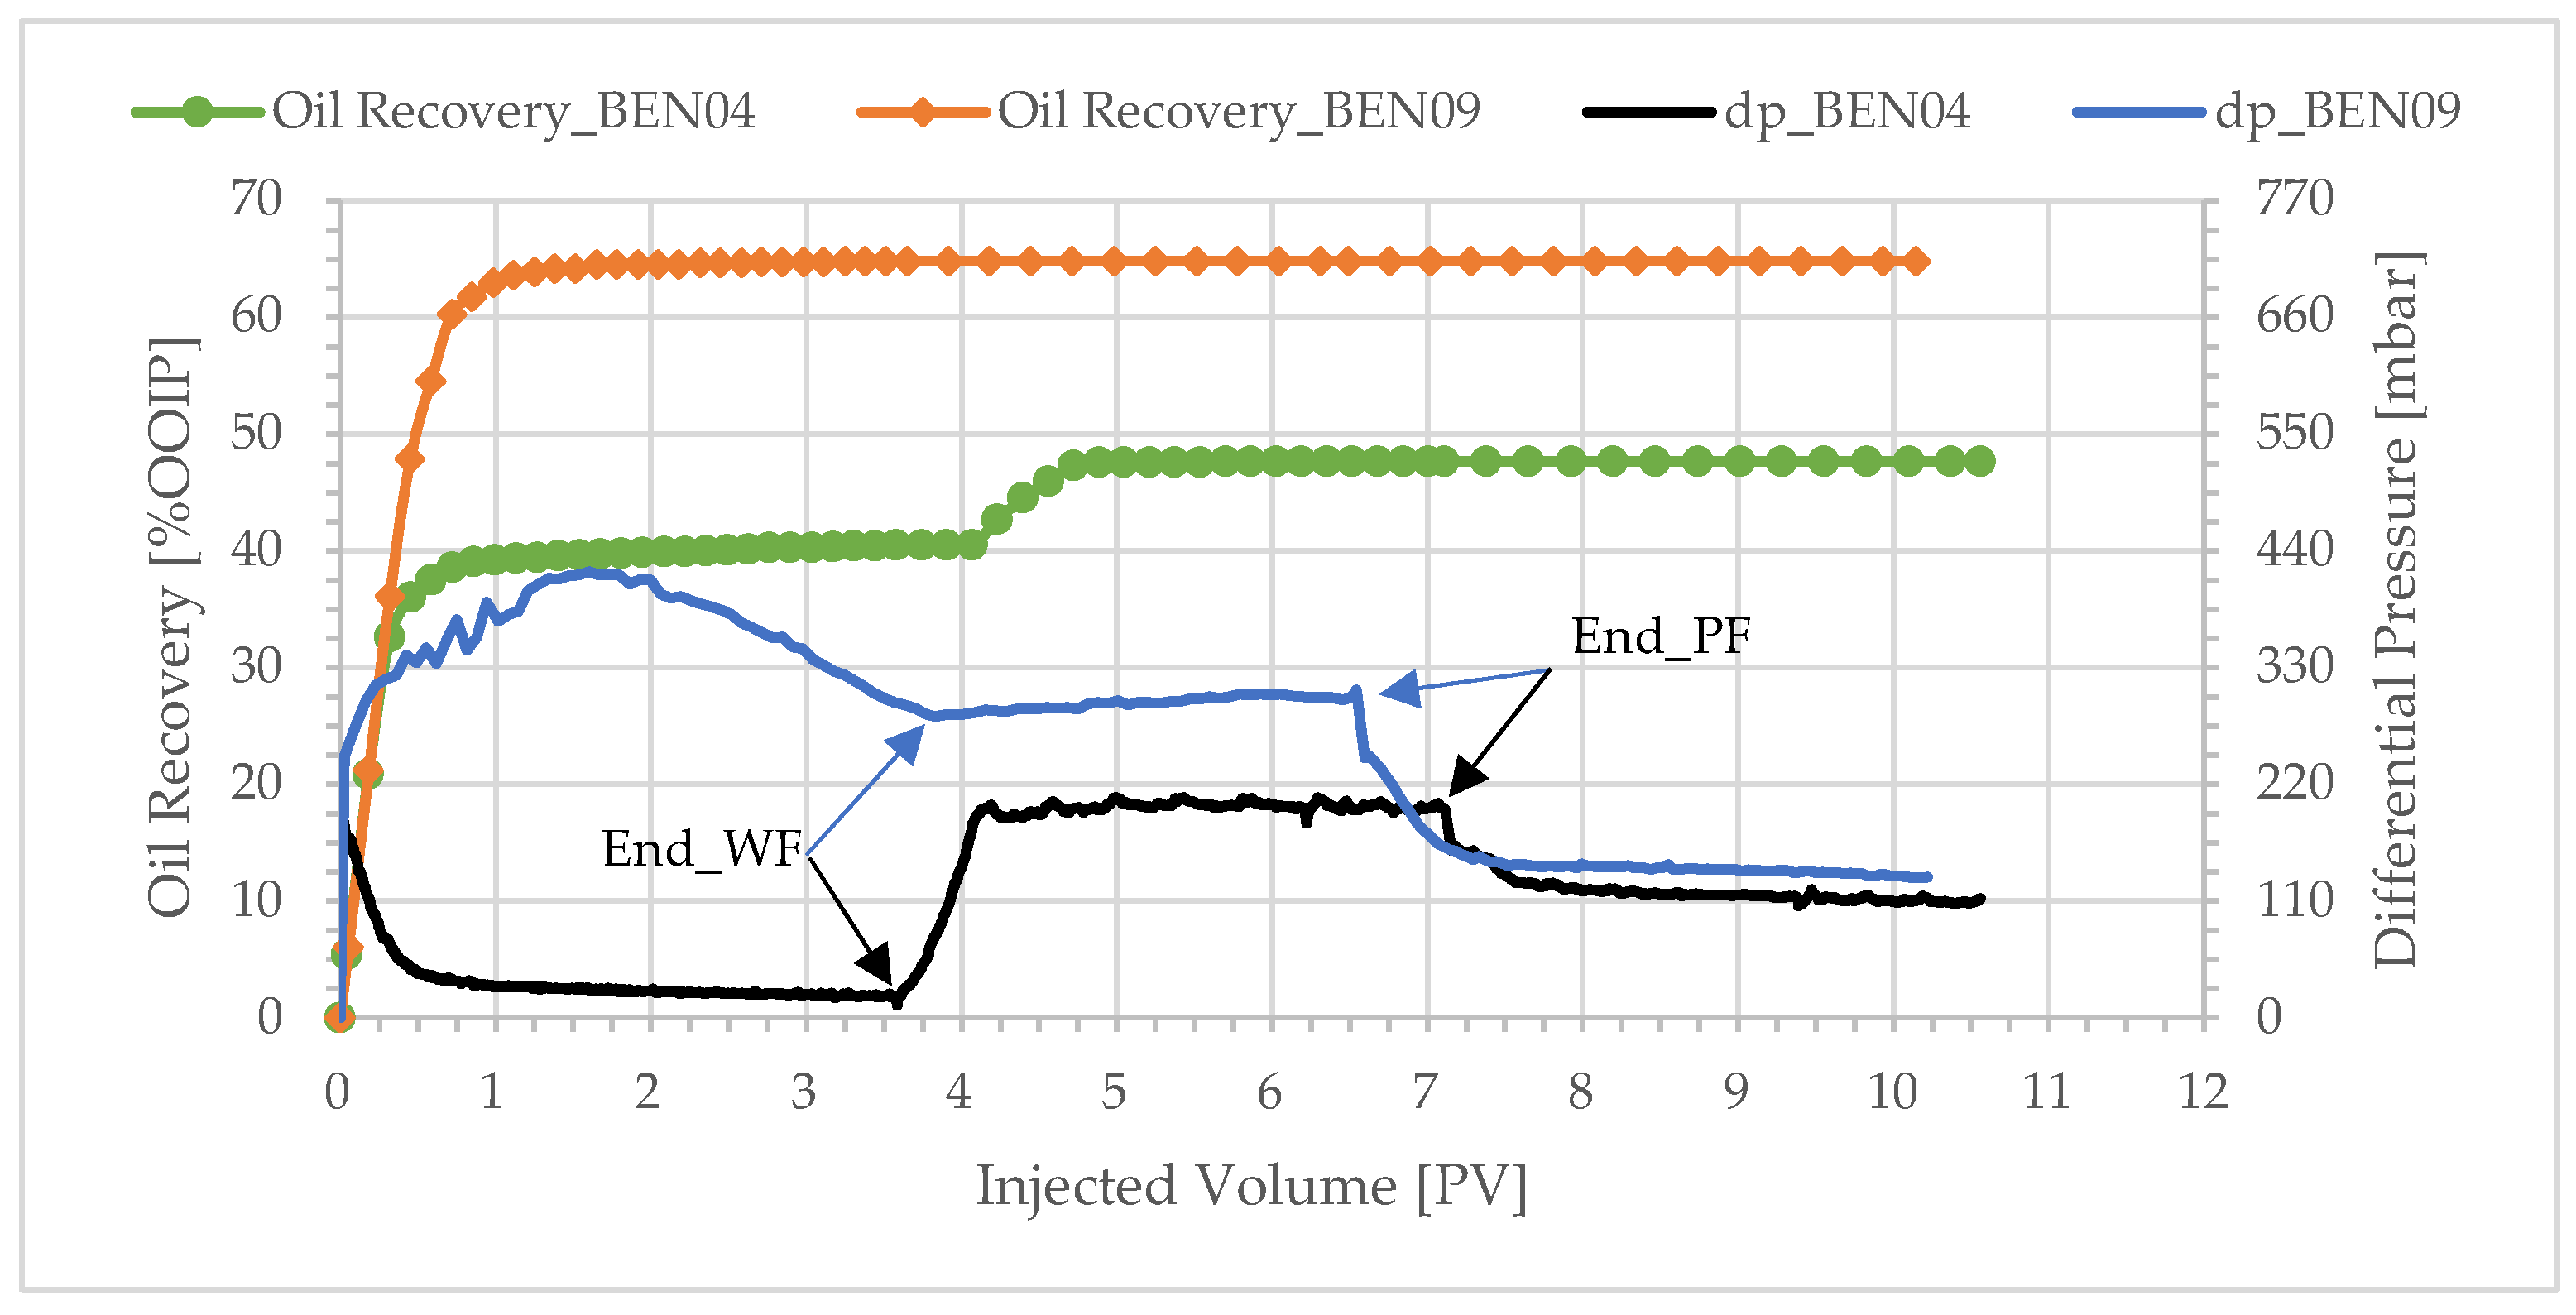
3.3. Effect of Injection Stage—Secondary and Tertiary Injection
4. Conclusions
Author Contributions
Funding
Data Availability Statement
Acknowledgments
Conflicts of Interest
Abbreviations
| CBM | Capillary Bundle Model |
| EOR | Enhanced Oil Recovery |
| PV | Pore Volume |
| RF | Resistance Factor |
| RRF | Residual Resistance Factor |
| STO | Stock Tank Oil |
| OOIP | Original Oil in Place |
| WBT | Water Breakthrough |
References
- Chang, H.L. Polymer Flooding Technology Yesterday, Today, and Tomorrow. J. Pet. Technol. 1978, 30, 1113–1128. [Google Scholar] [CrossRef]
- Needham, R.B.; Doe, P.H. Polymer Flooding Review. J. Pet. Technol. 1987, 39, 1503–1507. [Google Scholar] [CrossRef]
- Sorbie, K.S. Polymer-Improved Oil Recovery; Blackie: Glasgow, UK; CRC Press: Boca Raton, FL, USA, 1991; ISBN 978-0-216-92693-6. [Google Scholar]
- Taber, J.J.; Martin, F.D.; Seright, R.S. EOR Screening Criteria Revisited—Part 1: Introduction to Screening Cri-teria and Enhanced Recovery Field Projects. SPE Reserv. Eng. 1997, 12, 189–198. [Google Scholar] [CrossRef]
- Taber, J.J.; Martin, F.D.; Seright, R.S. EOR Screening Criteria Revisited—Part 2: Applications and Impact of Oil Prices. SPE Reserv. Eng. 1997, 12, 199–206. [Google Scholar] [CrossRef]
- Farajzadeh, R.; Glasbergen, G.; Karpan, V.; Mjeni, R.; Boersma, D.M.; Eftekhari, A.A.; Casquera Garcia, A.; Bruining, J. Improved Oil Recovery Techniques and Their Role in Energy Efficiency and Reducing CO2 Footprint of Oil Production. J. Clean. Prod. 2022, 369, 133308. [Google Scholar] [CrossRef]
- Bondino, I.; Nguyen, R.; Hamon, G.; Per Arne, O.; Skauge, A.; Jouenne, S. Tertiary Polymer Flooding in Extra-Heavy Oil: An Investigation Using 1D and 2D Experiments, Core Scale Simulation and Pore scale Network Models. In Proceedings of the International Symposium of the Society of Core Analysts (SCA2011-18), Austin, TX, USA, 18–21 September 2011. [Google Scholar]
- Skauge, A.; Ormehaug, P.A.; Gurholt, T.; Vik, B.; Bondino, I.; Hamon, G. 2-D Visualisation of Unstable Water-flood and Polymer Flood for Displacement of Heavy Oil. In Proceedings of the SPE Improved Oil Recovery Symposium, Tulsa, OK, USA, 14–18 April 2012; p. SPE-154292-MS. [Google Scholar] [CrossRef]
- Craig, F.F. The Reservoir Engineering Aspects of Waterflooding; Henry L. Doherty Series; Henry L. Doherty Memorial Fund of AIME: Richardson, TX, USA, 1993; ISBN 978-0-89520-202-4. [Google Scholar]
- Wassmuth, F.R.; Green, K.; Hodgins, L.; Turta, A.T. Polymer Flood Technology for Heavy Oil Recovery. In Proceedings of the Canadian International Petroleum Conference, Calgary, AB, Canada, 12–14 June 2007; p. PETSOC-2007-182. [Google Scholar] [CrossRef]
- Lake, L.W. Enhanced Oil Recovery; Prentice Hall: Englewood Cliffs, NJ, USA, 1989; ISBN 978-0-13-281601-4. [Google Scholar]
- Delamaide, E.; Zaitoun, A.; Renard, G.; Tabary, R. Pelican Lake Field: First Successful Application of Polymer Flooding in a Heavy Oil Reservoir. SPE Res. Eval. Eng. 2014, 17, 340–354. [Google Scholar] [CrossRef]
- Delaplace, P.; Renard, G.; Delamaide, E.; Euzen, T.; Roggero, F.; Kopecny, P. Reservoir Simulations of a Polymer Flood Pilot in the Pelican Lake Heavy Oil Field (Canada): A Step Forward. In Proceedings of the SPE Reservoir Characterization and Simulation Conference and Exhibition, Abu Dhabi, United Arab Emirates, 16–18 September 2013; p. SPE-166028-MS. [Google Scholar] [CrossRef]
- Delaplace, P.; Delamaide, E.; Roggero, F.; Renard, G. History Matching of a Successful Polymer Flood Pilot in the Pelican Lake Heavy Oil Field, Canada. In Proceedings of the SPE Annual Technical Conference and Exhibition, New Orleans, LA, USA, 30 September–2 October 2013; p. SPE-166256. [Google Scholar] [CrossRef]
- Wilson, A. Pelican Lake: First Successful Application of Polymer Flooding in a Heavy-Oil Reservoir. J. Pet. Technol. 2015, 67, 78–80. [Google Scholar] [CrossRef]
- Skauge, T.; Vik, B.F.; Ormehaug, P.A.; Jatten, B.K.; Kippe, V.; Skjevrak, I.; Standnes, D.C.; Uleberg, K.; Skauge, A. Polymer Flood at Adverse Mobility Ratio in 2D Flow by X-Ray Visualization. In Proceedings of the SPE EOR Conference at Oil and Gas West Asia, Muscat, Oman, 31 March–2 April 2014; p. SPE-169740-MS. [Google Scholar] [CrossRef]
- Vik, B.; Kedir, A.; Kippe, V.; Sandengen, K.; Skauge, T.; Solbakken, J.; Zhu, D. Viscous Oil Recovery by Polymer Injection; Impact of In-Situ Polymer Rheology on Water Front Stabilization. In Proceedings of the SPE Europec featured at 80th EAGE Conference and Exhibition, Copenhagen, Denmark, 11–14 June 2018; p. SPE 190866. [Google Scholar] [CrossRef]
- Sorbie, K.S.; Skauge, A. Mobilization of By-Passed Oil by Viscous Crossflow in EOR Processes. In Proceedings of the IOR 2019—20th European Symposium on Improved Oil Recovery; European Association of Geoscientists & Engineers, Pau, France, 8–11 April 2019; Volume 2019, pp. 1–16. [Google Scholar] [CrossRef]
- Levitt, D.; Jouenne, S.; Bondino, I.; Santanach-Carreras, E.; Bourrel, M. Polymer Flooding of Heavy Oil Under Adverse Mobility Conditions. In Proceedings of the SPE Enhanced Oil Recovery Conference, Kuala Lumpur, Malaysia, 2–4 July 2013; p. SPE-165267-MS. [Google Scholar] [CrossRef]
- Beteta, A.; Sorbie, K.S.; Skauge, A. Immiscible Viscous Fingering: The Simulation of Tertiary Polymer Dis-placements of Viscous Oils in 2D Slab Floods. Polymers 2022, 14, 4159. [Google Scholar] [CrossRef] [PubMed]
- Salmo, I.C.; Sorbie, K.S.; Skauge, A.; Alzaabi, M.A. Immiscible Viscous Fingering: Modelling Unstable Water–Oil Displacement Experiments in Porous Media. Transp. Porous Media 2022, 145, 291–322. [Google Scholar] [CrossRef]
- Sorbie, K.S.; Al Ghafri, A.Y.; Skauge, A.; Mackay, E.J. On the Modelling of Immiscible Viscous Fingering in Two-Phase Flow in Porous Media. Transp. Porous Media 2020, 135, 331–359. [Google Scholar] [CrossRef]
- Beteta, A.; Sorbie, K.; Skauge, A.; Skauge, T. Viscous Crossflow as the Mechanism for Polymer Enhanced Oil Recovery in Viscous Oils: Evidence of Crossflow between Bypassed Oil and Viscous Fingers. Geoenergy Sci. Eng. 2025, 253, 213968. [Google Scholar] [CrossRef]
- Delamaide, E. Current Status of Polymer Flooding in Heavy Oil Fields: When Performances Beat Theory. In Proceedings of the SPE Western Regional Meeting, Garden Grove, CA, USA, 27 April–1 May 2025; p. SPE-224158-MS. [Google Scholar] [CrossRef]
- Ning, S.; Barnes, J.; Edwards, R.; Dunford, K.; Eastham, K.; Dandekar, A.; Zhang, Y.; Cercone, D.; Ciferno, J. First Ever Polymer Flood Field Pilot to Enhance the Recovery of Heavy Oils on Alaska’s North Slope—Polymer Injection Performance. In Proceedings of the 7th Unconventional Resources Technology Conference, Denver, CO, USA, 22–24 July 2019. [Google Scholar] [CrossRef]
- Dandekar, A.; Bai, B.; Barnes, J.; Cercone, D.; Ciferno, J.; Ning, S.; Seright, R.; Sheets, B.; Wang, D.; Zhang, Y. First Ever Polymer Flood Field Pilot—A Game Changer to Enhance the Recovery of Heavy Oils on Alaska’s North Slope. In Proceedings of the SPE Western Regional Meeting, San Jose, CA, USA, 23–26 April 2019; p. SPE-195257-MS. [Google Scholar] [CrossRef]
- Aitkulov, A.; Edwards, R.; Redwine, C.; Cunha, K. Milne Point Field Polymer Flood Update and Further Expansion. In Proceedings of the SPE Improved Oil Recovery Conference, Tulsa, OK, USA, 22–25 April 2024; p. SPE-218269-MS. [Google Scholar] [CrossRef]
- Delamaide, E. Pelican Lake: Learning from the Largest Polymer Flood Expansion in a Heavy Oil Field. In Proceedings of the Abu Dhabi International Petroleum Exhibition & Conference, Abu Dhabi, United Arab Emirates, 15–18 November 2021; p. SPE-208011-MS. [Google Scholar] [CrossRef]
- Delamaide, E. Review of Canadian Field Cases of Chemical Floods with Associative Polymer. In Proceedings of the SPE Improved Oil Recovery Conference, Virtual, 31 August–4 September 2020; p. SPE-200439-MS. [Google Scholar] [CrossRef]
- Mjeni, R.; Gharbi, M.; Lawati, S.; Dickson, S.-J.; Ismaili, A.R.; Hashmi, M.; Amri, I.; Belushi, K.; Farajzadeh, R.; Glasbergen, G.; et al. Nimr Polymer Project: The Results of Multi-Well Trial in the Medium-Heavy Oil Reservoir with Strong Bottom Aquifer. In Proceedings of the SPE Conference at Oman Petroleum & Energy Show, Muscat, Oman, 21–23 March 2022; p. SPE-200238-MS. [Google Scholar] [CrossRef]
- Sharma, A.K.; Upadhyay, S.; Mitra, S.; Meena, R.; Mavoori, R.S. India’s 1st Polymer Flood Scheme Implementation from Laboratory to Field in Heavy Oil Having Strong Aquifer. In Proceedings of the ADIPEC, Abu Dhabi, United Arab Emirates, 2–5 October 2023; p. SPE-216551-MS. [Google Scholar] [CrossRef]
- Juri, J.E.; Serrano, V.; Guillen, P.; Campos, H.; Zurletti, A.; Martinez, D.; Ruiz, A. Enhanced Fill-Up Response and Recovery with Secondary Polymer Injection vs. Tertiary Polymer Injection: A Field-Scale Pilot. In Proceedings of the SPE Improved Oil Recovery Conference, Tulsa, OK, USA, 22–25 April 2024; p. SPE-218204-MS. [Google Scholar] [CrossRef]
- Wang, J.; Dong, M. A Laboratory Study of Polymer Flooding for Improving Heavy Oil Recovery. In Proceedings of the Canadian International Petroleum Conference, Calgary, AB, Canada, 12–14 June 2007. [Google Scholar] [CrossRef]
- Wang, J.; Dong, M. Optimum Effective Viscosity of Polymer Solution for Improving Heavy Oil Recovery. J. Pet. Sci. Eng. 2009, 67, 155–158. [Google Scholar] [CrossRef]
- Skauge, A.; Shaker Shiran, B.; Ormehaug, P.A.; Santanach Carreras, E.; Klimenko, A.; Levitt, D. X-Ray CT Investigation of Displacement Mechanisms for Heavy Oil Recovery by Low Concentration HPAM Polymers. In Proceedings of the SPE Improved Oil Recovery Conference, Virtual, 31 August–4 September 2020; p. SPE-200461-MS. [Google Scholar] [CrossRef]
- American Petroleum Institute. Recommended Practices for Evaluation of Polymers Used in Enhanced Oil Recovery Operations; API RP 63; American Petroleum Institute: Washington, DC, USA, 1990. [Google Scholar]
- Knight, B.L.; Rhudy, J.S. Recovery of High-Viscosity Crudes By Polymer Flooding. J. Can. Pet. Technol. 1977, 16, PETSOC-77-04-07. [Google Scholar] [CrossRef]
- Clarke, A.; Howe, A.M.; Mitchell, J.; Staniland, J.; Hawkes, L.; Leeper, K. Mechanism of Anomalously In-creased Oil Displacement with Aqueous Viscoelastic Polymer Solutions. Soft Matter 2015, 11, 3536–3541. [Google Scholar] [CrossRef] [PubMed]
- Chauveteau, G. Molecular Interpretation of Several Different Properties of Flow of Coiled Polymer Solutions Through Porous Media in Oil Recovery Conditions. In Proceedings of the SPE Annual Technical Conference and Exhibition, San Antonio, TX, USA, 4–7 October 1981; p. SPE-10060-MS. [Google Scholar] [CrossRef]
- Naar, J.; Wygal, R.J.; Henderson, J.H. Imbibition Relative Permeability in Unconsolidated Porous Media. Soc. Pet. Eng. J. 1962, 2, 13–17. [Google Scholar] [CrossRef]
- Willhite, G.P. Waterflooding; Society of Petroleum Engineers: Richardson, TX, USA, 1986; ISBN 978-1-55563-005-8. [Google Scholar]
- Salter, S.J.; Mohanty, K.K. Multiphase Flow in Porous Media: I. Macroscopic Observations and Modeling. In Proceedings of the SPE Annual Technical Conference and Exhibition, New Orleans, LA, USA, 26–29 September 1982; p. SPE-11017-MS. [Google Scholar]
- Beteta, A.; Sorbie, K.S.; Skauge, A.; Skauge, T. Immiscible Viscous Fingering: The Effects of Wettability/Capillarity and Scaling. Transp. Porous Media 2024, 151, 85–118. [Google Scholar] [CrossRef]
- Doorwar, S.; Mohanty, K.K. Viscous Fingering During Non-Thermal Heavy Oil Recovery. In Proceedings of the SPE Annual Technical Conference and Exhibition, Denver, CO, USA, 30 October–2 November 2011; p. SPE-146841-MS. [Google Scholar] [CrossRef]
- Mohanty, K.K.; Salter, S.J. Multiphase Flow in Porous Media: III. Oil Mobilization, Transverse Dispersion, and Wettability. In Proceedings of the SPE Annual Technical Conference and Exhibition, San Francisco, CA, USA, 5–8 October 1983; p. SPE12127-MS. [Google Scholar] [CrossRef]
- Bourgeois, M.J.; Cottin, C.; Morel, D.; Hy-Billiot, J.; Hourcq, S.; Lassalle, S.; N’guyen, M. Reduced Residual Oil Saturation for Secondary and Early Tertiary Polymer Floods Obtained in the Laboratory. In Proceedings of the IOR-2017—19th European Symposium on Improved Oil Recovery, Stavanger, Norway, 24–27 April 2017; Volume 2017, pp. 1–12. [Google Scholar] [CrossRef]
- Delamaide, E. Comparison of Primary, Secondary and Tertiary Polymer Flood in Heavy Oil—Field Results. In Proceedings of the SPE Trinidad and Tobago Section Energy Resources Conference, Port of Spain, Trinidad and Tobago, 13–15 June 2016; p. SPE-180852-MS. [Google Scholar] [CrossRef]
- Beteta, A.; Sorbie, K.S.; McIver, K.; Johnson, G.; Gasimov, R.; Van Zeil, W. The Role of Immiscible Fingering on the Mechanism of Secondary and Tertiary Polymer Flooding of Viscous Oil. Transp. Porous Media 2022, 143, 343–372. [Google Scholar] [CrossRef]

| Parameter | BEN03 | BEN04 | BEN05 | BEN06 | BEN07 | BEN08 | BEN09 | BEN10 |
|---|---|---|---|---|---|---|---|---|
| length [cm] | 15.10 | 14.93 | 14.30 | 15.10 | 14.62 | 14.91 | 14.83 | 15.14 |
| diameter [cm] | 3.80 | 3.73 | 3.73 | 3.78 | 3.80 | 3.72 | 3.79 | 3.80 |
| PV [mL] | 40.75 | 36.78 | 35.03 | 39.77 | 38.41 | 36.51 | 37.54 | 37.75 |
| porosity [%] | 23.9 | 22.6 | 22.4 | 23.6 | 23.2 | 22.5 | 22.5 | 22.0 |
| [Fraction] | 0.11 | 0.12 | 0.11 | 0.11 | 0.12 | 0.14 | 0.12 | 0.11 |
| ) [mD] | 1541 | 2494 | 2277 | 1446 | 1891 | 2351 | 1690 | 1615 |
| ) 1 [mD] | 1145 | 2496 | 2267 | 1225 | 1594 | 2215 | 1619 | — |
| Core ID | Injected Polymer | [fraction] | Recovery Factor [%OOIP] | |||
|---|---|---|---|---|---|---|
| Concentration [ppm] | Viscosity * [cP] | Water Flood | Polymer Flood | Final | ||
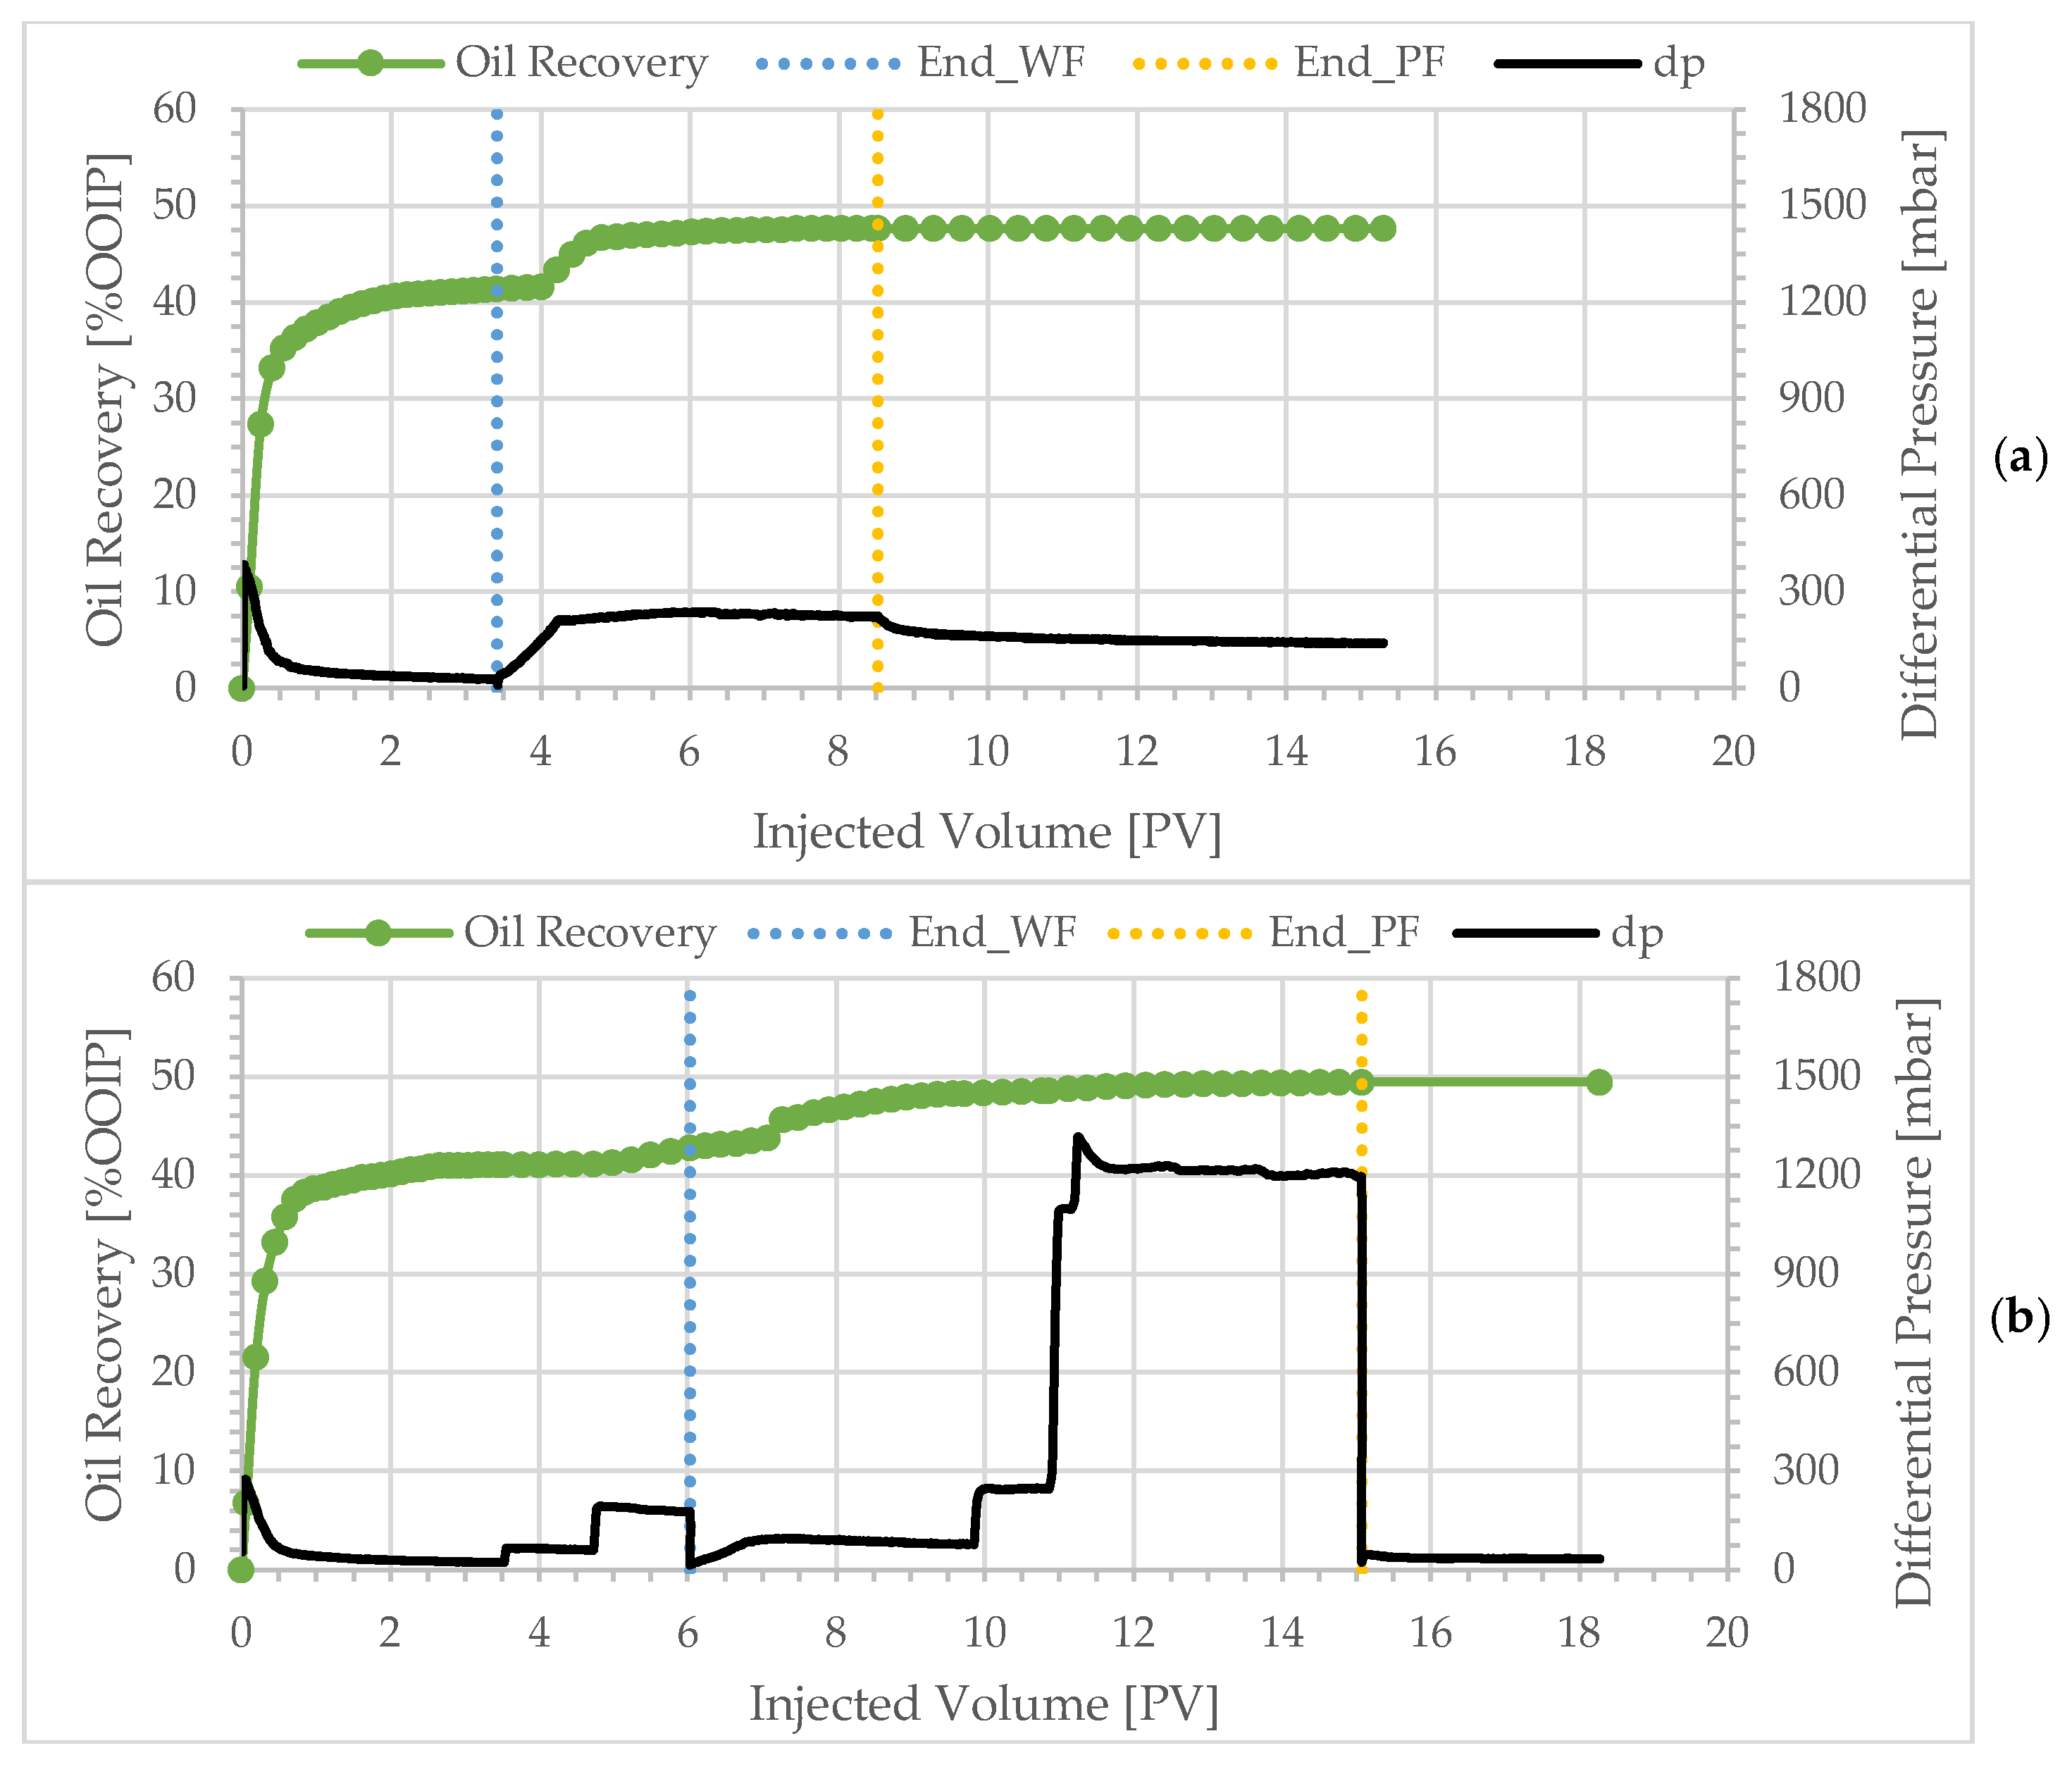
| BEN05 | 600 | 10.0 | 0.11 | 41.2 | 8.0 | 49.2 |
| BEN04 | 250 | 4.10 | 0.12 | 40.5 | 7.2 | 47.7 |
| BEN03 | 140 | 2.53 | 0.11 | 38.0 | 8.1 | 46.5 |
| BEN06 | 70 | 1.80 | 0.11 | 41.4 | 7.1 | 48.5 |
| BEN08 | 40 | 1.35 | 0.14 | 40.4 | 5.5 | 45.9 |
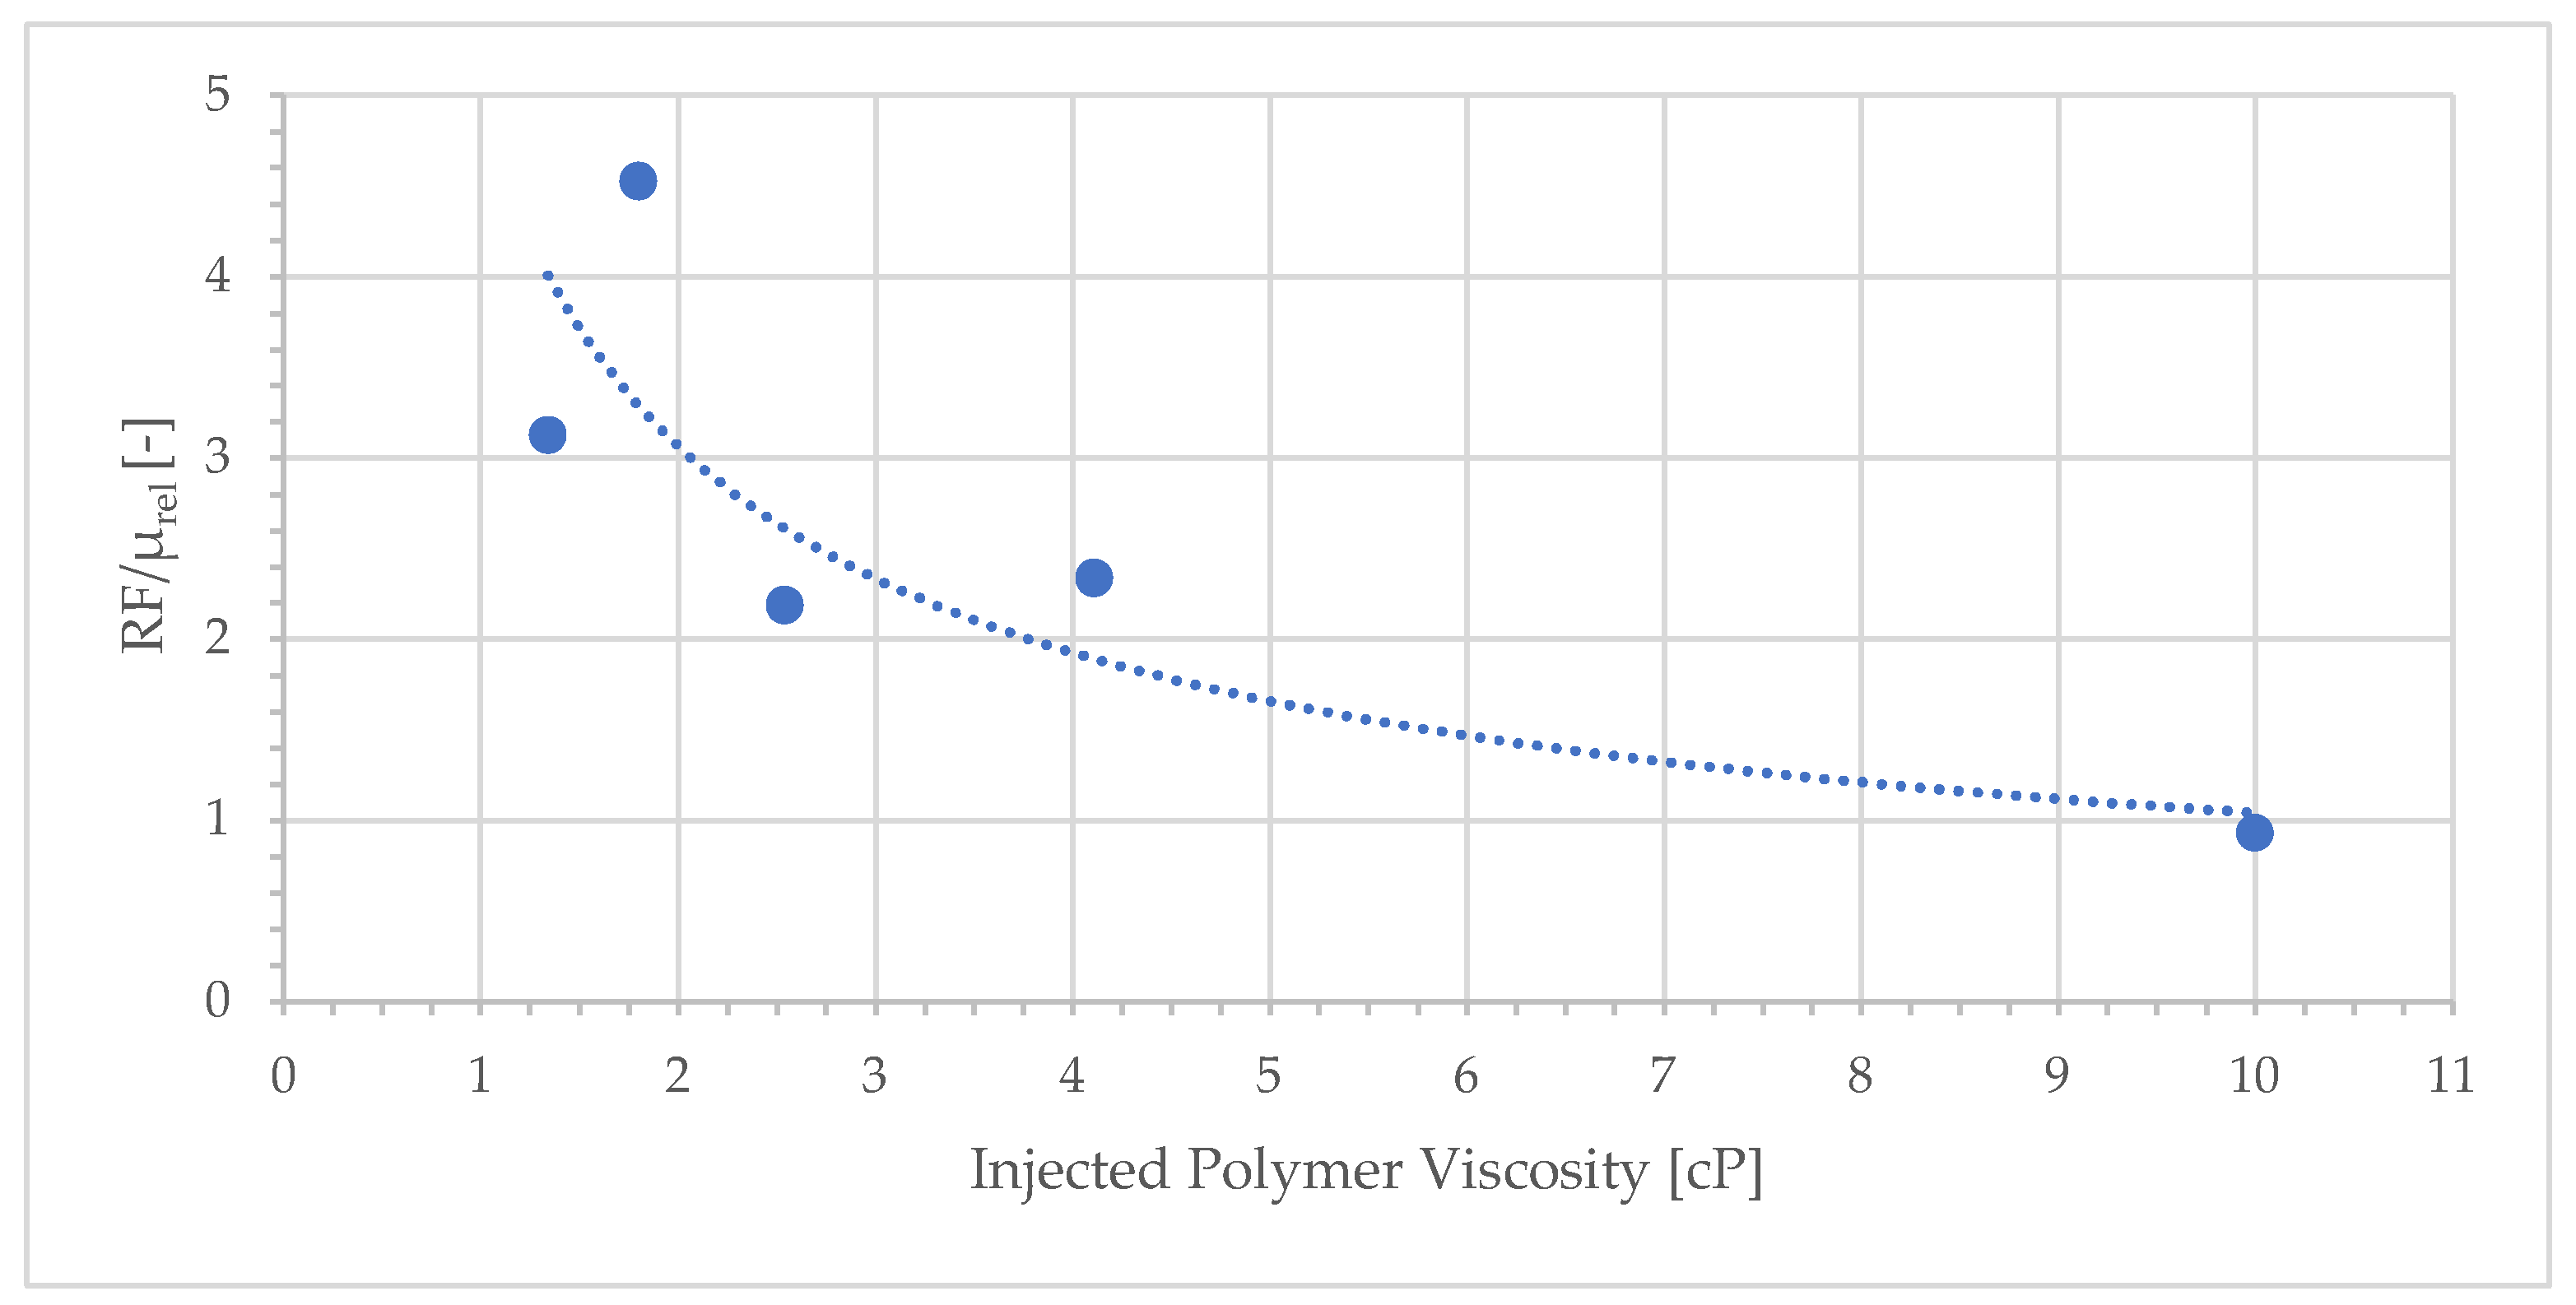
| Core ID | Conc. [ppm] | µrel (p/w) [cP/cP] | ΔPp [mbar] | ΔPw,prior [mbar] | RF [mbar/mbar] | RF/µrel [-] | Apparent Viscosity [cP] |
|---|---|---|---|---|---|---|---|
| BEN05 | 600 | 9.8 | 230 | 25 | 9.2 | 0.9 | 9.4 |
| BEN04 | 250 | 4.0 | 199 | 21 | 9.5 | 2.4 | 9.7 |
| BEN03 | 140 | 2.4 | 130 | 24 | 5.4 | 2.2 | 5.5 |
| BEN06 | 70 | 1.8 | 225 | 28 | 8.0 | 4.6 | 8.2 |
| BEN08 | 40 | 1.3 | 72 | 17 | 4.1 | 3.1 | 4.2 |
| Core ID | Injected Viscosity [cP] | [Fraction] | Recovery Factor [%OOIP] | ||
|---|---|---|---|---|---|
| Water Flood | Polymer Flood | Final | |||
| BEN06 | 1.80 | 0.11 | 41.4 | 7.1 | 48.5 |
| BEN07 * | 1.80 | 0.12 | 42.8 | 6.7 | 49.5 |
| Core ID | Injected Viscosity [cP] | [Fraction] | Recovery Factor [%OOIP] | ||
|---|---|---|---|---|---|
| Water Flood | Polymer Flood | Final | |||
| BEN04 aged | 4.10 | 0.12 | 40.5 | 7.2 | 47.7 |
| BEN10 ww | 4.10 | 0.11 | 40.7 | 5.6 | 46.3 |
| Core ID | Injected Viscosity [cP] | [Fraction] | Recovery Factor [%OOIP] | ||
|---|---|---|---|---|---|
| Water Flood | Polymer Flood | Final | |||
| BEN04 (ter.) | 4.10 | 0.12 | 40.5 | 7.2 | 47.7 |
| BEN09 (sec.) | 4.10 | 0.12 | - | 64.8 | 64.8 |
Disclaimer/Publisher’s Note: The statements, opinions and data contained in all publications are solely those of the individual author(s) and contributor(s) and not of MDPI and/or the editor(s). MDPI and/or the editor(s) disclaim responsibility for any injury to people or property resulting from any ideas, methods, instructions or products referred to in the content. |
© 2025 by the authors. Licensee MDPI, Basel, Switzerland. This article is an open access article distributed under the terms and conditions of the Creative Commons Attribution (CC BY) license (https://creativecommons.org/licenses/by/4.0/).
Share and Cite
Murad, A.; Skauge, A.; Shaker Shiran, B.; Skauge, T.; Klimenko, A.; Santanach-Carreras, E.; Jouenne, S. Impact of Adverse Mobility Ratio on Oil Mobilization by Polymer Flooding. Polymers 2025, 17, 2033. https://doi.org/10.3390/polym17152033
Murad A, Skauge A, Shaker Shiran B, Skauge T, Klimenko A, Santanach-Carreras E, Jouenne S. Impact of Adverse Mobility Ratio on Oil Mobilization by Polymer Flooding. Polymers. 2025; 17(15):2033. https://doi.org/10.3390/polym17152033
Chicago/Turabian StyleMurad, Abdulmajeed, Arne Skauge, Behruz Shaker Shiran, Tormod Skauge, Alexandra Klimenko, Enric Santanach-Carreras, and Stephane Jouenne. 2025. "Impact of Adverse Mobility Ratio on Oil Mobilization by Polymer Flooding" Polymers 17, no. 15: 2033. https://doi.org/10.3390/polym17152033
APA StyleMurad, A., Skauge, A., Shaker Shiran, B., Skauge, T., Klimenko, A., Santanach-Carreras, E., & Jouenne, S. (2025). Impact of Adverse Mobility Ratio on Oil Mobilization by Polymer Flooding. Polymers, 17(15), 2033. https://doi.org/10.3390/polym17152033