
Ultra-Stable, Conductive, and Porous P-Phenylenediamine-Aldehyde-Ferrocene Micro/Nano Polymer Spheres for High-Performance Supercapacitors with Positive Electrodes

 ,
, 
Abstract
1. Introduction
2. Materials and Methods
2.1. Experimental Material
2.2. Preparation of Poly-Schiff Base Ferrocene
2.3. Preparation of Working Electrode
2.4. Methods for Characterizing Material Structure and Morphology
2.4.1. Fourier Transform Infrared Spectrometer (FT-IR)
2.4.2. X-Ray Diffraction (XRD)
2.4.3. Scanning Electron Microscope (SEM)
2.5. Electrochemical Performance Testing
3. Results and Discussion
3.1. FT-IR Results
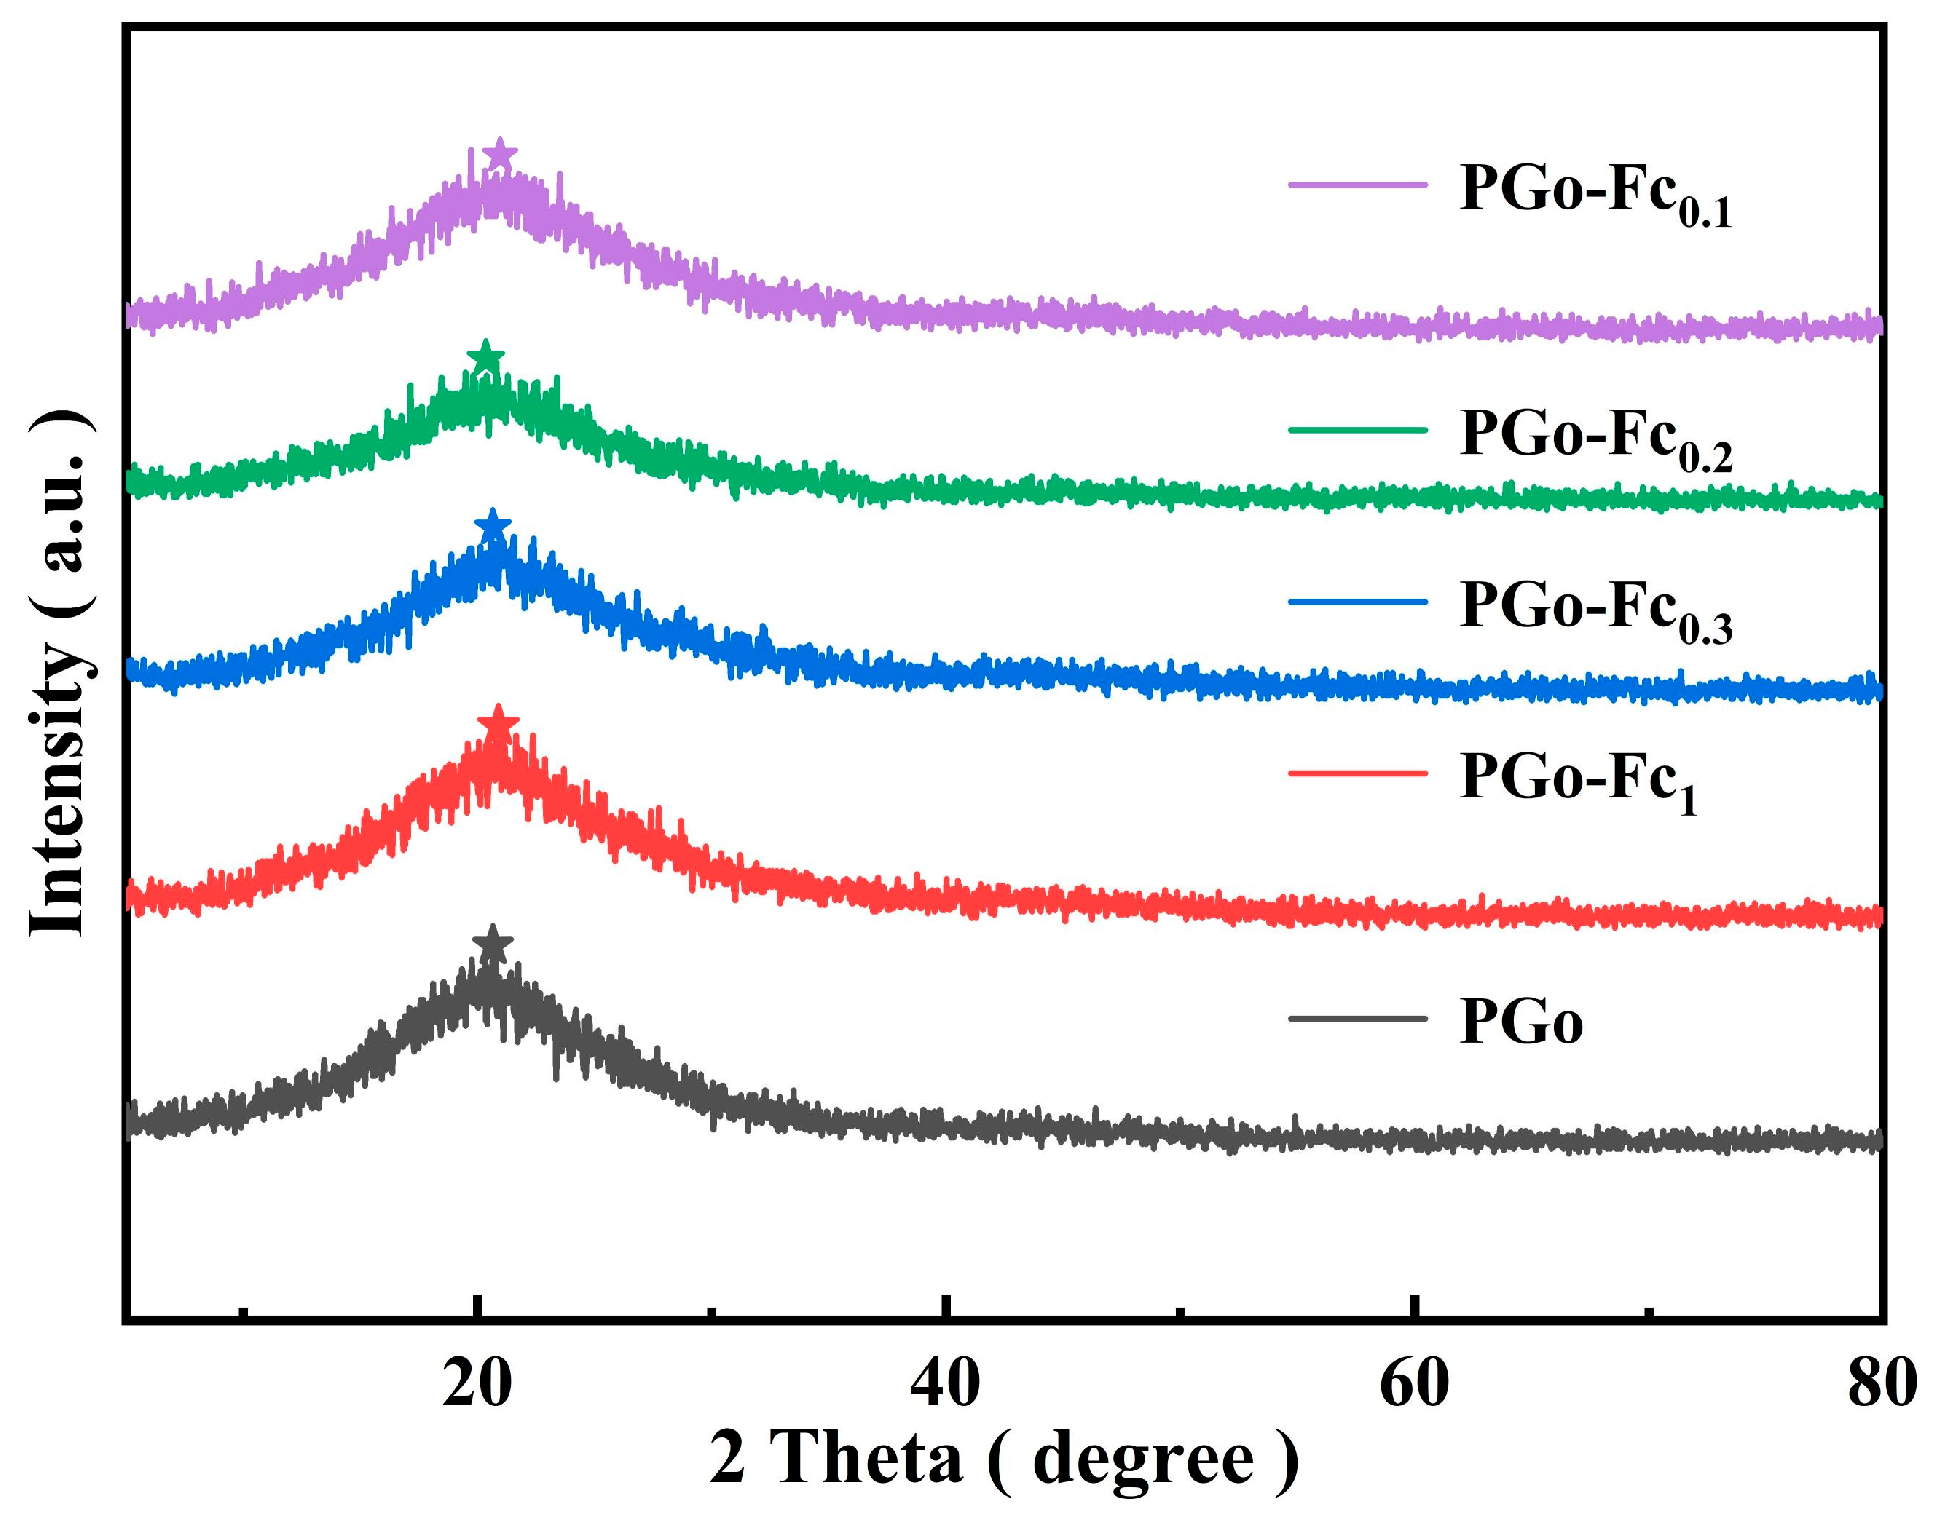
3.2. XRD Results
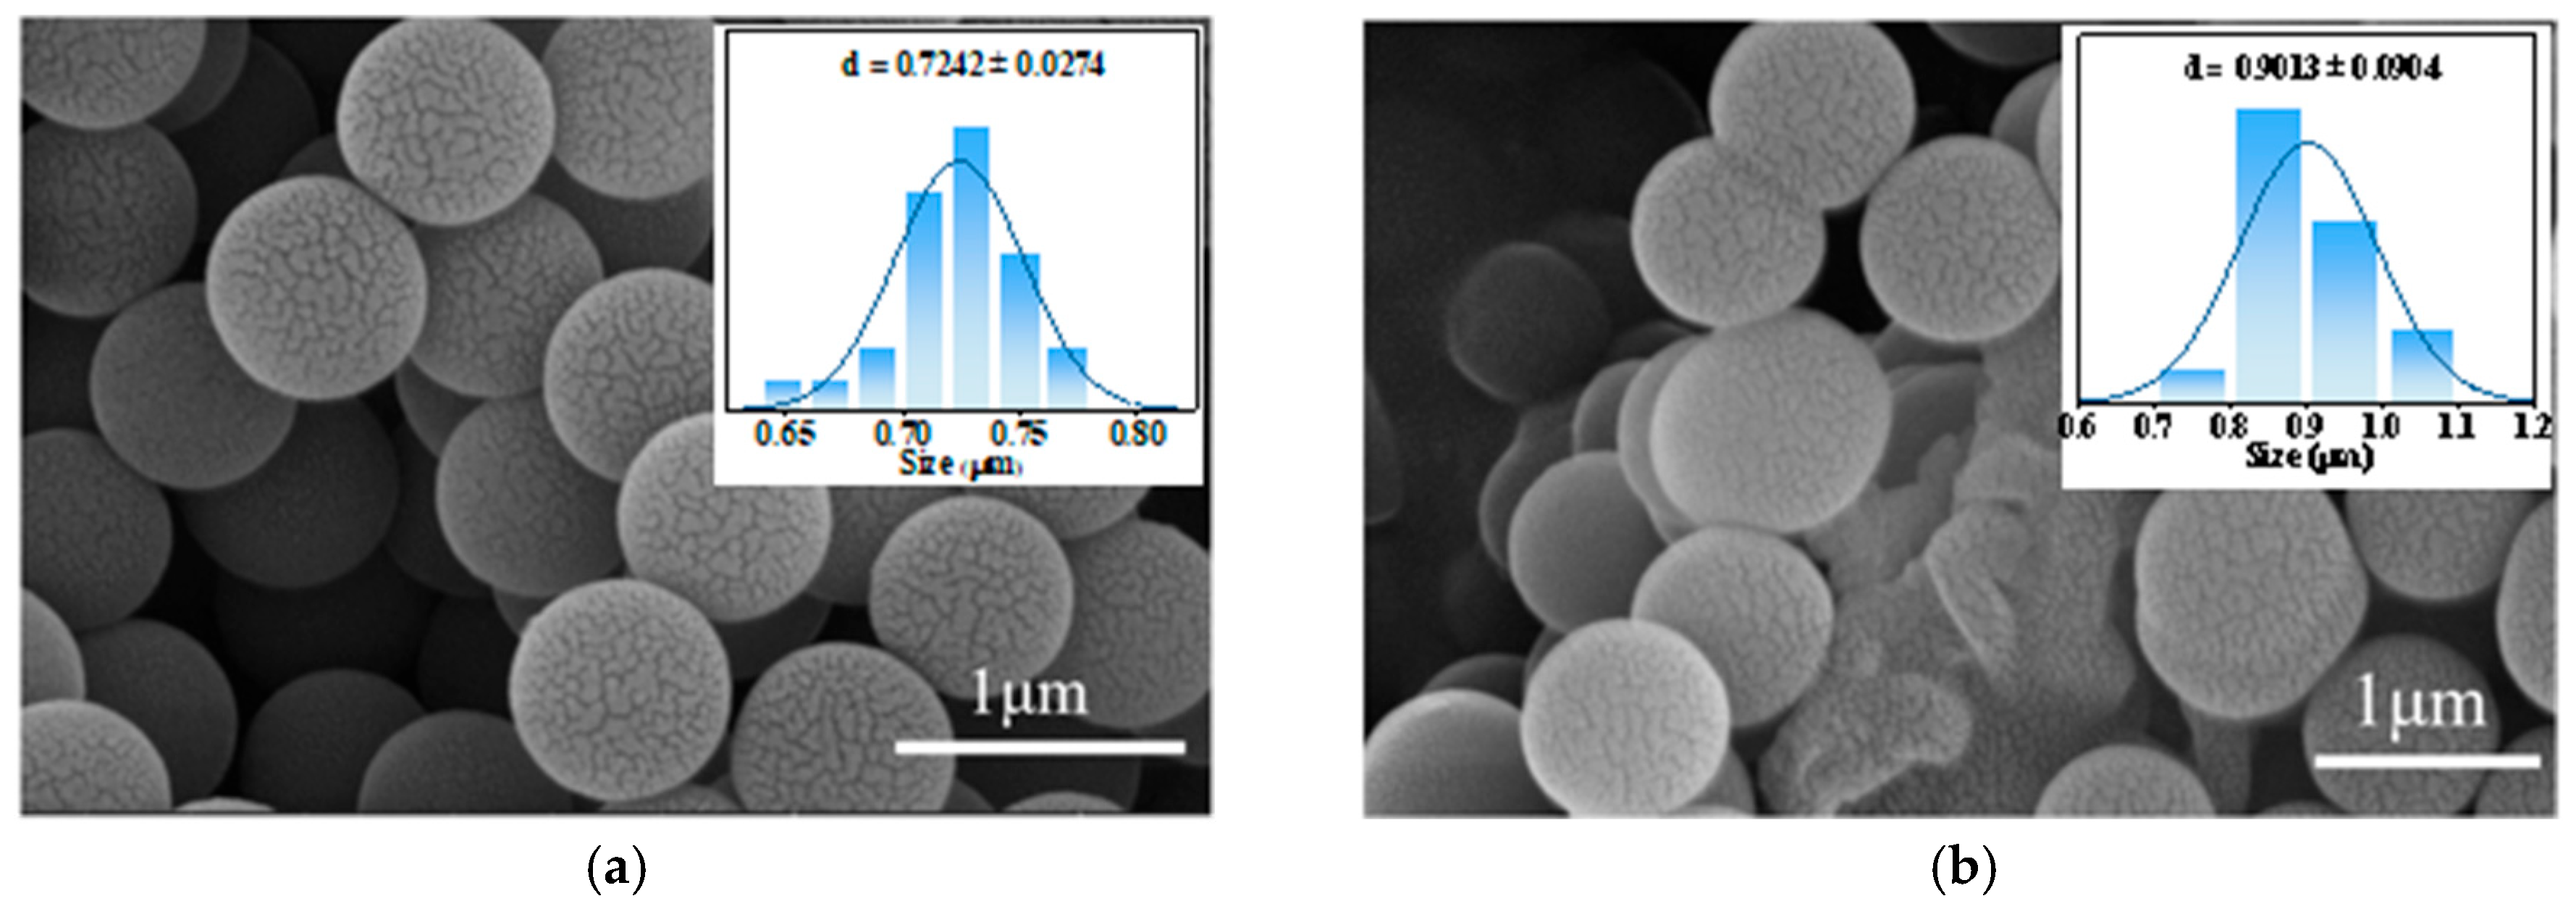
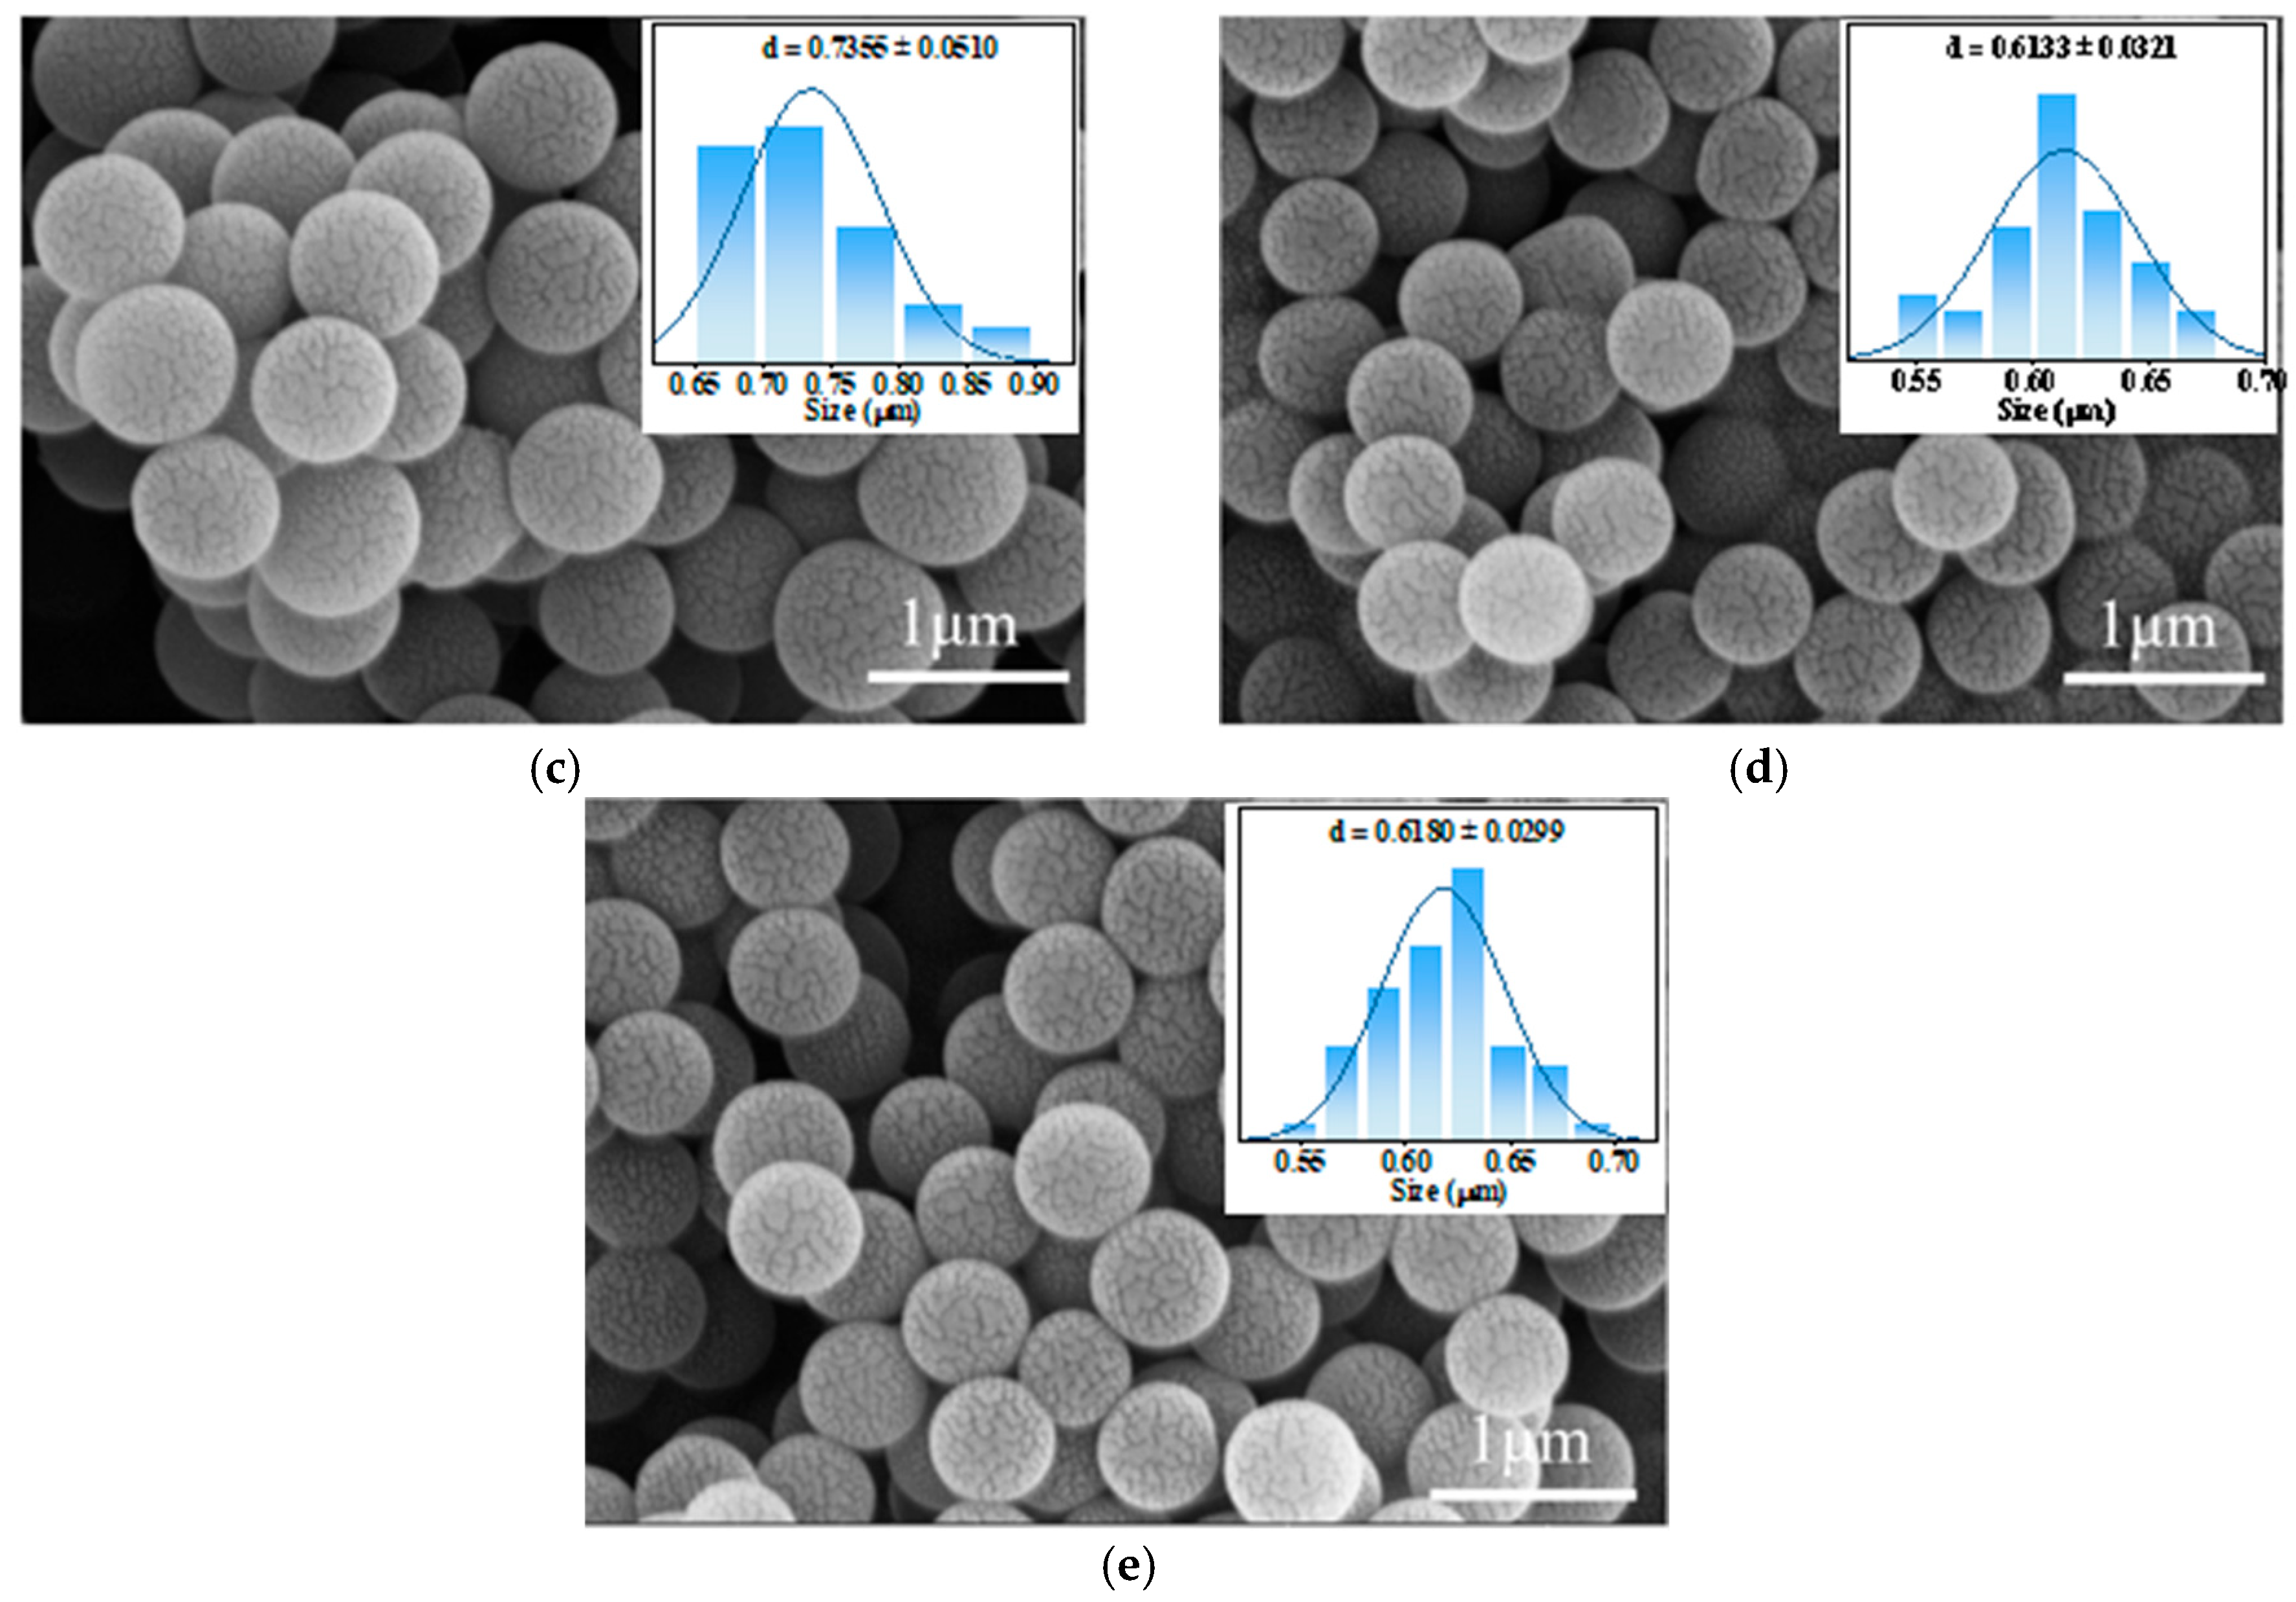
3.3. SEM Results
3.4. Electrochemical Characterization of PGo-Fcx
3.4.1. CV Results
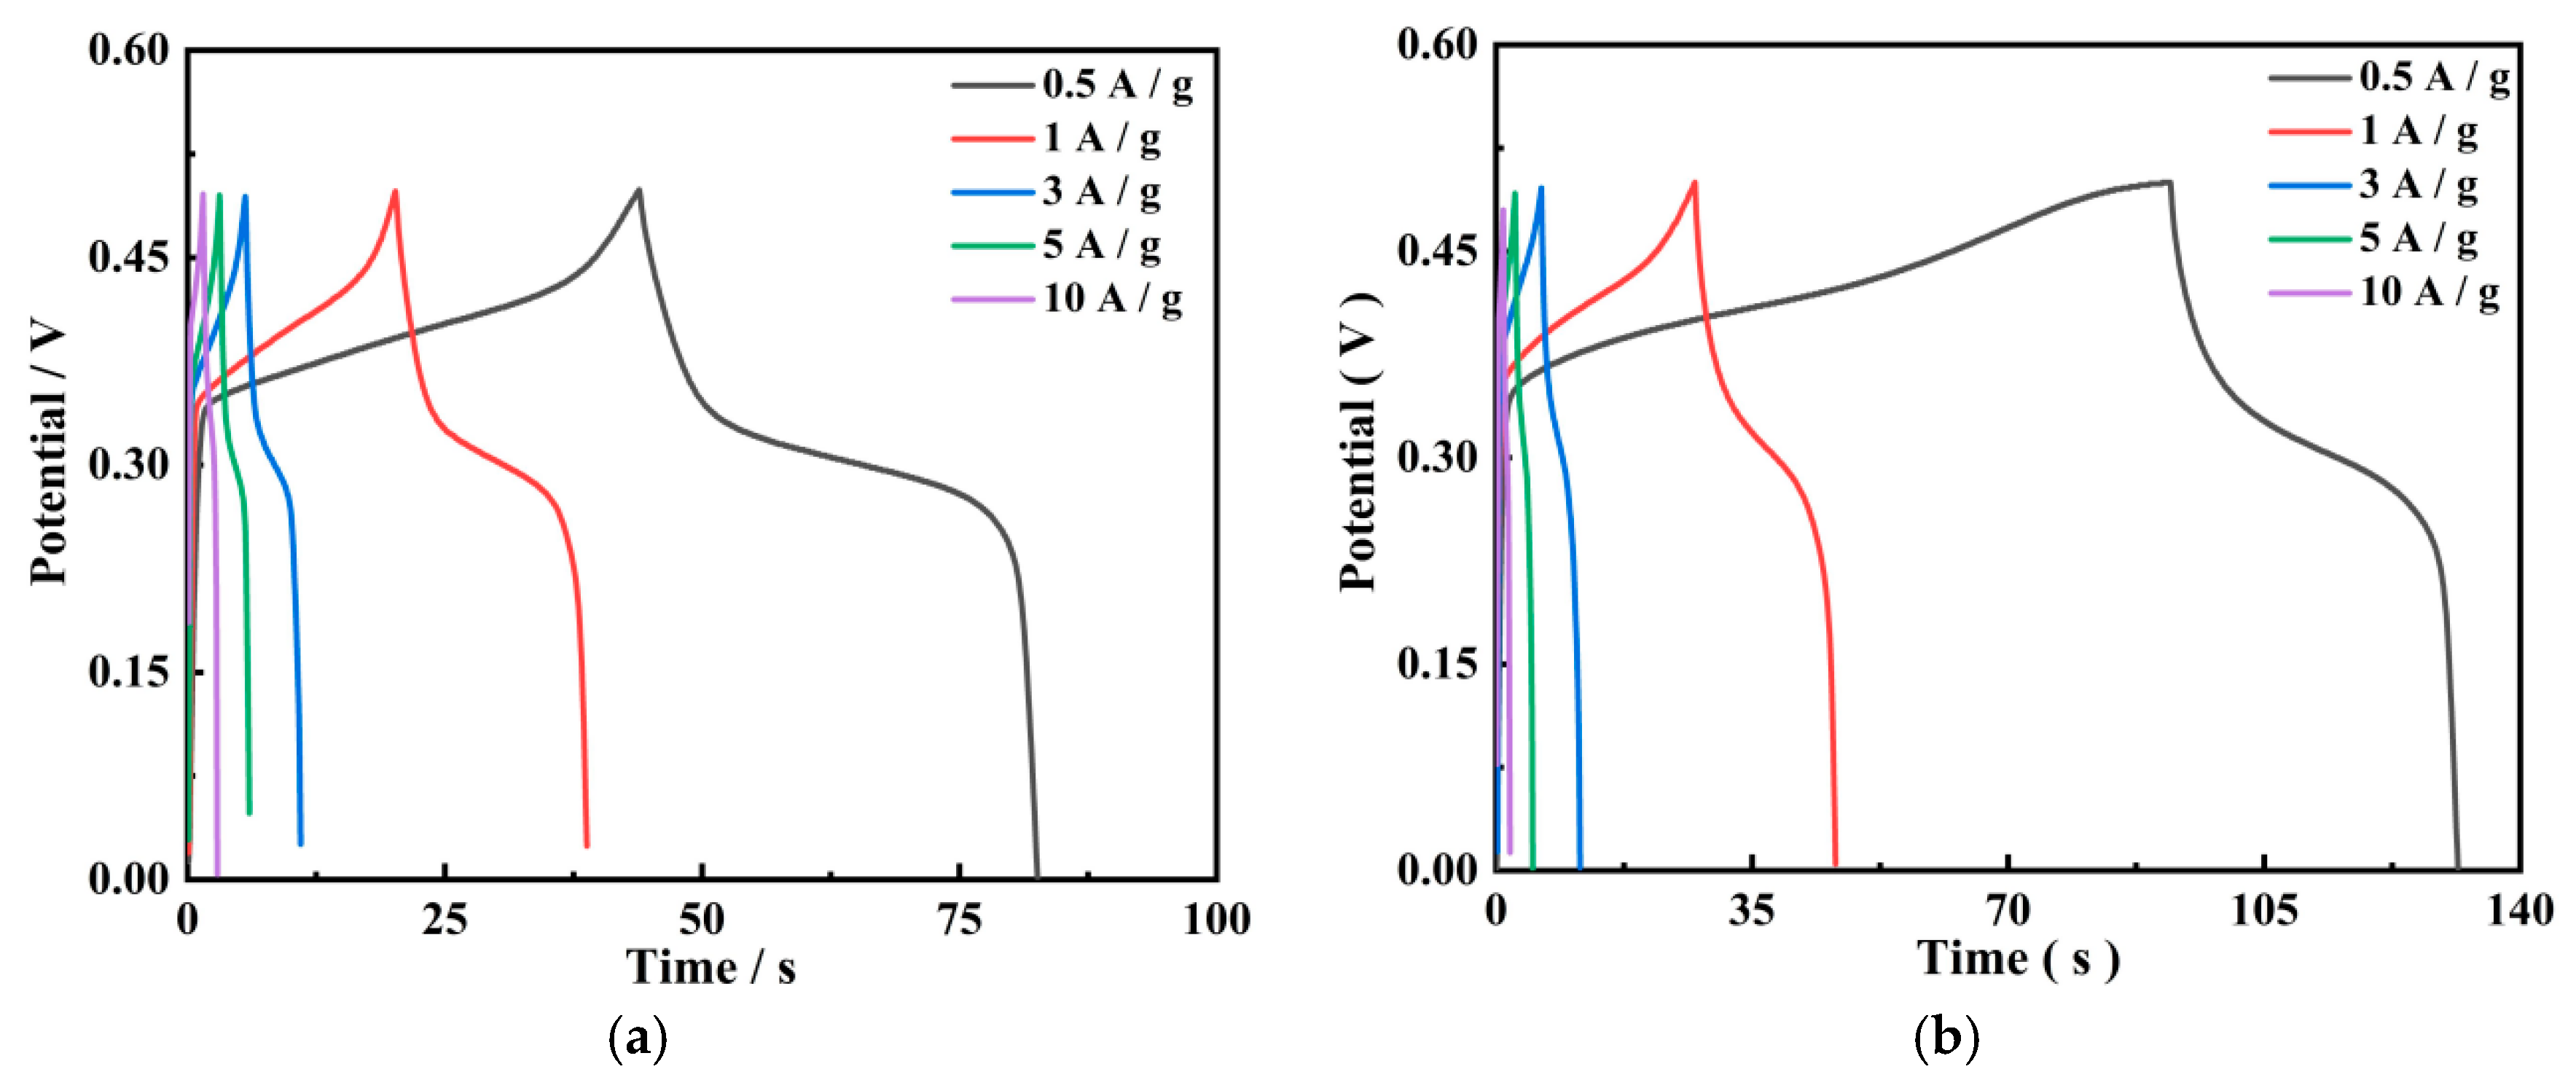
3.4.2. GCD Results
3.4.3. EIS Results
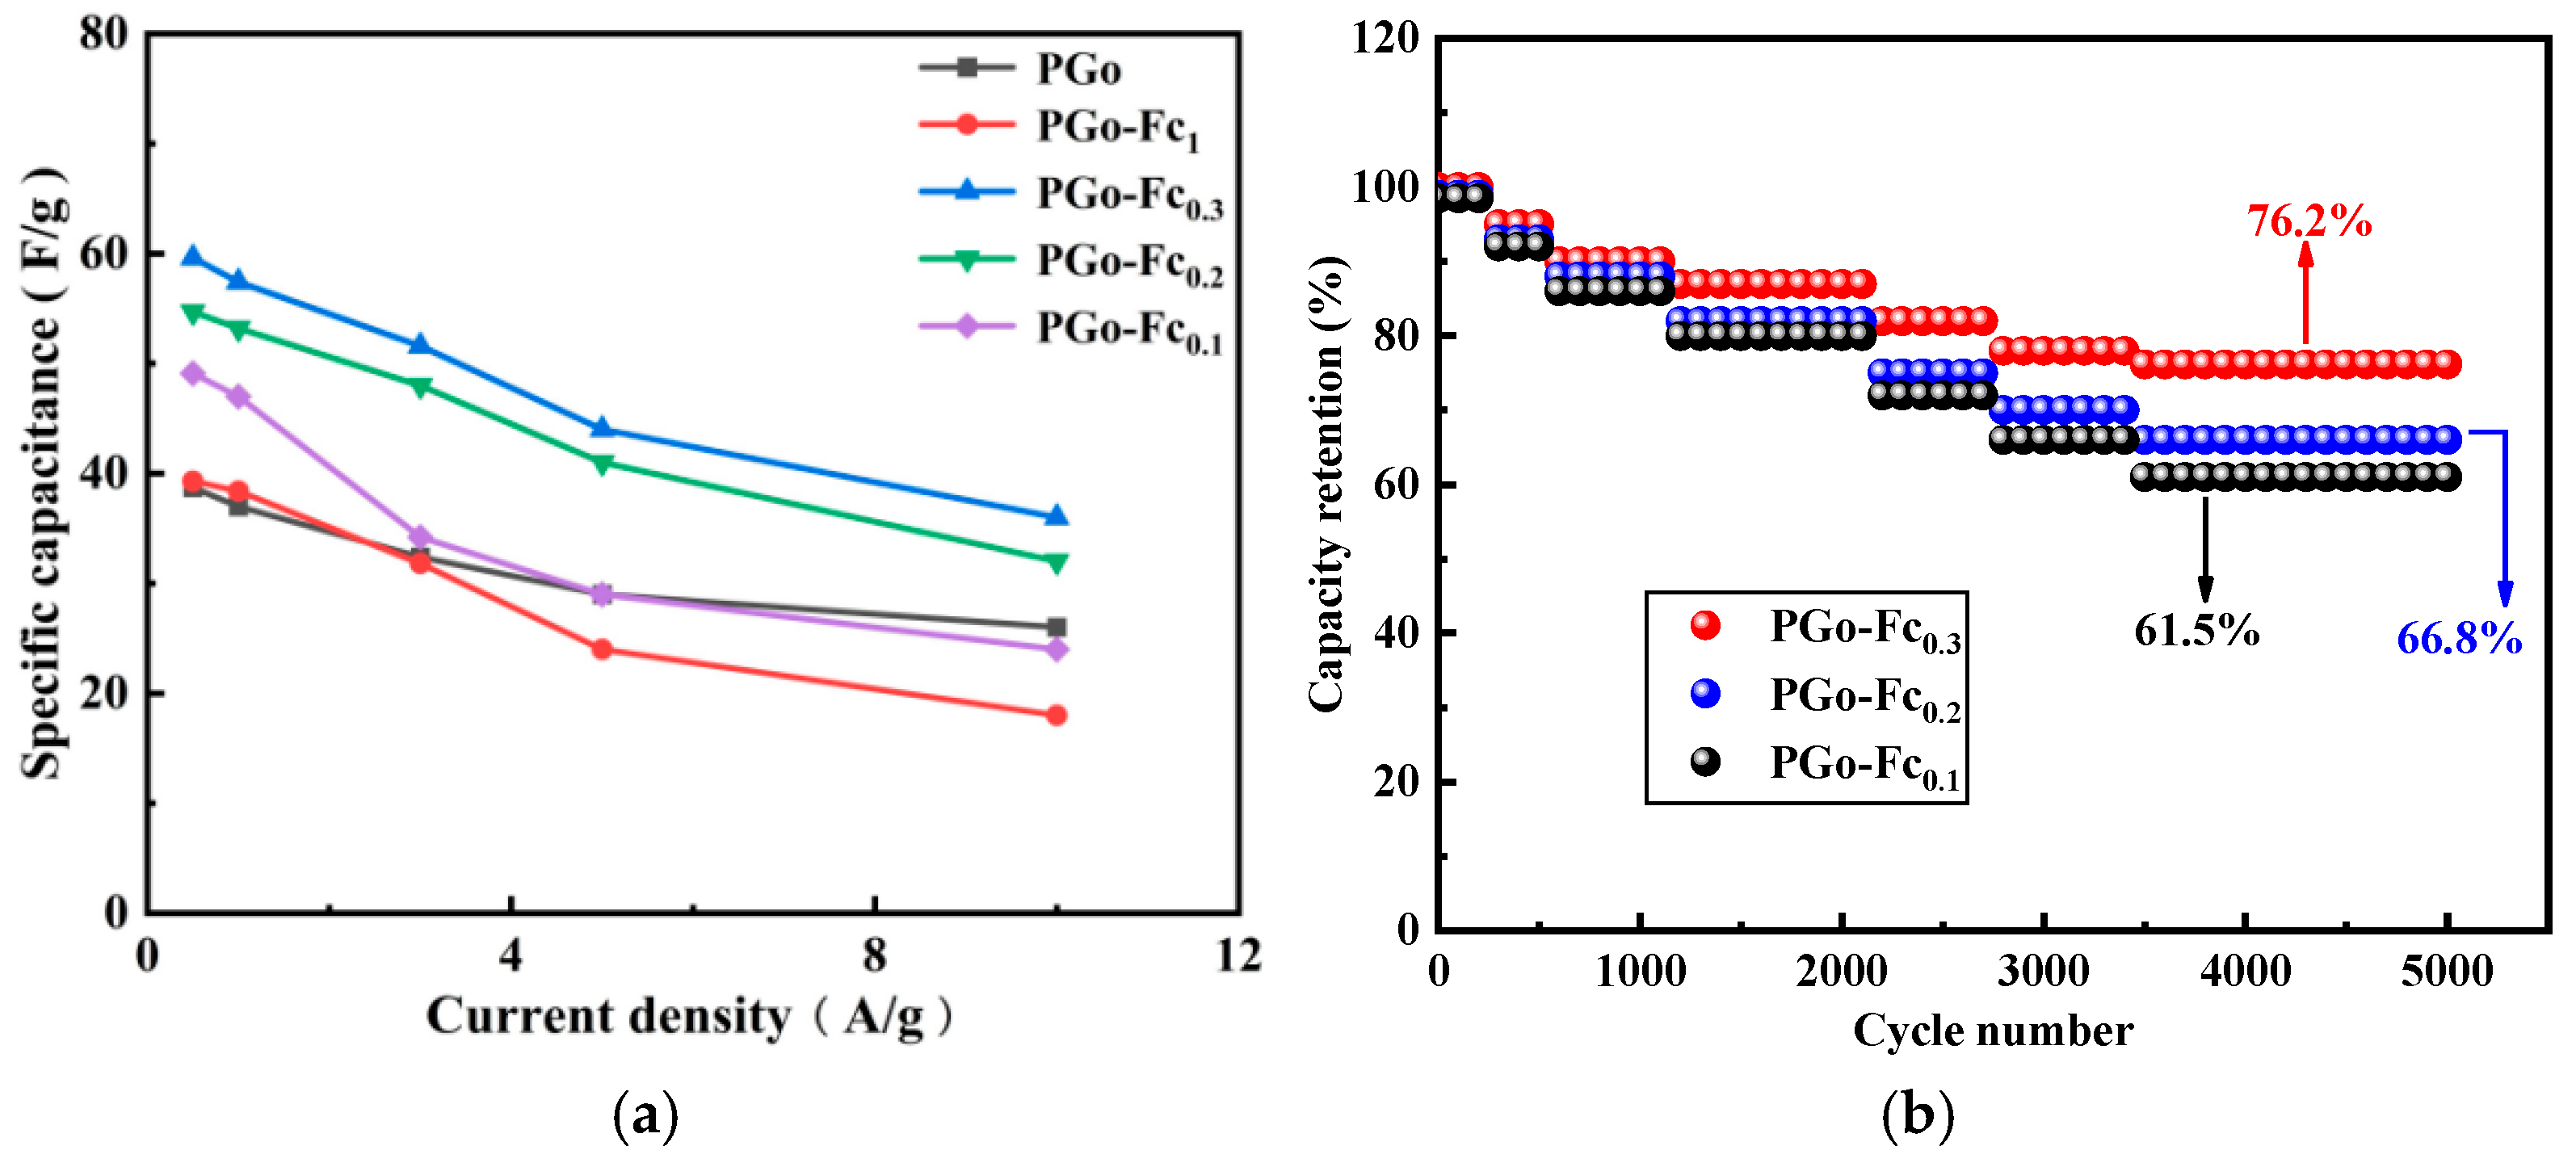
3.4.4. Rate and Cycle Performance
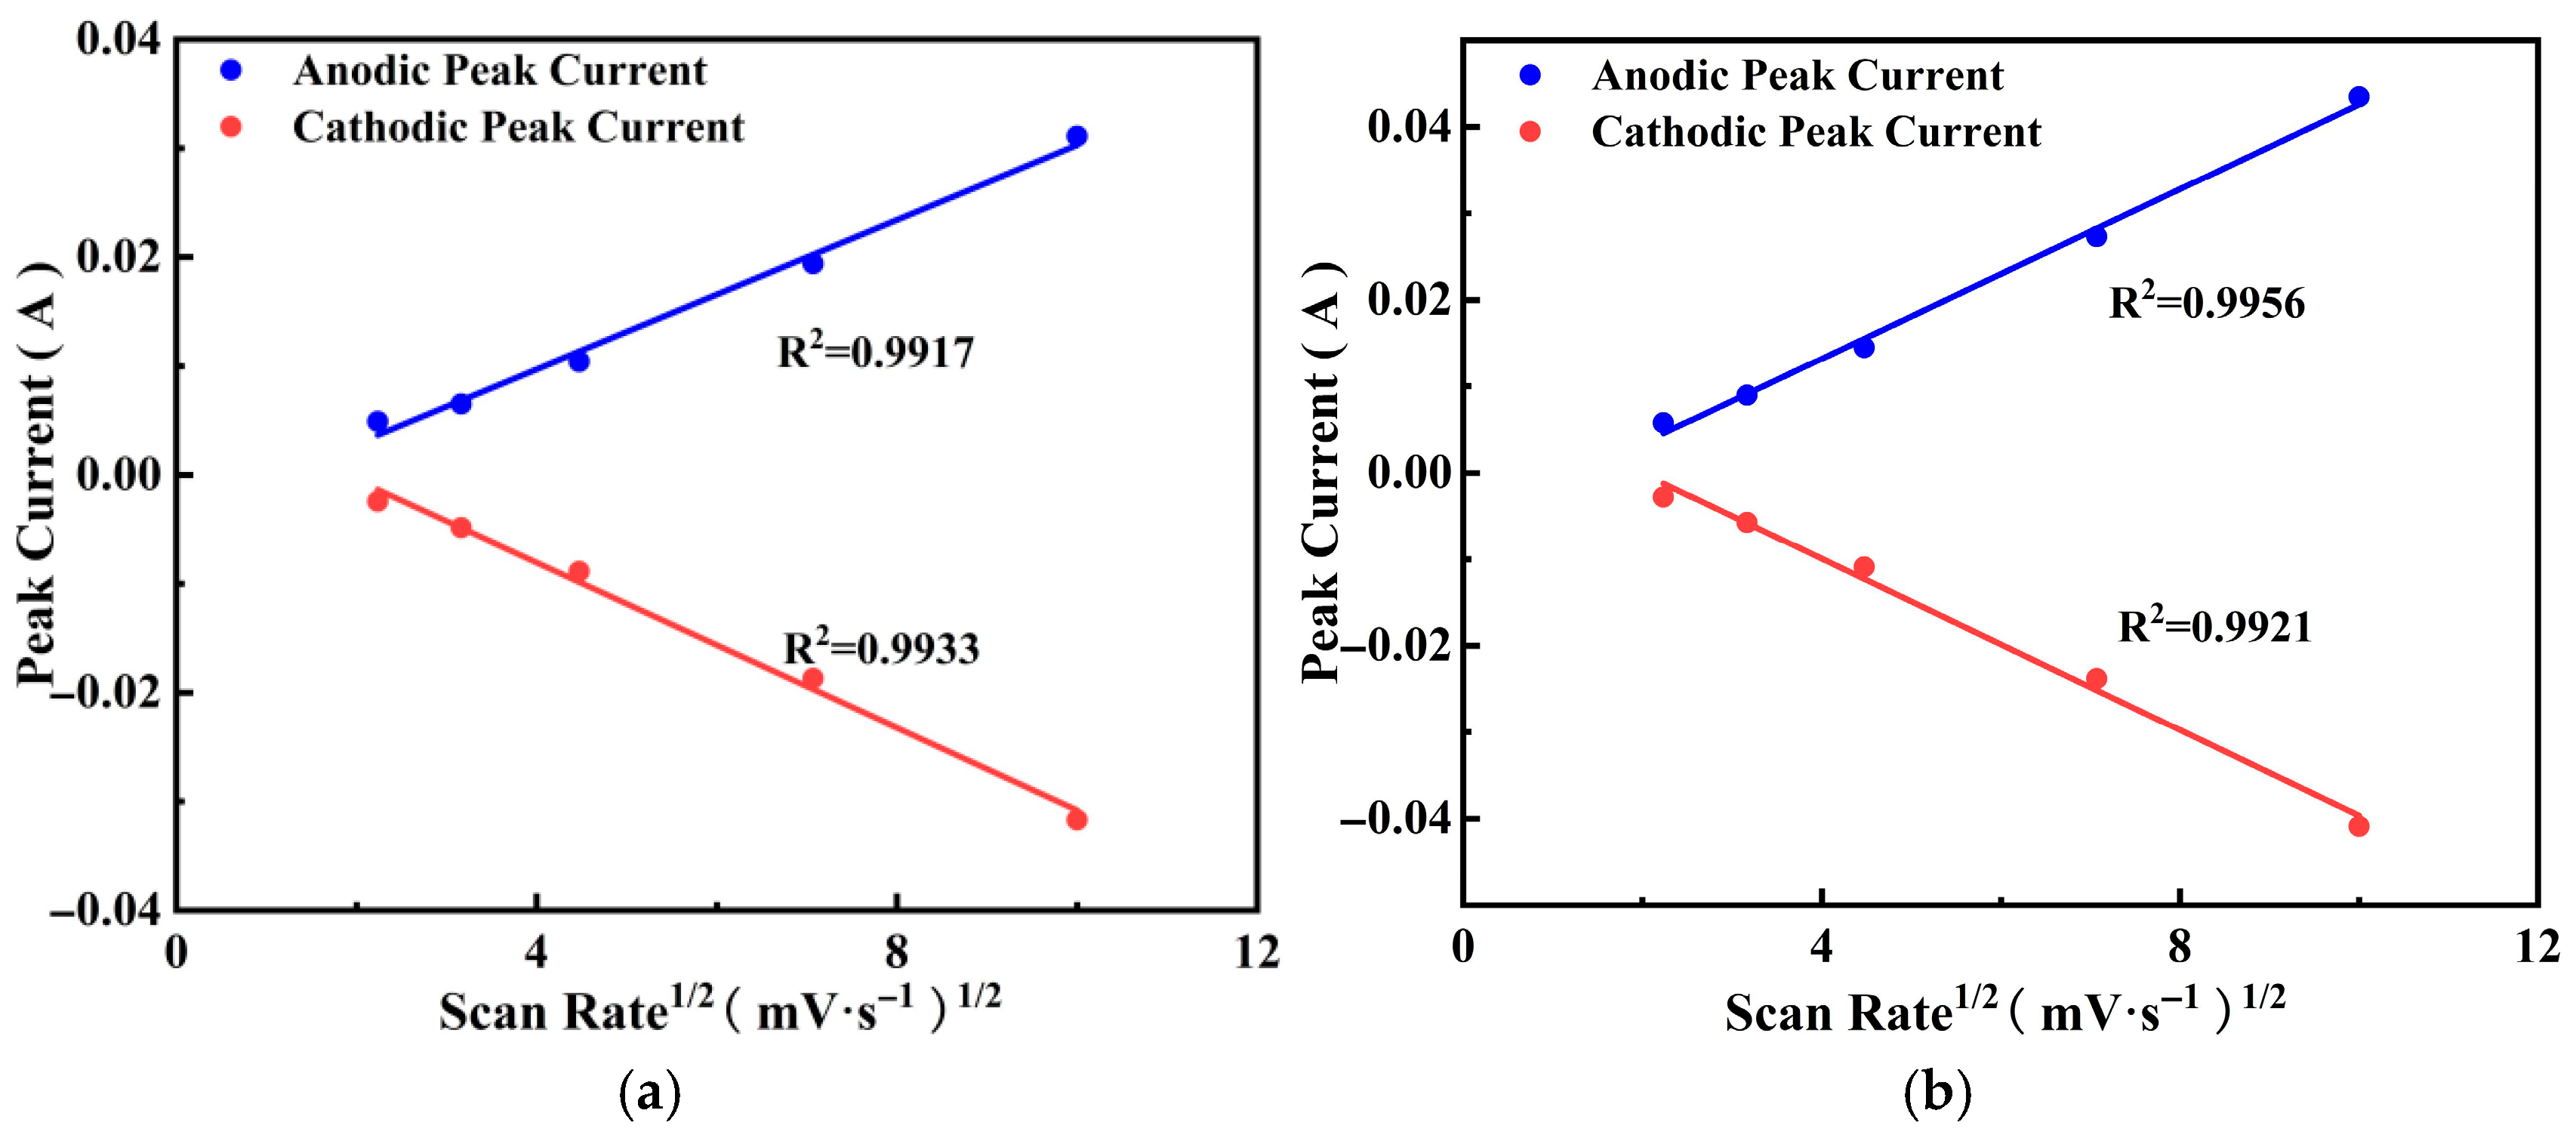
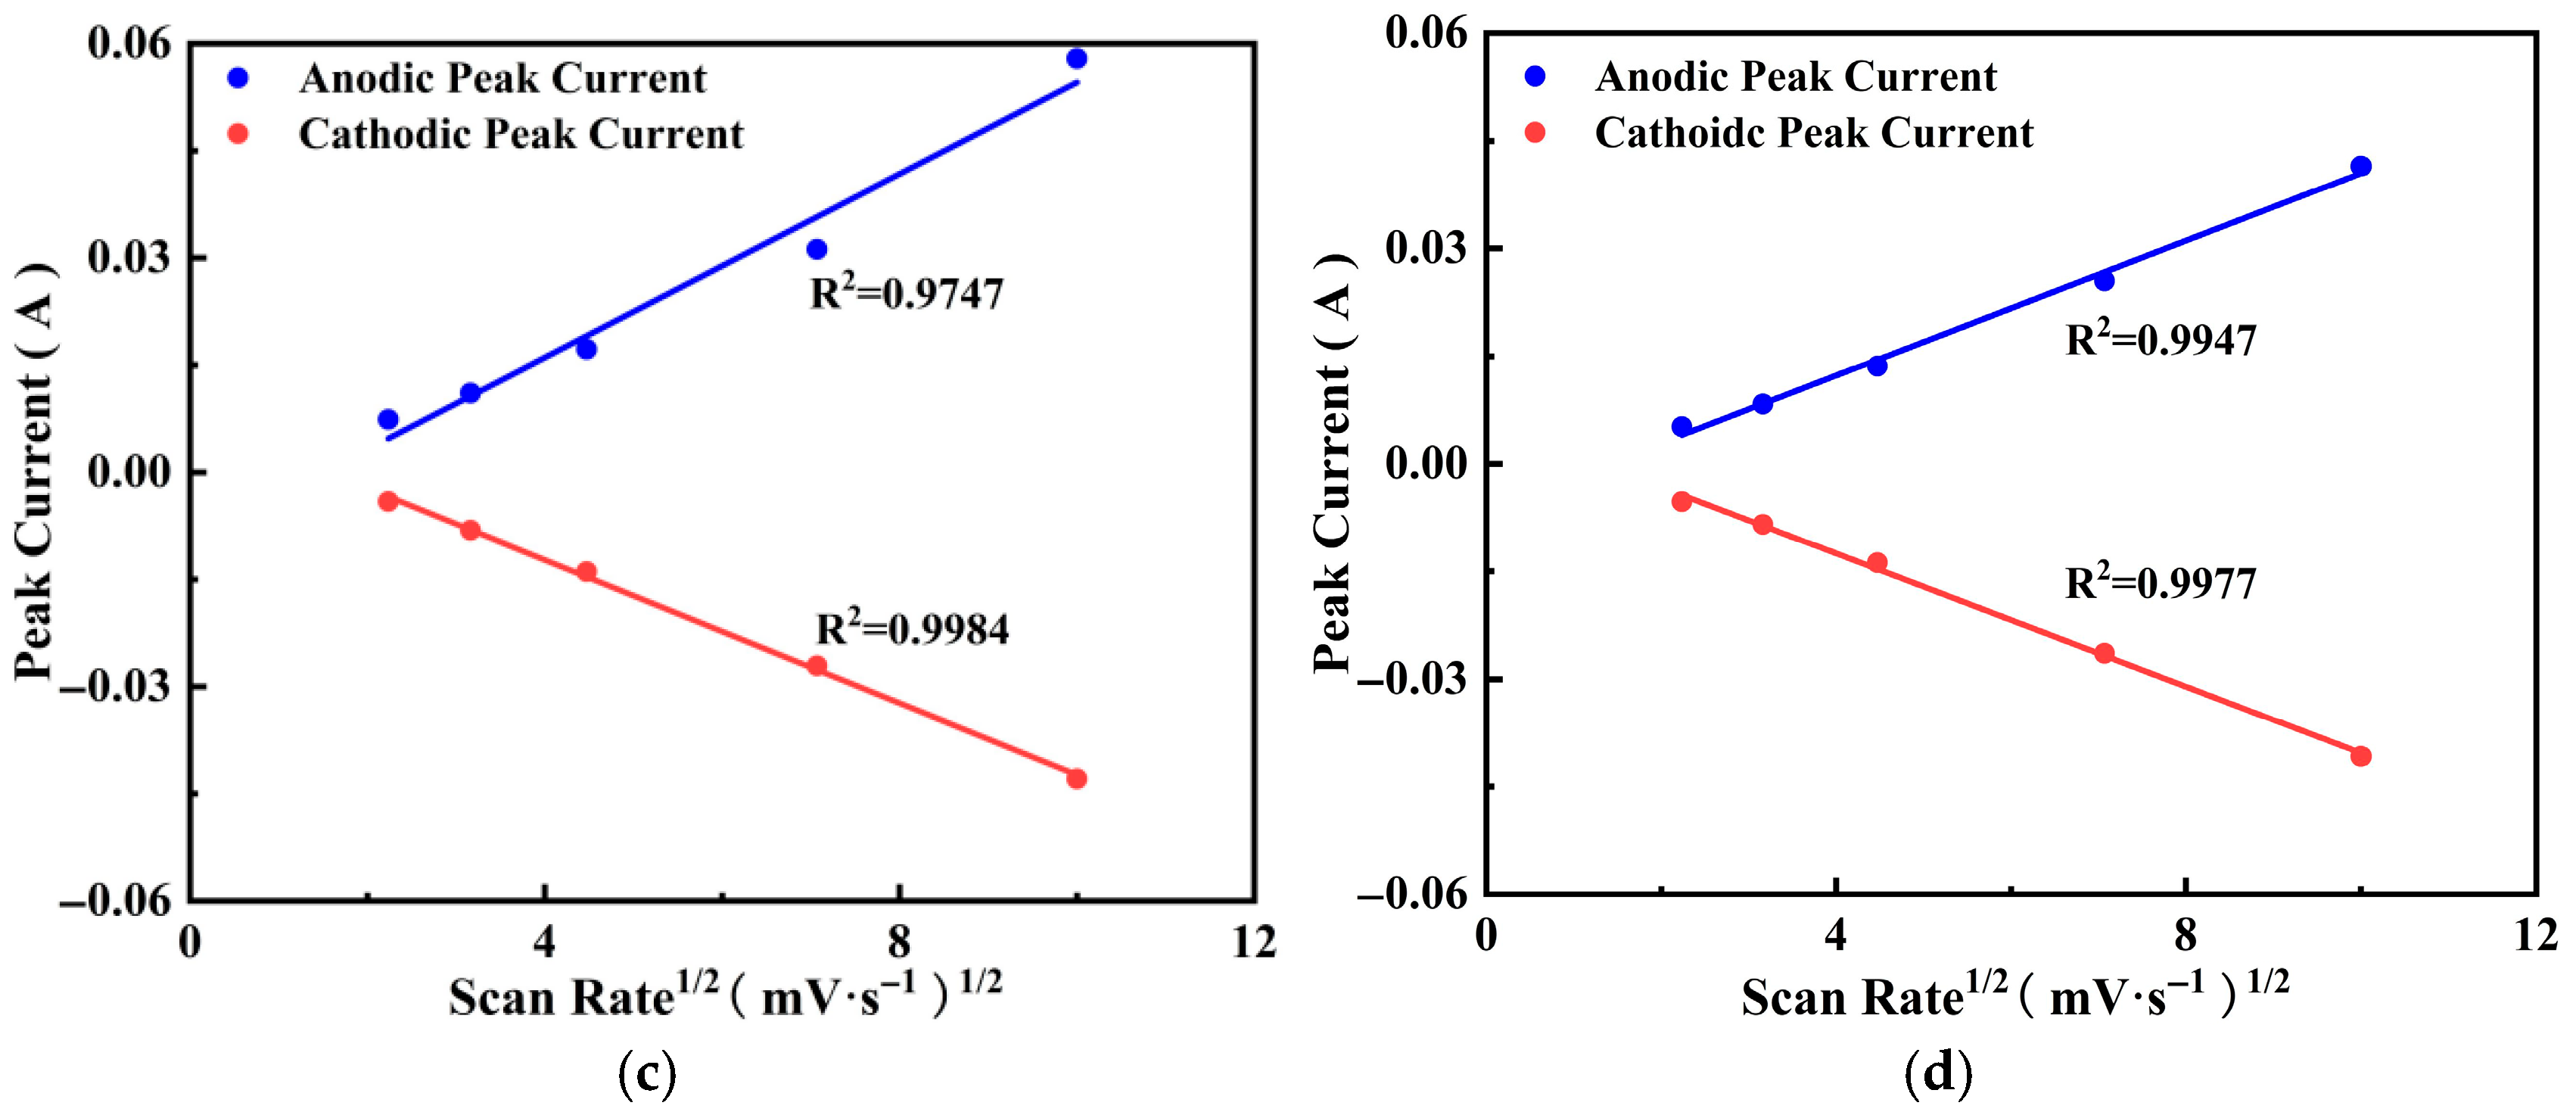
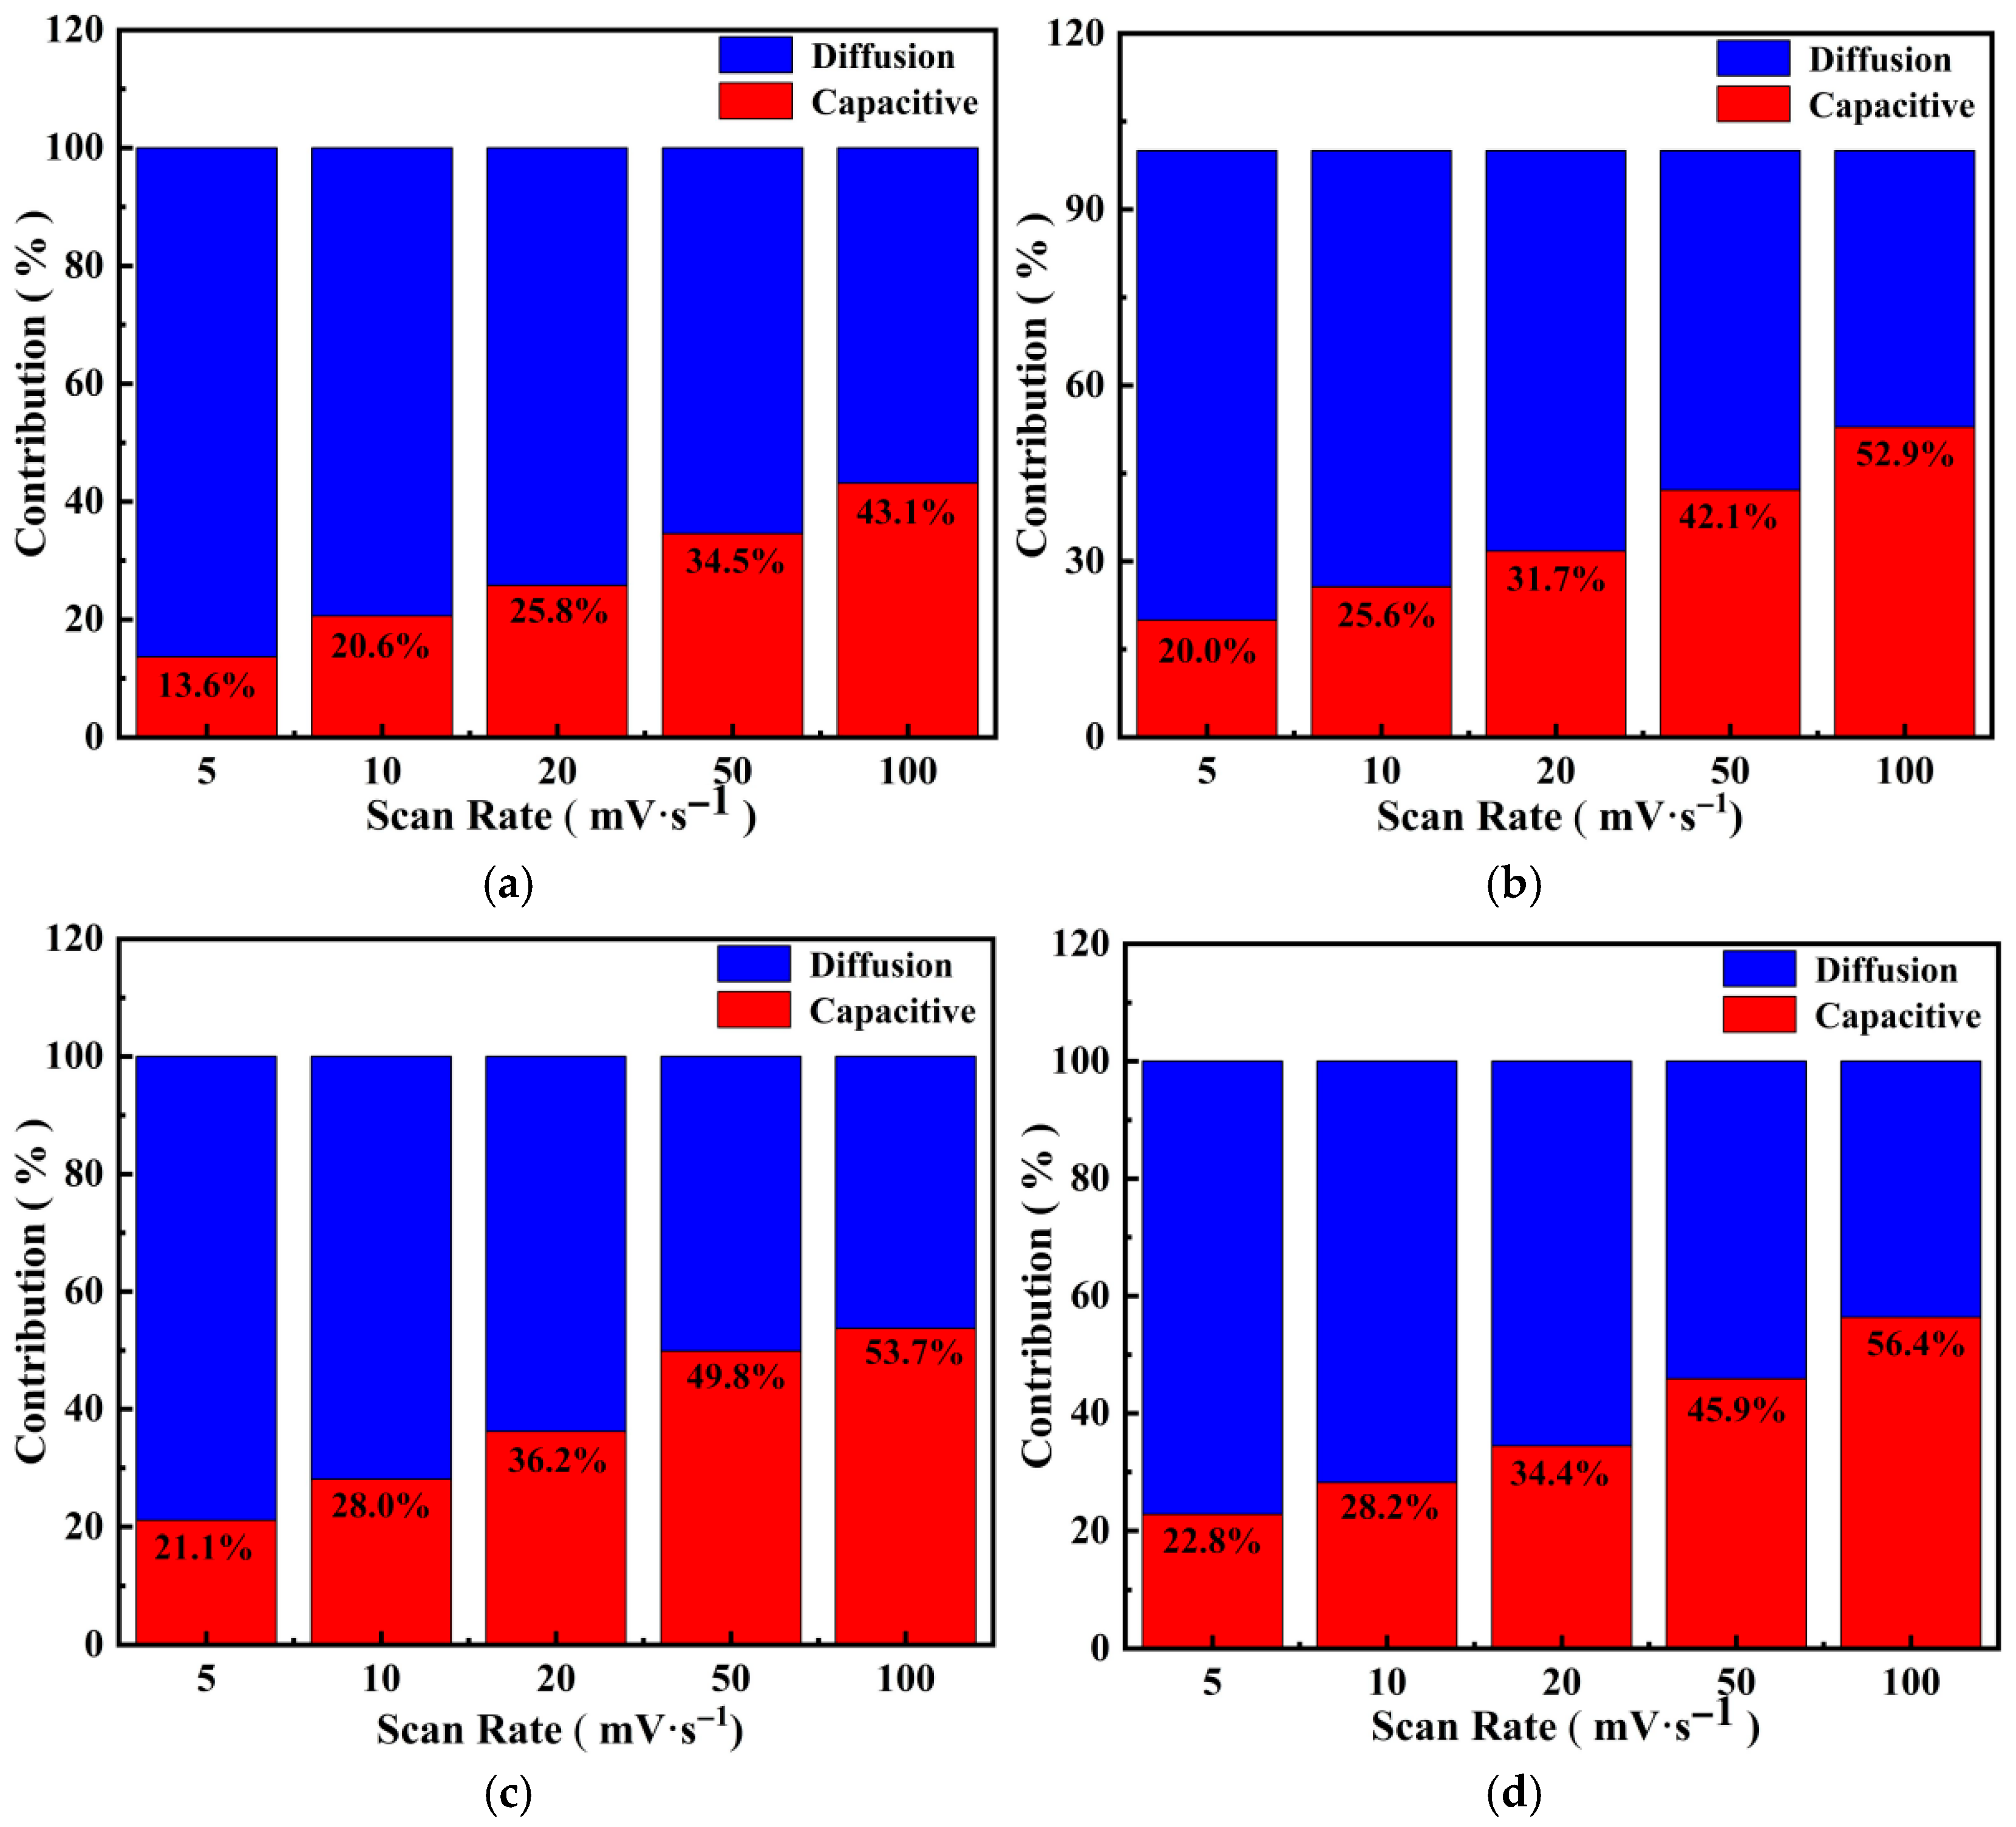
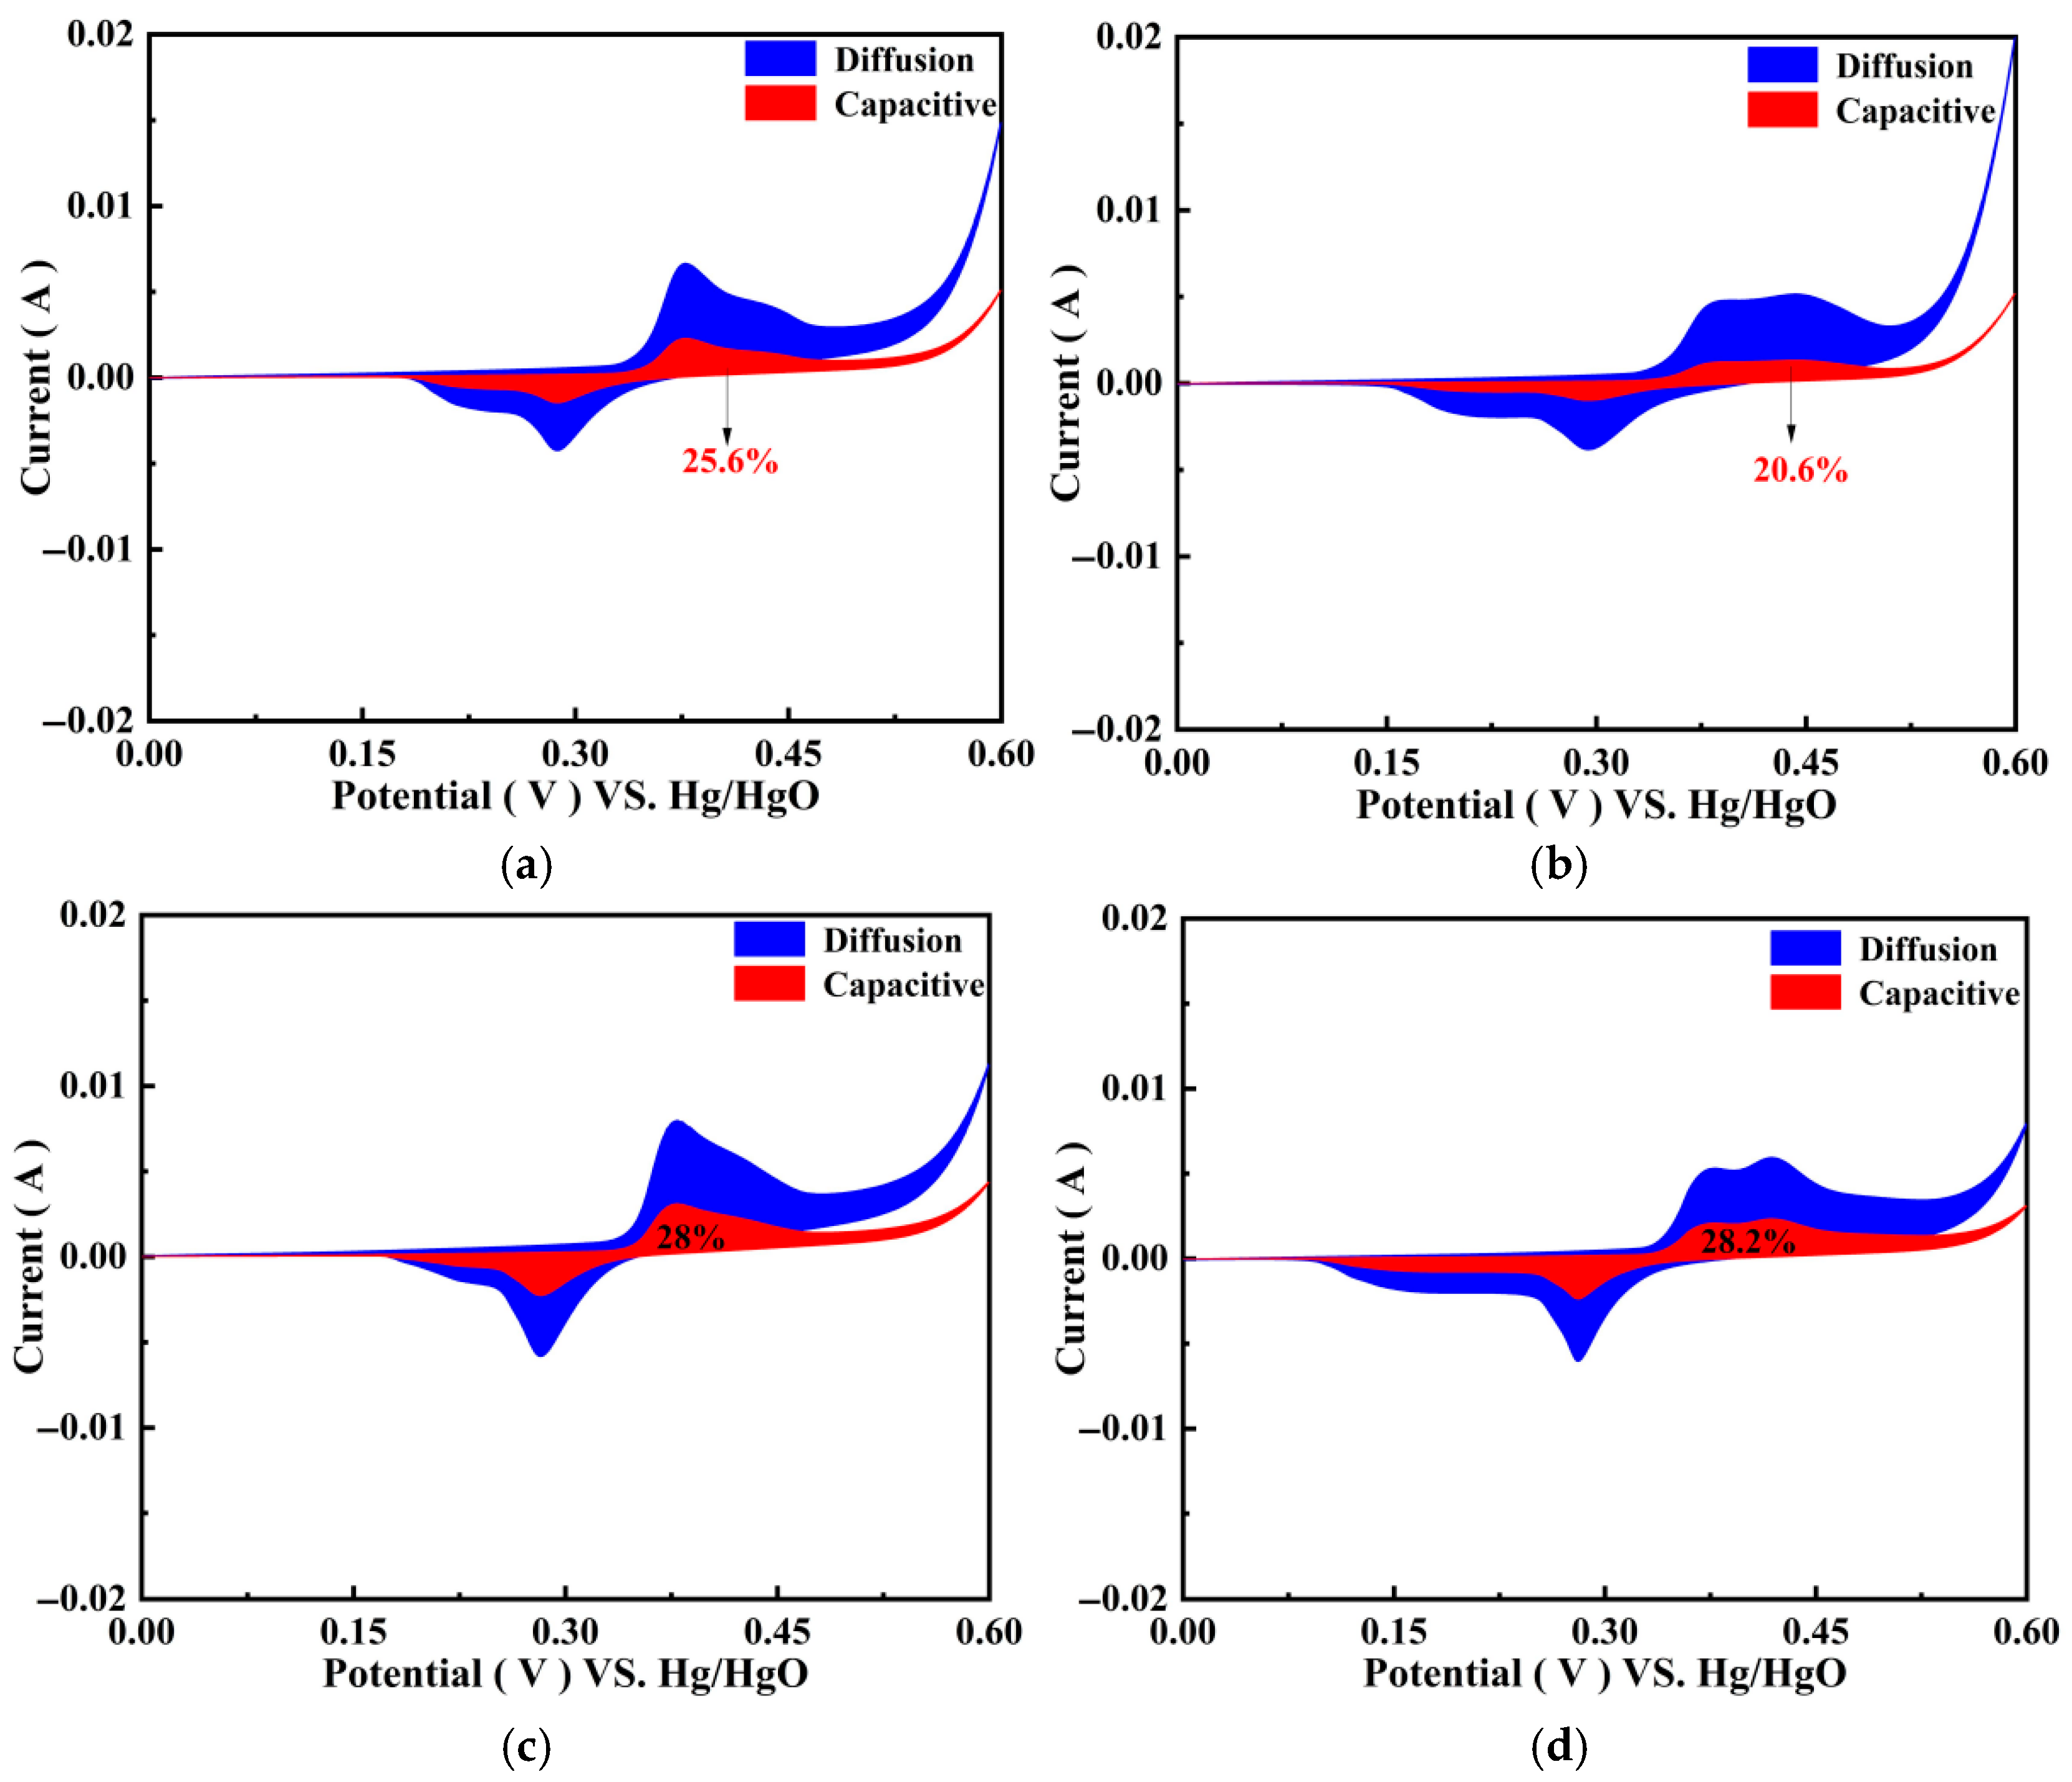
3.4.5. Charge Storage Mechanism
4. Conclusions
Author Contributions
Funding
Institutional Review Board Statement
Data Availability Statement
Conflicts of Interest
References
- Huang, M.; Li, M.; Niu, C.; Li, Q.; Mai, L. Recent advances in rational electrode designs for high-performance alkaline rechargeable batteries. Adv. Funct. Mater. 2019, 29, 1807847. [Google Scholar] [CrossRef]
- Fleischmann, S.; Mitchell, J.B.; Wang, R.; Zhan, C.; Jiang, D.-E.; Presser, V.; Augustyn, V. Pseudocapacitance: From fundamental understanding to high power energy storage materials. Chem. Rev. 2020, 120, 6738–6782. [Google Scholar] [CrossRef] [PubMed]
- Yang, D.; Zuo, S.; Yang, H.; Zhou, Y.; Wang, X. Freestanding millimeter-scale porphyrin-based monoatomic layers with 0.28 nm thickness for CO2 electrocatalysis. Angew. Chem. Int. Ed. Engl. 2020, 59, 18954–18959. [Google Scholar] [CrossRef] [PubMed]
- Sahoo, S.; Kumar, R.; Joanni, E.; Singh, R.K.; Shim, J.-J. Advances in pseudocapacitive and battery-like electrode materials for high performance supercapacitors. J. Mater. Chem. A 2022, 10, 13190–13240. [Google Scholar] [CrossRef]
- Zhang, Y.-Z.; Wang, Y.; Cheng, T.; Yao, L.-Q.; Li, X.; Lai, W.-Y.; Huang, W. Printed supercapacitors: Materials, printing and applications. Chem. Soc. Rev. 2019, 48, 3229–3264. [Google Scholar] [CrossRef]
- Russell, J.C.; Posey, V.A.; Gray, J.; May, R.; Reed, D.A.; Zhang, H.; Marbella, L.E.; Steigerwald, M.L.; Yang, Y.; Roy, X.; et al. High-performance organic pseudocapacitors via molecular contortion. Nat. Mater. 2021, 20, 1136–1141. [Google Scholar] [CrossRef]
- Olabi, A.G.; Abbas, Q.; Al Makky, A.; Abdelkareem, M.A. Supercapacitors as next generation energy storage devices: Properties and applications. Energy 2022, 248, 123617. [Google Scholar] [CrossRef]
- Yan, J.; Li, S.; Lan, B.; Wu, Y.; Lee, P.S. Rational design of nanostructured electrode materials toward multifunctional supercapacitors. Adv. Funct. Mater. 2019, 30, 1902564. [Google Scholar] [CrossRef]
- Wei, W.; Cui, X.; Chen, W.; Ivey, D.G. Manganese oxide-based materials as electrochemical supercapacitor electrodes. Chem. Soc. Rev. 2011, 40, 1697–1721. [Google Scholar] [CrossRef]
- Wang, W.; Xiao, Y.; Li, X.; Cheng, Q.; Wang, G. Bismuth oxide self-standing anodes with concomitant carbon dots welded graphene layer for enhanced performance supercapacitor-battery hybrid devices. Chem. Eng. J. 2019, 371, 327–336. [Google Scholar] [CrossRef]
- Chen, H.C.; Qin, Y.; Cao, H.; Song, X.; Huang, C.; Feng, H.; Zhao, X. Synthesis of amorphous nickel–cobalt–manganese hydroxides for supercapacitor-battery hybrid energy storage system. Energy Storage Mater. 2019, 17, 194–203. [Google Scholar] [CrossRef]
- Skunik-Nuckowska, M.; Węgrzyn, K.; Dyjak, S.; Wisińska, N.H.; Kulesza, P.J. Polyoxometalate/hydroquinone dual redox electrolyte for hybrid energy storage systems. Energy Storage Mater. 2019, 21, 427–438. [Google Scholar] [CrossRef]
- Zhong, M.Z.; Zhang, M.; Li, X.F. Carbon nanomaterials and their composites for supercapacitors. Carbon Energy 2022, 4, 950–985. [Google Scholar] [CrossRef]
- Zeng, J.; Xu, C.; Gao, T.; Jiang, X.; Wang, X. Porous monoliths of 3D graphene for electric double-layer supercapacitors. Carbon Energy 2021, 3, 193–224. [Google Scholar] [CrossRef]
- An, C.; Zhang, Y.; Guo, H.; Wang, Y. Metal oxide-based supercapacitors: Progress and prospectives. Nanoscale Adv. 2019, 1, 4644–4658. [Google Scholar] [CrossRef]
- Kumar, S.; Saeed, G.; Zhu, L.; Hui, K.N.; Kim, N.H.; Lee, J.H. 0D to 3D Carbon-based networks combined with pseudocapacitive electrode material for high energy density supercapacitor: A Review. Chem. Eng. J. 2021, 403, 126352. [Google Scholar] [CrossRef]
- Meng, Q.; Cai, K.; Chen, Y.; Chen, L. Research progress on conducting polymer based supercapacitor electrode materials. Nano Energy 2017, 36, 268–285. [Google Scholar] [CrossRef]
- Ramya, R.; Sivasubramanian, R.; Sangaranarayanan, M. Conducting polymers-based electrochemical supercapacitors—Progress and prospects. Electrochim. Acta 2013, 101, 109–129. [Google Scholar] [CrossRef]
- Xue, D.; Zhu, D.; Xiong, W.; Cao, T.; Wang, Z.; Lv, Y.; Li, L.; Liu, M.; Gan, L. Template-free, self-doped approach to porous carbon spheres with high N/O contents for high-performance supercapacitors. ACS Sustain. Chem. Eng. 2019, 7, 7024–7034. [Google Scholar] [CrossRef]
- Sardana, S.; Gupta, A.; Singh, K.; Maan, A.; Ohlan, A. Conducting polymer hydrogel based electrode materials for supercapacitor applications. J. Energy Storage 2022, 45, 103510. [Google Scholar] [CrossRef]
- Zhang, J.; Mu, Y. A Schiff based p-phenylenediimine polymer as high capacity anode materials for stable lithium ion batteries. Electrochimica Acta 2023, 450, 142276. [Google Scholar] [CrossRef]
- Ma, X.; Li, Q.; Zhang, Y.; Wang, W.; Guo, Y.; Zhang, C. Facile Synthesis of Polymeric Schiff Base Metal Complex as Electrode for High-performance Supercapacitors. J. Electrochem. Soc. 2020, 167, 090544. [Google Scholar] [CrossRef]
- Guo, Y.; Wang, J.; Ma, X.; Wei, Z.; Wang, W.; Zhang, C.; Lei, Y. Preparation and characterization of Schiff base metal complexes for high performance supercapattery. J. Energy Storage 2022, 48, 103956. [Google Scholar] [CrossRef]
- Segura, J.L.; Mancheño, M.J.; Zamora, F. Covalent organic frameworks based on Schiff-base chemistry: Synthesis, properties and potential applications. Chem. Soc. Rev. 2016, 45, 5635–5671. [Google Scholar] [CrossRef]
- Su, S.; Lai, Q.; Liang, Y. Schiff-base polymer derived nitrogen-rich microporous carbon spheres synthesized by molten-salt route for high-performance supercapacitors. RSC Adv. 2015, 5, 60956–60961. [Google Scholar] [CrossRef]
- Cruz-Manzo, S.; Greenwood, P. Blocked-Diffusion with Frequency Dispersion for Study of EIS in NiMH Batteries. J. Electrochem. Soc. 2019, 166, A1176–A1184. [Google Scholar] [CrossRef]
- Lu, Y.; Cai, Y.; Zhang, Q.; Chen, J. Insights into redox processes and correlated performance of organic carbonyl electrode materials in rechargeable batteries. Adv. Mater. 2022, 34, 2104150. [Google Scholar] [CrossRef]


| Name of Material | Molecular Formula/Abbreviation | Norm |
|---|---|---|
| Toluene diamine | C6H8N2 | Analytically pure (AR) |
| Glyoxal solution | C2H2O2 | Analytically pure (AR) |
| Ferrocene | FeC10H10 | Analytically pure (AR) |
| Anhydrous ethanol | C2H6O | Analytically pure (AR) |
| Deionized water | / | / |
| Potassium hydroxide | KOH | Analytically pure (AR) |
| Hydrochloric acid | HCl | Analytically pure (AR) |
| PGo | PGo-Fc1 | PGo-Fc0.3 | PGo-Fc0.2 | PGo-Fc0.1 | |
|---|---|---|---|---|---|
| Average grain size | 0.72 μm | 0.90 μm | 0.62 μm | 0.73 μm | 0.61 μm |
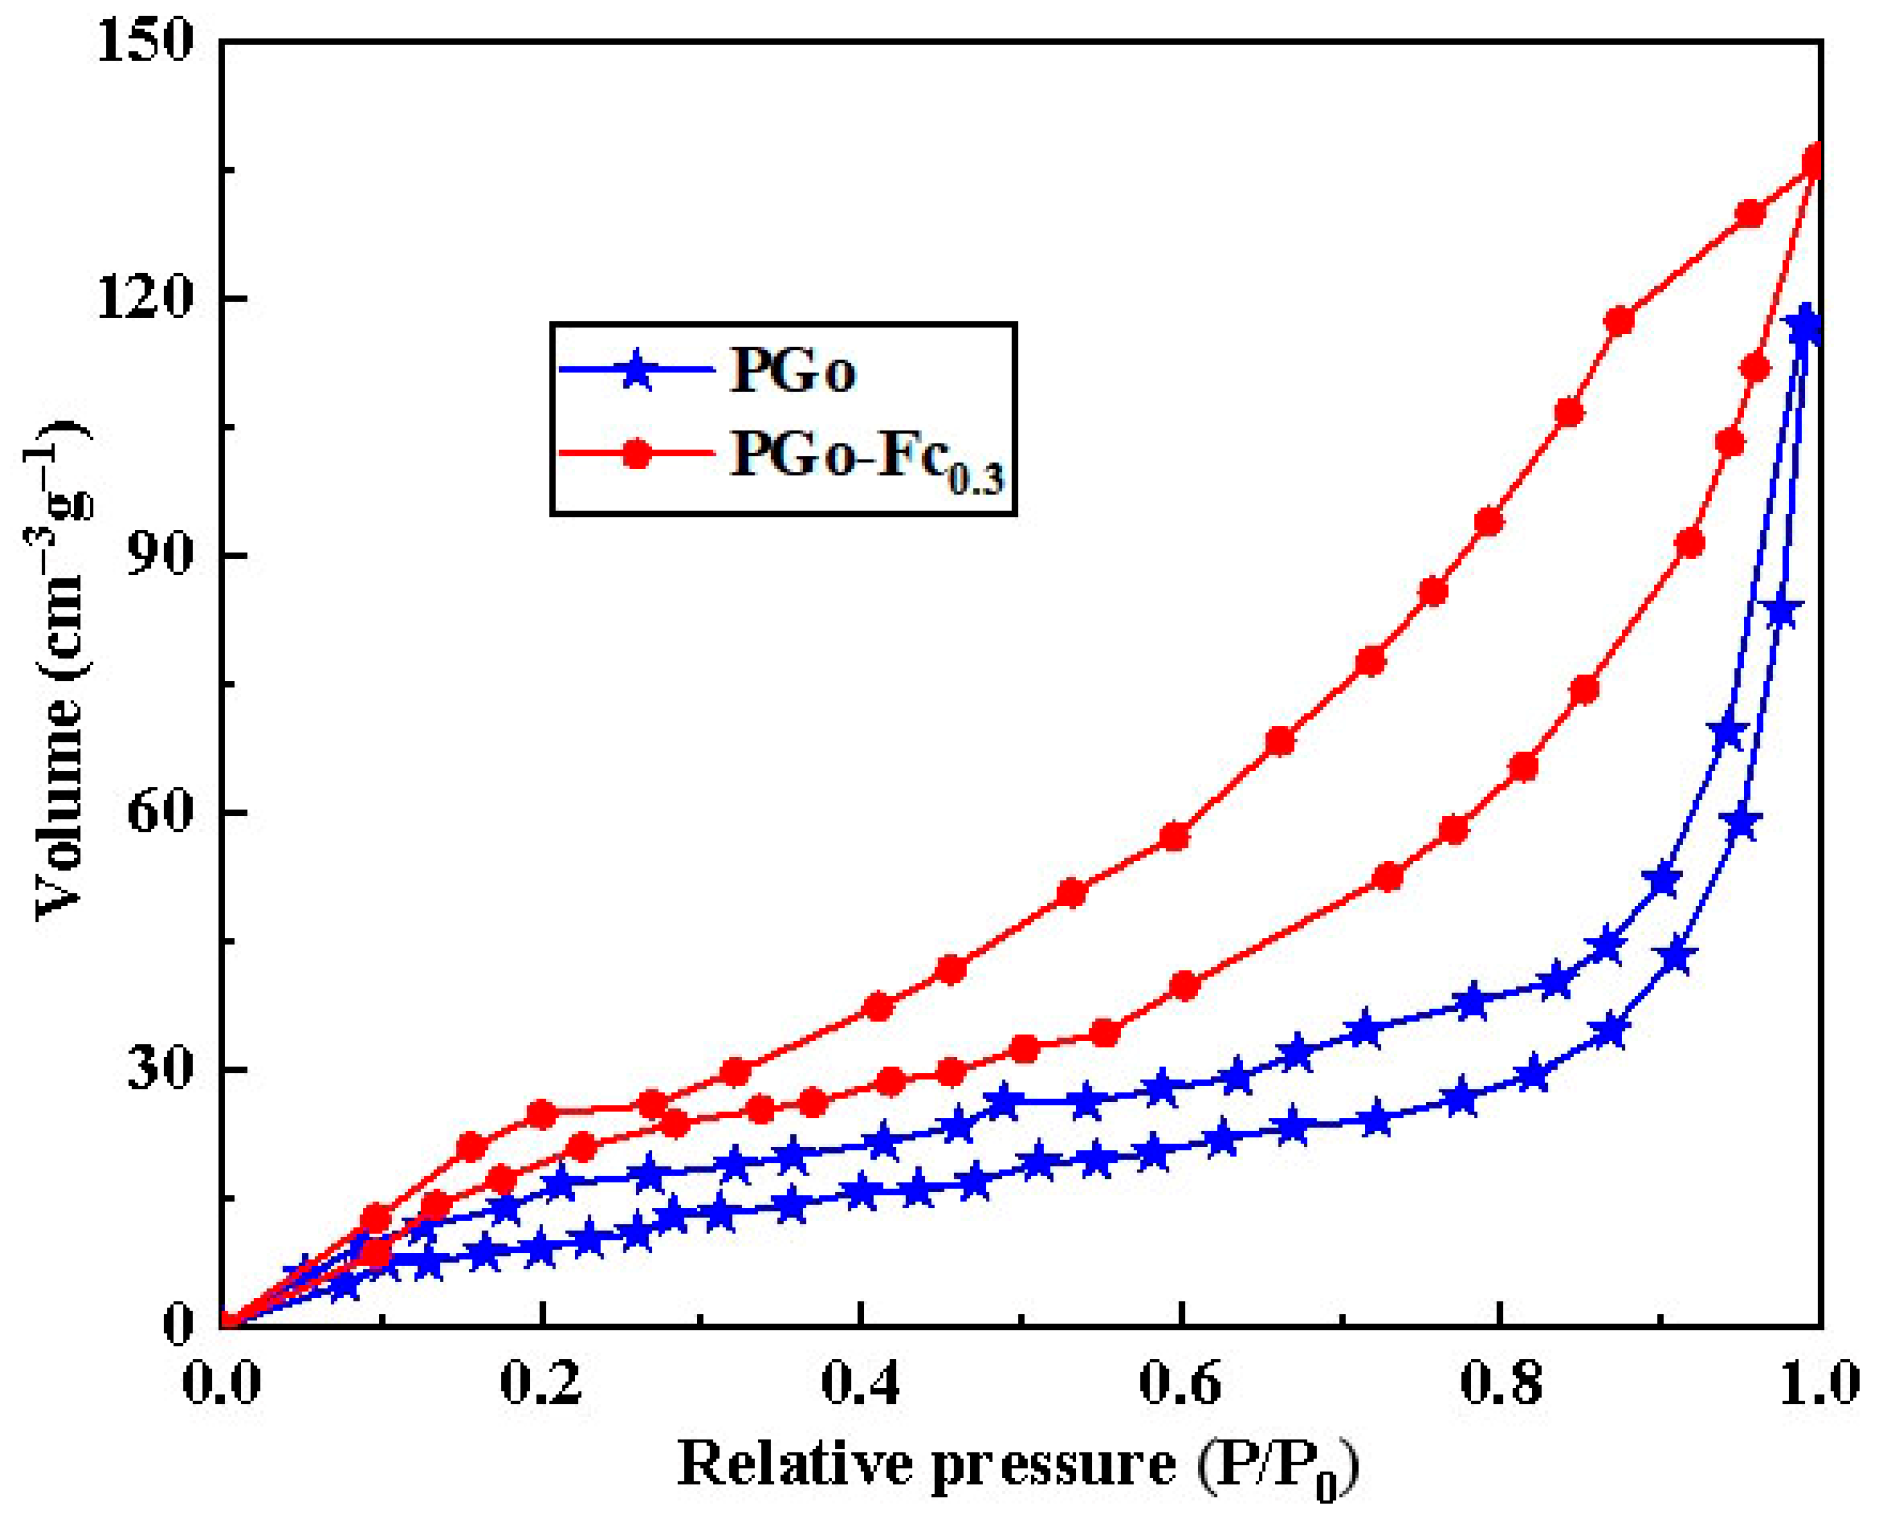
| Material | Specific Surface Area (m2/g) | Total Pore Volume (cm3/g) | Average Pore Size (nm) |
|---|---|---|---|
| PGo | 36.73 | 0.086 | 24.5 |
| PGo-Fc0.3 | 41.65 | 0.108 | 22.8 |
| Electrode Material | Different Current Density | ||||
|---|---|---|---|---|---|
| 0.5 A/g | 1 A/g | 3 A/g | 5 A/g | 10 A/g | |
| PGo | 38.7 F/g | 37.0 F/g | 32.4 F/g | 29.0 F/g | 26.0 F/g |
| PGo-Fc1 | 39.3 F/g | 38.4 F/g | 31.8 F/g | 24.0 F/g | 18.0 F/g |
| PGo-Fc0.3 | 59.6 F/g | 57.4 F/g | 51.6 F/g | 44.0 F/g | 36.0 F/g |
| PGo-Fc0.2 | 54.7 F/g | 53.2 F/g | 48 F/g | 41.0 F/g | 32.0 F/g |
| PGo-Fc0.1 | 49.1 F/g | 47.0 F/g | 34.2 F/g | 29.0 F/g | 24.0 F/g |
| PB | 21.7 F/g | 20.8 F/g | 20.4 F/g | 20.0 F/g | 18.0 F/g |
| PGd | 16.3 F/g | 15.6 F/g | 14.4 F/g | 14.0 F/g | 12.0 F/g |
Disclaimer/Publisher’s Note: The statements, opinions and data contained in all publications are solely those of the individual author(s) and contributor(s) and not of MDPI and/or the editor(s). MDPI and/or the editor(s) disclaim responsibility for any injury to people or property resulting from any ideas, methods, instructions or products referred to in the content. |
© 2025 by the authors. Licensee MDPI, Basel, Switzerland. This article is an open access article distributed under the terms and conditions of the Creative Commons Attribution (CC BY) license (https://creativecommons.org/licenses/by/4.0/).
Share and Cite
Wang, X.; Li, Q.; Bian, Z.; Wang, D.; Liu, C.; Yu, Z.; Li, X.; Li, Q. Ultra-Stable, Conductive, and Porous P-Phenylenediamine-Aldehyde-Ferrocene Micro/Nano Polymer Spheres for High-Performance Supercapacitors with Positive Electrodes. Polymers 2025, 17, 1964. https://doi.org/10.3390/polym17141964
Wang X, Li Q, Bian Z, Wang D, Liu C, Yu Z, Li X, Li Q. Ultra-Stable, Conductive, and Porous P-Phenylenediamine-Aldehyde-Ferrocene Micro/Nano Polymer Spheres for High-Performance Supercapacitors with Positive Electrodes. Polymers. 2025; 17(14):1964. https://doi.org/10.3390/polym17141964
Chicago/Turabian StyleWang, Xin, Qingning Li, Zhiruo Bian, Da Wang, Cong Liu, Zhaoxu Yu, Xuewen Li, and Qijun Li. 2025. "Ultra-Stable, Conductive, and Porous P-Phenylenediamine-Aldehyde-Ferrocene Micro/Nano Polymer Spheres for High-Performance Supercapacitors with Positive Electrodes" Polymers 17, no. 14: 1964. https://doi.org/10.3390/polym17141964
APA StyleWang, X., Li, Q., Bian, Z., Wang, D., Liu, C., Yu, Z., Li, X., & Li, Q. (2025). Ultra-Stable, Conductive, and Porous P-Phenylenediamine-Aldehyde-Ferrocene Micro/Nano Polymer Spheres for High-Performance Supercapacitors with Positive Electrodes. Polymers, 17(14), 1964. https://doi.org/10.3390/polym17141964