Article

Enhancing 3D Printing of Gelatin/Siloxane-Based Cellular Scaffolds Using a Computational Model

by
Marcos B. Valenzuela-Reyes
1,
Esmeralda S. Zuñiga-Aguilar
1,
Christian Chapa-González
1,
Javier S. Castro-Carmona
1,
Luis C. Méndez-González
1,
R. Álvarez-López
2,
Humberto Monreal-Romero
3 and
Carlos A. Martínez-Pérez
1,*
1
Institute of Engineering and Technology, Autonomous University of the City of Juarez, Ciudad Juárez 32310, Mexico
2
Computer Science Department, The University of Texas at El Paso, West University Avenue, El Paso, TX 79968, USA
3
Department of Biomaterials and Nanotechnology, Autonomous University of Chihuahua, University Av., Col. Centro 31000, Mexico
*
Author to whom correspondence should be addressed.
Polymers 2025, 17(13), 1838; https://doi.org/10.3390/polym17131838
Submission received: 1 June 2025 / Revised: 26 June 2025 / Accepted: 27 June 2025 / Published: 30 June 2025
(This article belongs to the Special Issue Designing Polymers for Emerging Applications)

Abstract

In recent years, there has been a surge in the extrusion-based 3D printing of materials for various biomedical applications. This work presents a novel methodology for optimizing extrusion-based 3D bioprinting of a gelatin/siloxane hybrid material for biomedical applications. A systematic approach integrating rheological characterization, computational fluid dynamics simulation (CFD), and machine-learning-based image analysis, was employed. Rheological tests revealed a shear stress of 50 Pa, a maximum viscosity of 3 × 10⁵ Pa·s, a minimum viscosity of 0.089 Pa·s, and a shear rate of 15 rad/s (27G nozzle, 180 kPa pressure, 32 °C temperature, 30 mm/s velocity) for a BIO X bioprinter. While these parameters yielded constructs with 54.5% similarity to the CAD design, a multi-faceted optimization strategy was implemented to enhance fidelity, computational fluid dynamics simulations in SolidWorks, coupled with a custom-develop a binary classifier convolutional neuronal network for post-printing image analysis, facilitated targeted parameter refinement. Subsequent printing optimized parameters (25G nozzle, 170 kPa, 32 °C, 20 mm/s) achieved a significantly improved similarity of 92.35% CAD, demonstrating efficacy. The synergistic combination of simulation and machine learning ultimately enabled the fabrication of complex 3D constructs with a high fidelity of 94.13% CAD similarity, demonstrating the efficacy and potential of this integrated approach for advanced biofabrication.

1. Introduction

Bio-inks are formulations composed of living cells, biomaterials, and other supporting components that are used in three-dimensional (3D) bioprinting to create biological structures. These bio-inks are designed to provide a suitable microenvironment for cell adhesion, growth, and differentiation, enabling the fabrication of complex biological structures, including tissues, organs, and therapeutic constructs such as skin grafts and cartilage replacement. Bio-inks are categorized into hydrogels, microcarriers, cellular aggregates, and decellularized matrices, each possessing unique material and synthesis methods [1,2,3].
Hybrid bio-inks integrating multiple biomaterials offer a synergistic advantage by combining the desirable mechanical and biological properties of their constituents [4]. This approach facilitates the creation of complex and functional 3D constructs, expanding the possibilities of bioprinting [5]. Examples of hybrid bio-inks include hydrogel–ceramic composites for bone tissue engineering [6,7,8], hydrogel–microcarrier for organ printing [9], hydrogel–polymer for soft tissues, and hydrogel–bioactive material to enhance cell adhesion, proliferation, and differentiation [10,11,12]. For instance, hydrogel–microcarrier hybrids have shown promise in printing complex vascularized organs [13,14,15].
Gelatin/siloxane hybrid inks represent a compelling combination of natural and synthetic materials for 3D printing. Gelatin, a biocompatible and biodegradable natural polymer, provides flexible structures, particularly advantageous for soft tissue applications; on the other hand, siloxane, a synthetic polymer with better mechanical resistance, enhances the structural integrity of complex constructs [9]. These hybrid inks can be processed via various printing techniques, including extrusion, injection, and laser-based, offering versatility across applications. However, extrusion-based printing of gelatin/siloxane presents significant challenges due to the complex interplay of process parameters such as ink composition, temperature, extrusion velocity, and pressure [11,15]. Precise control of these parameters is essential to avoid defects such as cracking and poor interlayer adhesion impacting the fidelity of the printed constructs [16,17].
Computational modeling, particularly using finite element method (FEM), has emerged as a powerful tool for understanding and optimizing the extrusion dynamics of gelatine/siloxane hybrid materials. FEM simulation allows for the prediction of ink flow behavior and the resulting constructs properties, considering the influence of composition, temperature, velocity, and pressure. By analyzing factors such as mechanical strength, flexibility, and surface quality, simulation can guide parameter optimization for improved fidelity and process efficiency. This approach provides valuable insights into the complex relationships between material properties, process parameters, and the final printed product, accelerating the development of advanced 3D printing strategies for biomedical applications [18,19,20,21,22,23,24].
Statistical analysis using a factorial design of experiments (DoE) enables the preprocessing of data, which can subsequently be used for training machine learning (ML) models. Based on a convolutional neuronal network (CNN), the analysis focused on images captured by an optical microscope of prints produced using different printing parameters. Additionally, image preprocessing was implemented to simplify and optimize the analysis, facilitating efficient estimation of 3D printing process parameters. Furthermore, the models can estimate filament diameter based on both experimental data simulations of the extrusion process. ML models are valuable tools for computational modeling, as they enable the estimation of printing parameters without considering experimental conditions and material properties. ML models can also be trained to predict filament diameter based on experimental data or simulation results, offering a non-destructive approach to quality control [25,26,27].
In this context, we propose a novel computational framework for defining key process parameters (velocity, pressure, and temperature) for extrusion-based 3D bioprinting of complex structures using a gelatin/siloxane hybrid material. This approach integrates rheological and mechanical characterization of the ink, providing essential material properties (elastic modulus, Poisson’s ratio, and tensile strength) for accurate FEM simulation in SolidWorks software. In order to optimize the printing process and achieve high-fidelity ink filament diameter, targeting 95% accuracy a factorial DoE was employed. A custom-developed ML model trained in data from simulations and experiments was used to analyze filament diameter, enabling a precise 3D extrusion process. The model’s predictions were validated through physicochemical testing and comparison with computational models. This integrated approach aims to significantly improve the fidelity and efficiency of printed gelatin/siloxane ink.

2. Materials and Methods

2.1. Materials and Ink Synthesis

Gelatin/siloxane hybrid material was synthesized according to the protocol described by Mahony et al. [28]. In order to prepare a stable ink, porcine gelatin (G2500) and tetraethyl orthosilicate (TEOS) (86578) were obtained from Sigma-Aldrich (Saint Louis, MO, USA). Initially, 10% (w/v) gelatin and 10% (w/v) TEOS siloxane hydrogels were prepared separately by magnetic stirring at 6000 rpm and 60 °C for 40 min. The final hybrid ink was obtained by combining both hydrogels (22% gelatin, 78% siloxane) [16] under the following controlled conditions: stirring at 8000 rpm and 60 °C for 90 min to ensure uniform dispersion and reproducibility [16,28,29].

2.2. Ink Characterization

The rheological properties of the gelatin/siloxane hybrid material (22G/78S) were characterized using a TA Instruments AR 2000 ex rheometer (New Castle, DE, USA). Measurements were performed replicating the BIO X 3D printer’s operating parameters, including temperature, velocity, and pressure. Viscosity was analyzed in flow mode using a 25 mm diameter geometry. Compression resistance was computed at four stages: before and after printing, post-crosslinking on the print bed temperature, and after UV radiation treatment. Tests were conducted using a TA Instruments Q800 DMA (New Castle, DE, USA) under controlled conditions (32 °C, vacuum atmosphere) with a force range of 0.0001–18 N and a compression rate of 1000 Pa/s. The material’s chemical composition was examined with a Thermo Nicolet 6700 FT-IR spectrophotometer (Madison, WI, USA) across three stages: before printing, crosslinking, and post-UV treatment. The analysis investigated the effects of physical and chemical crosslinking on chemical bonds and compression resistance. These studies aimed to understand the material’s structural and mechanical changes throughout the 3D printing process [3,5,9,11,16,28,29,30].

2.3. Computational Model

The computational model for the 3D printing process of the gelatin/siloxane hybrid material was developed using FEM in SolidWorks 2022 academic software. A volume flow simulation based on the material’s physicochemical properties was conducted to analyze its thermomechanical behavior under varying pressures, temperatures, and velocities within the BIO X 3D printer cartridge. The BIO X printer cartridge was designed to integrate the study parameters—temperature, velocity, and pressure—into simulations for analyzing material flow and deformation. A comprehensive FEM-based simulation was developed in SolidWorks 2022 to evaluate the thermomechanical behavior of the gelatin/siloxane hybrid material under varying extrusion parameters. A high-resolution finite element mesh was constructed, incorporating both mechanical and fluid dynamic parameters to accurately capture the ink’s deformation and flow properties. The simulation applied 200 kPa pressure, 45 mm/s velocity, and 32 °C temperature to analyze controlled deformation, enabling process adjustments and optimizing extrusion printing parameters [18,19,20,21,22,31].

2.3.1. Mathematical Model for the Simulation of the Material and 3D Printing Process

The mathematical model was conducted to comprehend the thermomechanical performance of the 22G/78S concentration of the gelatin/siloxane hybrid material through characterization tests, aspects such as thermogravimetry analysis (TGA), differential scanning calorimetry (DSC), and viscosity ramps as a function of temperature and shear stress performed on the rheometer [18,19,31,32,33,34].
Mathematical relationships express through Astrid’s Mathematical model, which is developed based on the flow rate equation Equation (1), which accounts for extrusion velocity calculated via FEM using specialized software. This calculation considers both the geometry and physicochemical properties of the material. The flow rate (Q) is mathematically described as the product of extrusion velocity (VEXT) and the cross-sectional area of the nozzle area (AN), allowing precise prediction of volumetric flow dynamics. Assuming maximum velocity equals extrusion velocity, a relationship with the power law is established as Equation (2). The Hagen–Poiseuille equation is then generalized and combined with the Power law Equation (3), rewritten in terms of the consistency index (K), as shown in Equation (4). The parameter K, derived from rheological studies, is stored in the simulation software for automatic analysis. Finally, expressing Equation (4) in terms of pressure variation (ΔP) leads to a definitive generalization of the Hagen–Poiseuille equation, as detailed in Equation (5) [9,10,15,16]. Equation (6) describes how to estimate the filament diameter based on FEM calculations. This estimation considers the extrusion velocity (VEXT) and the maximum velocity (VMAX) obtained from FEM simulations. Additionally, the elasticity factor of the ink (n) is included, as it influences the material’s behavior during extrusion [18,19,32,33].
Q = V E X T × W N
V M A X = V E X T × 3 n + 1 n
V E X T = n 3 n + 1 × R 2 K × P L
K = n 3 n + 1 × R 2 V E X T × P L
P = 8 × η × V E X T × L R 2
D F = 4 × W N × V E X T n × V M A X

2.3.2. Finite Element Method Computational Model of the 3D Printing Process

The thermomechanical properties of the gelatin/siloxane hybrid material, as studied by Valenzuela-Reyes et al. [16], were input into SolidWorks to analyze compression resistance, shear stress, dynamic viscosity, and controlled deformation during extrusion-based printing. A fluid simulation incorporated 0–200 kPa compression stress, 5–45 mm/s horizontal velocity, and a constant temperature of 32 °C to study material deformation. A thermal barrier simulating a steady temperature of 10 °C print bed was used to evaluate its effects on filament properties like viscosity and shear stress. The software interface also estimated the final filament diameter, considering printing parameters and cross-linking induced by bed temperature [18,19,20,21,22,23,24].

2.3.3. Machine Learning Model

The ML CNN classifier model was trained to analyze images of 3D-printed meshes captured using an optical microscope (Tomlov ×1000) (Osaka, Japan). The images were preprocessed by converting them to grayscales, binarizing them, applying a Gaussian filter, and resizing them with physical measurements obtained with a digital caliper. The dataset was split into training (80%) and validation (20%) sets. The images were labeled as “High or Low” based on their similarity to the CAD design, using metrics such as structural similarity (SSIM) and dimensional similarity (SD) (Figure 1a) [25,26,27,35].
S c a l e L = L O b j e t i v e L
S c a l e W = W O b j e t i v e W
S S I M ( x , y ) = ( 2 μ x μ y + C 1 ) ( 2 σ x y + C 2 ) μ x 2 + μ y 2 + C 1 ( μ x 2 + μ y 2 + C 2 )
S D = 100 L L O + | W W o | max ( L O , W O ) × 100
S A = S S I M + S D 2
Before being input into the ML model, the images were resized to a matrix size of 128 × 128. The dataset size was progressively expanded to 100 image batches, starting from 250 images. The hyperparameters were adjusted to enhance learning. Recall (R) was used as the evaluation metric. The model architecture was based on a convolutional neural network (CNN) designed to classify images of printed meshes and compare them with a target image corresponding to the CAD design to classify images of printed meshes by comparing them with a target image from CAD design. This comparison assesses the fidelity and dimensional accuracy of the printed parts. The input layer had dimensions of (128,128,1). The convolutional and pooling blocks were composed of filters of size (3,3), with depths of 32, 64, 128, and 256, and included batch normalization and MaxPooling2D to reduce dimensionality. Subsequently, a flattening layer was followed by a fully connected layer with 256 neurons and ReLU activation, along with L2 regularization to prevent overfitting. A Dropout layer with a rate of 0.5 was used to further mitigate overfitting. The output layer was a single neuron with sigmoid activation, generating a binary value: 1 to classify “High” similarity and 0 for “Low” similarity CAD design. This model analyzed images from the BIO X 3D printer to identify prints with the highest similarity to the CAD model. The corresponding printing parameters were then retrieved using a predefined experimental matrix [25,26,27,35].

2.4. Validation 3D Printing Test

The 3D printing validation tests were conducted using 3 mL of ink composed of the gelatin-siloxane hybrid material (28G/72S), loaded into the cartridges of the BIOX 3D printer (CELLINK, Gothenburg, Sweden). A CAD design of a 10 mm × 10 mm mesh, as shown in Figure 1a, was printed using the parameters estimated from the ink characterization: applied pressure at 180 kPa, printing velocity at 25 mm/s, and temperature at 32 °C. The objective was to perform a statistical comparison between the parameters experimentally estimated and those obtained through the FEM, based on the resulting length (L), width (W), and filament diameter (FD), and then estimate the fidelity (F) and similarity to the CAD design (S). The images of the printed constructs were captured using an optical microscope (Tomlov ×1000), and these were used to train the ML model, considering the printing parameters detailed in Table 1. Finally, the CAD design from Figure 2a and the complex 3D construct CAD design from Figure 2b were printed. The resulting filament diameter was measured and compared using the three estimation methods: experimental, FEM simulation, and the ML model [5,9,10,15,16].

Manual Calculation of Percentage Similarity Between the Printed and the CAD Design

Printed meshes of 10 mm × 10 mm were manually measured using a digital vernier caliper to calculate the similarity percentage between the printed object and the CAD design. This calculation allowed for a comparison between the trained machine learning model and the physical prints by employing metrics such as MSE, MAE, and the correlation coefficient to determine which estimation process is more accurate.
The manual calculation was carried out using the following equations: based on the measurements of the printed mesh: measure length (Lm), width (Wm) (see Equations (12) and 13), and the ideal specifications: length (LCAD) and width (WCAD), the percentage error for each parameter was computed (EDraw). Subsequently, normalization was applied in the case of the filament diameter presented in Equation (14), and percentage similarity presented in Equation (15). This process quantified the loss of fidelity for each parameter. It expresses the overall similarity as a percentage [25,26,27,35,36].
E L = L m L C A D L C A D × 100
E w = W m W C A D W C A D × 100
E D = E D r a w 3 × 100
S i m i l a r i t y = 100 % E D

2.5. DoE Study

Minitab software was used to conduct DoE analysis using a full factorial DoE with three factors and two, five, and five levels to compare experimental estimation, MEF simulation, and training of the ML CNN classifier model. In this study, the independent variables were nozzle size (A, G), applied pressure (B, kPa), and printing velocity (C, mm/s). The metrics used for training the ML model were employed as response variables, as shown in Table 1. The purpose of this approach was to compare the results of the full factorial DoE with the coefficient correlation, linear regression equation, mean squared error (MSE), and mean absolute error (MAE) after completing the model training. This comparison was aimed at validating the performance of the trained model based on the physical measurements obtained [25,26,27,35,36].

2.6. Experimental Validation of DoE Regression Model and Machine Learning Model

ML models integrate statistical measures, such as the MSE and MAE. This allows the factorial DoE based on statistical measures to be compared with the model’s learning performance in terms of the obtained filament diameter and its fidelity to the CAD design. The MAE, representing the average absolute difference between predicted values and actual values obtained in experimental tests, was determined using Equation (16). The MSE, derived from the residuals of the linear regression, compares actual values with predicted values and was calculated using Equation (17). The validation of the CNN classifier model’s accuracy, the FEM simulation, and experimental tests were carried out by comparing linear regression statistics (MSE and MAE). Additionally, a Pearson correlation test was conducted using Equation (18) to determine if there is a linear relationship between the percentage similarity of the experimental tests, the FEM simulation, and the ML model estimates. These comparisons were based on the printing parameters and percentage similarity. For the experimental tests, FEM simulation, pressure, temperature, and printing velocity were evaluated. For the CNN-based ML model, nozzle size, pressure, and speed were considered. The ultimate goal was to obtain the average filament diameter and assess fidelity to the printed CAD design [25,26,27,35,36].
M A E = Σ ί = 1 n | y ί x ί | n
M S E = Σ ί = 1 n ( x ί ȳ ) 2 n
r = n ( x y ) ( x ) ( y ) | n x 2 ( x ) 2 |   | n ( y ) 2 ( y ) 2 |

3. Results

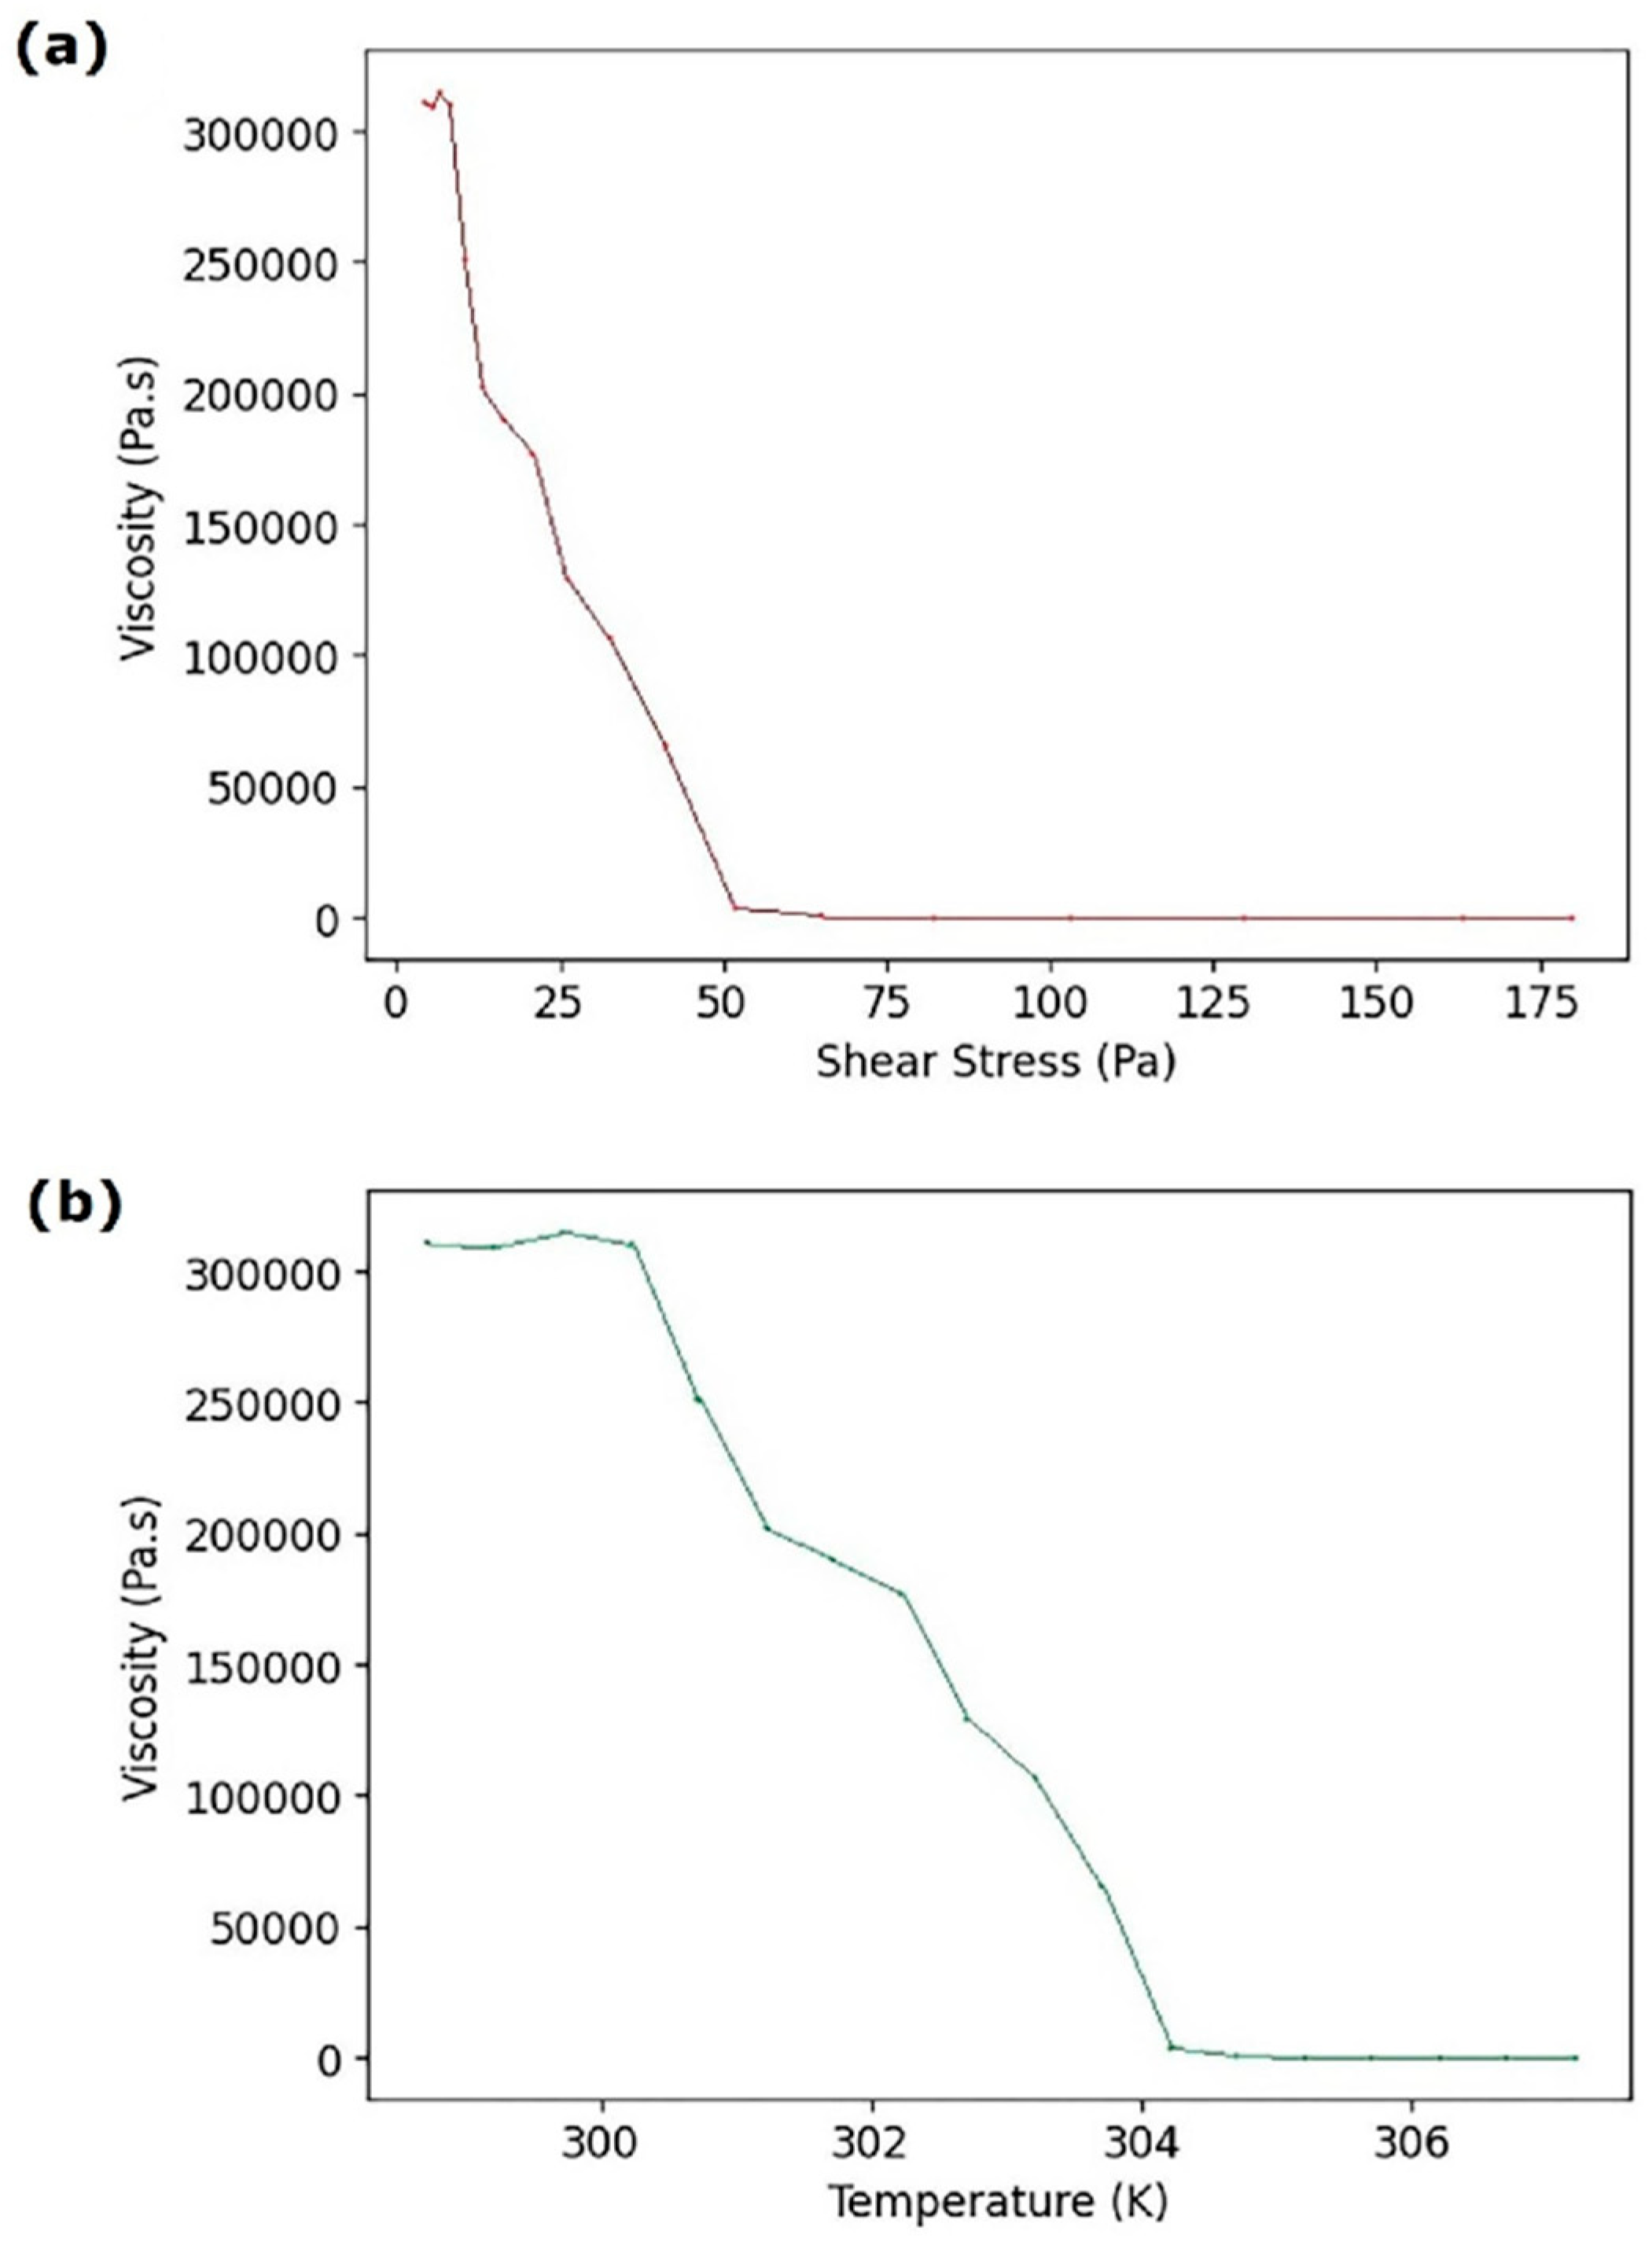
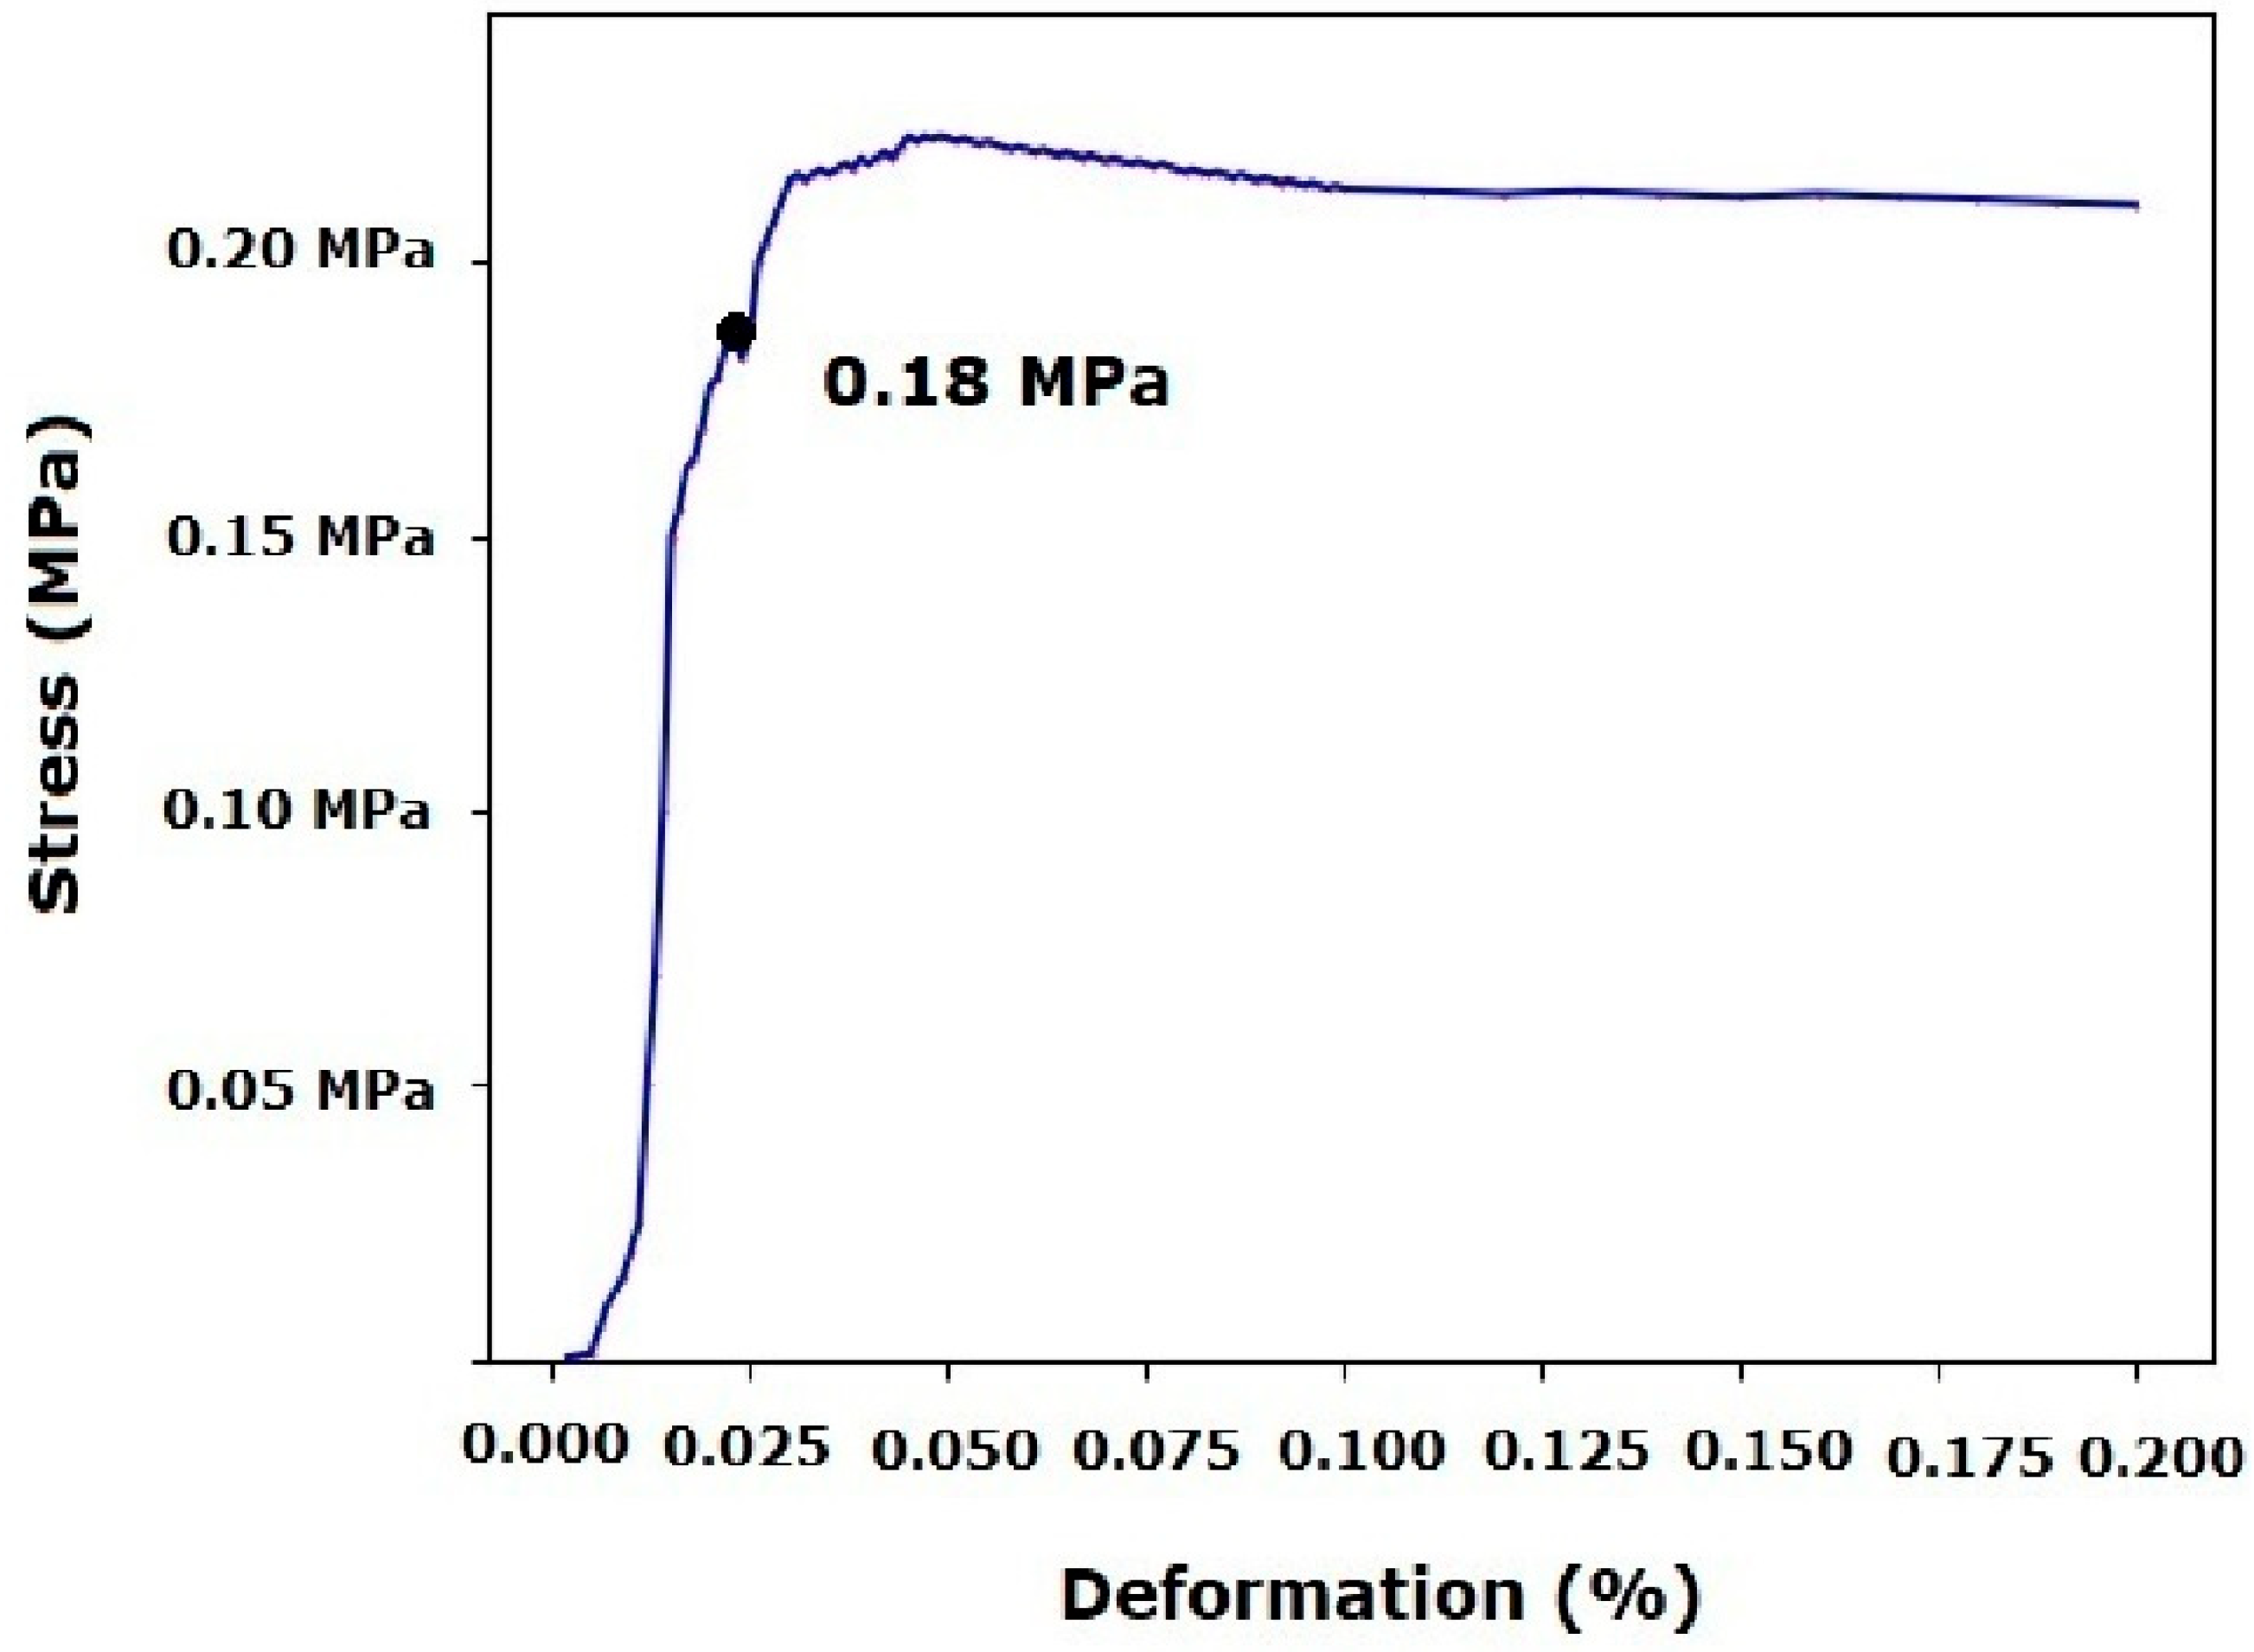
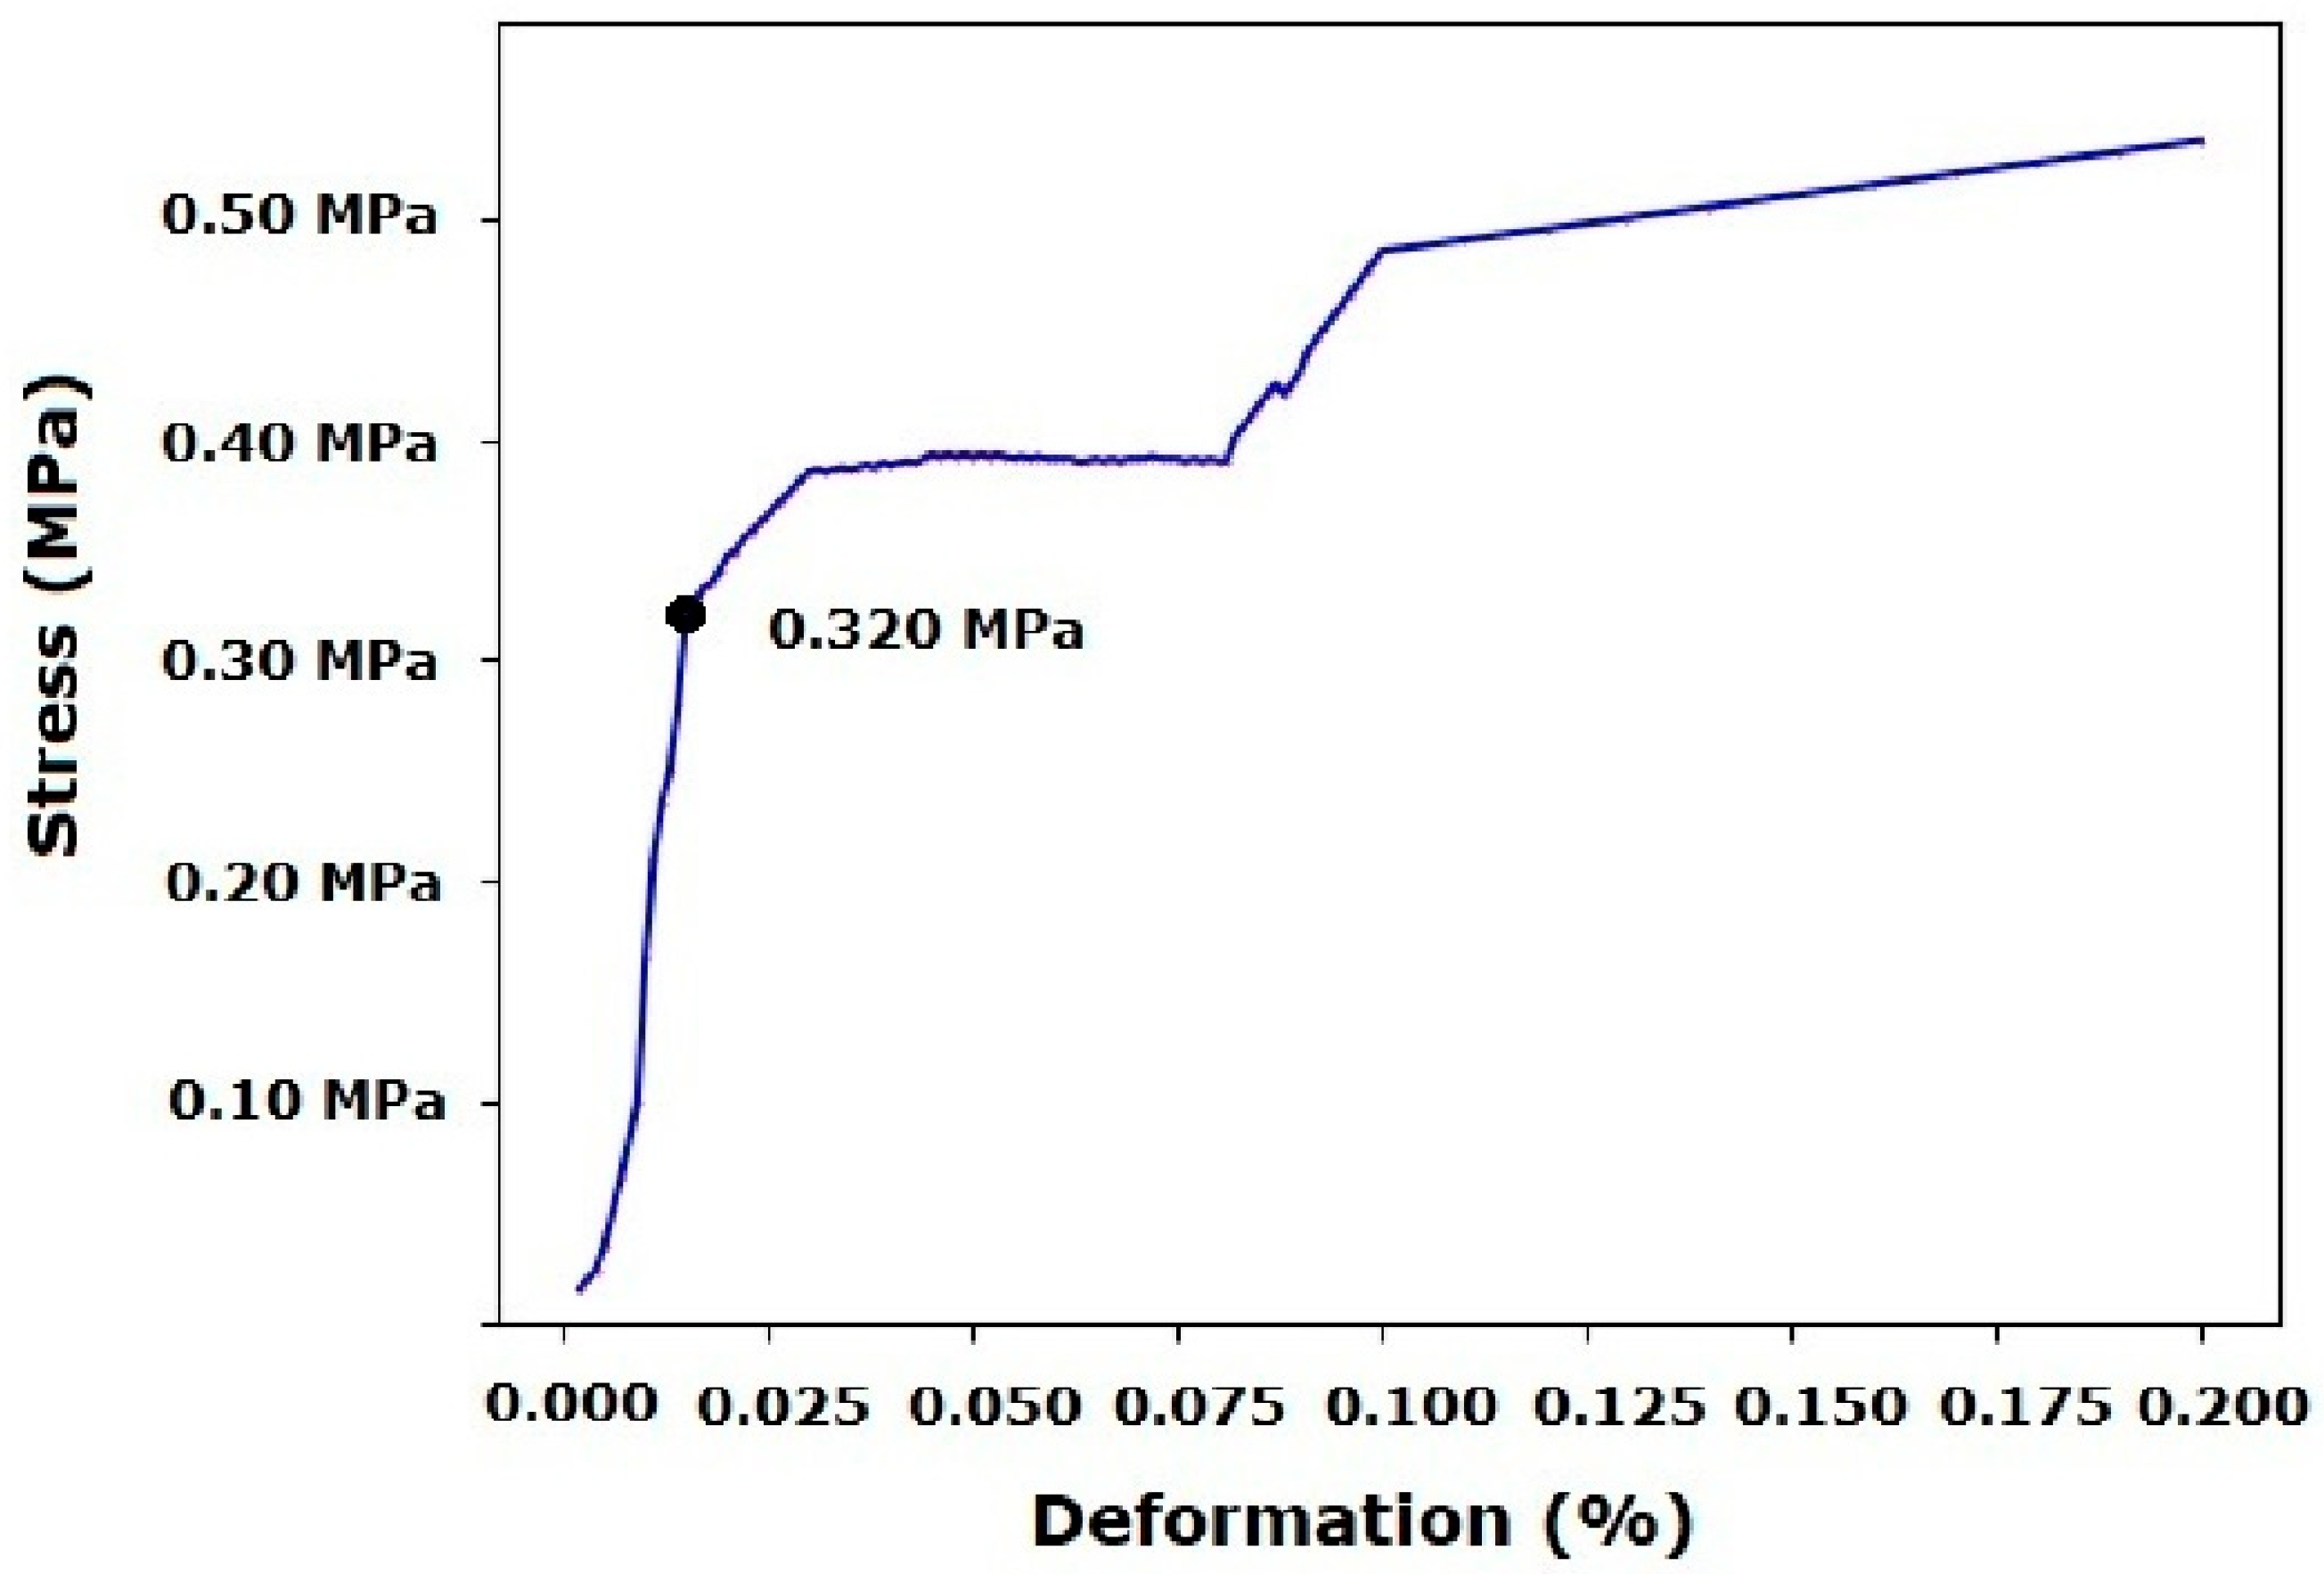
3.1. Gelatin/Siloxane Ink Synthesis

Experimental Validation

The gelatin/siloxane hybrid material exhibited shear-thinning behavior, characterized by decreasing viscosity with increasing shear stress. The maximum viscosity of 3 × 10⁶ Pa·s occurred at 5 Pa, while the minimum viscosity of 0.089 Pa·s was observed at 50 Pa. These findings suggest an optimal pressure range for extrusion-based 3D printing the BIO X 3D printer targeting a viscosity of 0.089 Pa·s, as shown in Figure 2a. Temperature also influenced viscosity, with the maximum recorded at 304.2 K, and the minimum of 307.2 K indicates shear thinning between 304.2 and 307.2 K (Figure 2b). Based on these results, the optimal printing conditions for the gelatin/siloxane hybrid material were determined in 50 Pa and 307.2 K [9,16,28,29,30].
Fourier-transform infrared (FTIR) spectroscopy was used to analyze the vibrational states of the gelatin/siloxane hybrid material and to understand the effects of crosslinking and UV radiation on its chemical and structural properties. Key functional groups identified in the material included hydroxyl (-OH), silanol (Si-OH), siloxane (O-Si-O), and secondary amines (NH+). The hydroxyl groups from dispersed siloxane particles were detected at an absorbance wavelength of 2900 cm−1, while the silanol group appeared at 900 cm−1 and the siloxane group at 1100 cm−1. Secondary amines, originating from gelatin, were observed at 1540 cm−1 and 1640 cm−1, with hydroxyl groups from hydroxyproline detected in the range of 2900–3000 cm−1. Following the 3D printing process, significant changes in the functional groups were observed. The intensity of secondary amines (NH+) at 1540 cm−1 and 1640 cm−1 increased, which can be attributed to physical changes caused by printing parameters such as temperature, pressure, and velocity. Additionally, there was attenuation in the hydroxyl groups (-OH) within the range of 2900–3000 cm−1, likely due to the oxidation of dispersed siloxane and gelatin particles. This oxidation enhanced the material’s thermomechanical properties. The silanol (Si-OH) and siloxane (O-Si-O) groups at 900 cm−1 and 1100 cm−1, respectively, also showed increased intensity, indicating oxidation of Si-OH to O-Si-O and interactions between siloxane particles and gelatin. The UV radiation treatment further modified the functional groups of the material. The intensity of secondary amines (NH+) at 1540 cm−1 and 1640 cm−1 was reduced, reflecting the physical transformation of the material from a gel to a solid state. The hydroxyl group (-OH) in the range of 2900–3000 cm−1 was completely attenuated, making it impossible to measure. Similarly, the silanol and siloxane groups (Si-OH and O-Si-O) at 900 cm−1 and 1100 cm−1 experienced significant attenuation, suggesting the conclusion of oxidation processes and the structural transition of the material into a solid state (Figure 3) [9,16,28,29,30].
Before printing, mechanical compression resistance characterization revealed that constructs printed with the gelatin/siloxane hybrid material exhibited a resistance of 180 kPa, with a deformation degree of 0.025%. Post-yield stress and deformation were observed with stable behavior, related to rheological and 3D printing tests (Figure 4). Following the 3D printing process, a mechanical compression resistance of 183 kPa was obtained with a deformation degree of 0.027%. Similarly, deformation remained stable after the yield stress. This behavior could be attributed to the thermo-reversible nature that inks must exhibit for printing complex 3D constructs (Figure 5) [9,16,28,29,30].

3.2. Finite Element Method Simulation of the 3D Printing Process

A computational model for the 3D printing process was developed using a volume flow simulation in SolidWorks 2022, incorporating the material’s physicochemical properties. The model analyzed the thermomechanical behavior of the material under varying pressures, temperatures, and velocities within the BIO X 3D printer cartridge (Figure 6). The simulation revealed the influence of printing parameters on material. The pressure and viscosity at the 25G nozzle (0.250 mm diameter) were determined, with ranges of 270–100 kPa for pressure and 10.38–0.0250 Pa·s for viscosity. These results differ from experimental conditions, where a pressure of 170 kPa, a temperature of 31 °C, and a printing velocity of 25 mm/s were used. The model provided insights into the effects of printing parameters on material flow, identifying potential causes of nozzle obstruction. The relationships between shear rate and shear stress were examined, emphasizing the importance of maintaining shear thinning behavior for optimal flow. Failure to do so could result in inadequate flow and nozzle clogging. The Hagen–Poiseuille equation was used to determine optimal printing conditions. After 70 simulations, the ideal parameters were established as 171 kPa pressure, 31 °C temperature, and 0.026 m/s extrusion velocity. Shear stress across the nozzle geometry ranged from 63.24 Pa to 829.60 Pa, while dynamic viscosity averaged 2.88 Pa·s, remaining below the material’s maximum viscosity of 30 Pa·s. This confirmed the suitability of the identified conditions for achieving consistent material flow and high-fidelity prints. During printing, the filament formation of the 22G/78S material was observed at 10 °C. Viscosity increased from 3.66 Pa·s to 23.16 Pa·s, with shear stress rising from 50.06 Pa to 80 Pa, facilitating filament formation. Upon contacting the print bed, the temperature dropped from 32 °C to 27 °C, aiding the crosslinking process and preserving filament properties (Figure 7). The estimated filament diameter of 0.253 ± 1 mm closely matched the nozzle diameter of 0.250 mm (Figure 8). Despite slight swelling during crosslinking, controlled printing ensured high dimensional fidelity and consistent mechanical properties. These findings highlight the computational model’s utility in optimizing the extrusion-based 3D printing process and ensuring accurate filament production [18,20,21,22,23,24,34,37,38].

3.3. Estimation of Printing Parameters Using a Machine Learning Model

A machine learning model was developed to estimate printing parameters and predict the similarity between printed meshes and CAD designs. A dataset comprising physical measurements (length, width, and filament diameter) and estimated data (similarity percentage of the printed meshes, measured both manually and using the SSIM index) was collected. These data were integrated into an Excel file, enabling image resizing and balancing of the “High” and “Low” labels through weight assignment and augmentation techniques, particularly for the manually labeled “High” images. Subsequently, a binary classifier based on a CNN was designed by splitting the dataset into 80% for training and 20% for testing. The training was carried out progressively, increasing the number of images in batches of 100 and applying Early Stopping to prevent overfitting. With the addition of six extra batches, 850 images were reached, ensuring adequate training [25,26,27,36].
The hyperparameters were optimized using various metrics, such as F1-score, accuracy, and recall. The latter showed the best performance, achieving an AUC value of 0.87 for the “High” label and 0.82 for the “Low” label. Additionally, the AUC-PR metric was employed to prevent overfitting and ensure proper model generalization (Figure 9). The general AUC value was calculated as 0.97. The statistical evaluation was completed by calculating the MSE and MAE metrics, which allowed the comparison of the model’s precision with the results obtained through a factorial DoE [25,26,27,36].
The binary classifier selected image 9, which exhibited the highest similarity percentage relative to the CAD design: 94.1433% according to the SSIM calculation and 97% when evaluated manually. Additionally, a filament diameter of 0.252 ± 0.6 mm was recorded. (Figure 10) [25,26,27,36].
Finally, the results of the CNN model were compared with manual tests, simulations using FEM, and experimental printing tests, thereby corroborating the robustness of the model. The results indicate that the CNN-based classifier is well-suited for classifying images of printed meshes and for optimally identifying the similarity percentage between the printed mesh and the CAD design, making it an accurate approach for determining the optimal printing parameters [25,26,27,36].

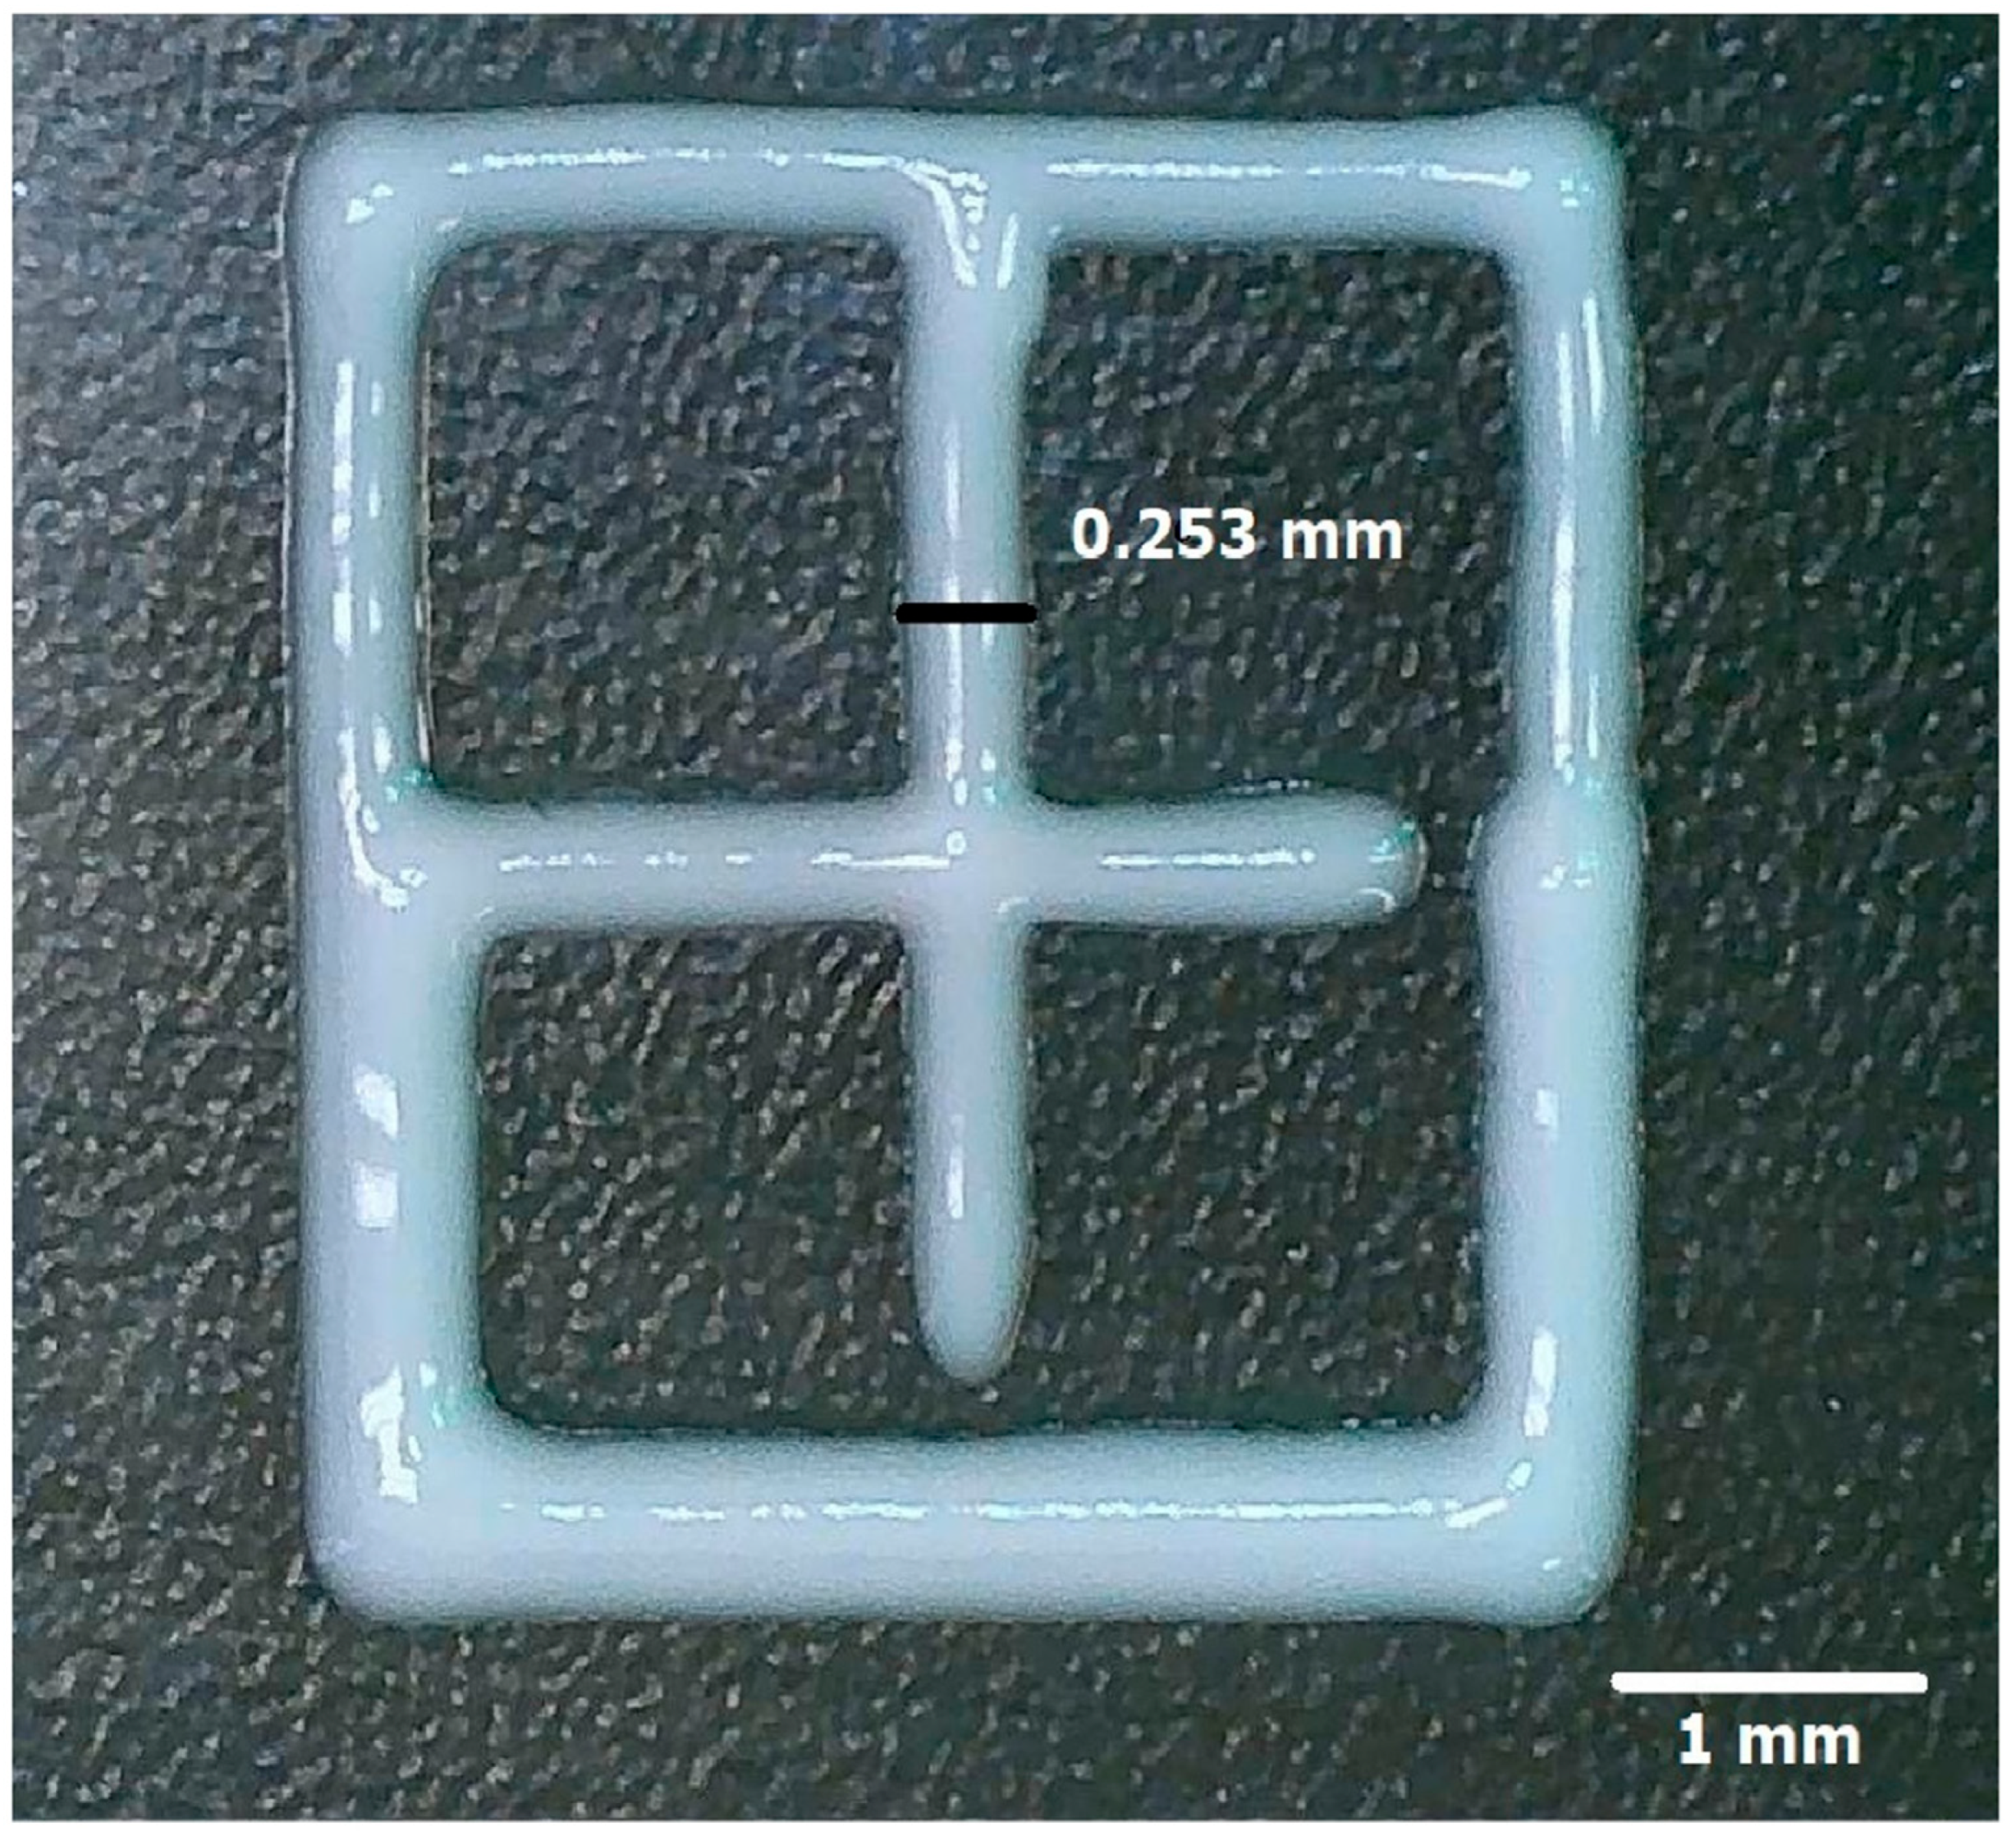
3.4. Validation 3D Printing Test

In this study, a total of 850 meshes (10 mm × 10 mm) were fabricated following the experimental matrix defined by the factorial Design of Experiments (DoE) framework. The printed meshes exhibited dimensional variability, with lengths ranging from 7.3 mm to 15.2 mm (mean: 11.028 ± 1.3 mm), widths spanning 8.5 mm to 14.8 mm (mean: 11.044 ± 1.2 mm), and filament diameters between 0.21 mm and 5 mm (mean: 1.098 ± 0.9 mm) (Figure 11). Each mesh was precisely measured using digital calipers, and high-resolution images were captured for statistical analysis and ML model training. The similarity percentage between the printed constructs and the CAD reference varied from 30% to 97% (mean: 54.5%). Furthermore, the experimentally obtained printing parameters were systematically compared with those derived from FEM simulations and ML predictive model, ensuring a rigorous validation of computational and experimental approaches [25,26,27,36].

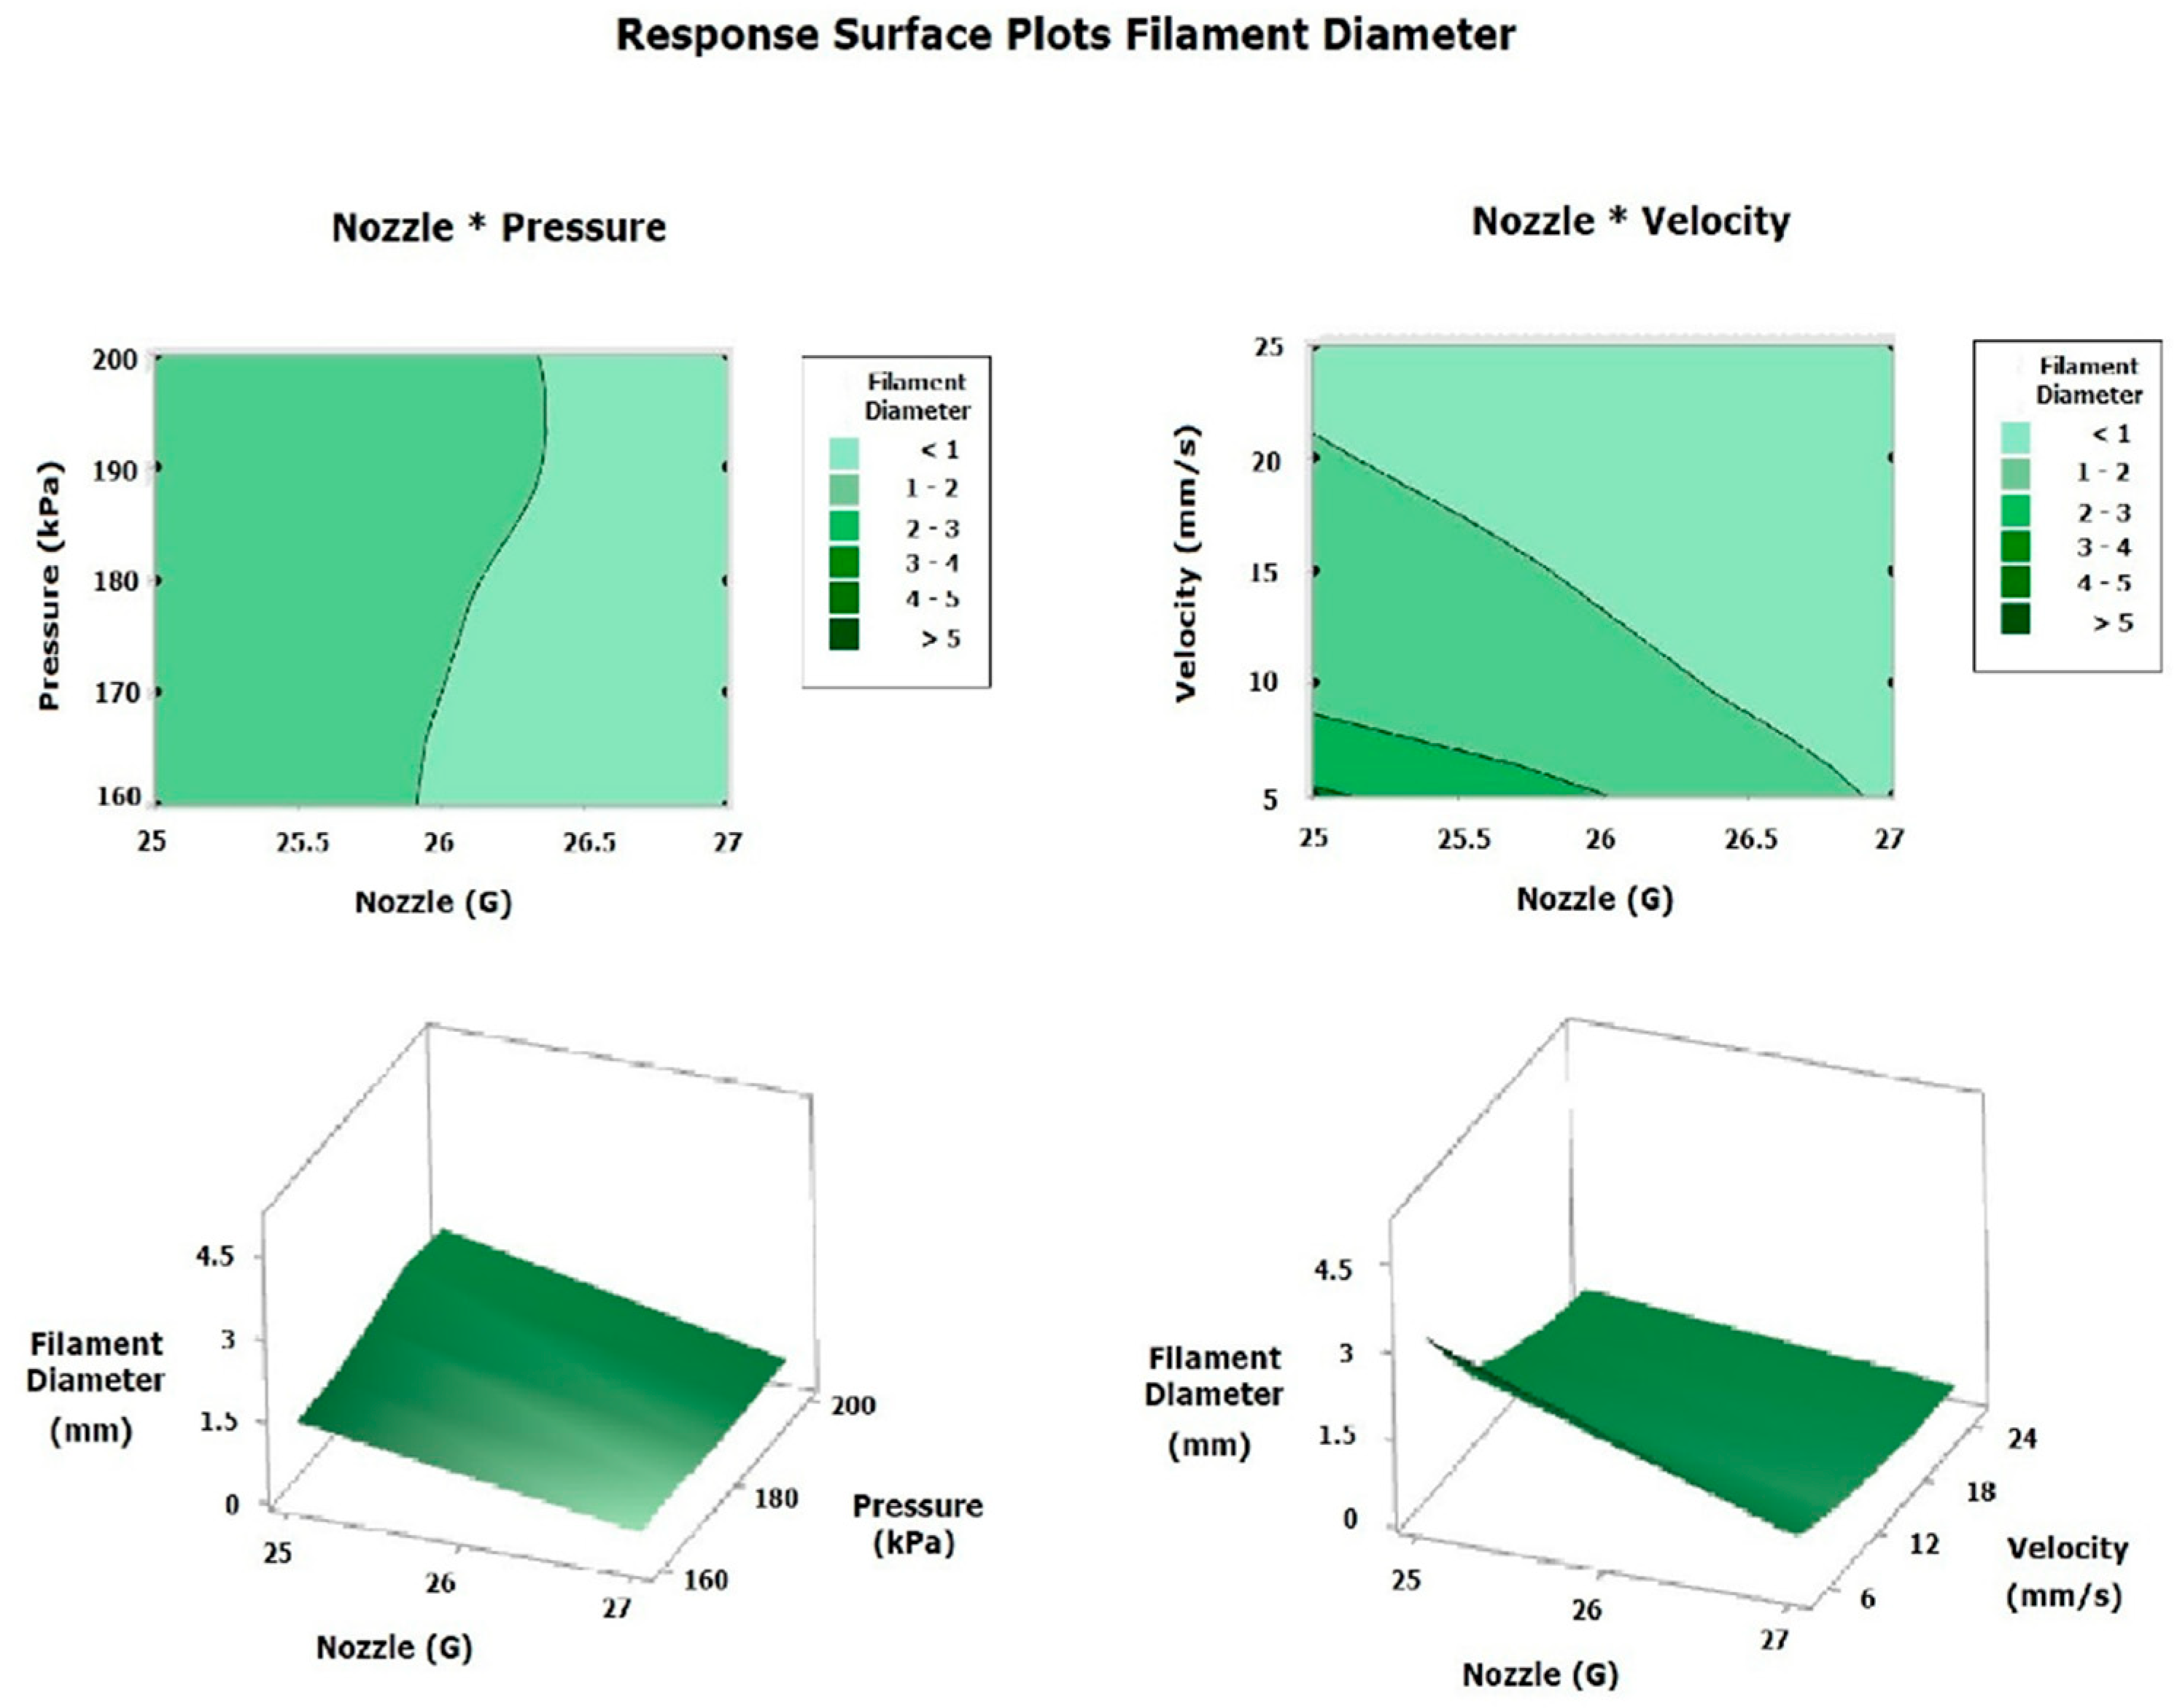
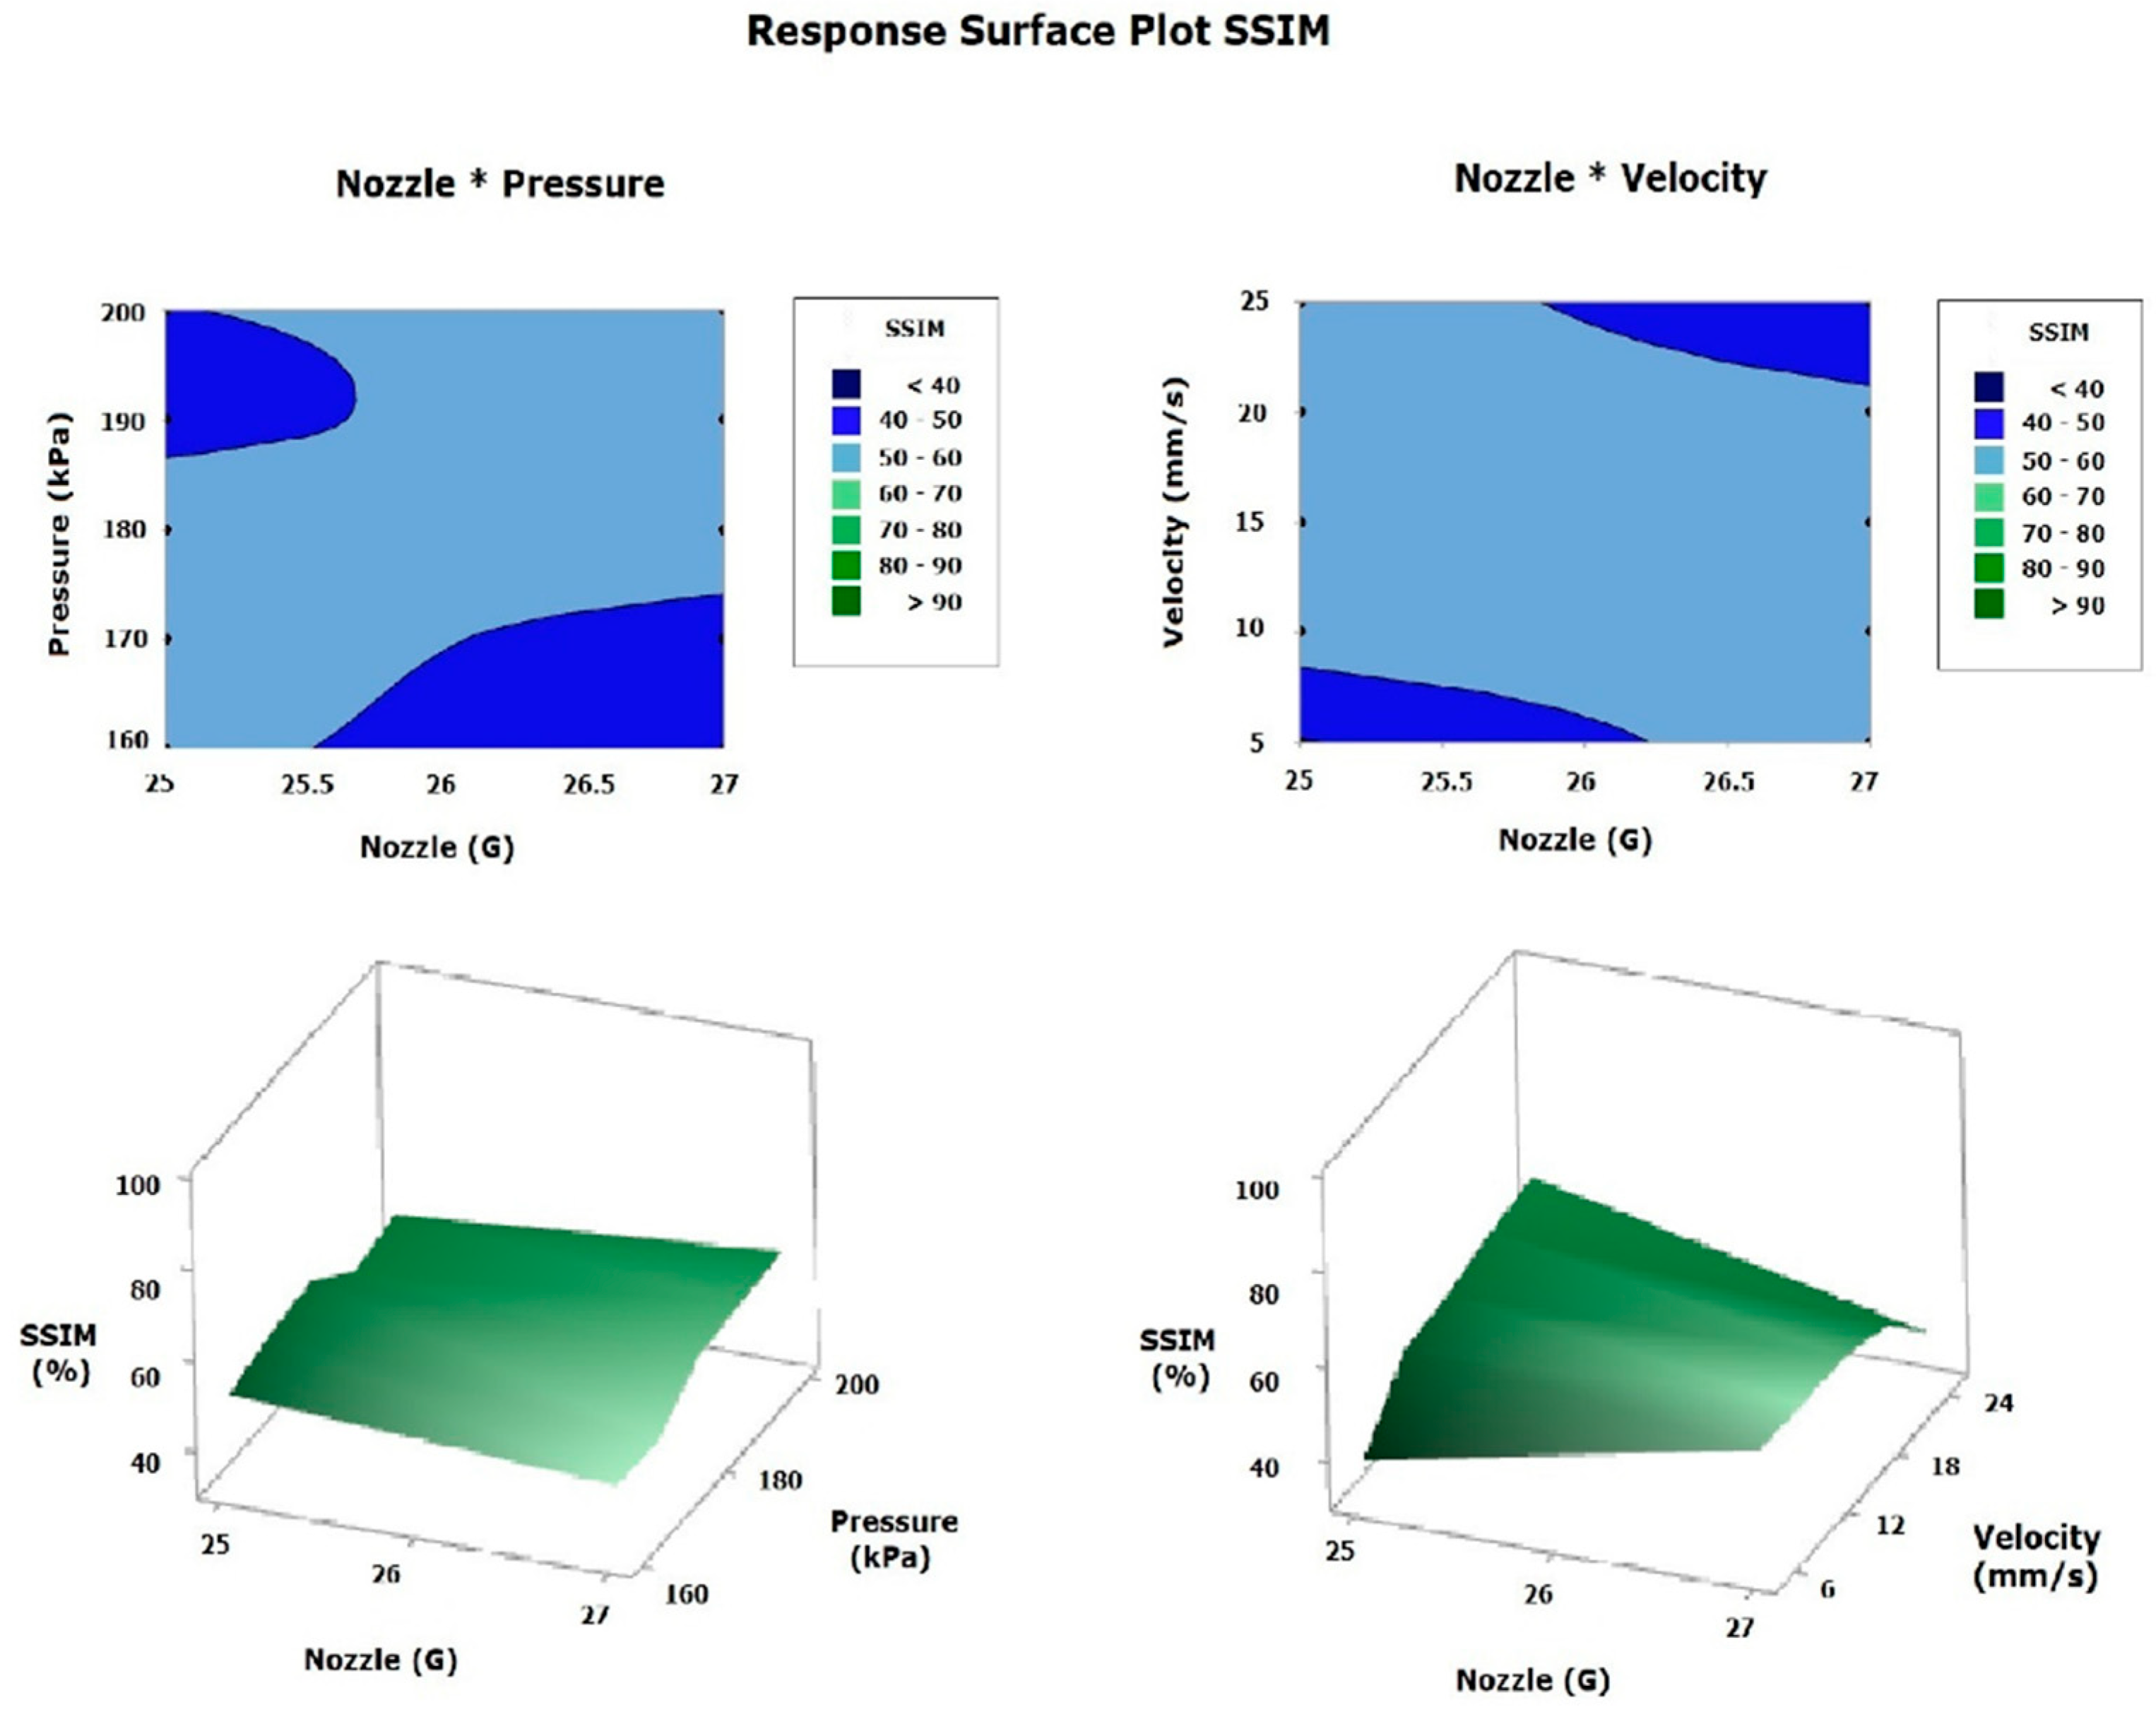
3.5. Design of Experiments

3.5.1. Three Factors/Two-, Five-, and Five-Level Factorial Design for Machine Learning Training

A full factorial design (n = 3) was used to investigate the relationship between printing parameters (speed, temperature, applied pressure, and nozzle) and the response variables: filament diameter and percentage of similarity concerning the CAD (Table 1). This study measured the filament diameter to be approximately 0.210–0.253 mm, corresponding to 27- and 25-gauge nozzles, respectively. The commercial maximum printing speed (20 mm/s) and applied pressure (200 kPa) were used with the ink from the 22G/78S material, although this material is extruded starting at a pressure of 160 kPa and a speed of 5 mm/s. The temperature was kept constant at 32 °C, following rheological studies of the gelatin/siloxane hybrid material, to reduce the variability in the filament diameter and the similarity percentage. Therefore, nozzle size, printing speed, and applied pressure were considered determining factors in viscosity variation (as a function of shear stress) (Figure 2a), in generating a continuous filament, and in increasing the similarity percentage with the printed CAD [18,25,26,27,37,38].
A Pareto chart with a reference line (α = 0.01) was used to examine which factors and interactions were statistically significant. This chart included the independent terms (A, B, C), the two-term interactions (AB, AC, BC), and the three-term interaction (ABC). For the filament diameter, the non-significant terms (ABC and BC, with p-values of 0.988 and 0.693, respectively) were removed, and for the similarity percentage, the terms A, B, BC, and ABC (with p-values of 0.757, 0.075, 0.895, and 0.766, respectively) were eliminated, as all were above α = 0.01. Polynomial linear regression equations were obtained for the filament diameter (Equation (19), R2 = 0.85) and the similarity percentage (Equation (20), R2 = 0.97) [18,25,26,27,37,38].
Filament Diameter = 1.0980 − 0.5492 (A − 26) + 0.0073 (B − 180) −0.0648 (C − 15) −0.0088 (A − 26) (B − 180) −0.0403 (A − 26) (C − 15)
SSIM = 51.810 + 0.233 (A − 26) + 0.10 (B − 180) +0.02 (C − 15) + 0.28 (A − 26) (B − 180) −0.63 (A − 26) (C − 15)
Main effects plots were used to display the relationship between the response variables and the independent factors. In the main effects plot for the similarity percentage (calculated by SSIM), it was observed that, independently, factor B had a statistically significant effect (p = 0.007), with an average similarity percentage of 57.76%. In contrast, factors A (p = 0.757) and C (p = 0.075) had a smaller impact. Among the two-factor interactions, the AB combination was the most influential (p = 0.000), achieving a similarity percentage of 60.12% with the 25G tip, while the BC interaction showed no significance (p = 0.895), and the AC interaction was significant (p = 0.001). The three-factor interactions were not significant (Figure 12). Notably, a velocity of 15 mm/s exhibited identical behavior with both 25G and 27G nozzles, achieving a similarity percentage of 57.8% [18,25,26,27,37,38].
In the main effects plot for the filament diameter, factor A had the greatest effect on the final finish of the filament during the 3D extrusion printing process (p = 0.000), with an average diameter of 0.5488 mm recorded with the 27G nozzle. Factor B also showed a significant effect (p = 0.000), and to a lesser extent, factor C (p = 0.001). Among the two-factor interactions, the AB combination was the most significant (p = 0.000), producing an average diameter of 0.388 mm with a 27G nozzle at a speed of 25 mm/s; the AC interaction was significant (p = 0.004), while the BC interaction had no effect (p = 0.693). The three-factor interactions were not significant (Figure 13). Finally, it was observed that the averages between the similarity percentage calculated by the ML model and the measurements taken with the digital caliper decreased, due to the effect of the “Low” category data considered during the ML model’s training process [18,25,26,27,37,38].

3.5.2. Response Surface Design

The polynomial regression model for the filament diameter is presented in Equation (19), and the similarity percentage calculated using the ML model with SSIM is shown in Equation (20). Both models were obtained by eliminating the factors and interactions (involving two or three factors) that were not statistically significant. These equations generated surface plots for the filament diameter (Figure 14) and the similarity percentage (Figure 15), with the most significant factors represented on the x- and y-axes and the corresponding response variable on the z-axis. This approach enabled a comparison of the printing parameters (pressure, velocity, and nozzle size) based on the experimental estimates, FEM simulation, and the ML model [9,18,25,26,27,31,35,36,37,38].
The response surface plots for the filament diameter and similarity percentage were generated after filtering out non-significant factors and assigning the nozzle as the x-axis variable, as it had the most statistically significant effect. Note that the Pressure*Velocity interaction was discarded from the surface analysis due to its lack of significance. The filament diameter surface plot (Figure 14) demonstrated that, in the Nozzle*Pressure analysis, using the 27G nozzle produced a smaller filament diameter, reaching an optimal level at 200 kPa; however, since the diameter decreased excessively at high pressures, the optimum was determined to be at 170 kPa with a 27G nozzle. Similarly, the Nozzle*Speed analysis revealed that the worst conditions—with a diameter exceeding 5 mm—occurred with a 25G nozzle at 5 mm/s, while the filament diameter decreased proportionally with increasing printing speed and when using the 27G nozzle. Thus, the ideal condition for obtaining an expected diameter of less than 1 mm is to use a 27G nozzle and a printing velocity of 25 mm/s. In summary, the ideal parameters for the filament diameter were a 27G nozzle, a pressure of 170 kPa, and a printing velocity of 25 mm/s [9,18,25,26,27,31,35,36,37,38].
The response surface plot for the SSIM (Figure 15) calculated by the ML model showed an average value in the study range of approximately 50–60%. For the Nozzle*Pressure interaction, it was observed that the ideal parameters are a pressure between 170 and 180 kPa, and the use of a 25G nozzle—because at high pressures and with the 27G nozzle, the filament gets cut—negatively affects the similarity percentage relative to the CAD. Furthermore, the analysis of the Nozzle*Velocity interaction indicated that both at 25 mm/s with a 27G nozzle and at 5 mm/s with a 25G nozzle, the SSIM was reduced; therefore, the ideal conditions considering this index are approximately a speed of 15–20 mm/s combined with a 25–27G nozzle, with the SSIM surface analysis suggesting a pressure of 180 kPa, a speed of 15 mm/s, and a 25–27G nozzle. Using the ML model to calculate the SSIM allows for the incorporation of the properties of the material used as ink—in this case, the gelatin/siloxane hybrid material—thus facilitating the combination of the filament diameter analysis and the SSIM to determine the optimal printing parameters. This integrated approach takes into account both the physicochemical properties of the ink and the final structure of the printed part [9,18,25,26,27,31,35,36,37,38].

3.6. Statistical Comparison Between the Experimental Estimation, FEM Simulation, and ML Model

The selection of the applied pressure intervals (160–200 kPa) and printing speed (5–25 mm/s) was based on the rheological tests of the 22G78S ink and the specifications of the BIO X 3D printer to study their effect on the filament diameter and calculate the similarity percentage concerning the CAD using the binary CNN classifier model. The printing temperature was fixed at 32 °C, according to the rheological characterization, while nozzle sizes of 25–27 G were selected based on initial printing tests [9,18,32,33].
The initial physicochemical characterization tests allowed for an experimental estimation of the printing parameters. Likewise, the simulation of the physicochemical properties of the 22G78S ink through a volumetric fluid simulation using FEM facilitated the estimation of printing parameters (Table 2). The printing validation tests enabled the printing of different meshes within the previously defined intervals, which allowed for the validation of the printing parameters estimated both experimentally and via FEM simulation [18,21,25,26,27,31,35,36,37,38]. Subsequently, the printing diameters of the obtained meshes were measured using a digital caliper to corroborate the FEM simulation estimates. The images captured by the Tomlov digital microscope were then used to train the binary CNN classifier model, which determined the similarity percentage concerning the CAD manually and using SSIM (Table 2). Finally, by considering the printing parameters and comparing the factorial DoE experiment matrix, the printing parameters were estimated by selecting the image that exhibited the highest similarity to the CAD design (Table 2) [9,18,21,25,26,27,31,35,36,37,38].
Through statistical analysis of the factorial DoE, it was estimated that, experimentally, a filament diameter of 1.098 mm, a similarity percentage concerning the CAD of 54.5%, and an R2 coefficient of 0.79 were obtained (Table 3); these parameters showed the worst performance during the validation tests (Figure 11). The FEM simulation produced an average filament diameter of 0.253 mm and a similarity percentage of 92.35%, with an R2 coefficient of 0.94 (Table 3), indicating an improvement in approximating the conditions and the final finish of the printed filament (Figure 11). Finally, the binary CNN classifier model, trained with the image most similar to the CAD using SSIM, yielded an average filament diameter of 0.252 mm and a similarity percentage of 94.13%, using an AUC value of 0.97 (Table 3) as a comparative metric against the R2 coefficient obtained in the statistical analysis of the factorial DoE for both the experimental estimation and the FEM simulation (Figure 11) According to the statistical comparison, the most accurate estimation method was the ML model [18,25,26,27,35].
The Pearson correlation test at a 95% confidence interval revealed that there is a positive relationship between the manual calculation of the similarity percentage relative to the CAD design and that learned by the binary CNN classifier model, with a correlation coefficient of 0.841, a p value of 0.000, and a confidence interval of (0.801, 0.874). This validates that the model learned correctly and that the results were not due to chance. Similarly, there was a negative correlation between the response variables—filament diameter and similarity percentage relative to the CAD—with a correlation coefficient of −0.316, a p value of 0.000, and a confidence interval of (−0.424, −0.200), indicating an inversely proportional relationship between the filament diameter and the similarity percentage. In other words, if the filament diameter increases, the similarity percentage decreases, and vice versa. This was confirmed experimentally and reinforces the optimal parameters obtained by combining the FEM simulation and the ML model: a 25G nozzle, an applied pressure of 170 kPa, a printing speed of 25 mm/s, and a temperature of 32 °C, which yielded an average filament diameter of 0.253 mm and a similarity percentage of 92.35% relative to the CAD design [18,25,26,27,31,35,36,37,38].

4. Discussion

The experimental validation of the 3D printing process for the gelatin/siloxane hybrid material focused on rheological characterization and mechanical testing. The relationship between viscosity and shear stress was analyzed, showing that a shear stress of 50 Pa·s corresponded to an applied pressure of over 150 kPa. Ideal shear thinning behavior was observed between 30 °C and 32 °C, with viscosity being too high at lower temperatures and transitioning to Newtonian behavior at higher temperatures. Consequently, the printing temperature was set at 32 °C for the BIO X 3D printer. The printing velocity was determined using parameters from previous studies, enabling validation of the computational model [9,18,25,26,27,31,35,36,37,38].
Mechanical testing revealed a slight decrease in compression strength after printing (0.027% deformation), but UV radiation treatment improved this strength, supporting biological material deposition. FTIR analysis attributed these changes to silanol oxidation, which promotes gelatin–siloxane interactions (conversion of Si-OH to O-Si-O) and enhances rheological and mechanical behavior. Oxidation reduces viscosity, enabling smooth printing and consistent filament extrusion. The material was successfully printed at 180 kPa and 32 °C, achieving 50–90% filament fidelity as measured by optical microscopy [9,18,28,29,30,31,36,37,38].
Based on the Astrid mathematical model and implemented in SolidWorks 2022, the computational model used thermomechanical properties such as density, specific heat, thermal conductivity, and viscosity—the Hagen-Poiseuille equation determined extrusion velocity, identifying optimal conditions for high-fidelity printing. Simulations revealed dynamic viscosity variations from 10 Pa·s to 0.025 Pa·s, aligning with experimental observations. The material maintained a viscosity below 30 Pa·s, avoiding non-Newtonian behavior. After 70 simulations, optimal parameters were defined: 170 kPa pressure, 31.2 °C temperature, and 25 mm/s printing velocity [9,18,25,26,27,31,35,36,37,38].
The training of the binary CNN classifier model enabled the identification of the printed mesh most similar to the CAD design and the calculation of its similarity percentage by comparing the three methods for estimating printing parameters (experimental, FEM simulation, and ML model), as shown in Table 3. It is worth noting that the ML model considers only the morphological and structural finish of the printed constructs, without considering the material used. This allows for a broader analysis that is not limited to specific materials. In contrast, FEM simulation enables the analysis of the final finish of complex 3D constructs from the perspective of the material employed. Therefore, the combination of both tools—volumetric flow simulation by FEM and the binary CNN classifier model—facilitates the determination of optimal printing parameters, considering the physicochemical properties of the material used as ink, especially its mechanical properties for future incubation processes and biological material deposition [9,18,25,26,27,31,35,36,37,38].
Simultaneously, the ML model calculates the similarity percentage concerning the CAD of the complex 3D printed constructs, considering the printing parameters estimated by the FEM simulation, which are regarded as optimal based on the mechanical properties of the ink. In the case of the gelatin/siloxane hybrid material, printing parameters of a 25G nozzle, an applied pressure of 170 kPa, a printing velocity of 25 mm/s, and a constant temperature of 32 °C were obtained, with a similarity percentage to the CAD of 92.35%. Although this percentage is lower than that suggested by the ML model, the slightly smaller diameter of the printed mesh could affect the mechanical properties of the 3D construct when additional layers are printed, thereby compromising structural integrity [9,18,25,26,27,31,35,36,37,38].
The factorial DoE was employed as a tool to evaluate the accuracy and precision of the parameter estimation methods through polynomial regression models, surface analyses, and the study of the response variables (filament diameter and similarity percentage). This allowed for the determination of optimal printing parameters and for obtaining a 2D visualization, based on the images captured by the Tomlov digital microscope, of the different printed layers. Additionally, the interactions among the various factors in the 3D extrusion printing process using the BIO X printer were analyzed to identify the parameters that ensure the best structural and physicochemical performance of complex 3D constructs.

5. Conclusions

This study demonstrates the computational model’s superiority in optimizing 3D printing processes, particularly for biological applications involving organic, inorganic, and hybrid materials. However, achieving optimal printability requires an exhaustive physicochemical characterization of the ink. In the case of the gelatin/siloxane hybrid material, the results indicate that the oxidation of dispersed siloxane particles is a fundamental factor in determining its thermomechanical properties, directly influencing its rheological behavior and mechanical performance, which in turn facilitates the fabrication of complex 3D structures. Furthermore, statistical comparisons using a factorial DoE revealed that the computational model consistently produced structures with filament diameters more closely aligned to CAD reference than those obtained through trial–error experimental procedures. This precision is critical for improving the mechanical integrity of printed constructs and ensuring the effective deposition of biological materials in subsequent processing steps. These findings highlight the pivotal role of computational modeling in optimizing extrusion-based 3D printing for biomedical applications, emphasizing the necessity of coupling such approaches with rigorous physicochemical material characterization to achieve reproducible and high-fidelity biofabrication.

Author Contributions

Conceptualization, M.B.V.-R. and C.A.M.-P.; methodology, M.B.V.-R.; software, M.B.V.-R. and L.C.M.-G.; validation, L.C.M.-G. and R.Á.-L.; formal analysis, M.B.V.-R., J.S.C.-C. and C.A.M.-P.; investigation, M.B.V.-R.; resources, C.A.M.-P.; data curation, H.M.-R.; writing—original draft preparation, M.B.V.-R.; writing—review and editing, C.A.M.-P., C.C.-G. and E.S.Z.-A. visualization, M.B.V.-R.; supervision, C.A.M.-P. and E.S.Z.-A.; project administration, C.A.M.-P.; funding acquisition, C.A.M.-P. and E.S.Z.-A. All authors have read and agreed to the published version of the manuscript.

Funding

This research received was funded by CONACyT.

Institutional Review Board Statement

Not applicable.

Data Availability Statement

The original contributions presented in this study are included in the article. Further inquiries can be directed to the corresponding author.

Acknowledgments

M. B. Valenzuela-Reyes would like to thank SECIHTI for scholarship funding at Universidad Autónoma de Ciudad Juárez, (2023–2026).

Conflicts of Interest

The authors declare no conflicts of interest.

References

  1. Hölzl, K.; Lin, S.; Tytgat, L. Bioink properties before, during and after 3D bioprinting. Biofabrication 2016, 8, 032002. [Google Scholar] [CrossRef] [PubMed]
  2. Lelièvre, S.A.; Kwok, T.; Chittiboyina, S. Architecture in 3D cell culture: An essential feature for in vitro toxicology. Toxicol. Vitr. 2017, 45, 287–295. [Google Scholar] [CrossRef] [PubMed]
  3. Boccaccini, A.R.; Blaker, J.J. Bioactive composite materials for tissue engineering scaffolds. Expert Rev. Med. Devices 2015, 2, 303–317. [Google Scholar] [CrossRef]
  4. Gold, K.; Gaharwar, A.K.; Jain, A. Emerging trends in multiscale modeling of vascular pathophysiology: Organ-on-a-chip and 3D printing. Biomaterials 2019, 196, 2–17. [Google Scholar] [CrossRef]
  5. Rezaei, H.; Asefnejad, A.; Daliri Joupari, M.; Joughehdoust, S. The physicochemical and mechanical investigation of siloxane modified Gelatin/Sodium alginate injectable hydrogels loaded by ascorbic acid and β-Glycerophosphate. Mater. Today Commun. 2021, 26, 101914. [Google Scholar] [CrossRef]
  6. Mei, Q.; Rao, J.; Bei, H.P. 3D Bioprinting Photo-Crosslinkable Hydrogels for Bone and Cartilage Repair. Int. J. Bioprint. 2021, 7, 367. [Google Scholar] [CrossRef]
  7. Nallusamy, J.; Das, R. Hydrogels and their role in bone tissue engineering: An overview. J. Pharm. BioAllied Sci. 2021, 13, 908–912. [Google Scholar] [CrossRef]
  8. Yang, Z.; Yi, P.; Liu, Z. Stem Cell-Laden Hydrogel-Based 3D Bioprinting for Bone and Cartilage Tissue Engineering. Front. Bioeng. Biotechnol. 2022, 10, 865770. [Google Scholar] [CrossRef]
  9. Wojciechowska, P.; Cierpiszewski, R.; Maciejewski, H. Gelatin–Siloxane Hybrid Monoliths as Novel Heavy Metal Adsorbents. Appl. Sci. 2022, 12, 1258. [Google Scholar] [CrossRef]
  10. Urciuolo, A.; Giobbe, G.G.; Dong, Y. Hydrogel-in-hydrogel live bioprinting for guidance and control of organoids and organotypic cultures. Nat. Commun. 2023, 14, 37953–37954. [Google Scholar] [CrossRef]
  11. Wang, X.; Ao, Q.; Tian, X. Gelatin-Based Hydrogels for Organ 3D Bioprinting. Polymers 2017, 9, 401. [Google Scholar] [CrossRef] [PubMed]
  12. He, Y.; Yang, F.; Zhao, H. Research on the printability of hydrogels in 3D bioprinting. Sci. Rep. 2016, 6, 29977. [Google Scholar] [CrossRef]
  13. Da Silva, A.C.; Wang, J.; Minev, I.R. Electro-assisted printing of soft hydrogels via controlled electrochemical reactions. Nat. Commun. 2022, 13, 1353. [Google Scholar] [CrossRef]
  14. Zhou, T.; Yuk, H.; Hu, F. 3D printable high-performance conducting polymer hydrogel for all-hydrogel bioelectronic interfaces. Nat. Mater. 2023, 22, 895–902. [Google Scholar] [CrossRef] [PubMed]
  15. Caprioli, M.; Roppolo, I.; Chiappone, A. 3D-printed self-healing hydrogels via Digital Light Processing. Nat. Commun. 2021, 12, 462. [Google Scholar] [CrossRef] [PubMed]
  16. Valenzuela-Reyes, M.B. Estudio de las Propiedades Termomecánicas del Material Híbrido de Gelatina/Siloxano Como Biotinta Para Bioimpresión Por Extrusión; Universidad Autonoma de Ciudad Juarez: Chihuahua, Mexico, 2020. [Google Scholar]
  17. Chen, X.B.; Fazel Anvari-Yazdi, A.; Duan, X. Biomaterials/bioinks and extrusion bioprinting. Bioact. Mater. 2023, 28, 511–536. [Google Scholar] [CrossRef]
  18. Fareez, U.N.; Naqvi, S.A.; Mahmud, M.; Temirel, M. Computational Fluid Dynamics (CFD) Analysis of Bioprinting. Adv. Healthc. Mater. 2024, 13, 2400643. [Google Scholar] [CrossRef]
  19. Göhl, J.; Markstedt, K.; Mark, A. Simulations of 3D bioprinting: Predicting bioprintability of nanofibrillar inks. Biofabrication 2018, 10, 034105. [Google Scholar] [CrossRef]
  20. Namvar, N.; Moloukzadeh, I.; Zolfagharian, A. Bio-inspired design, modeling, and 3D printing of lattice-based scale model scooter decks. Int. J. Adv. Manuf. Technol. 2023, 126, 2887–2903. [Google Scholar] [CrossRef]
  21. Oladapo, B.; Zahedi, A.; Ismail, S. 3D-printed biomimetic bone implant polymeric composite scaffolds. Int. J. Adv. Manuf. Technol. 2023, 126, 4259–4267. [Google Scholar] [CrossRef]
  22. Lannunziata, E.; Colucci, G.; Minetola, P.; Giubilini, A. Effect of annealing treatment and infill percentage on 3D-printed PEEK samples by Fused Filament Fabrication. Int. J. Adv. Manuf. Technol. 2024, 131, 5209–5222. [Google Scholar] [CrossRef]
  23. Suthithanakom, S.; Sithiwichankit, C.; Chaiprabha, K.; Chancharoen, R. Flexible actuation with intrinsic sensing for ram extrusion 3D printing. Int. J. Adv. Manuf. Technol. 2024, 131, 5787–5799. [Google Scholar] [CrossRef]
  24. Sun, J.; Gong, Y.; He, Y.; Fan, C.; Chen, H.; Shao, H.; Zhou, R. Process optimization for coaxial extrusion-based bioprinting: A comprehensive analysis of material behavior, structural precision, and cell viability. Addit. Manuf. 2025, 100, 104682. [Google Scholar] [CrossRef]
  25. Limon, S.M.; Quigley, C.; Sarah, R.; Habib, A. Advancing scaffold porosity through a machine learning framework in extrusion based 3D bioprinting. Front. Mater. 2024, 10, 1337485. [Google Scholar] [CrossRef]
  26. Wang, J.; Heshmati, A.N.; Jiang, J. 3D bioprinted microparticles: Optimizing loading efficiency using advanced DoE technique and machine learning modeling. Int. J. Pharm. 2022, 628, 122302. [Google Scholar] [CrossRef] [PubMed]
  27. Shin, J.; Lee, Y.; Li, Z. Optimized 3D Bioprinting Technology Based on Machine Learning: Rev Recent Trends and Advances. Micromachines 2022, 13, 363. [Google Scholar] [CrossRef]
  28. Mahony, O.; Tsigkou, O.; Ionescu, C. Silica-Gelatin Hybrids with Tailorable Degradation and Mechanical Properties for Tissue Regeneration. Adv. Funct. Mater. 2010, 20, 3835–3845. [Google Scholar] [CrossRef]
  29. Greenhalgh, R.D.; Ambler, W.S.; Quinn, S.J. Hybrid sol–gel inorganic/gelatin porous fibres via solution blow spinning. J. Mater. Sci. 2017, 52, 9066–9081. [Google Scholar] [CrossRef]
  30. Smitha, S.; Mukundan, P.; Krishna, P.P.; Warrier, K. Silica–gelatin bio-hybrid and transparent nano-coatings through sol–gel technique. Mater. Chem. Phys. 2007, 103, 318–322. [Google Scholar] [CrossRef]
  31. Arjoca, S.; Bojin, F.; Neagu, M.; Paunescu, A.; Neagu, A.; Paunescu, V. Hydrogel extrusion speed measurements for the optimization of bioprinting parameters. Gels 2024, 10, 103. [Google Scholar] [CrossRef]
  32. Paxton, N.; Smolan, W.; Böck, T. Proposal to assess printability of bioinks for extrusion-based bioprinting and evaluation of rheological properties governing bioprintability. Biofabrication 2017, 9, 44107. [Google Scholar] [CrossRef] [PubMed]
  33. Paxton, N.C.; Ren, J.; Ainsworth, M.J. Rheological Characterization of Biomaterials Directs Additive Manufacturing of Strontium-Substituted Bioactive Glass/Polycaprolactone Microfibers. Macromol. Rapid Commun. 2019, 40, 1900019. [Google Scholar] [CrossRef]
  34. Oyinloye, T.M.; Yoon, W.B. Application of computational fluid dynamics (CFD) in the deposition process and printability assessment of 3D printing using rice paste. Processes 2022, 10, 68. [Google Scholar] [CrossRef]
  35. Krishna, D.V.; Sankar, M.R. Machine learning-assisted extrusion-based 3D bioprinting for tissue regeneration applications. Ann. 3D Print. Med. 2023, 12, 100132. [Google Scholar] [CrossRef]
  36. Zhang, C.; Elvitigala, K.C.M.L.; Murbarok, W.; Okano, Y.; Sakai, S. Machine learning-based prediction and optimization framework for as-extruded cell viability in extrusion-based 3D bioprinting. Virtual Phys. Prototyp. 2024, 19, e2400330. [Google Scholar] [CrossRef]
  37. Raja, V.; Nimbkar, S.; Moses, J.A.; Nair, S.V.R.; Anandhramakrishnan, C. Modeling and simulation of 3D food printing systems—Scope, advances and challenges. Foods 2023, 12, 3412. [Google Scholar] [CrossRef]
  38. Lombardi, L.; Scalzone, A.; Ausilio, C.; Gentile, P.; Tammaro, D. Optimizing nozzle design in extrusion-based 3D bioprinting to minimize mechanical stress and enhance cell viability. Bioprinting 2025, 11, 025190182. [Google Scholar] [CrossRef]
Figure 1. Printed CAD Designs: (a) A flat 10 × 10 mm mesh designed for initial calibration and validation tests. (b) An anatomically complex 3D construct representing the tricuspid and bicuspid heart valves.
Polymers 17 01838 g001
Figure 2. Rheological characterization of the gelatin/siloxane ink: (a) Viscosity as a function of shear stress. (b) Viscosity as a function of temperature.
Polymers 17 01838 g002
Figure 3. Gelatin/siloxane hybrid material FTIR spectrum before printing, after printing, and after UV treatment.
Polymers 17 01838 g003
Figure 4. Mechanical compression test after printing.
Polymers 17 01838 g004
Figure 5. Mechanical compression test after UV treatment.
Polymers 17 01838 g005
Figure 6. Volumetric flow simulation by FEM: ink flows through a 25G nozzle.
Polymers 17 01838 g006
Figure 7. Simulation of the temperature effect on the printing bed.
Polymers 17 01838 g007
Figure 8. Estimation of the filament diameter.
Polymers 17 01838 g008
Figure 9. ROC curve and AUC values for the “Low” and “High” classes.
Polymers 17 01838 g009
Figure 10. Image of the printed mesh with the highest similarity percentage relative to the CAD design.
Polymers 17 01838 g010
Figure 11. Comparison of the filament diameters obtained with the different parameter estimation methods.
Polymers 17 01838 g011
Figure 12. Main effects plot of the SSIM calculated by the ML model.
Polymers 17 01838 g012
Figure 13. Main effects plot of the filament diameter measured from the printing tests.
Polymers 17 01838 g013
Figure 14. Response surface plot filament diameter.
Polymers 17 01838 g014
Figure 15. Response surface plot SSIM.
Polymers 17 01838 g015
Table 1. Three factors/two-, five-, and five-level factorial design.
ParametersLevels
Nozzle size (G)27 25
Pressure (kPa)160170 180190200
Printing velocity (mm/s)5 10 15 2025
Table 2. Gelatin/siloxane ink printing parameters.
Printing Parameters Estimation
Printing ParametersExperimentalFEM SimulationML Model
Nozzle size (G)272525
Temperature (°C)323232
Pressure (kPa)180170170
Velocity (mm/s)302520
Table 3. Statistical comparison of the estimation methods for the printing parameters of the gelatin/siloxane ink.
Estimation Methods Comparison
Estimation Methods Diameter Filament (mm) Similarity Percentage (%) AUC/R2MSEMAE
Experimental1.09854.50.790.90051.086
FEM simulation0.25392.350.850.00340.004
ML model 0.25294.130.970.00310.003
Disclaimer/Publisher’s Note: The statements, opinions and data contained in all publications are solely those of the individual author(s) and contributor(s) and not of MDPI and/or the editor(s). MDPI and/or the editor(s) disclaim responsibility for any injury to people or property resulting from any ideas, methods, instructions or products referred to in the content.

