
Surface Morphology and Degradation of Poly[(R)-3-Hydroxybutyrate]-block-Poly(ε-Caprolactone) and Poly[(R)-3-Hydroxybutyrate]-block-Poly(l-Lactide) Biodegradable Diblock Copolymers

 , and
, and
Abstract

1. Introduction
2. Materials and Methods
2.1. Materials
2.2. Synthesis of PHBCL and PHBLA Diblock Copolymers
2.2.1. Synthesis of LMPHB Initiator
2.2.2. ROP of ε-CL and l-Lactide Cyclic Monomers
2.3. Structural Analysis (1H NMR and GPC)
2.4. Thermal Analysis (DSC, TGA and WAXD)
2.5. WAXD Measurements
2.6. POM Observation
2.7. Melt-Crystallized Thin-Film Sample Preparation
2.8. AFM Observation
2.9. Enzymatic Degradation
3. Results and Discussion
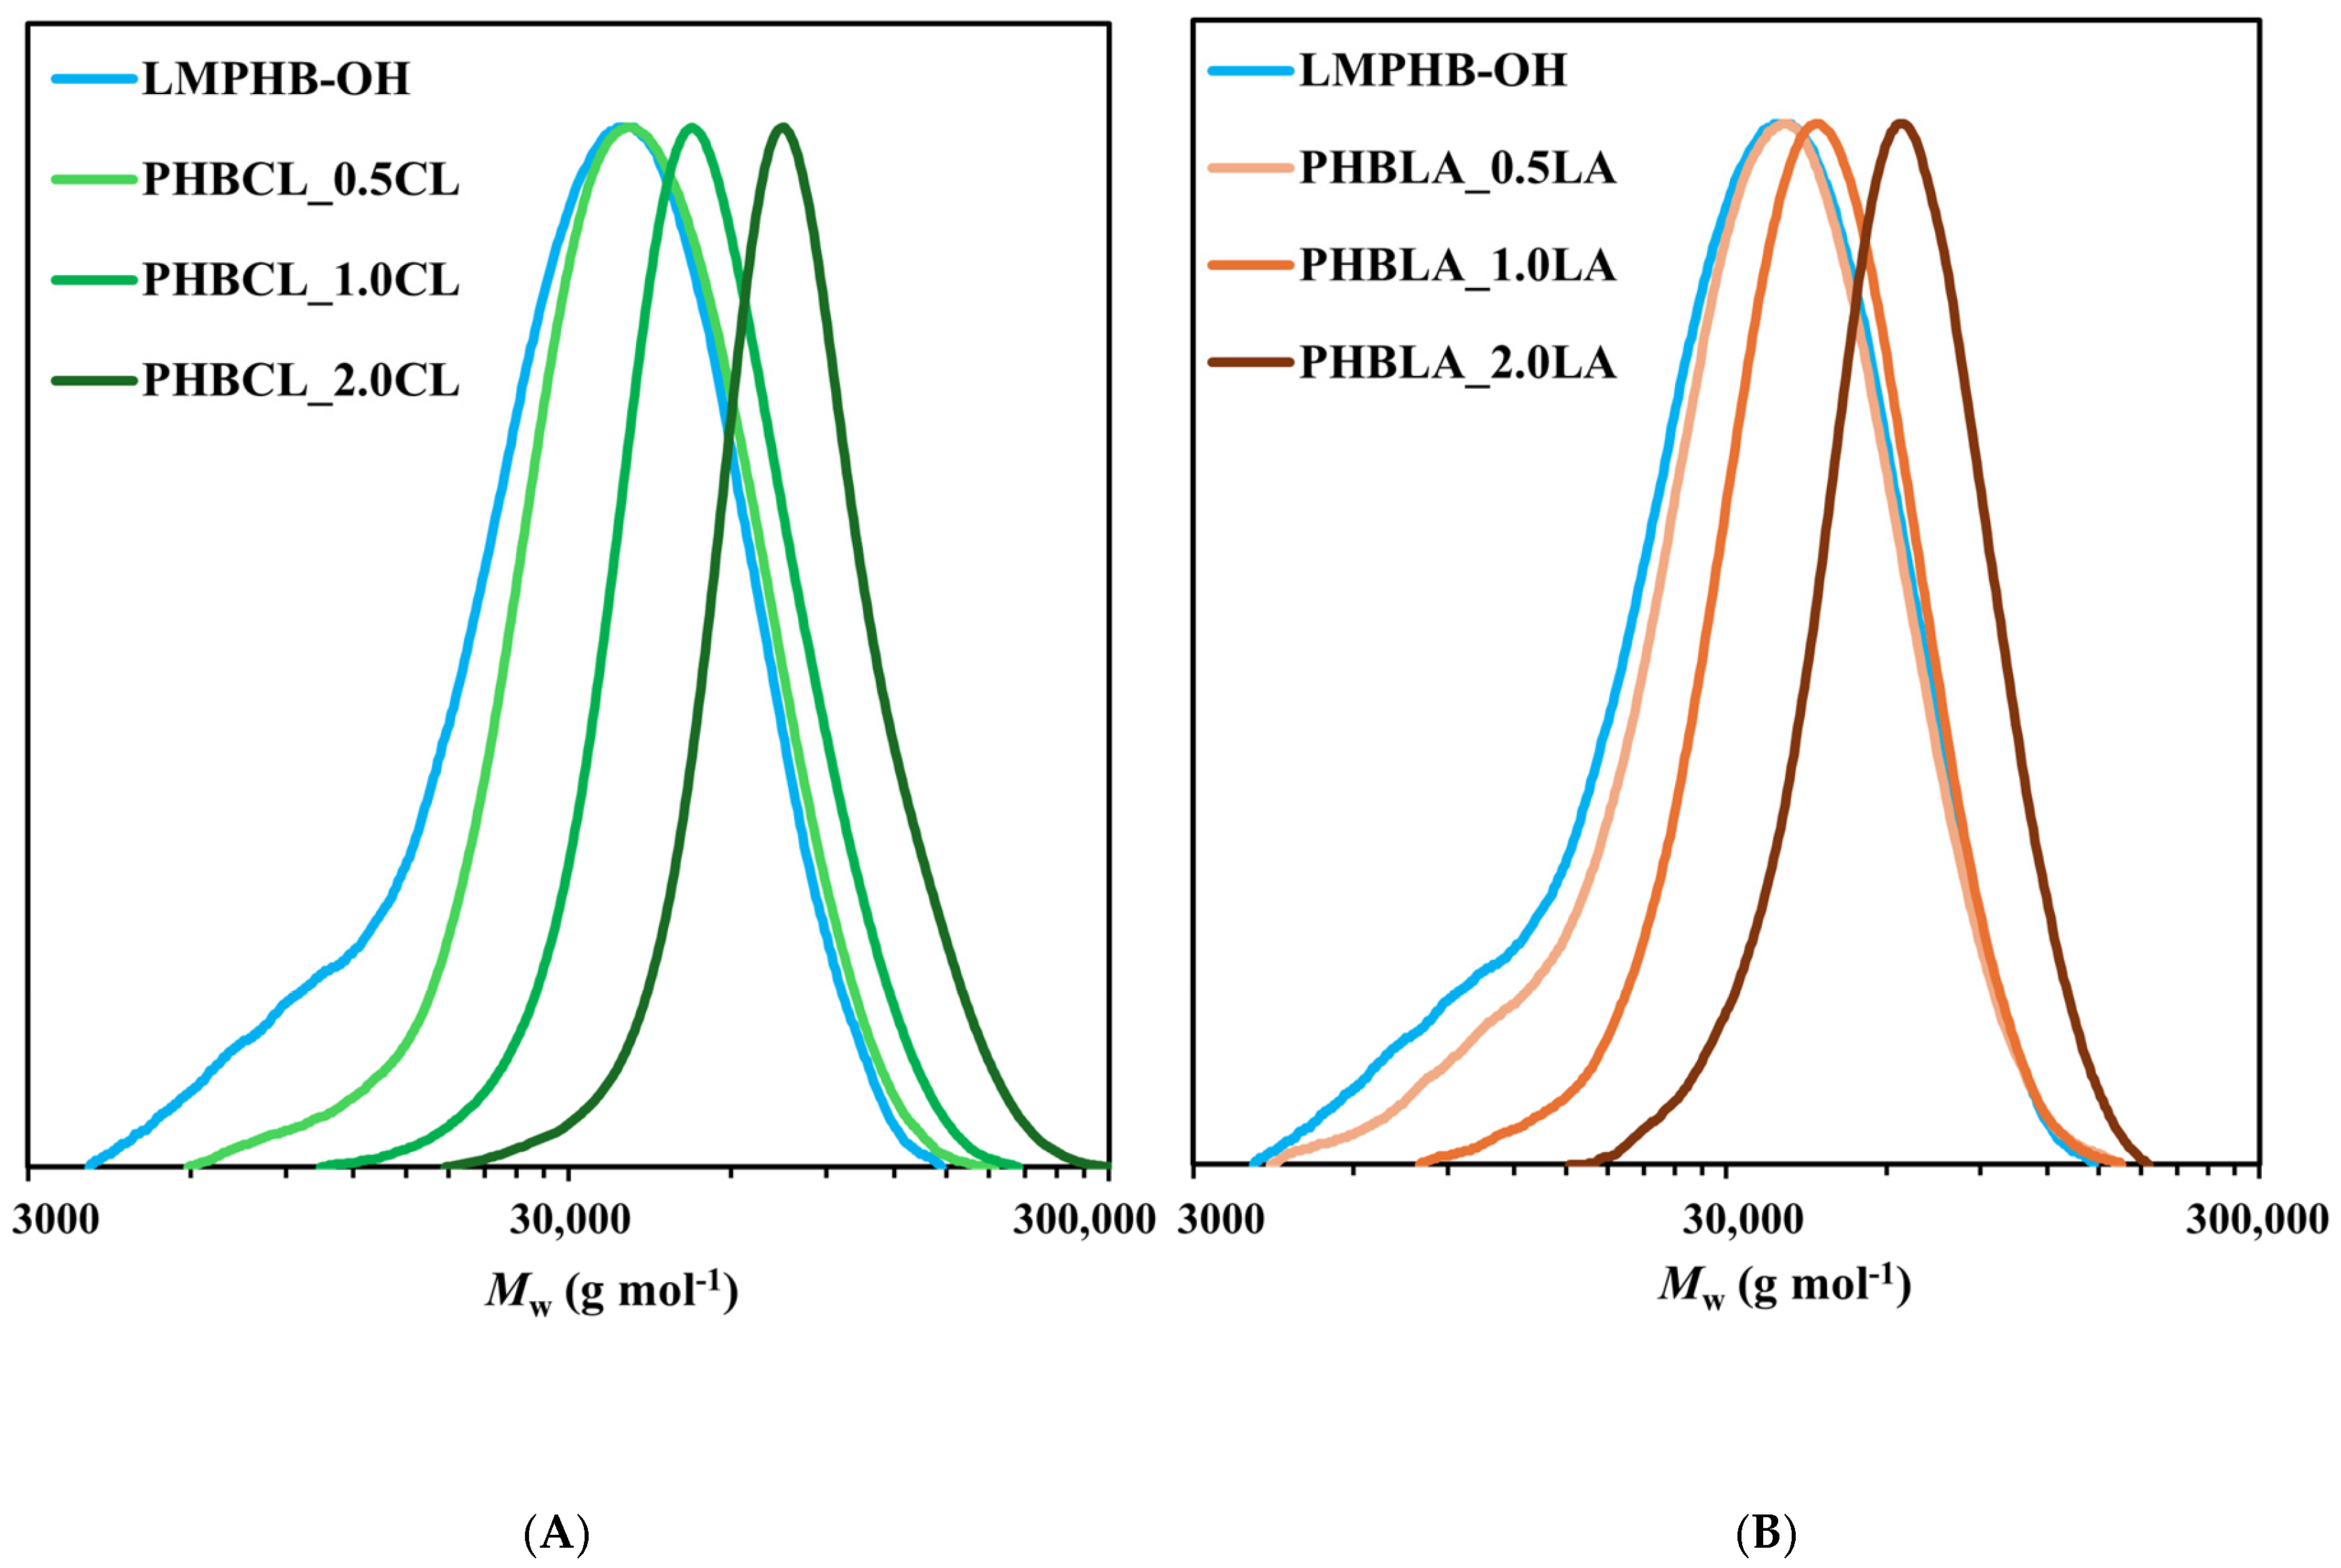
3.1. Synthesis and Characterization of Diblock Copolymers
3.2. Thermal Analysis
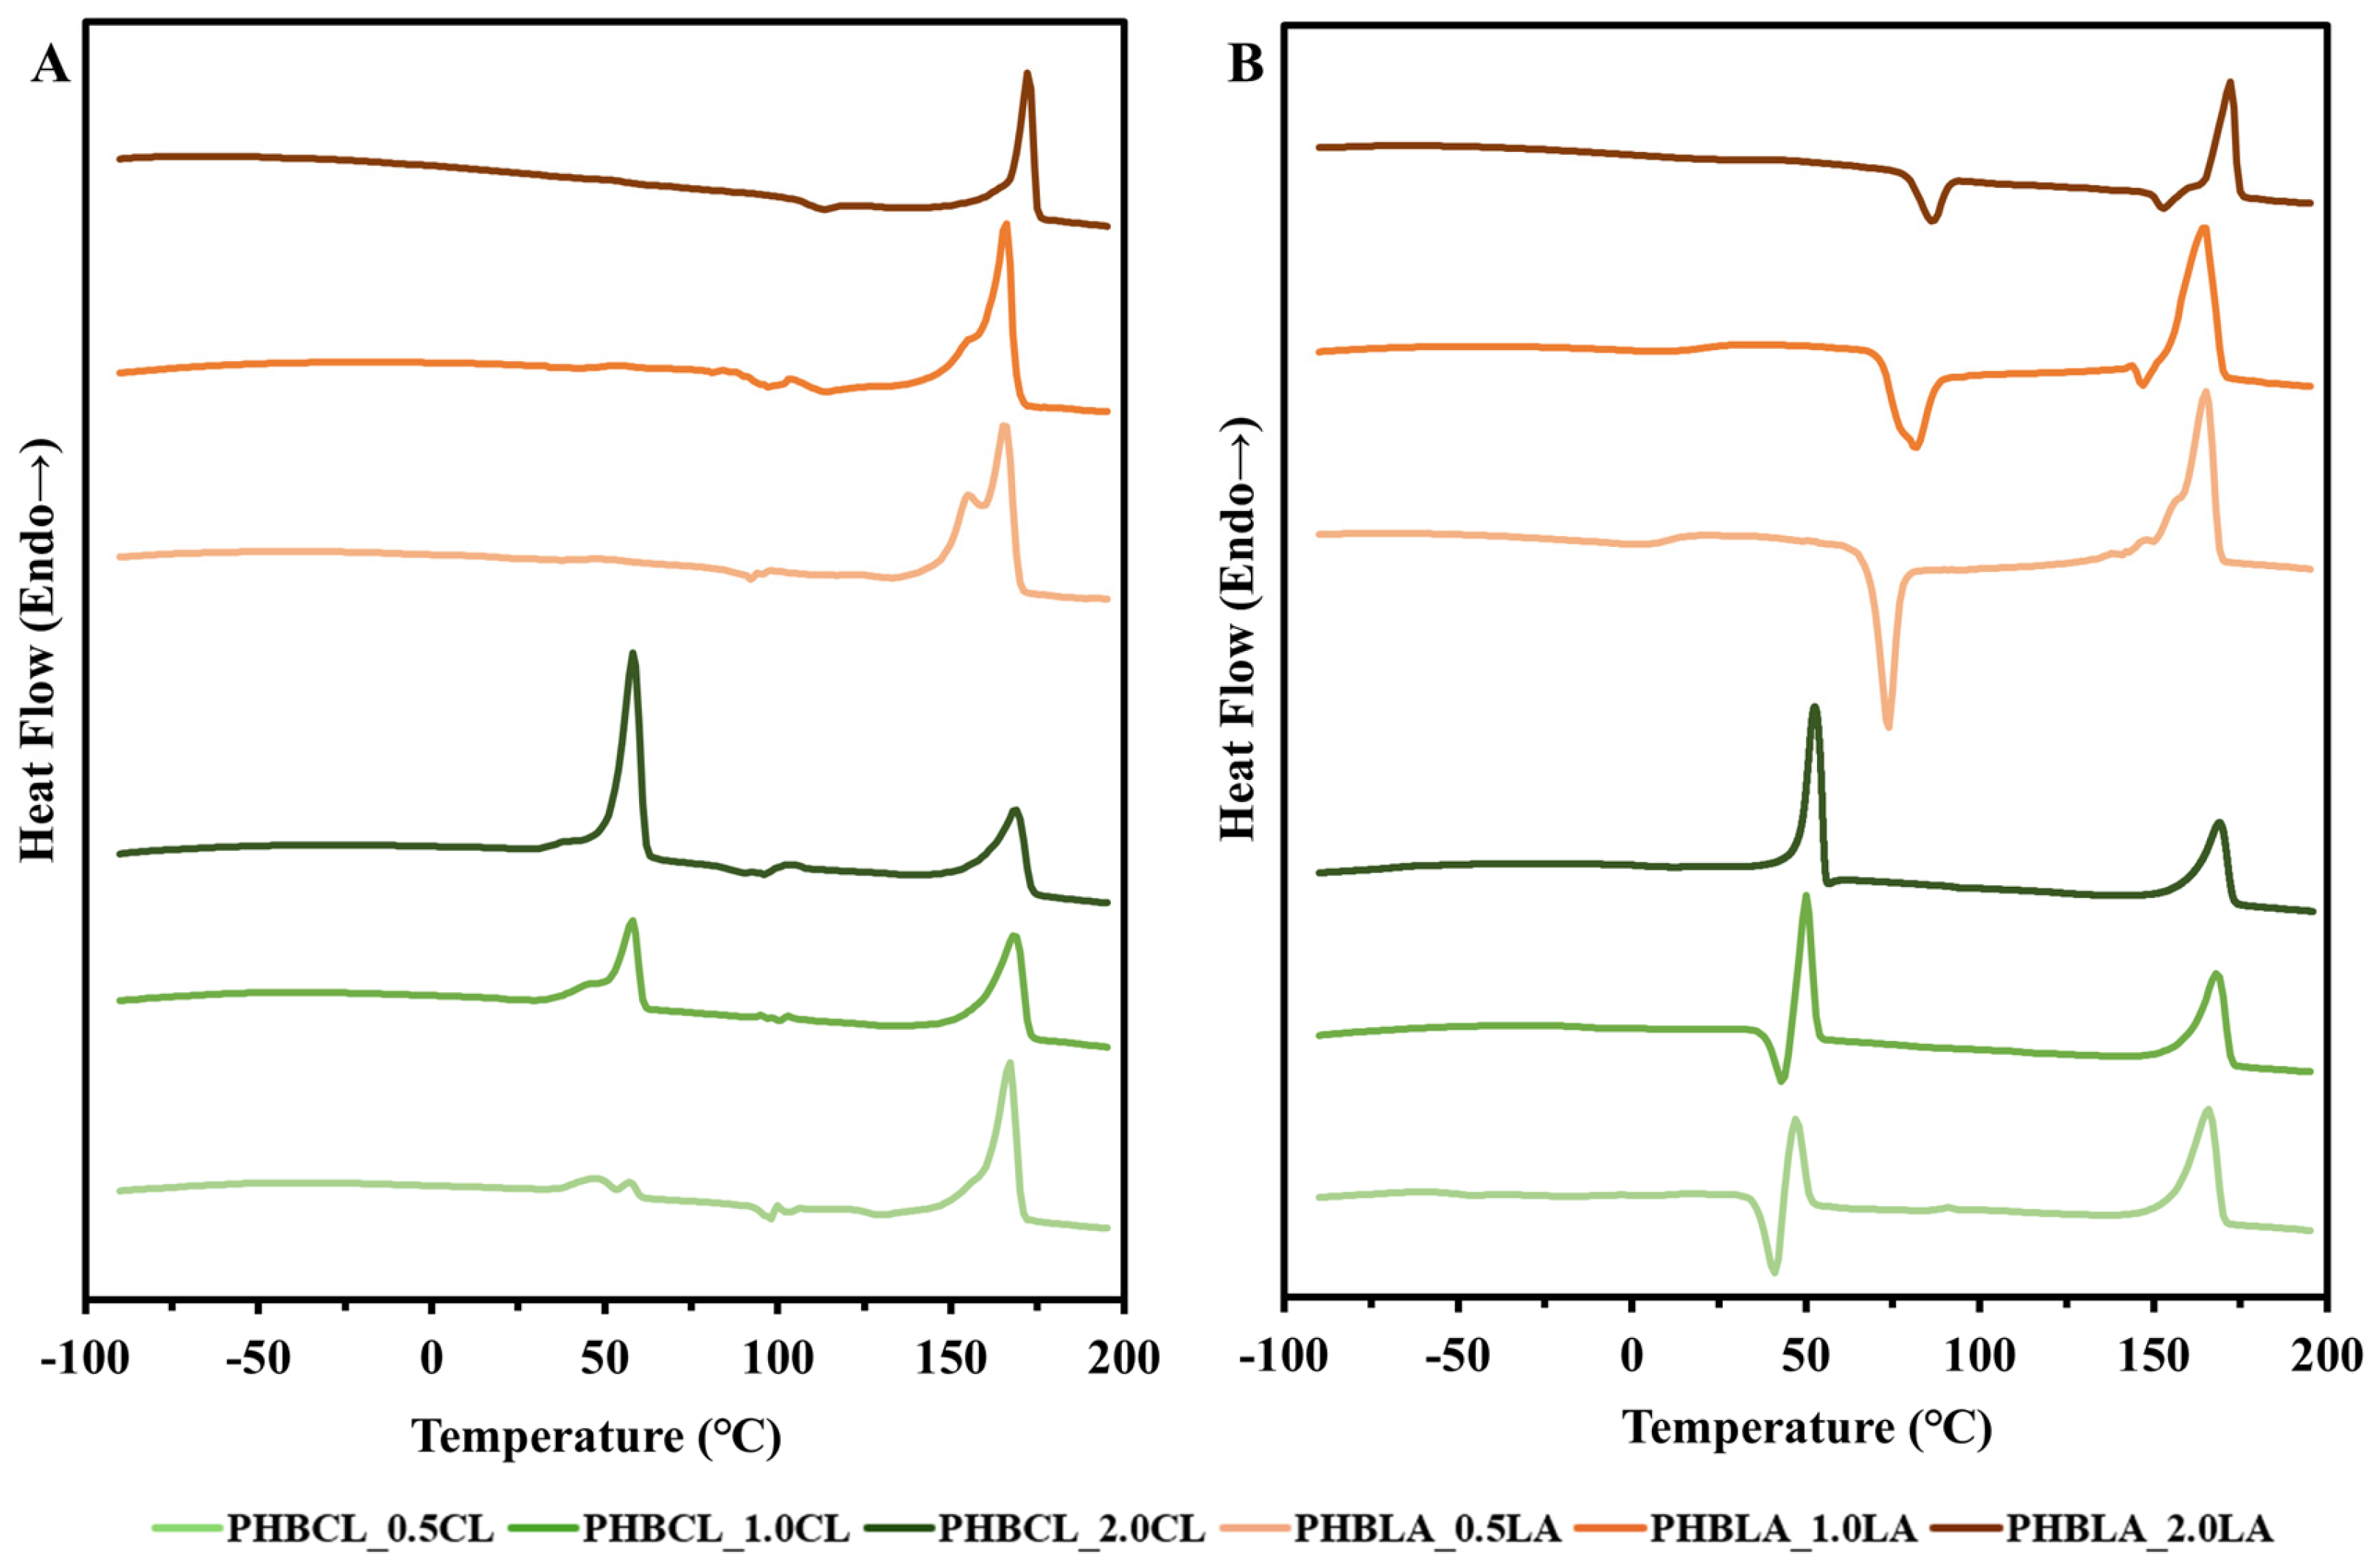
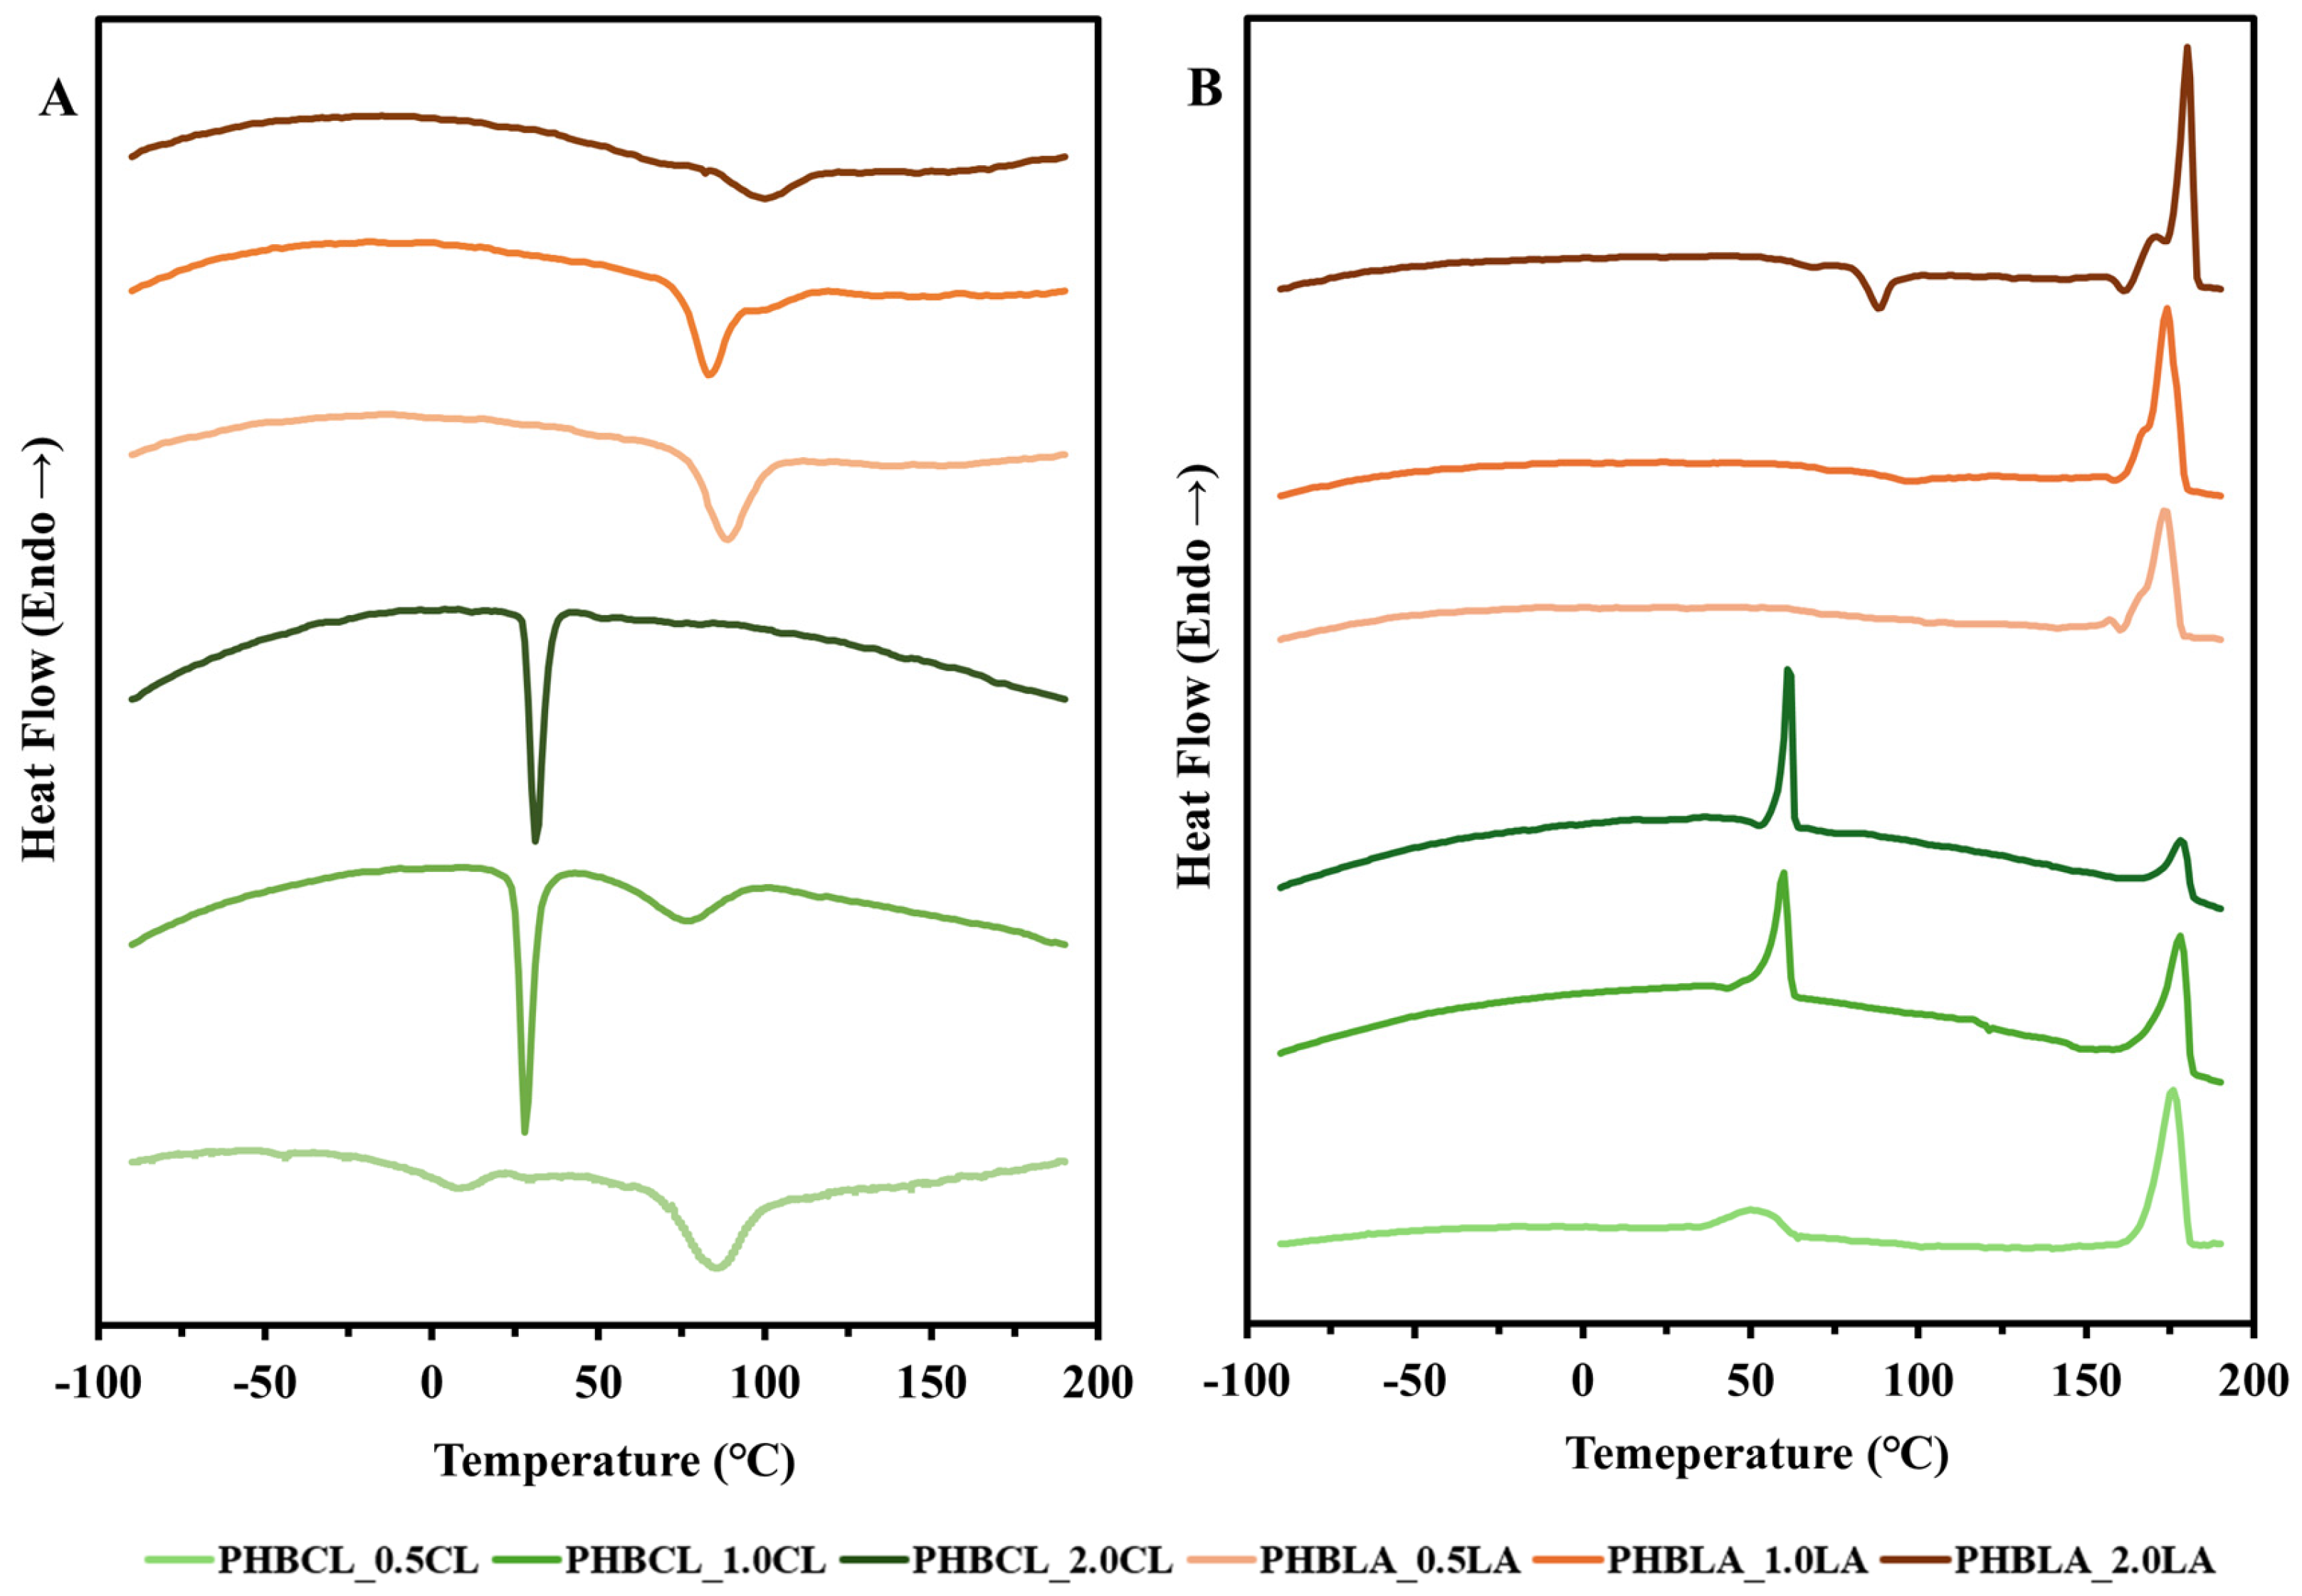
3.2.1. DSC (Thermal Properties)
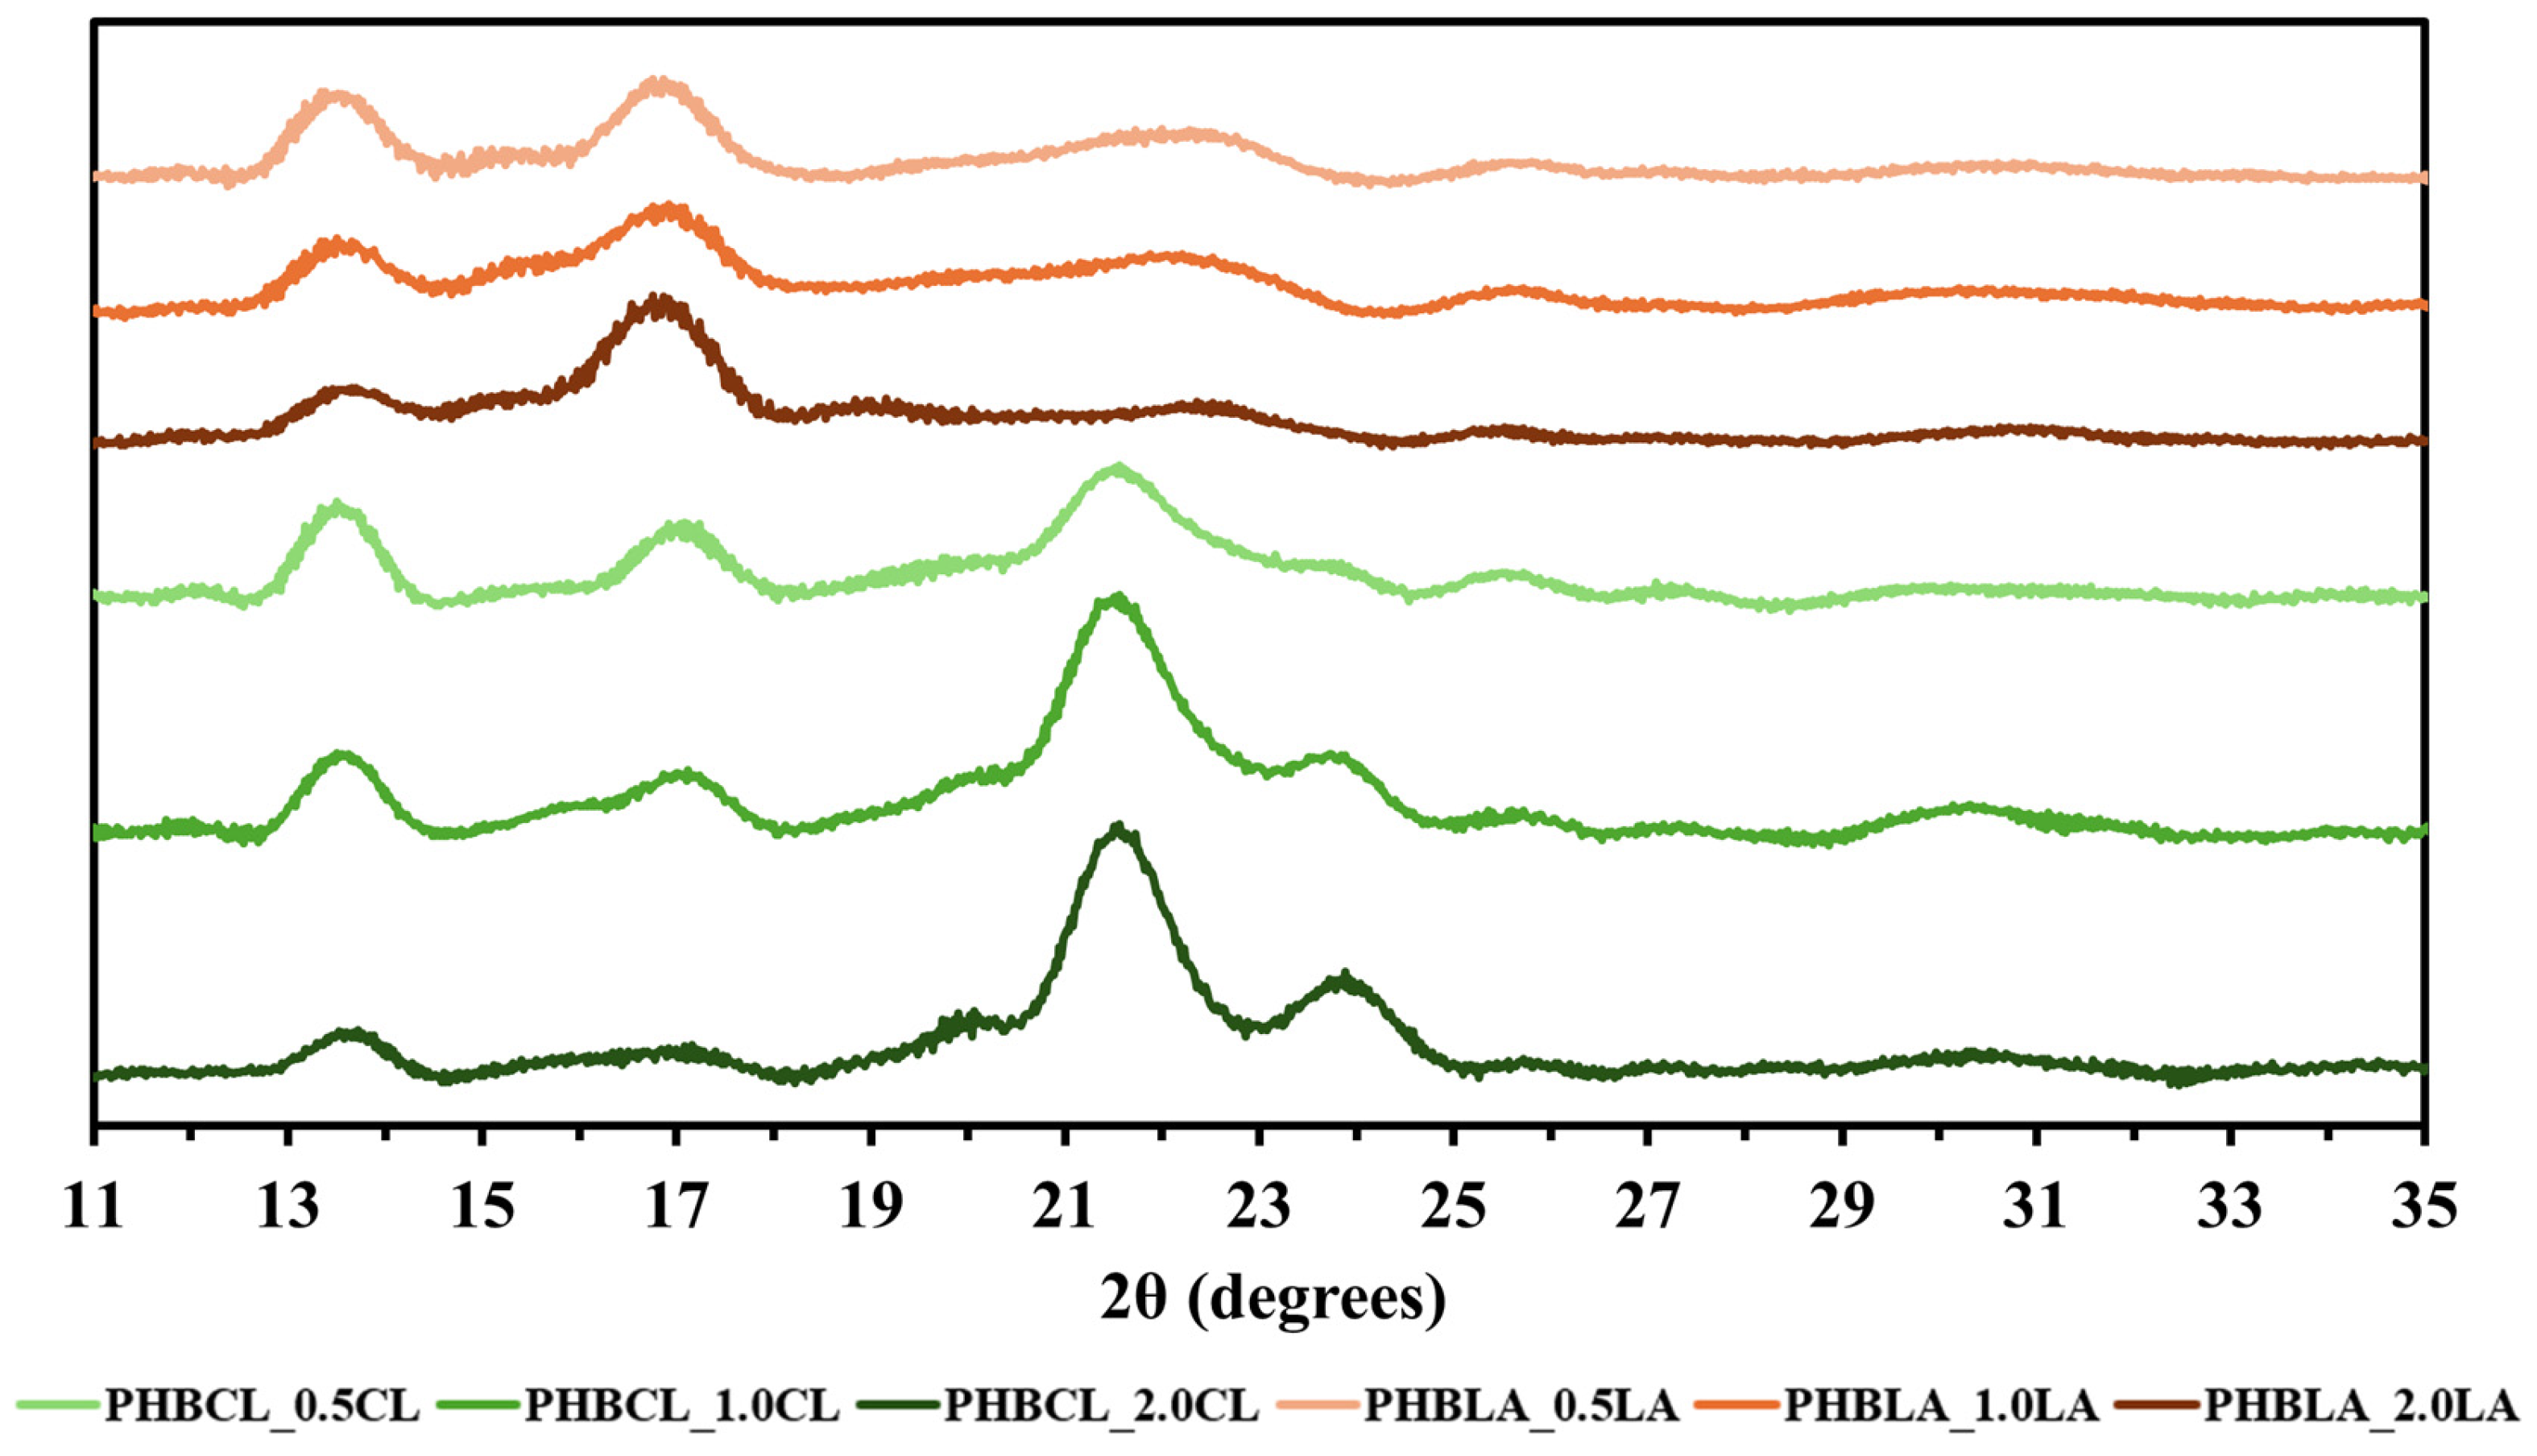
3.2.2. WAXD
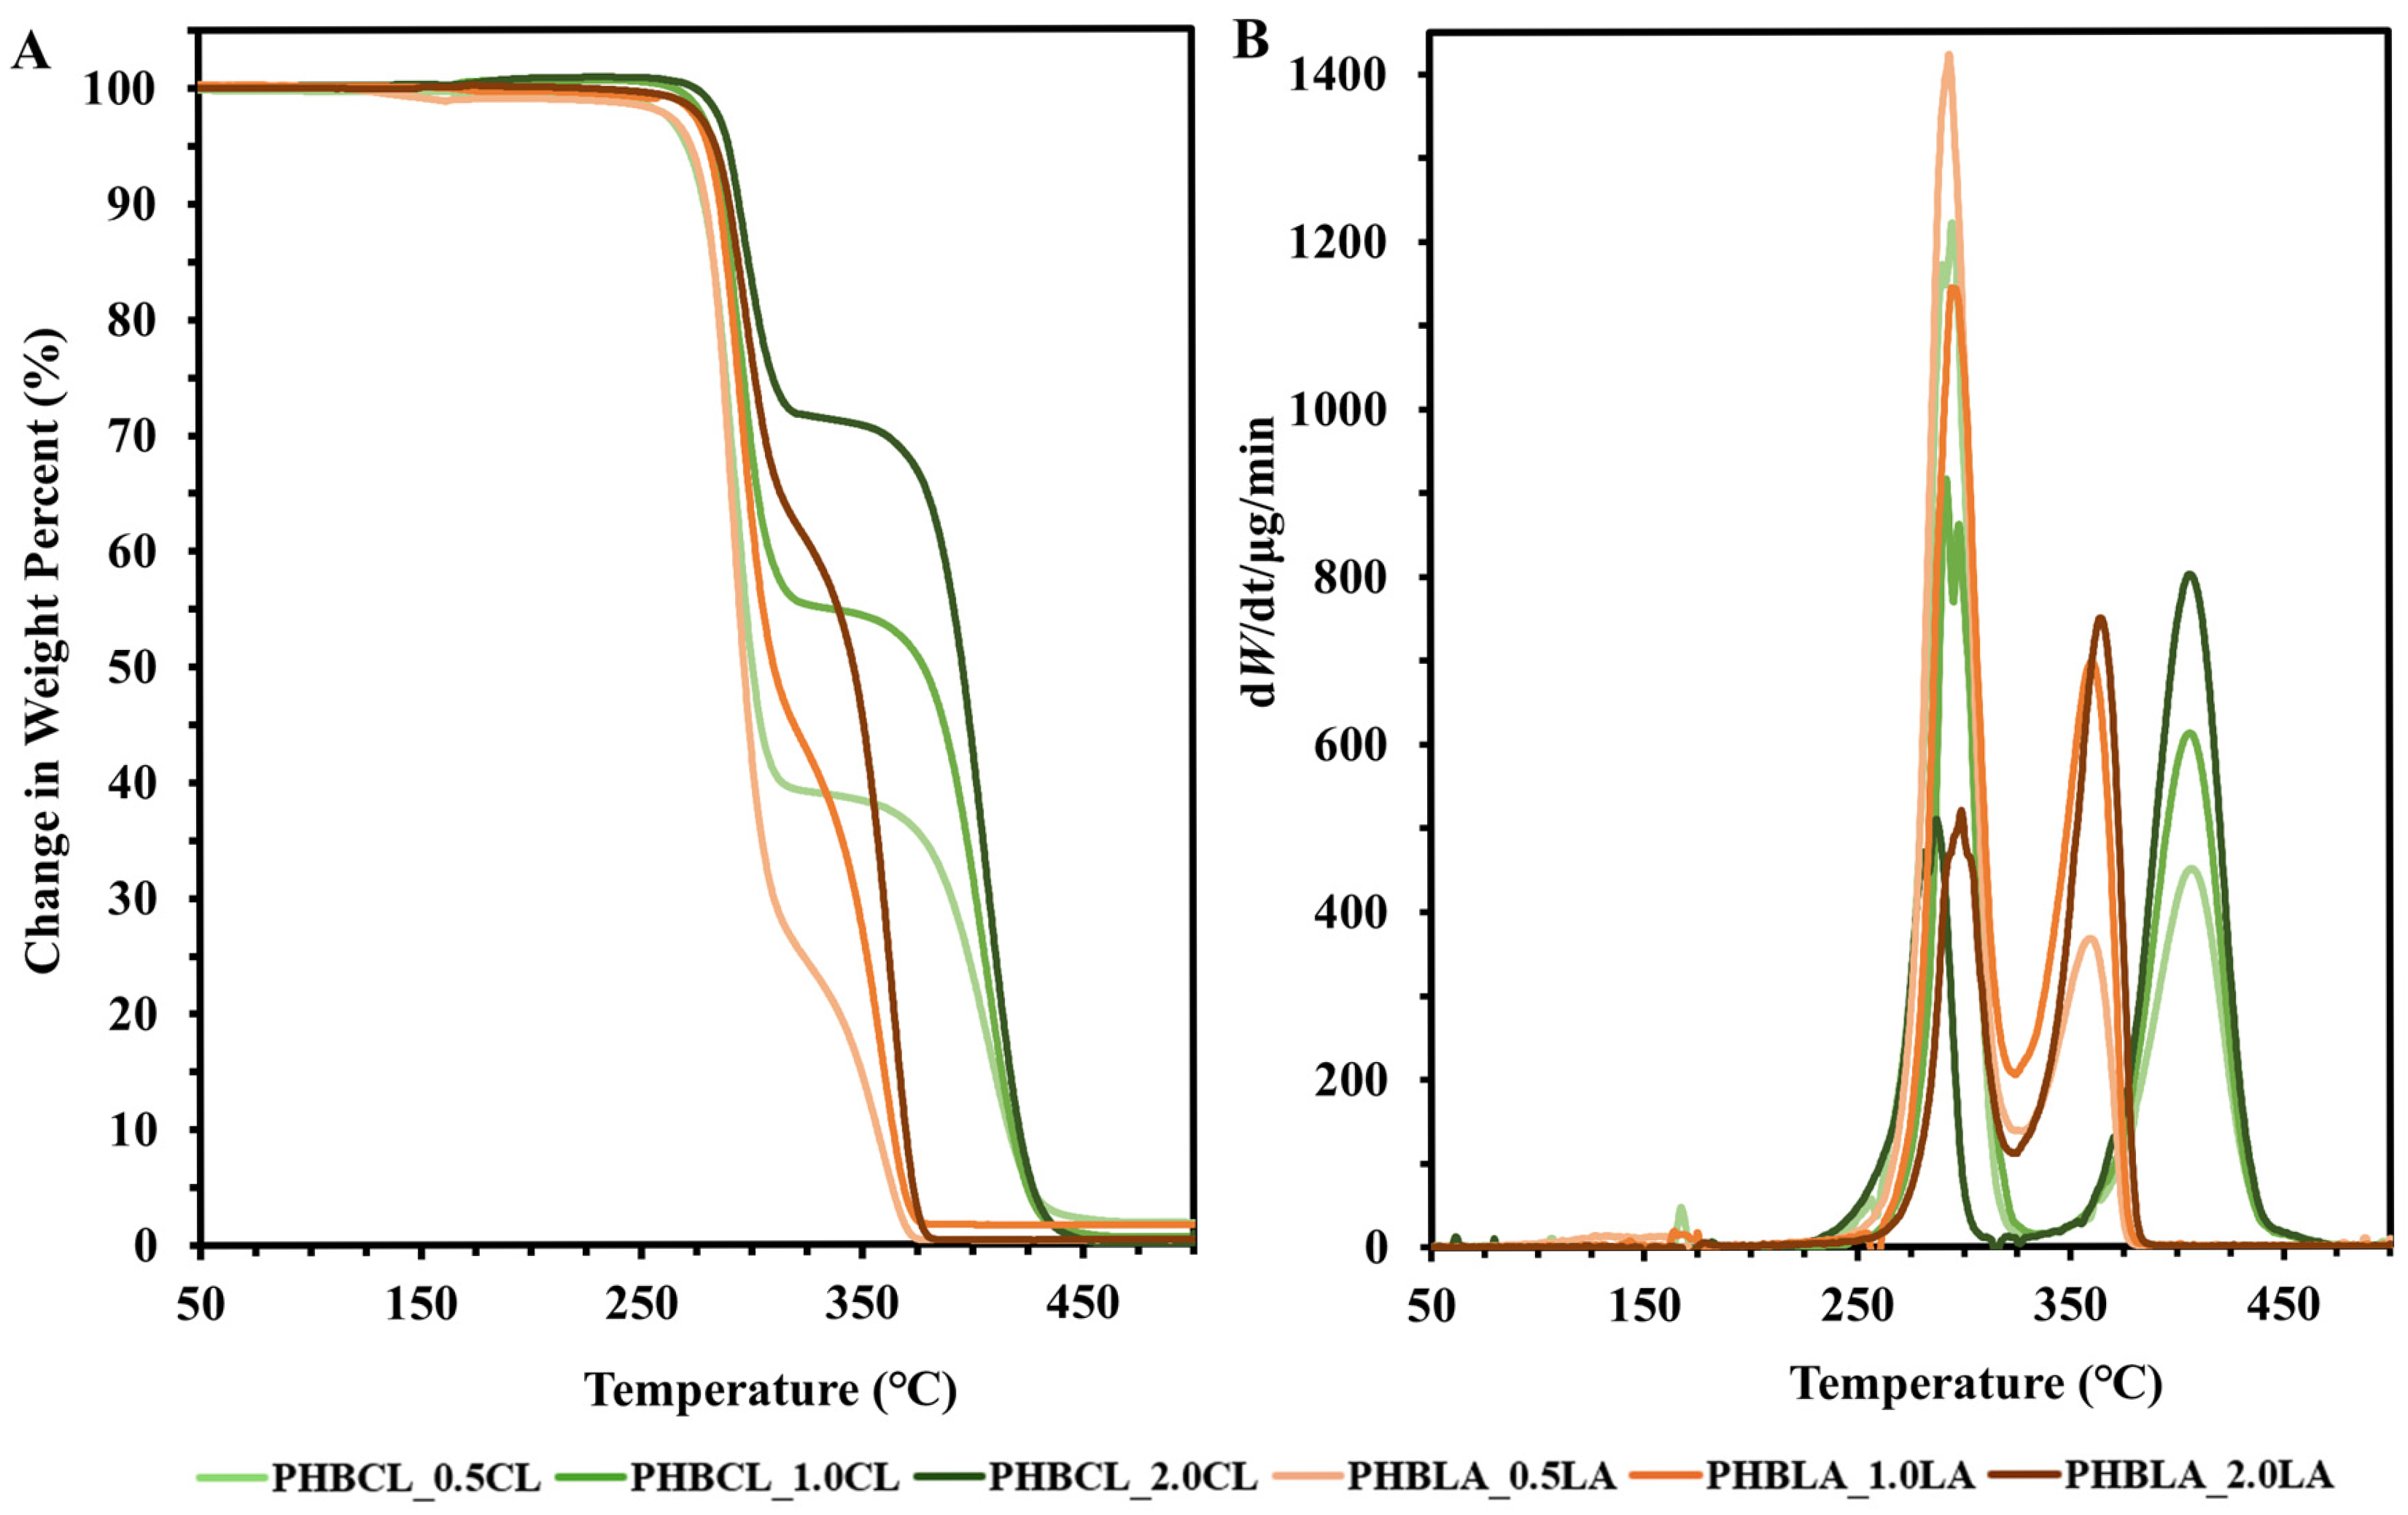
3.2.3. TGA
3.3. Crystallization Analysis
3.3.1. DSC (Crystallization)
3.3.2. POM Observation of Crystallization
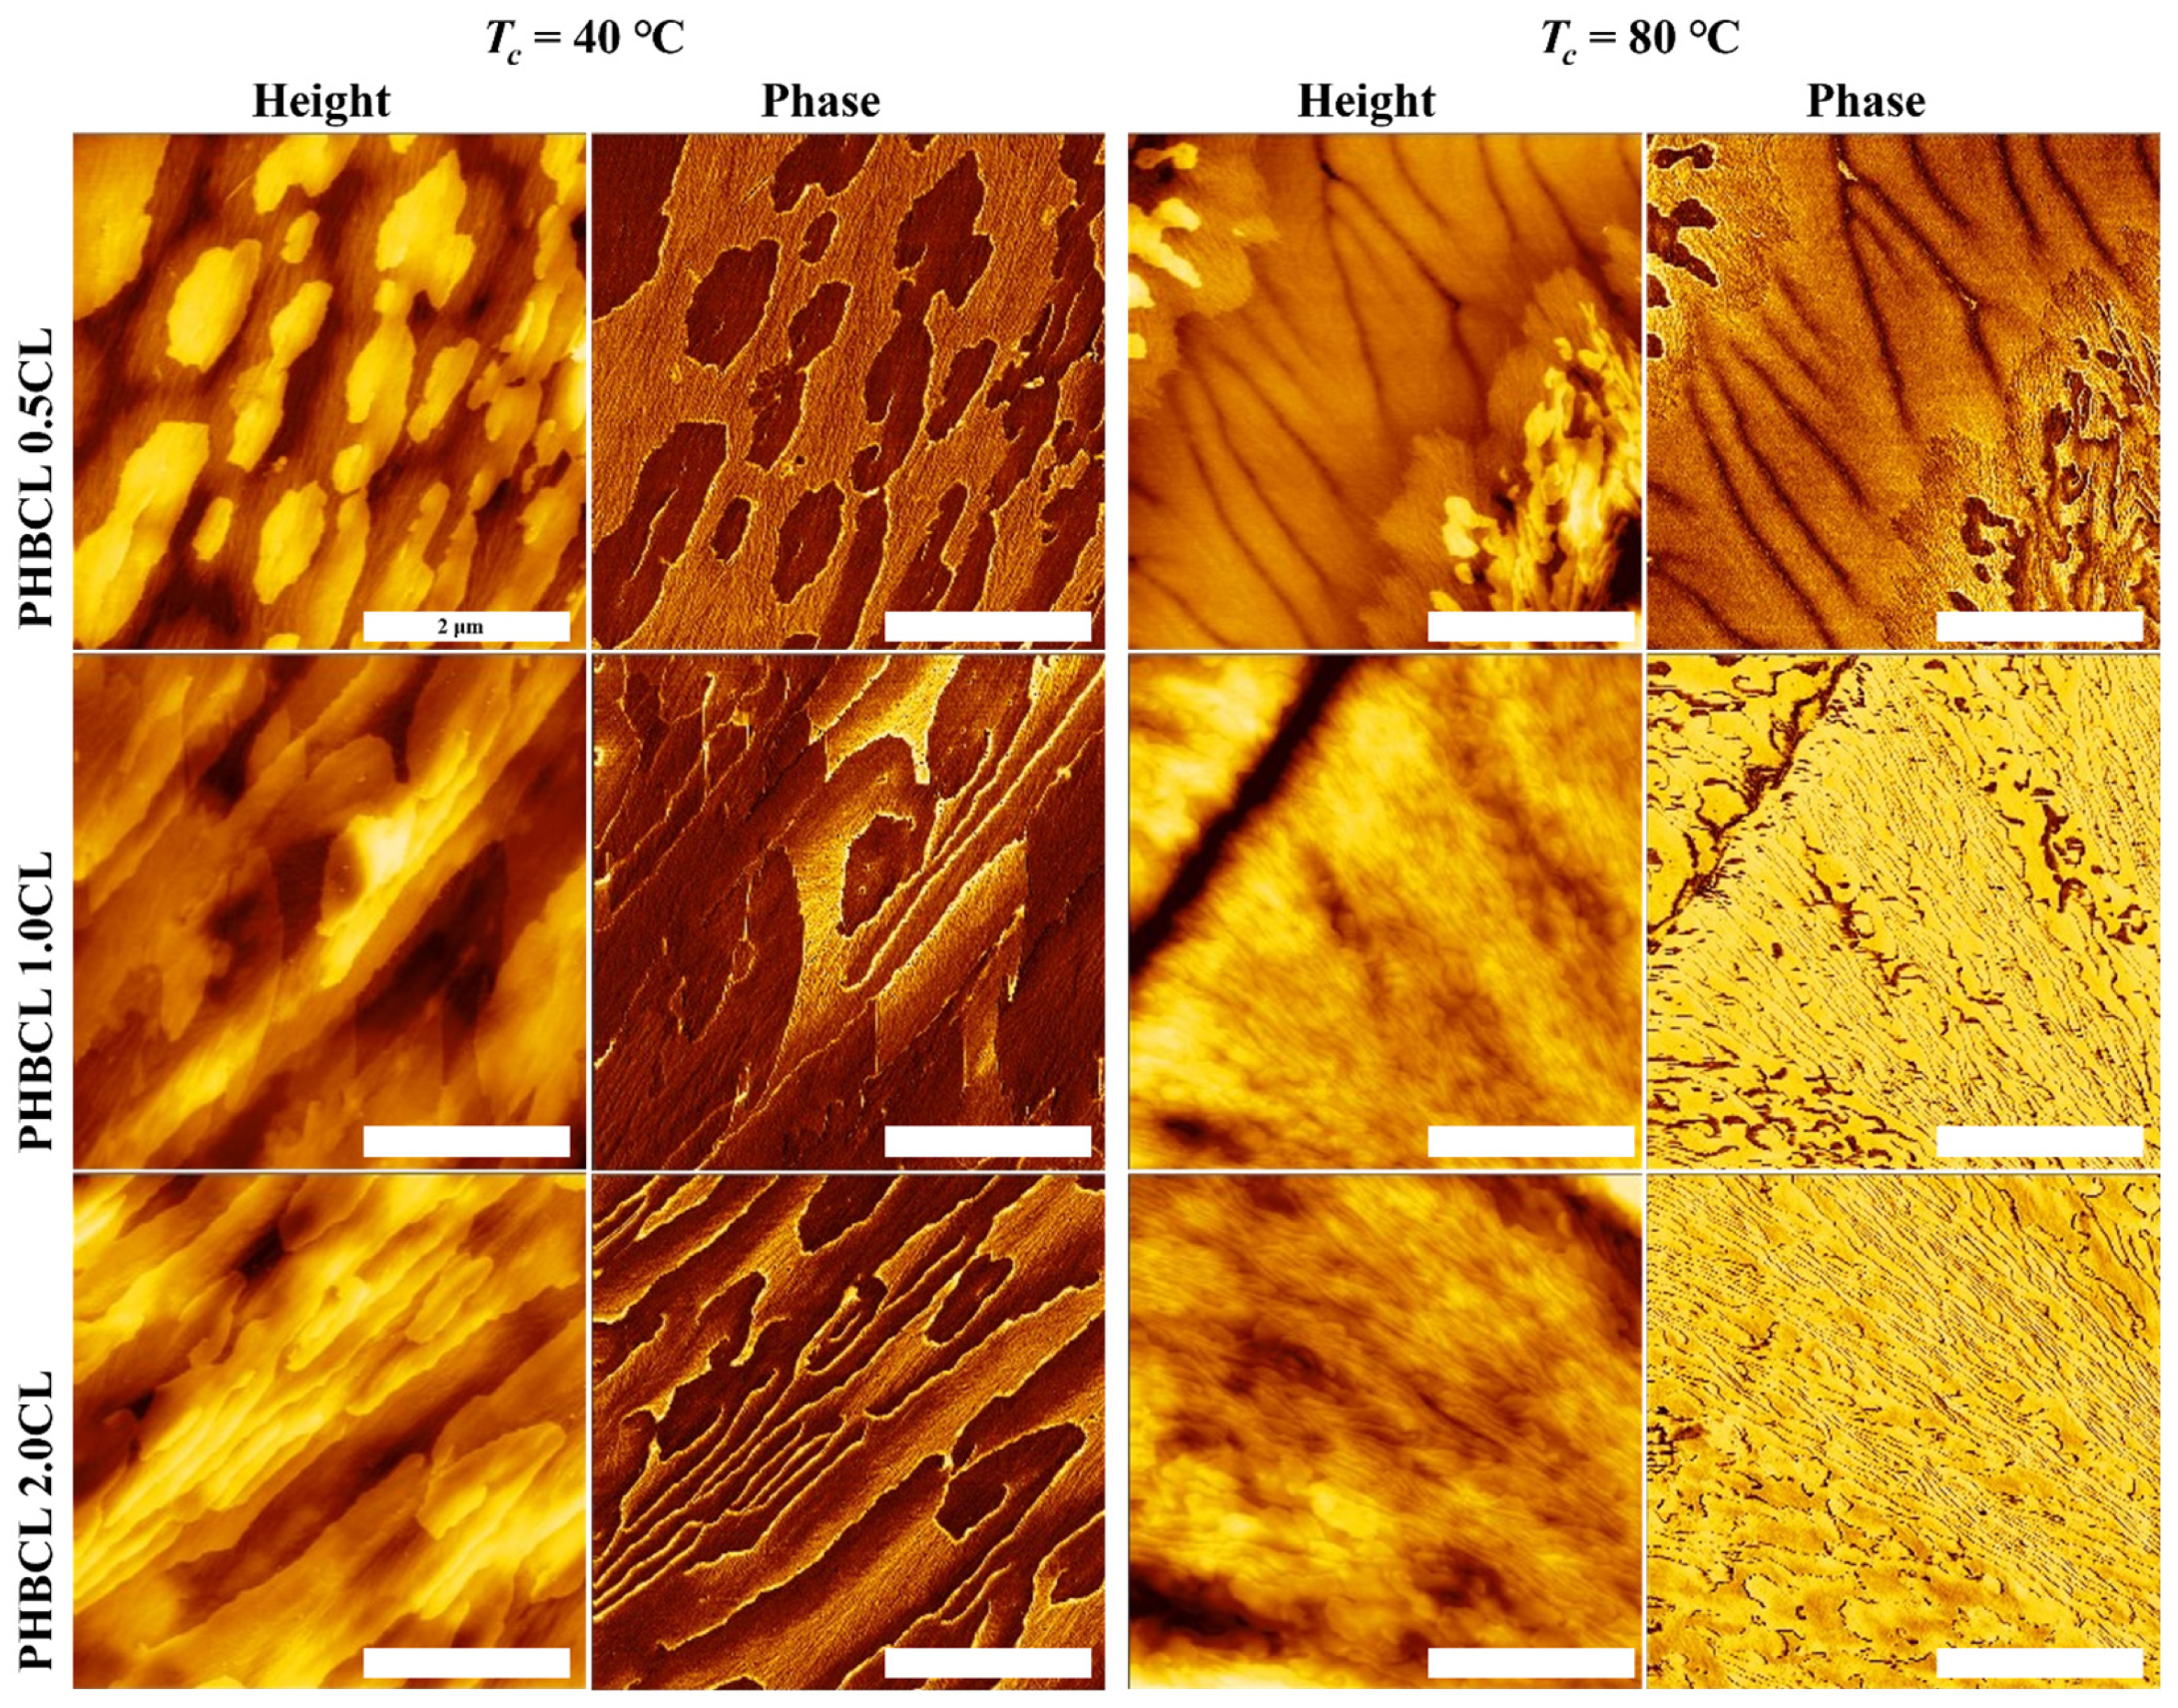
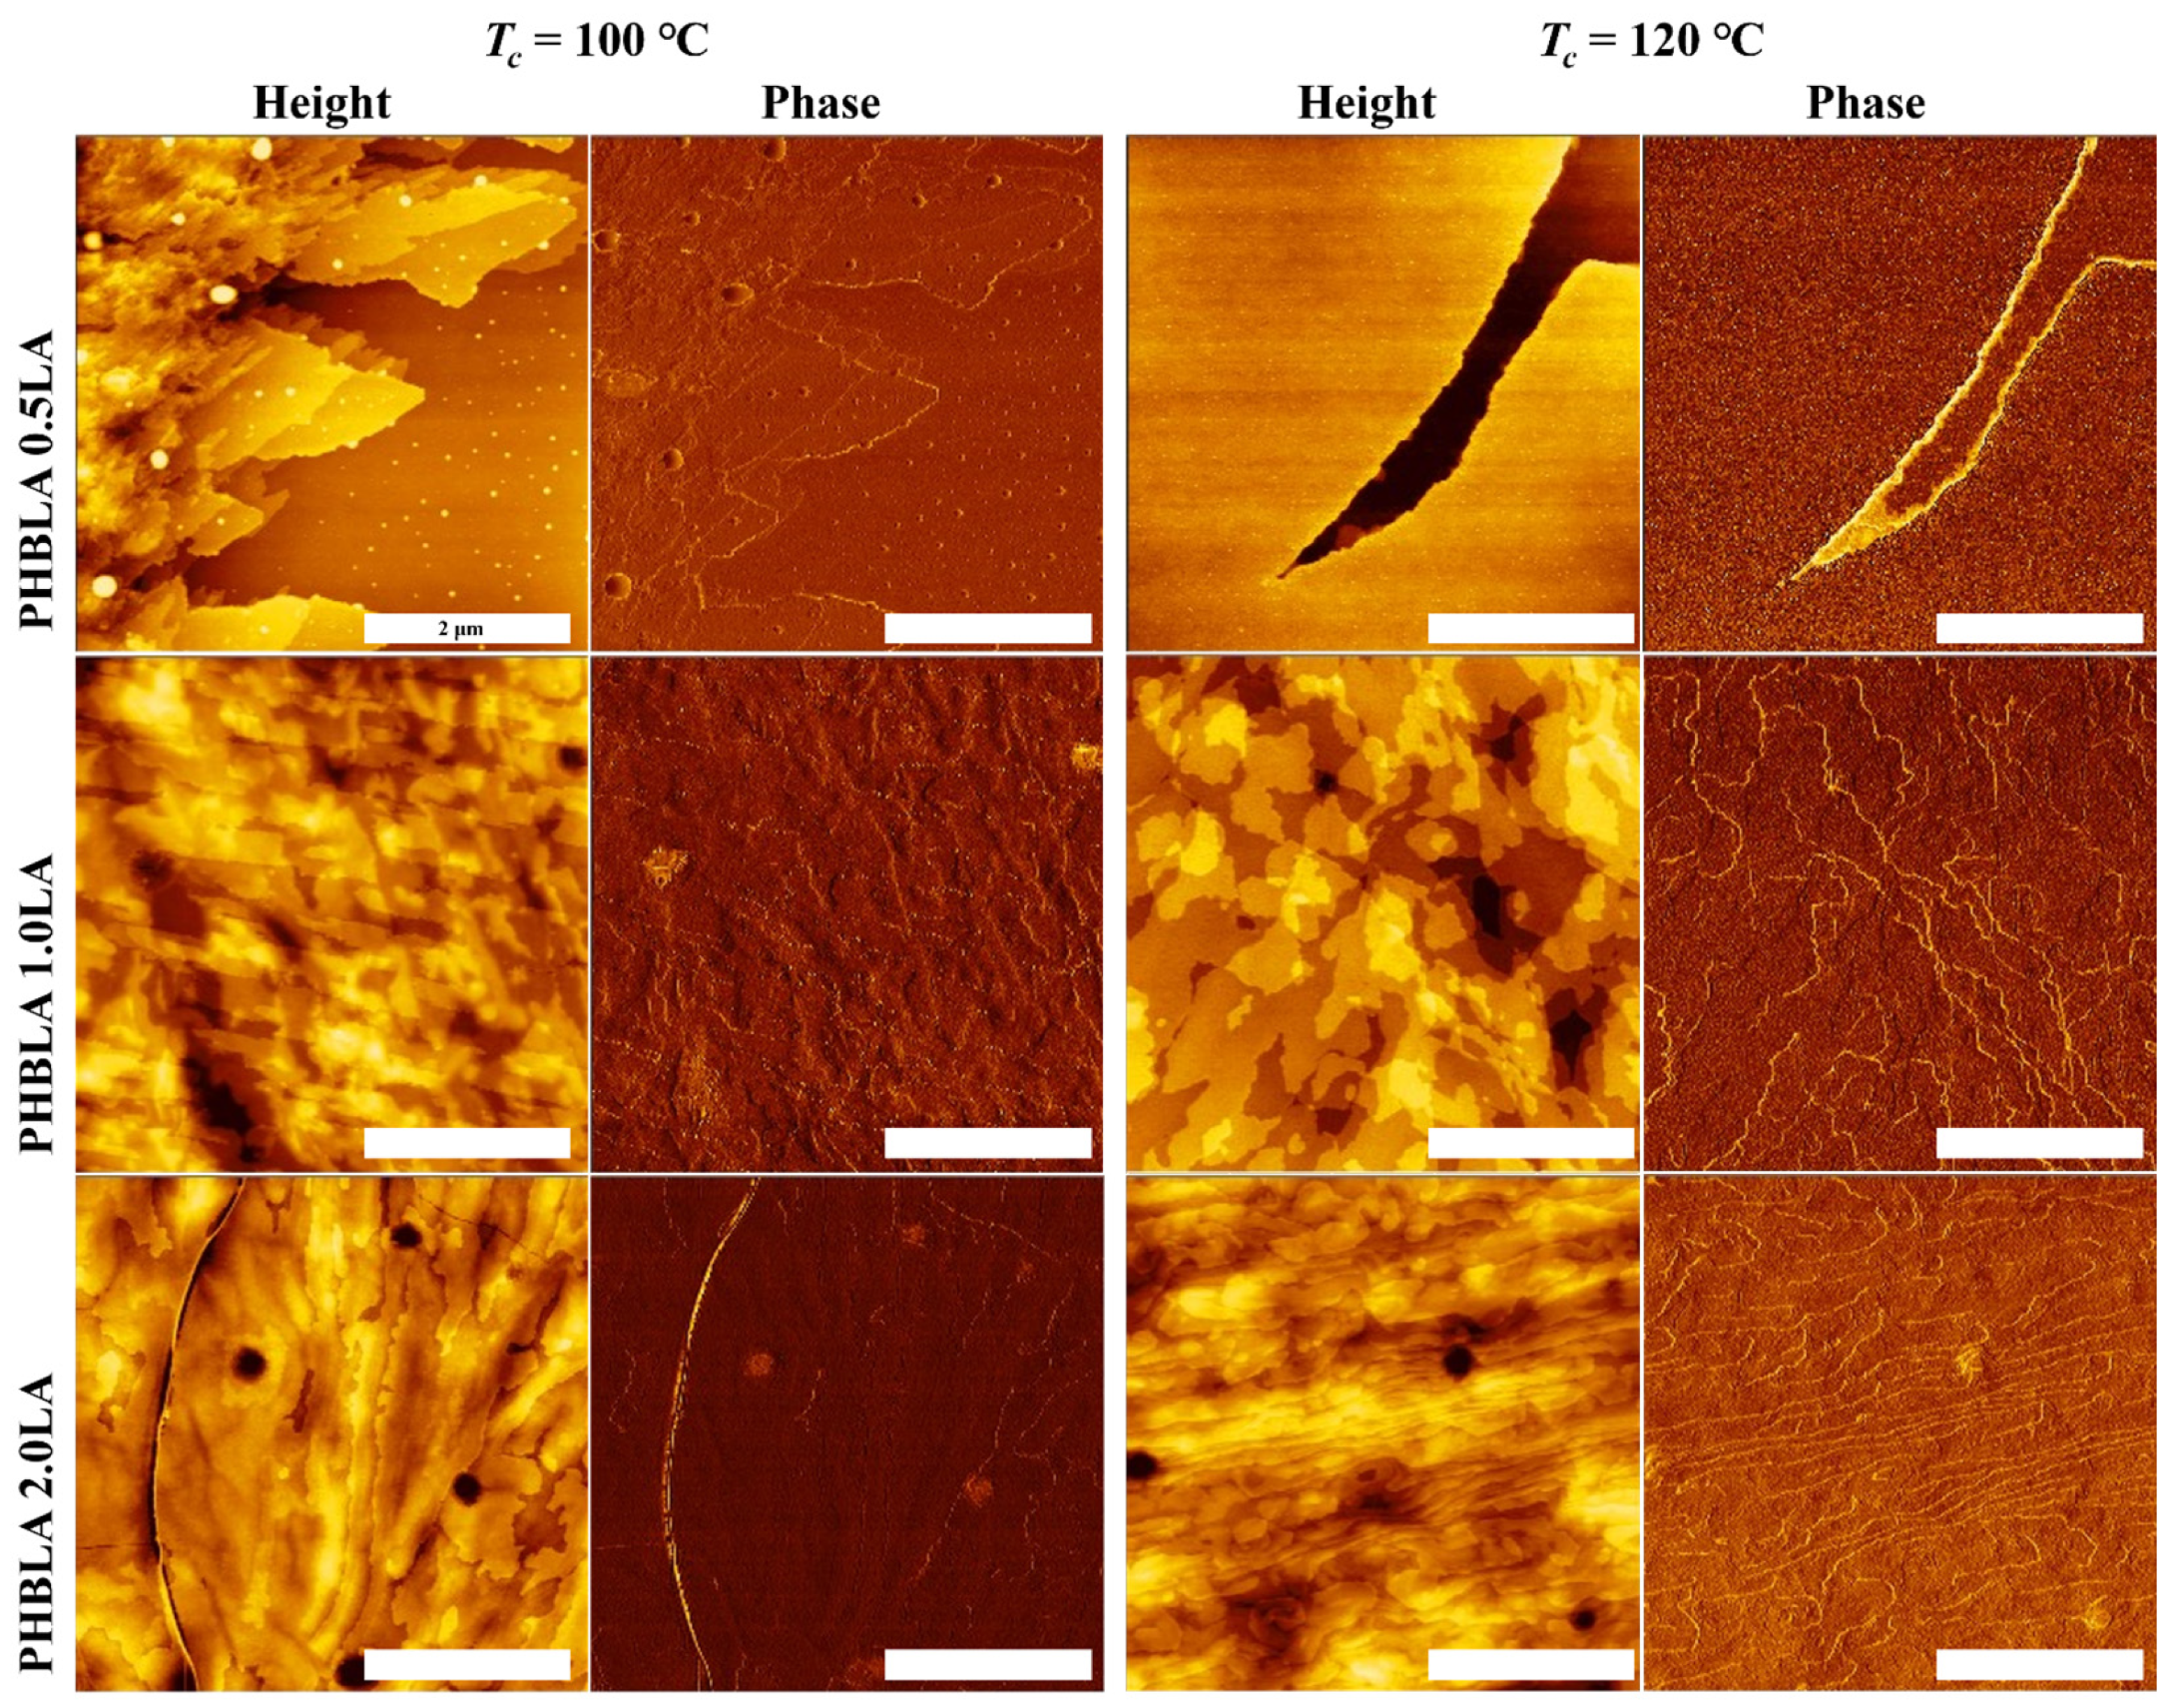
3.4. AFM Observation of Surface Morphology Analysis
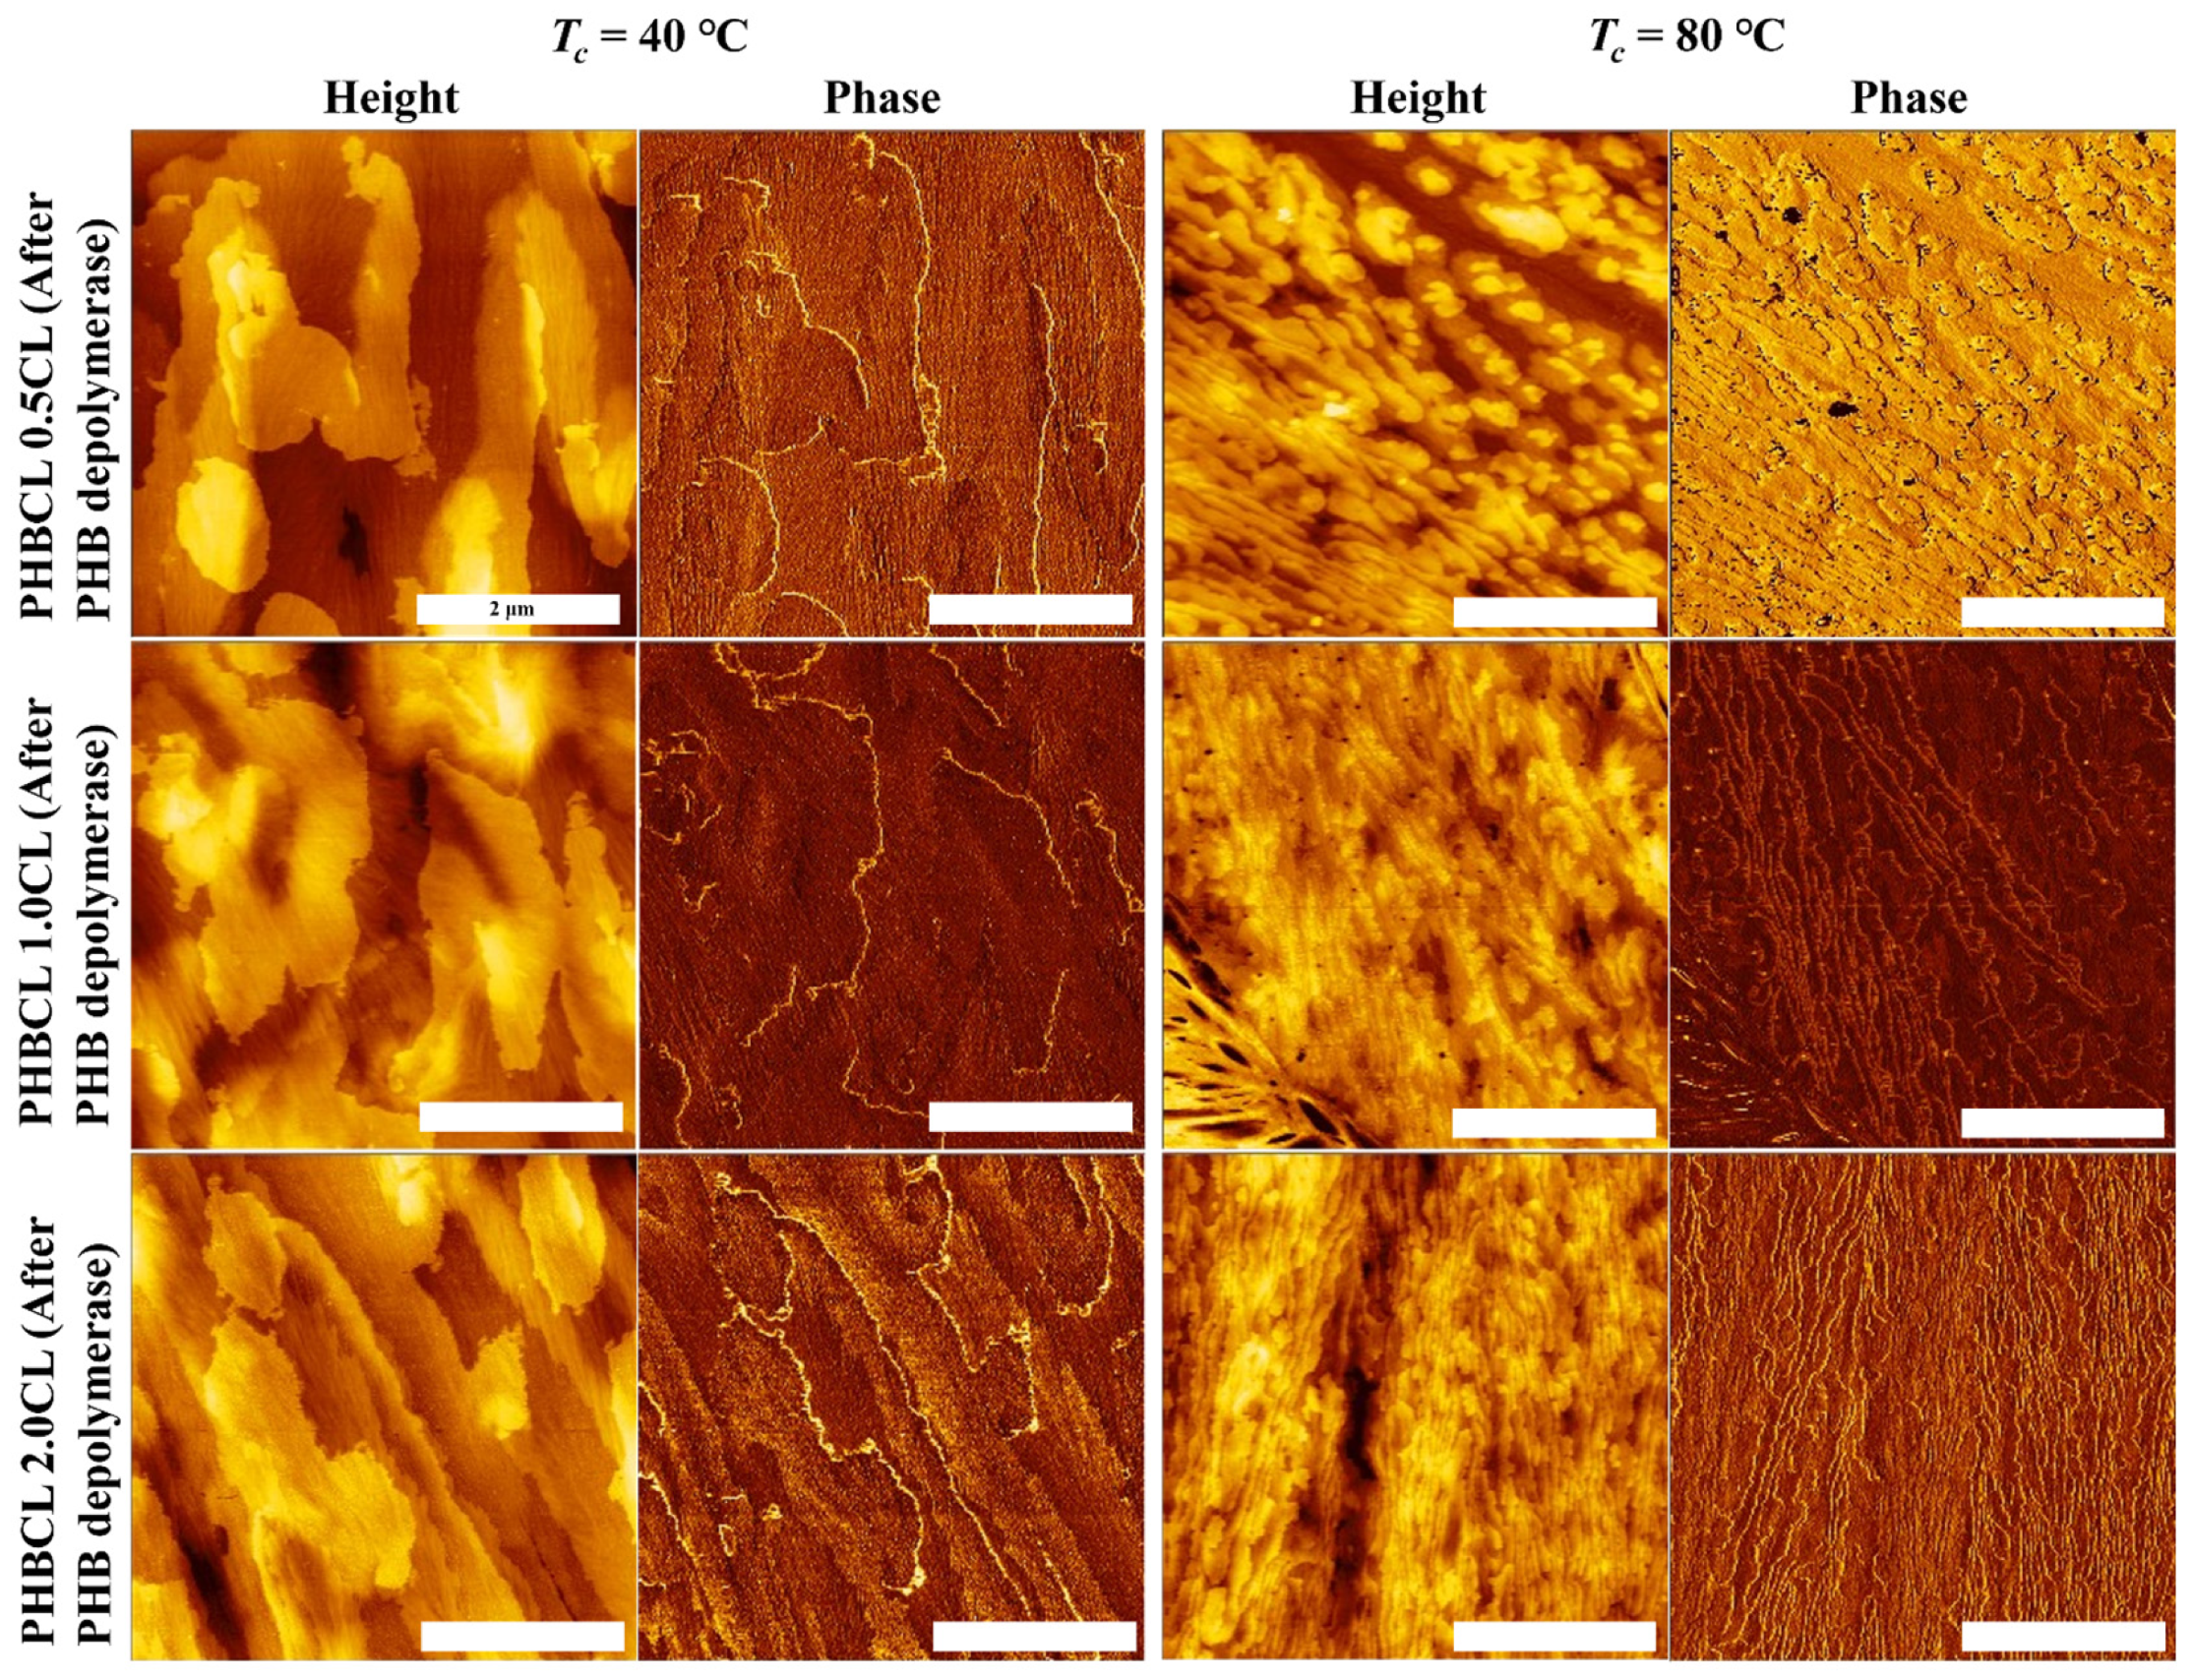
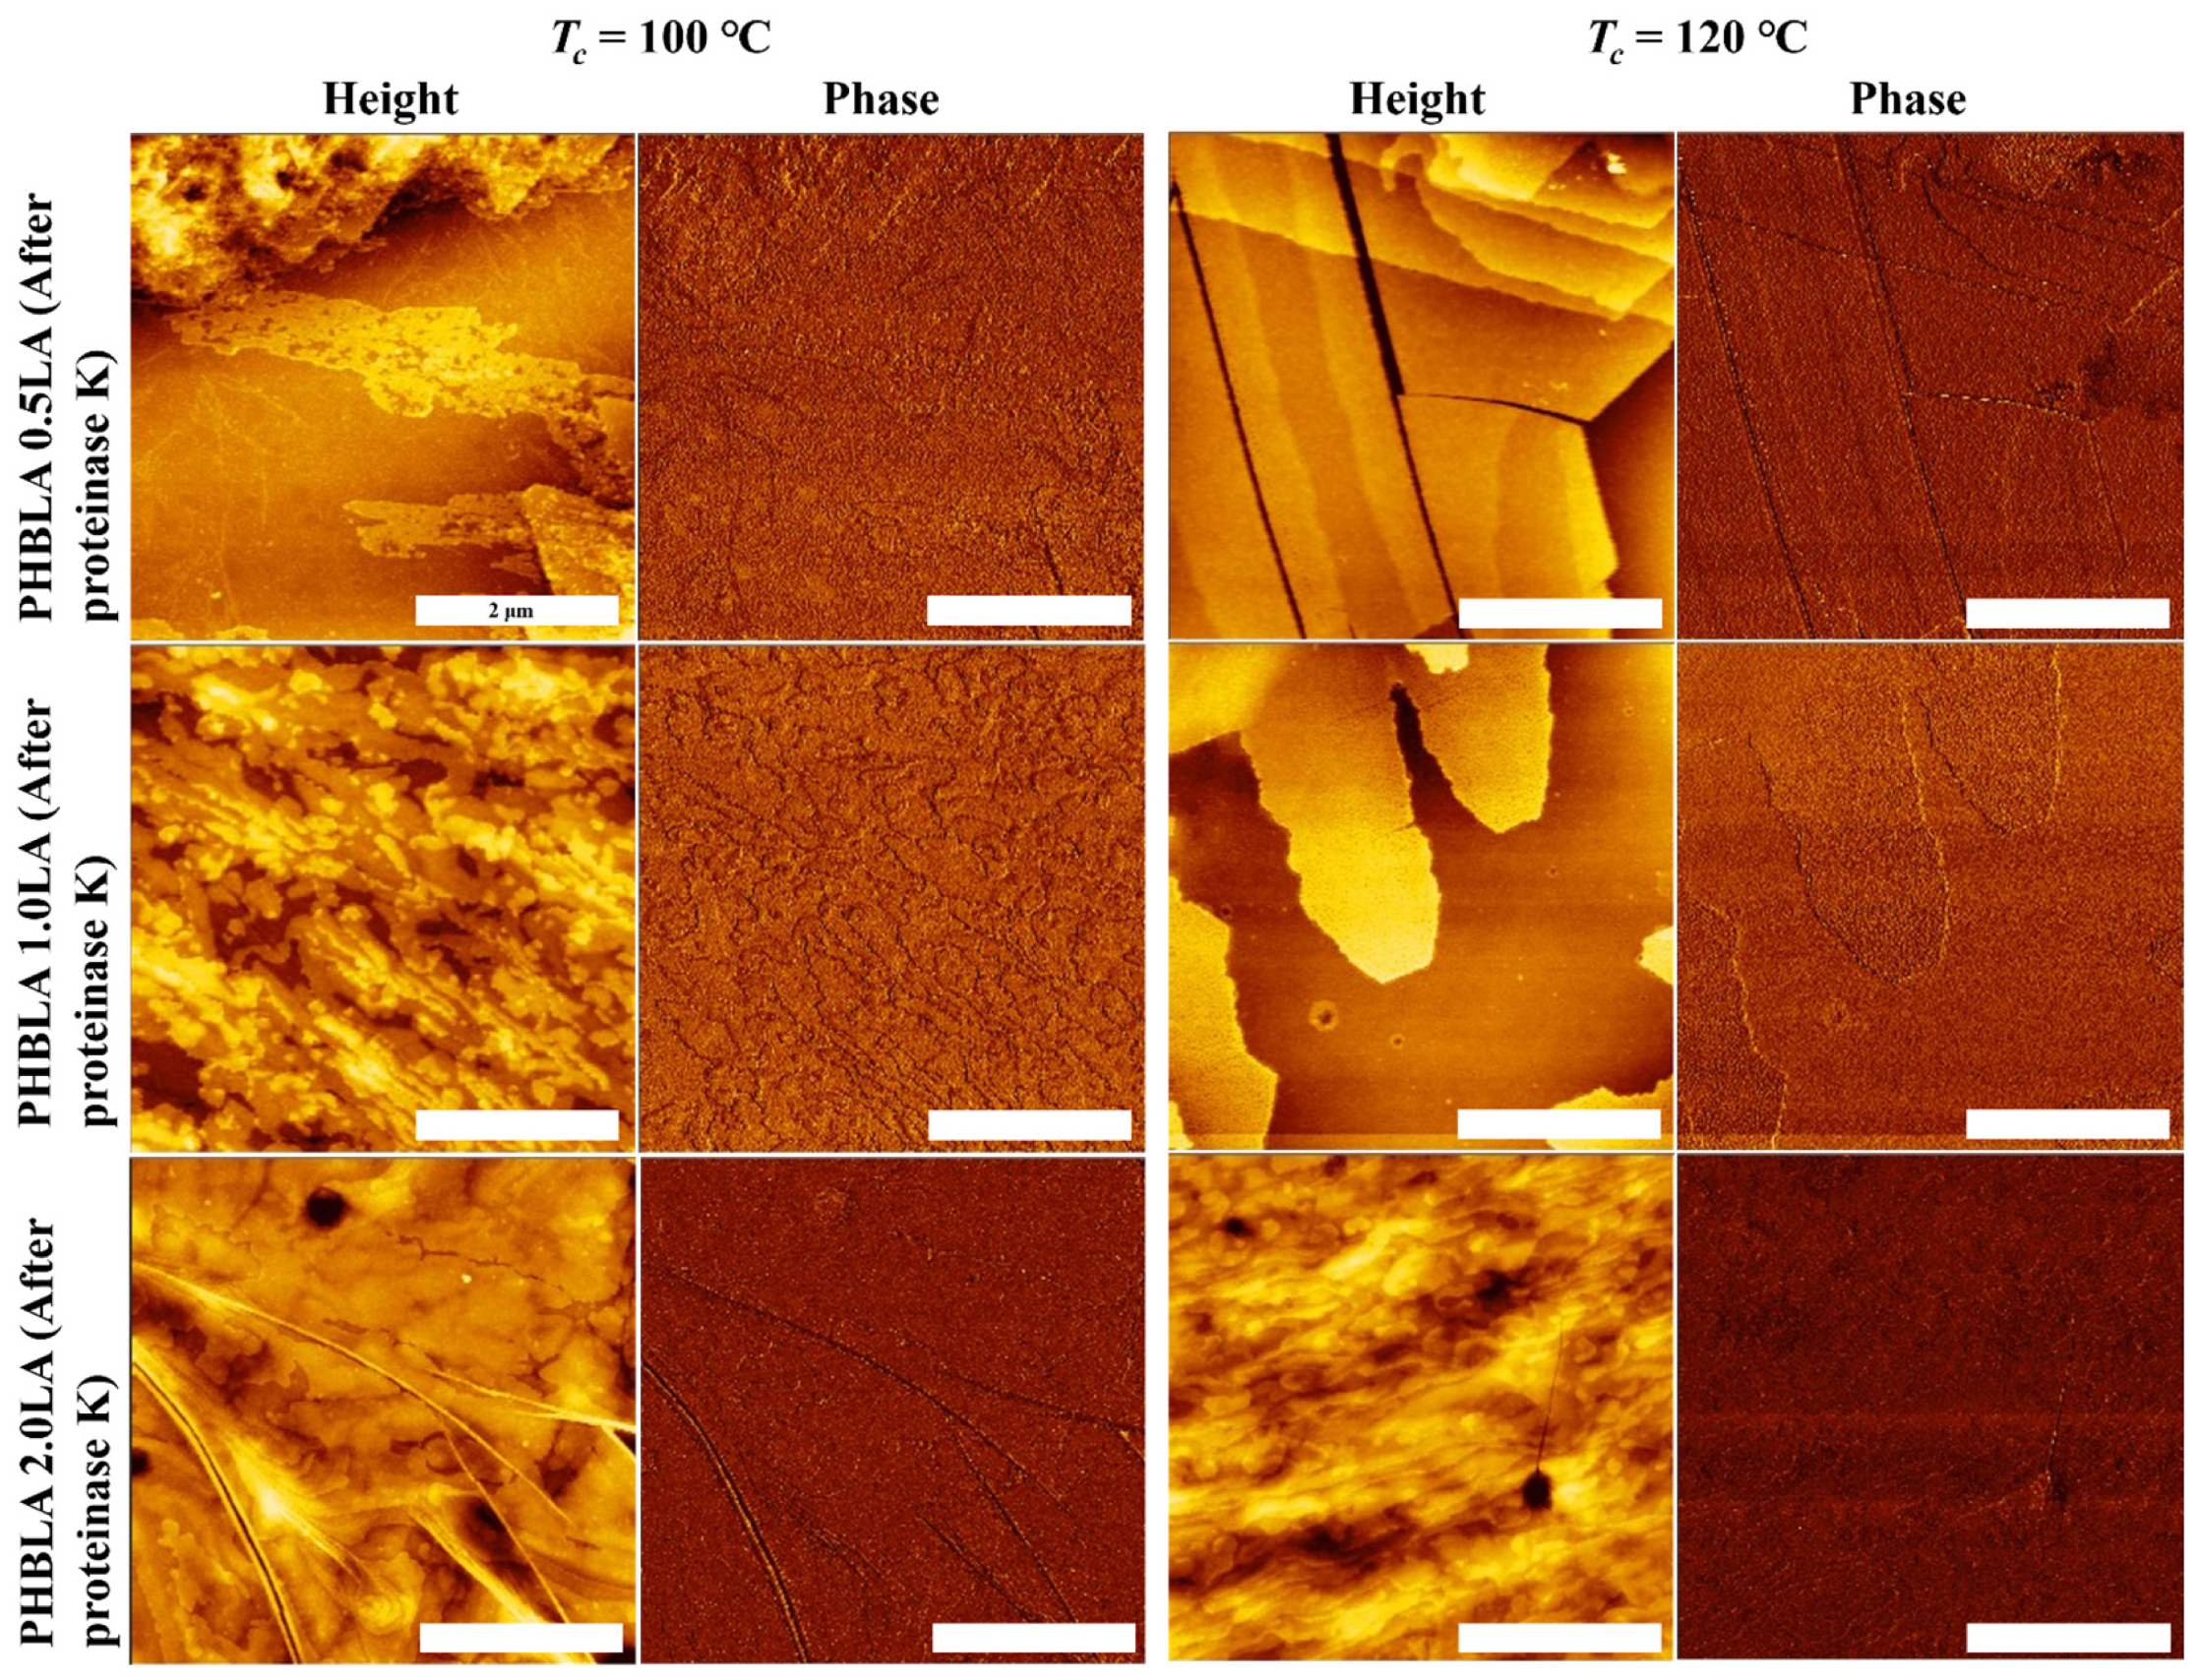
3.5. Effects of Enzymatic Degradation on Surface Morphology
4. Conclusions
Supplementary Materials
Author Contributions
Funding
Institutional Review Board Statement
Data Availability Statement
Acknowledgments
Conflicts of Interest
Abbreviations
| P3HB (or PHB) | Poly[(R)-3-hydroxybutyrate] |
| PCL | Polycaprolactone |
| PLLA (or PLA) | Poly(l-lactic acid) |
| LMPHB | Low molecular weight poly[(R)-3-hydroxybutyrate] |
| HMPHB | High molecular weight poly[(R)-3-hydroxybutyrate] |
| PHBCL | Poly[(R)-3-hydroxybutyrate]-block-polycaprolactone |
| PHBLA | Poly[(R)-3-hydroxybutyrate]-block-polylactic acid |
| NMR | Nuclear magnetic resonance |
| GPC | Gas permeation chromatography |
| DSC | Differential scanning calorimetry |
| TGA | Thermal gravimetric analysis |
| DTG | Derivative thermogravimetric analysis |
| WAXD | Wide-angle X-ray diffraction |
| POM | Polarized optical microscopy |
| AFM | Atomic force microscopy |
| ROP | Ring- opening polymerization |
| DBTDL | Dibutyltin dilaurate |
References
- Swetha, T.A.; Bora, A.; Ananthy, V.; Ponnuchamy, K.; Muthusamy, G.; Arun, A. A review of bioplastics as an alternative to petrochemical plastics: Its types, structure, characteristics, degradation, standards, and feedstocks. Polym. Adv. Technol. 2024, 35, e6482. [Google Scholar] [CrossRef]
- Di Bartolo, A.; Infurna, G.; Dintcheva, N.T. A Review of Bioplastics and Their Adoption in the Circular Economy. Polymers 2021, 13, 1229. [Google Scholar] [CrossRef] [PubMed]
- Cakmak, O.K. Biodegradable Polymers—A Review on Properties, Processing, and Degradation Mechanism. Circ. Econ. Sustain. 2024, 4, 339–362. [Google Scholar] [CrossRef]
- Asghari, F.; Samiei, M.; Adibkia, K.; Akbarzadeh, A.; Davaran, S. Biodegradable and biocompatible polymers for tissue engineering application: A review. Artif. Cells Nanomed. Biotechnol. 2017, 45, 185–192. [Google Scholar] [CrossRef] [PubMed]
- Meereboer, K.W.; Misra, M.; Mohanty, A.K. Review of recent advances in the biodegradability of polyhydroxyalkanoate (PHA) bioplastics and their composites. Green Chem. 2020, 22, 5519–5558. [Google Scholar] [CrossRef]
- Samir, A.; Ashour, F.H.; Hakim, A.A.A.; Bassyouni, M. Recent advances in biodegradable polymers for sustainable applications. Npj Mater. Degrad. 2022, 6, 68. [Google Scholar] [CrossRef]
- Rai, P.; Mehrotra, S.; Priya, S.; Gnansounou, E.; Sharma, S.K. Recent advances in the sustainable design and applications of biodegradable polymers. Bioresour. Technol. 2021, 325, 124739. [Google Scholar] [CrossRef]
- Kai, D.; Loh, X.J. Polyhydroxyalkanoates: Chemical Modifications Toward Biomedical Applications. ACS Sustain. Chem. Eng. 2014, 2, 106–119. [Google Scholar] [CrossRef]
- Kumar, N.; Ravikumar, M.N.V.; Domb, A.J. Biodegradable block copolymers. Adv. Drug Deliv. Rev. 2001, 53, 23–44. [Google Scholar] [CrossRef]
- Reeve, M.S.; McCarthy, S.P.; Gross, R.A. Preparation and characterization of (R)-poly(.beta.-hydroxybutyrate)-poly(.epsilon.-caprolactone) and (R)-poly(.beta.-hydroxybutyrate)-poly(lactide) degradable diblock copolymers. Macromolecules 1993, 26, 888–894. [Google Scholar] [CrossRef]
- Oyama, T.; Kobayashi, S.; Okura, T.; Sato, S.; Tajima, K.; Isono, T.; Satoh, T. Biodegradable Compatibilizers for Poly(hydroxyalkanoate)/Poly(ε-caprolactone) Blends through Click Reactions with End-Functionalized Microbial Poly(hydroxyalkanoate)s. ACS Sustain. Chem. Eng. 2019, 7, 7969–7978. [Google Scholar] [CrossRef]
- Jeepery, I.F.; Goto, T.; Sudesh, K.; Abe, H. Biodegradable block copolymer as compatibilizer and blend component of poly(3-hydroxybutyrate-co-3-hydroxyhexanoate)-based polyester blends. Eur. Polym. J. 2023, 196, 112314. [Google Scholar] [CrossRef]
- Wu, L.; Chen, S.; Li, Z.; Xu, K.; Chen, G.-Q. Synthesis, characterization and biocompatibility of novel biodegradable poly[((R)-3-hydroxybutyrate)-block-(D,L-lactide)-block-(ε-caprolactone)] triblock copolymers. Polym. Int. 2008, 57, 939–949. [Google Scholar] [CrossRef]
- Wu, L.; Wang, L.; Wang, X.; Xu, K. Synthesis, characterizations and biocompatibility of novel biodegradable star block copolymers based on poly[(R)-3-hydroxybutyrate] and poly(ε-caprolactone). Acta Biomater. 2010, 6, 1079–1089. [Google Scholar] [CrossRef]
- Handbook of Polymer Crystallization. Available online: https://onlinelibrary.wiley.com/doi/epdf/10.1002/9781118541838 (accessed on 1 December 2024).
- Hamley, I.W.; Castelletto, V.; Castillo, R.V.; Müller, A.J.; Martin, C.M.; Pollet, E.; Dubois, P. Crystallization in Poly(l-lactide)-b-poly(ε-caprolactone) Double Crystalline Diblock Copolymers: A Study Using X-ray Scattering, Differential Scanning Calorimetry, and Polarized Optical Microscopy. Macromolecules 2005, 38, 463–472. [Google Scholar] [CrossRef]
- Li, S.; Sun, X.; Li, H.; Yan, S. The crystallization behavior of biodegradable polymer in thin film. Eur. Polym. J. 2018, 102, 238–253. [Google Scholar] [CrossRef]
- Tsuji, H.; Miyauchi, S. Poly(l-lactide): VI Effects of crystallinity on enzymatic hydrolysis of poly(l-lactide) without free amorphous region. Polym. Degrad. Stab. 2001, 71, 415–424. [Google Scholar] [CrossRef]
- Reeve, M.S.; McCarthy, S.P.; Downey, M.J.; Gross, R.A. Polylactide stereochemistry: Effect on enzymic degradability. Macromolecules 1994, 27, 825–831. [Google Scholar] [CrossRef]
- Kikkawa, Y.; Abe, H.; Iwata, T.; Inoue, Y.; Doi, Y. Crystallization, Stability, and Enzymatic Degradation of Poly(l-lactide) Thin Film. Biomacromolecules 2002, 3, 350–356. [Google Scholar] [CrossRef]
- Abe, H.; Doi, Y.; Aoki, H.; Akehata, T.; Hori, Y.; Yamaguchi, A. Physical Properties and Enzymic Degradability of Copolymers of (R)-3-Hydroxybutyric and 6-Hydroxyhexanoic Acids. Macromolecules 1995, 28, 7630–7637. [Google Scholar] [CrossRef]
- Ghosh, K.; Jones, B.H. Roadmap to Biodegradable Plastics—Current State and Research Needs. ACS Sustain. Chem. Eng. 2021, 9, 6170–6187. [Google Scholar] [CrossRef]
- Iwata, T.; Doi, Y. Morphology and Enzymatic Degradation of Poly(l-lactic acid) Single Crystals. Macromolecules 1998, 31, 2461–2467. [Google Scholar] [CrossRef]
- Numata, K.; Abe, H.; Doi, Y. Enzymatic processes for biodegradation of poly(hydroxyalkanoate)s crystals. Can. J. Chem. 2008, 86, 471–483. [Google Scholar] [CrossRef]
- Vonk, C.G. Computerization of Ruland’s X-ray method for determination of the crystallinity in polymers. J. Appl. Crystallogr. 1973, 6, 148–152. [Google Scholar] [CrossRef]
- Tan, L.-T.; Hiraishi, T.; Sudesh, K.; Maeda, M. Directed evolution of poly[(R)-3-hydroxybutyrate] depolymerase using cell surface display system: Functional importance of asparagine at position 285. Appl. Microbiol. Biotechnol. 2013, 97, 4859–4871. [Google Scholar] [CrossRef]
- Špitalský, Z.; Lacík, I.; Lathová, E.; Janigová, I.; Chodák, I. Controlled degradation of polyhydroxybutyrate via alcoholysis with ethylene glycol or glycerol. Polym. Degrad. Stab. 2006, 91, 856–861. [Google Scholar] [CrossRef]
- Li, Y.; Kissel, T. Synthesis, characteristics and in vitro degradation of star-block copolymers consisting of l-lactide, glycolide and branched multi-arm poly(ethylene oxide). Polymer 1998, 39, 4421–4427. [Google Scholar] [CrossRef]
- Timbart, L.; Renard, E.; Tessier, M.; Langlois, V. Monohydroxylated Poly(3-hydroxyoctanoate) Oligomers and Its Functionalized Derivatives Used as Macroinitiators in the Synthesis of Degradable Diblock Copolyesters. Biomacromolecules 2007, 8, 1255–1265. [Google Scholar] [CrossRef]
- Makiguchi, K.; Satoh, T.; Kakuchi, T. Diphenyl Phosphate as an Efficient Cationic Organocatalyst for Controlled/Living Ring-Opening Polymerization of δ-Valerolactone and ε-Caprolactone. Macromolecules 2011, 44, 1999–2005. [Google Scholar] [CrossRef]
- Kim, M.S.; Seo, K.S.; Khang, G.; Lee, H.B. Ring-Opening Polymerization of ε-Caprolactone by Poly(ethylene glycol) by an Activated Monomer Mechanism. Macromol. Rapid Commun. 2005, 26, 643–648. [Google Scholar] [CrossRef]
- Castillo, R.; Müller, A. Crystallization and morphology of biodegradable or biostable single and double crystalline block copolymers. Prog. Polym. Sci. 2009, 34, 516–560. [Google Scholar] [CrossRef]
- Liu, Q.; Shyr, T.-W.; Tung, C.-H.; Deng, B.; Zhu, M. Block copolymers containing poly (3-hydroxybutyrate-co-3-hydroxyvalerate) and poly (ɛ-caprolactone) units: Synthesis, characterization and thermal degradation. Fibers Polym. 2011, 12, 848–856. [Google Scholar] [CrossRef]
- He, C.; Sun, J.; Deng, C.; Zhao, T.; Deng, M.; Chen, X.; Jing, X. Study of the Synthesis, Crystallization, and Morphology of Poly(ethylene glycol)−Poly(ε-caprolactone) Diblock Copolymers. Biomacromolecules 2004, 5, 2042–2047. [Google Scholar] [CrossRef] [PubMed]
- Van Horn, R.M.; Zheng, J.X.; Sun, H.-J.; Hsiao, M.-S.; Zhang, W.-B.; Dong, X.-H.; Xu, J.; Thomas, E.L.; Lotz, B.; Cheng, S.Z.D. Solution Crystallization Behavior of Crystalline−Crystalline Diblock Copolymers of Poly(ethylene oxide)-block-poly(ε-caprolactone). Macromolecules 2010, 43, 6113–6119. [Google Scholar] [CrossRef]
- Xu, Y.; Zhang, Y.; Fan, Z.; Li, S. Melt crystallization and morphology of poly(ε-caprolactone)-poly(ethylene glycol) diblock copolymers with different compositions and molecular weights. J. Polym. Sci. Part B Polym. Phys. 2010, 48, 286–293. [Google Scholar] [CrossRef]
- Iwata, T.; Doi, Y.; Kasuya, K.-I.; Inoue, Y. Visualization of Enzymatic Degradation of Poly[(R)-3-hydroxybutyrate] Single Crystals by an Extracellular PHB Depolymerase. Macromolecules 1997, 30, 833–839. [Google Scholar] [CrossRef]
- Kurokawa, K.; Yamashita, K.; Doi, Y.; Abe, H. Surface properties and enzymatic degradation of end-capped poly(l-lactide). Polym. Degrad. Stab. 2006, 91, 1300–1310. [Google Scholar] [CrossRef]


| Target of Degradation | Enzyme | Enzyme (with Buffer) Solution | Volume of Enzyme Solution (μL) | Degradation Time (min) |
|---|---|---|---|---|
| PHB | PHB depolymerase | 1.0 μg/mL in 0.1 M phosphate buffer | 100 | 40 |
| PCL | Lipase | 1.0 mg/mL in 0.1 M phosphate buffer | 75 | 30 |
| PLA | Proteinase K | 0.2 mg/mL in 50 mM tris-HCl buffer | 100 | 120 |
| Sample | PHB:PCL/PLA a | Mn (g mol−1) a | Mn (g mol−1) b | Mw (g mol−1) b | Mw/Mnb | Yield (%) |
|---|---|---|---|---|---|---|
| HMPHB | - | - | 174,200 | 430,300 | 2.47 | - |
| LMPHB | - | 10,800 | 26,000 | 38,400 | 1.48 | 94 |
| PHBCL 0.5CL | 1:0.5 | - | 34,900 | 44,700 | 1.28 | 93 |
| PHBCL 1.0CL | 1:1.0 | - | 49,200 | 58,300 | 1.19 | 92 |
| PHBCL 2.0CL | 1:2.1 | - | 73,200 | 84,600 | 1.16 | 95 |
| PHBLA 0.5LA | 1:0.7 | - | 29,100 | 40,300 | 1.39 | 85 |
| PHBLA 1.0LA | 1:1.3 | - | 39,100 | 47,400 | 1.21 | 87 |
| PHBLA 2.0LA | 1:2.4 | - | 59,000 | 68,200 | 1.16 | 86 |
| Sample | Tm (°C) a | ΔHm (J g−1) a | Tg (°C) b | Td5% (°C) c | Td50% (°C) c | Tdmax (°C) c | Xc (%) d | |||
|---|---|---|---|---|---|---|---|---|---|---|
| PHB | PCL/ PLA + PHB | PHB | PCL/ PLA + PHB | PHB | PCL/ PLA + PHB | |||||
| PHBCL 0.5CL | 166.9 | 47.0, 57.3 | 65.8 | 5.6, 2.0 | −6.9 | - | 271 | 301 | 407 | 73.5 ± 5 |
| PHBCL 1.0CL | 168.5 | 58.0 | 56.2 | 40.5 | −3.5 | −55.0 | 284 | 378 | 406 | 65.5 ± 6 |
| PHBCL 2.0CL | 168.9 | 58.3 | 32.6 | 50.5 | −7.8 | −53.3 | 290 | 396 | 406 | 73.5 ± 5 |
| PHBLA 0.5LA | - | 165.5 | - | 87.4 | - | 10.4 | 273 | 297 | 359 | 62.5 ± 4 |
| PHBLA 1.0LA | - | 165.8 | - | 80.7 | - | 20.2 | 281 | 310 | 360 | 56.5 ± 5 |
| PHBLA 2.0LA | - | 172.3 | - | 67.4 | - | 34.5 | 284 | 346 | 365 | 56.5 ± 5 |
| Sample | Tc (°C) a | ΔHc (J g−1) a | Tm (°C) b | ΔHf (J g−1) b | ||||
|---|---|---|---|---|---|---|---|---|
| PHB/ PHB + PLA | PCL/PLA | PHB/ PHB + PLA | PCL/PLA | PHB/ PHB + PLA | PCL/PLA | PHB/ PHB + PLA | PCL/PLA | |
| PHBCL 0.5CL | 85.2 | 7.3 | −36.8 | −9.8 | 176.1 | 51.3 | 55.8 | 20.7 |
| PHBCL 1.0CL | 77.3 | 28.1 | −19.9 | −29.5 | 177.9 | 59.8 | 48.6 | 27.8 |
| PHBCL 2.0CL | 51.2 | 31.2 | −0.5 | −41.0 | 178.3 | 61.6 | 28.6 | 33.6 |
| PHBLA 0.5LA | 88.5 | - | −44.5 | - | 173.5 | - | 59.6 | - |
| PHBLA 1.0LA | 82.6 | - | −35.8 | - | 174.0 | - | 59.9 | - |
| PHBLA 2.0LA | - | 99.6 | - | −13.1 | 180.1 | - | 60.1 | - |
Disclaimer/Publisher’s Note: The statements, opinions and data contained in all publications are solely those of the individual author(s) and contributor(s) and not of MDPI and/or the editor(s). MDPI and/or the editor(s) disclaim responsibility for any injury to people or property resulting from any ideas, methods, instructions or products referred to in the content. |
© 2025 by the authors. Licensee MDPI, Basel, Switzerland. This article is an open access article distributed under the terms and conditions of the Creative Commons Attribution (CC BY) license (https://creativecommons.org/licenses/by/4.0/).
Share and Cite
Bartels-Ellis, A.; Hayashi, S.; Hiraishi, T.; Tsuge, T.; Abe, H. Surface Morphology and Degradation of Poly[(R)-3-Hydroxybutyrate]-block-Poly(ε-Caprolactone) and Poly[(R)-3-Hydroxybutyrate]-block-Poly(l-Lactide) Biodegradable Diblock Copolymers. Polymers 2025, 17, 1558. https://doi.org/10.3390/polym17111558
Bartels-Ellis A, Hayashi S, Hiraishi T, Tsuge T, Abe H. Surface Morphology and Degradation of Poly[(R)-3-Hydroxybutyrate]-block-Poly(ε-Caprolactone) and Poly[(R)-3-Hydroxybutyrate]-block-Poly(l-Lactide) Biodegradable Diblock Copolymers. Polymers. 2025; 17(11):1558. https://doi.org/10.3390/polym17111558
Chicago/Turabian StyleBartels-Ellis, Ayan, Senri Hayashi, Tomohiro Hiraishi, Takeharu Tsuge, and Hideki Abe. 2025. "Surface Morphology and Degradation of Poly[(R)-3-Hydroxybutyrate]-block-Poly(ε-Caprolactone) and Poly[(R)-3-Hydroxybutyrate]-block-Poly(l-Lactide) Biodegradable Diblock Copolymers" Polymers 17, no. 11: 1558. https://doi.org/10.3390/polym17111558
APA StyleBartels-Ellis, A., Hayashi, S., Hiraishi, T., Tsuge, T., & Abe, H. (2025). Surface Morphology and Degradation of Poly[(R)-3-Hydroxybutyrate]-block-Poly(ε-Caprolactone) and Poly[(R)-3-Hydroxybutyrate]-block-Poly(l-Lactide) Biodegradable Diblock Copolymers. Polymers, 17(11), 1558. https://doi.org/10.3390/polym17111558