
Synthesis and Characterization of Bio-Composite Based on Urea–Formaldehyde Resin and Hydrochar: Inherent Thermal Stability and Decomposition Kinetics


 , and
, and 
Abstract

1. Introduction
2. Materials and Methods
2.1. Materials
2.2. Synthesis of UF Bio-Composite
2.3. Characterization Experimental Techniques for the Synthesized UF Bio-Composite
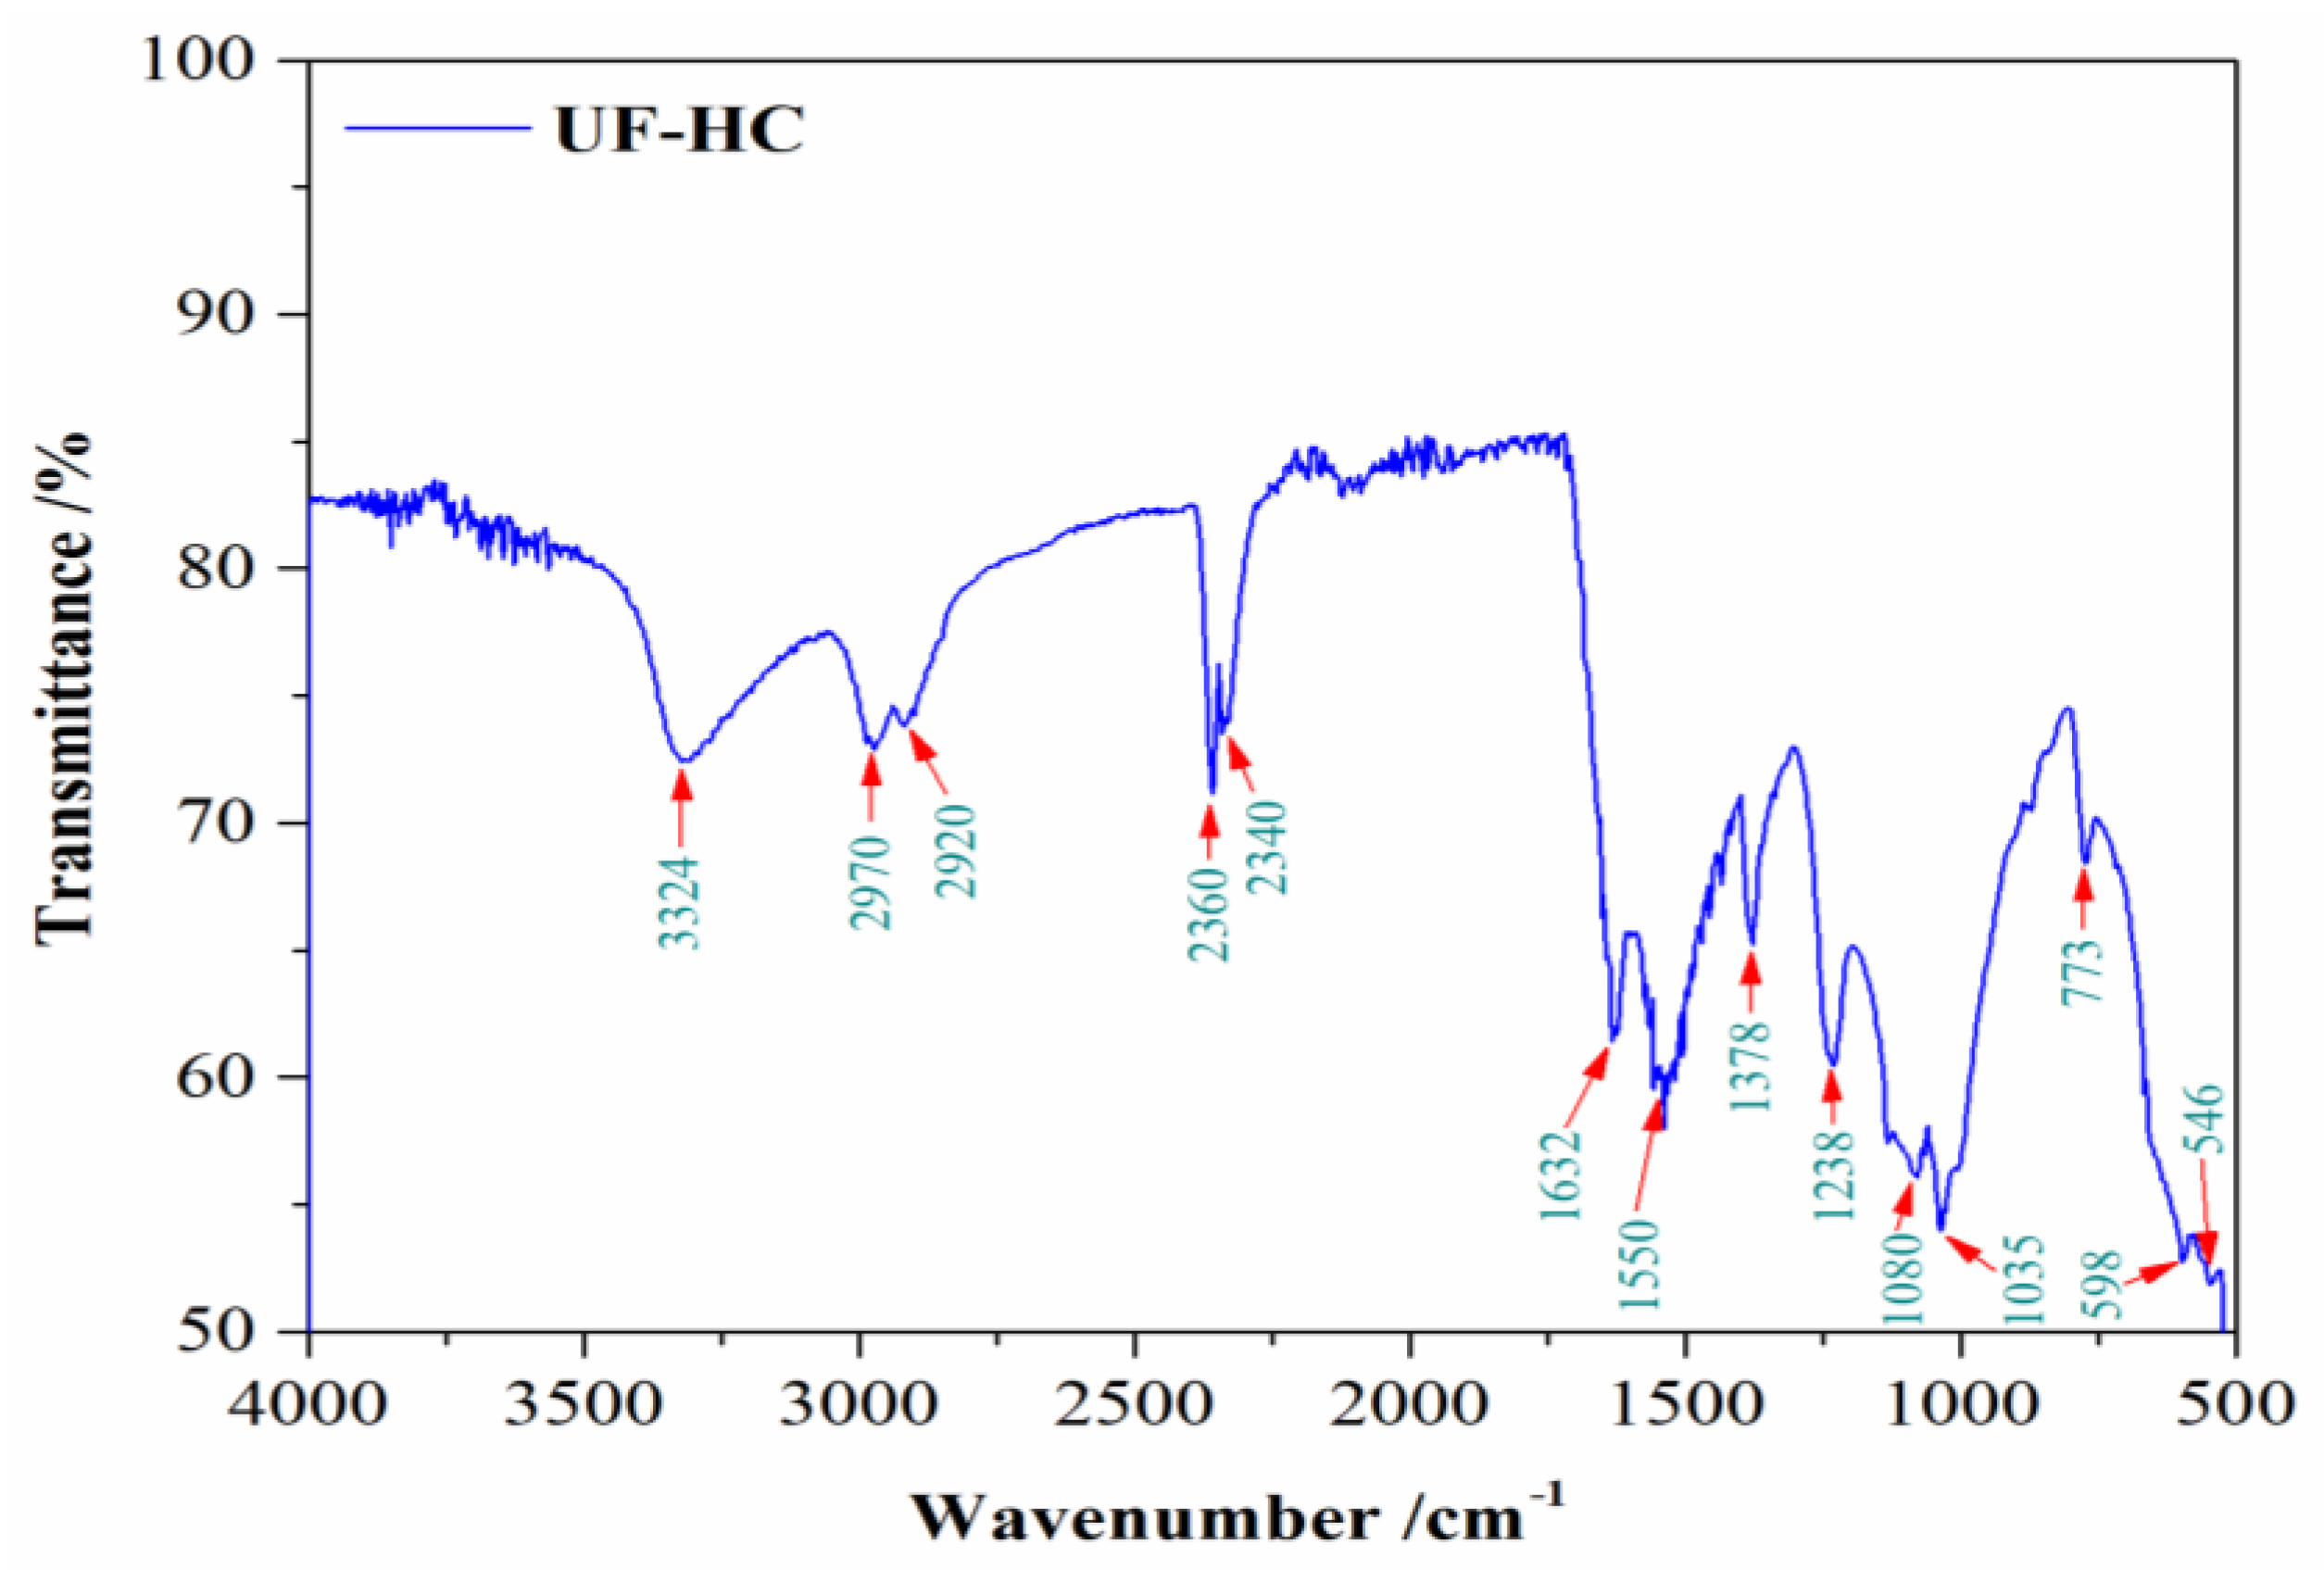
2.3.1. FTIR Analysis
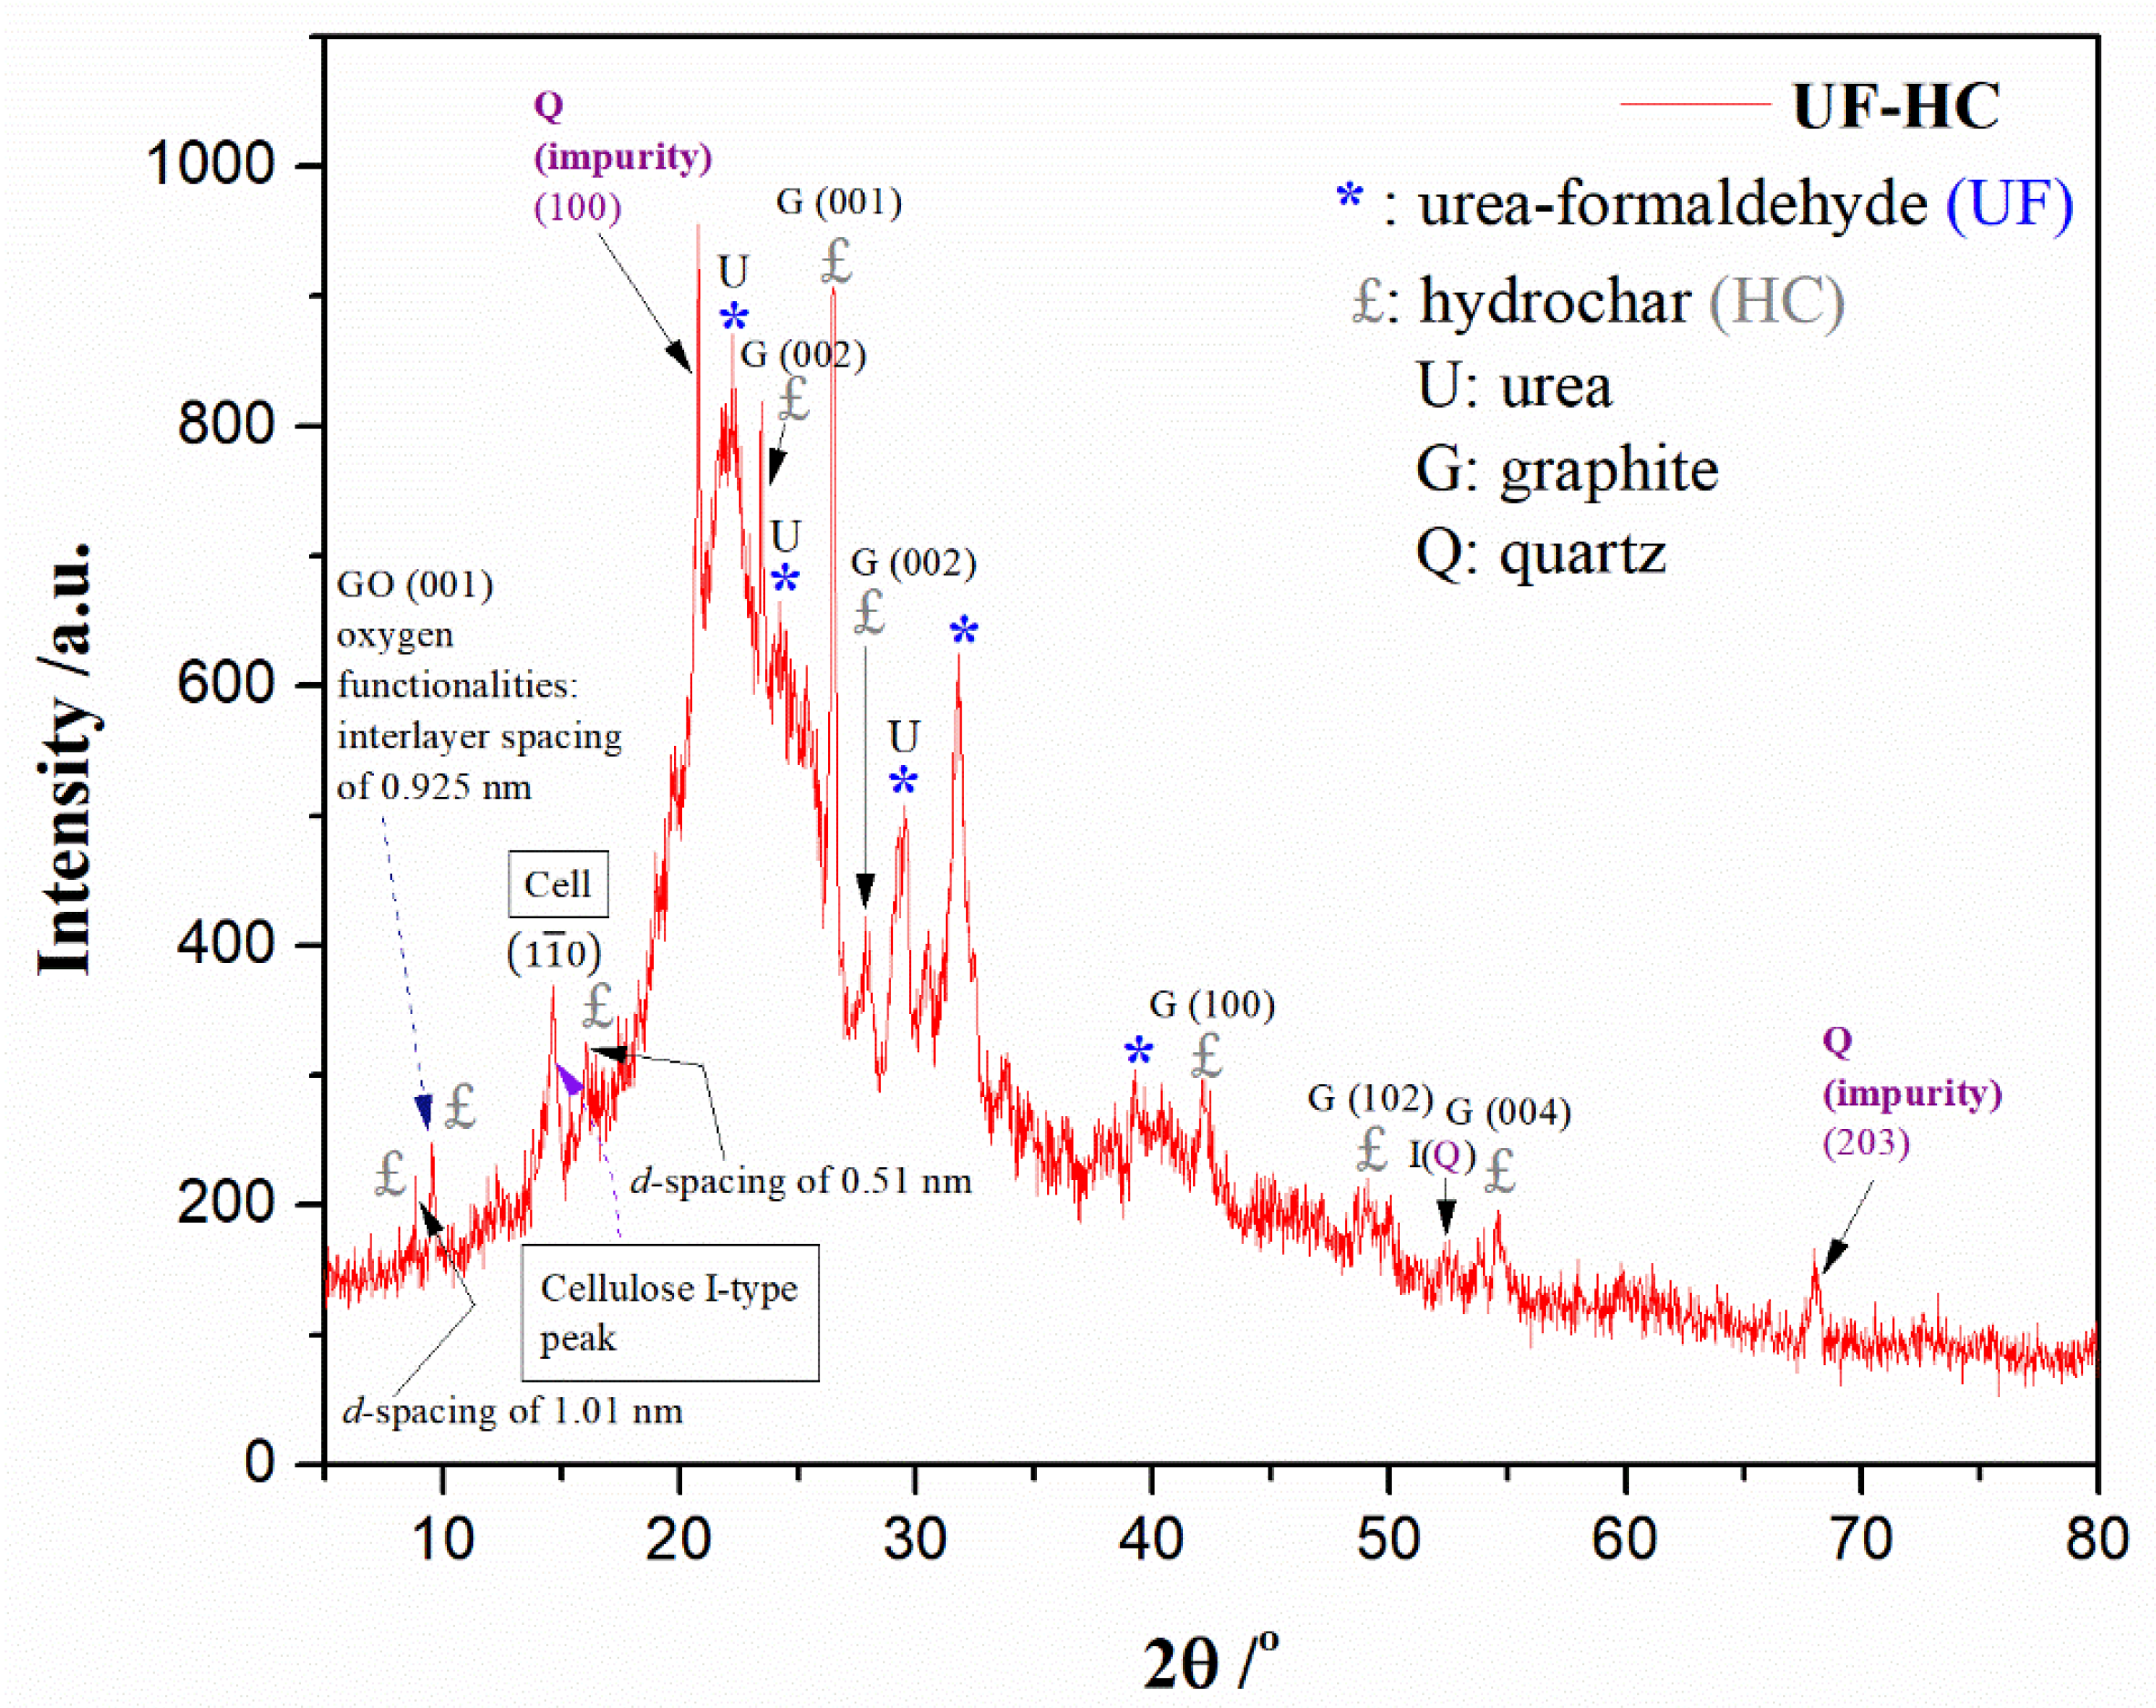
2.3.2. XRD Analysis
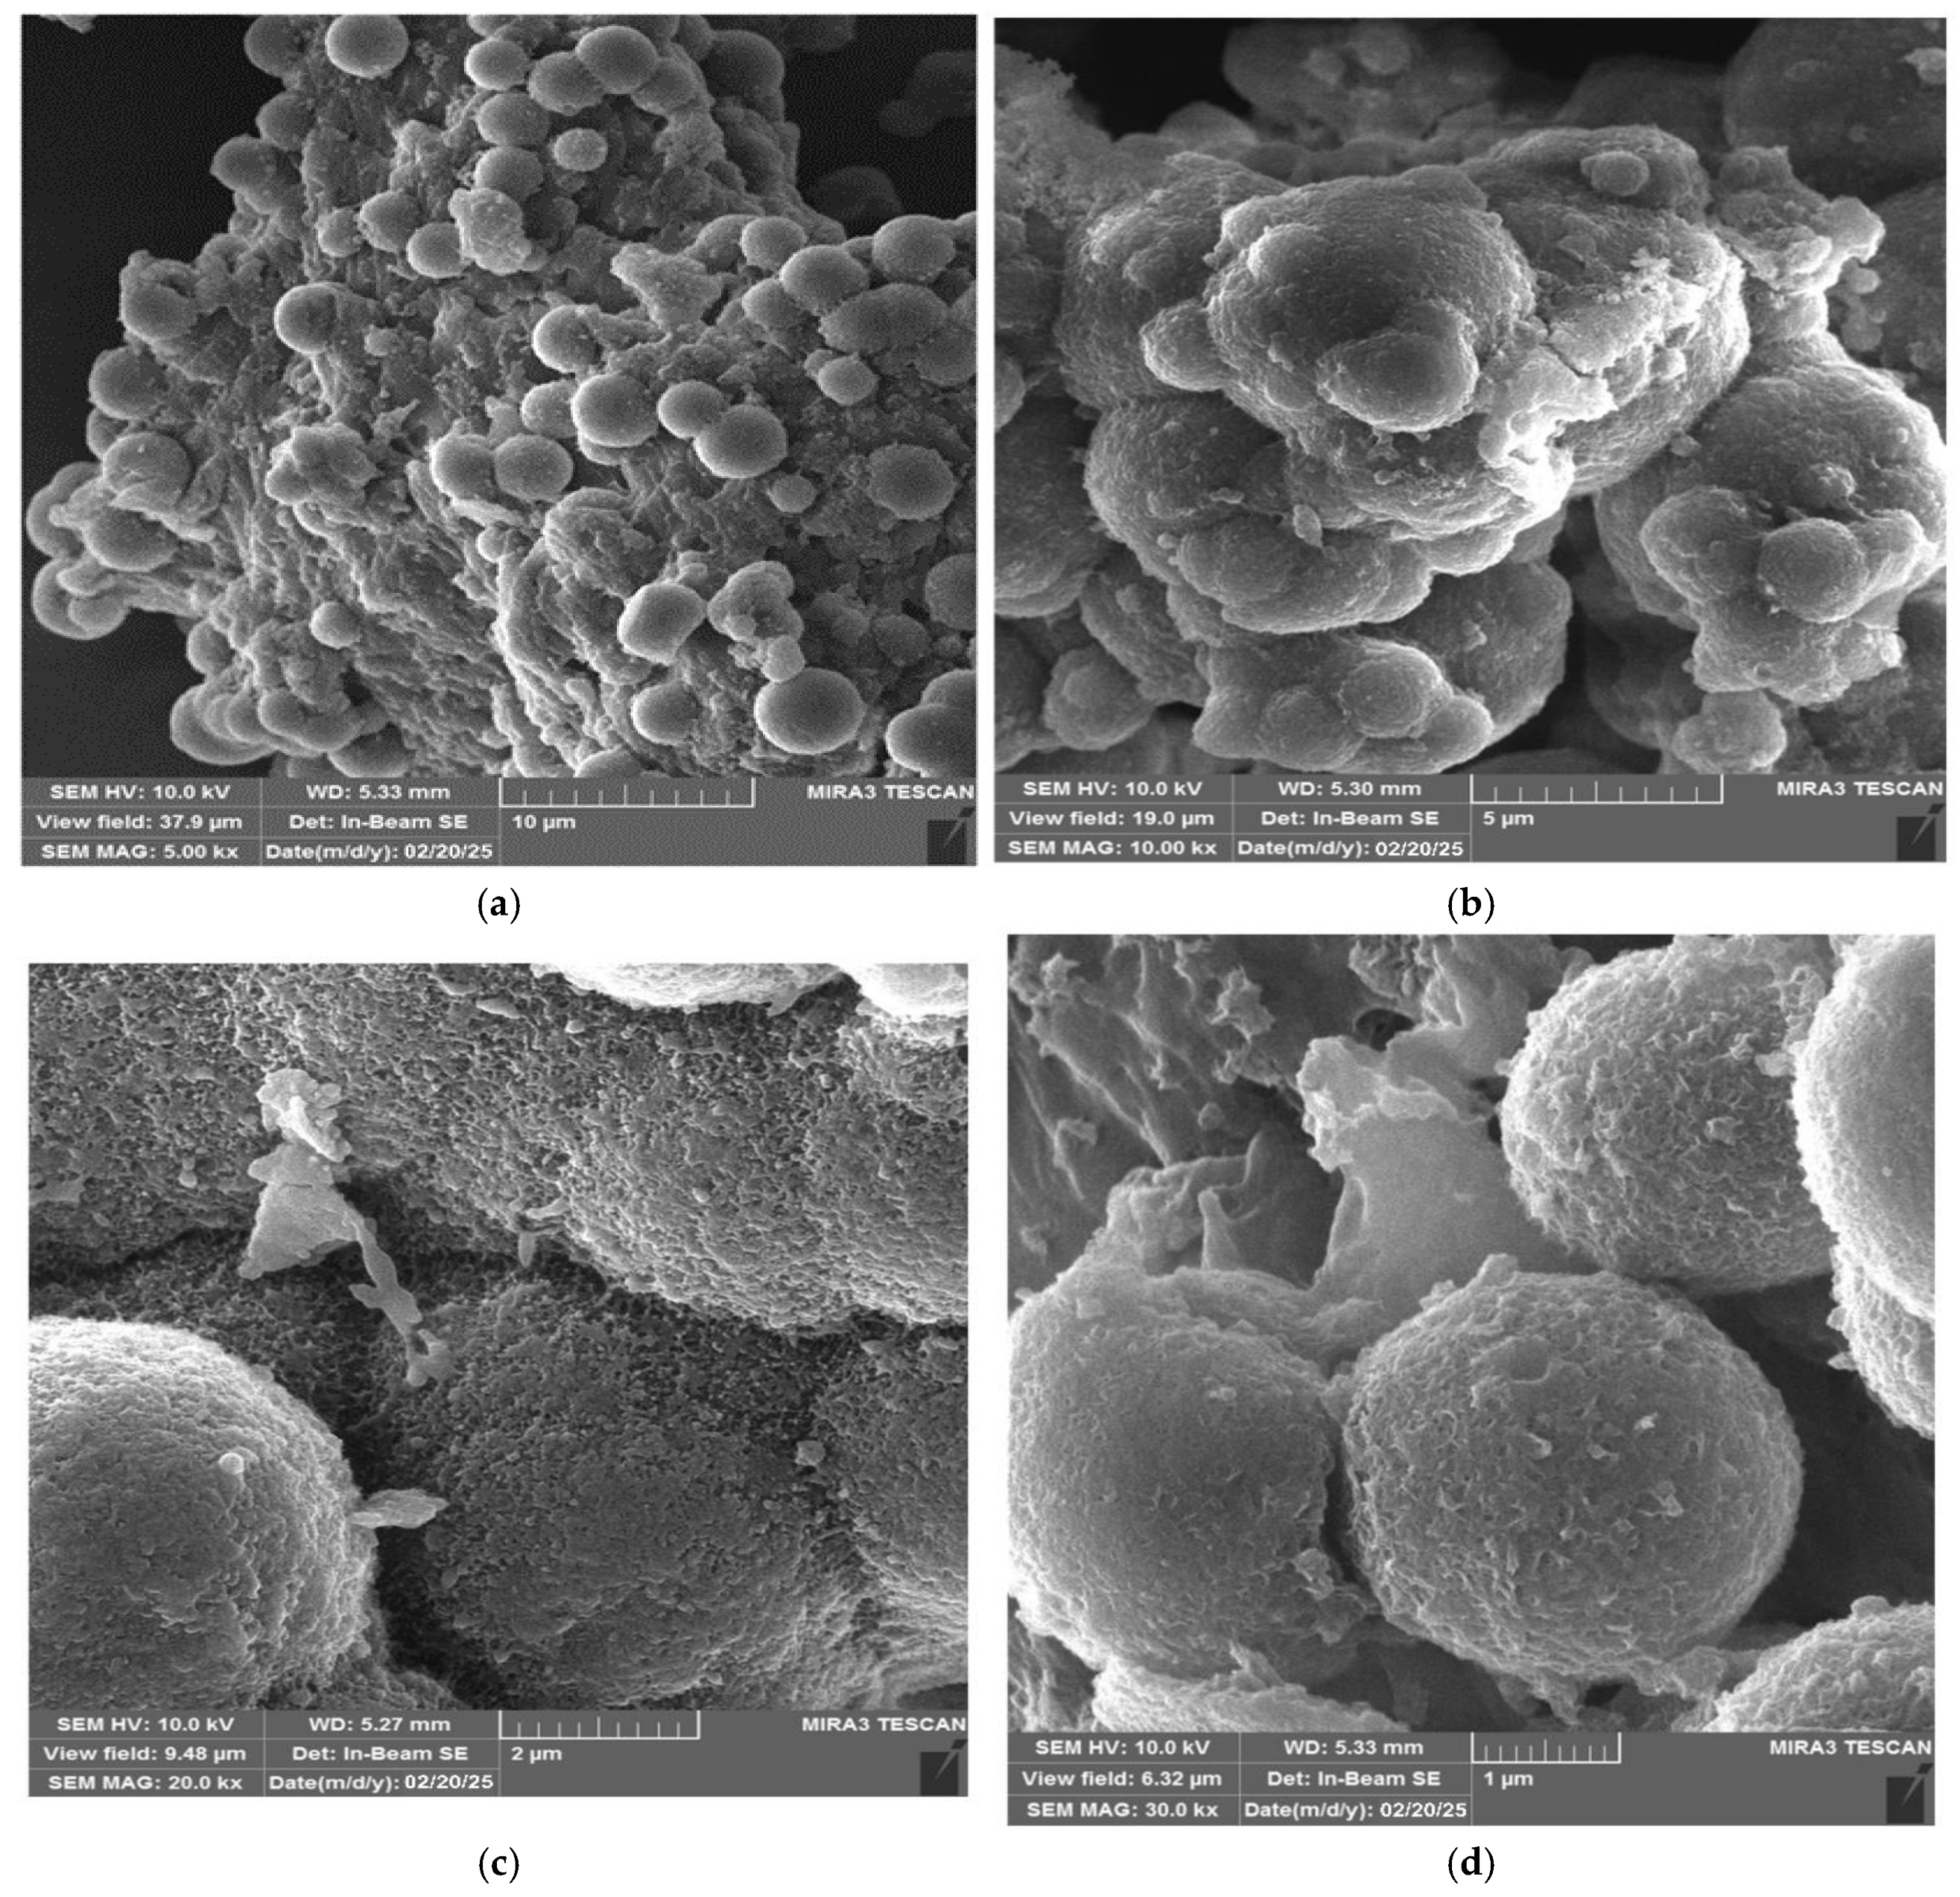
2.3.3. SEM Analysis
2.3.4. Simultaneous Thermogravimetric Analysis (TGA) and Differential Thermal Analysis (DTA) for Monitoring the Thermal Stability and Decomposition Process of UF Bio-Composite
2.4. Assessment of Thermal Stability of UF Bio-Composite
2.5. Methods for Determining the Kinetic Triplet of a Process and Its Optimization
3. Results and Discussion
3.1. FTIR Results
3.2. XRD Results
3.3. SEM Results
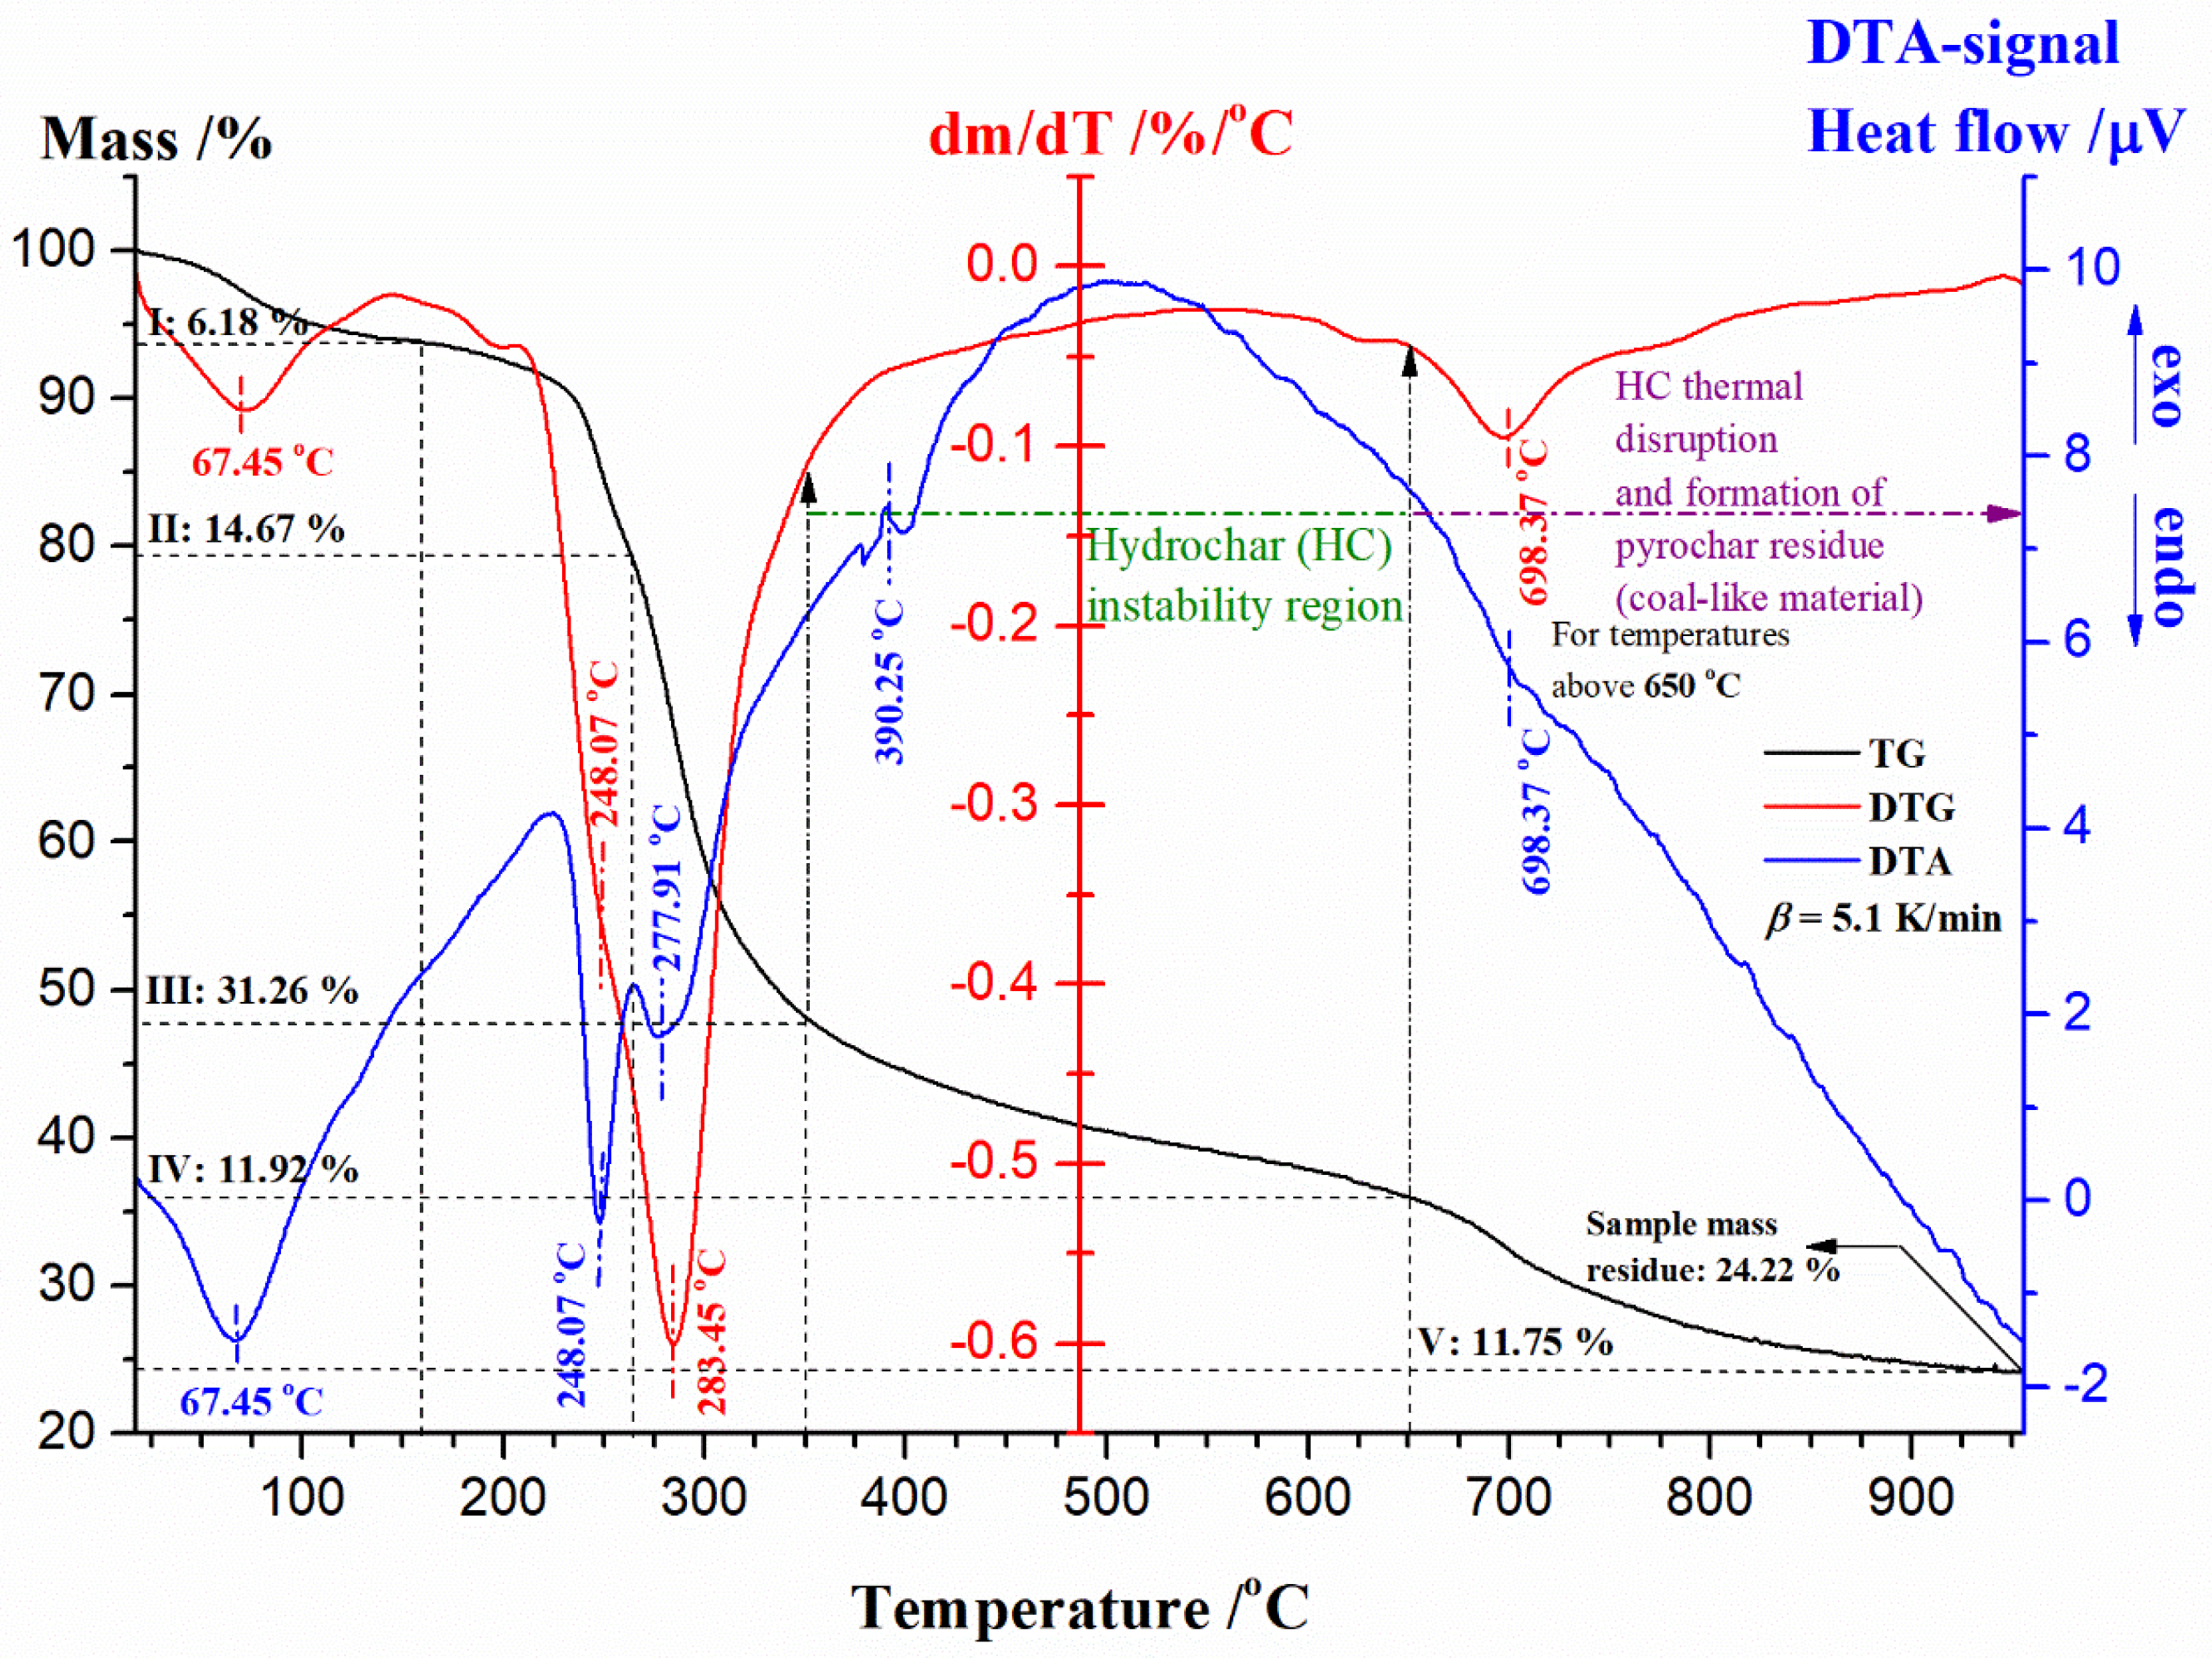
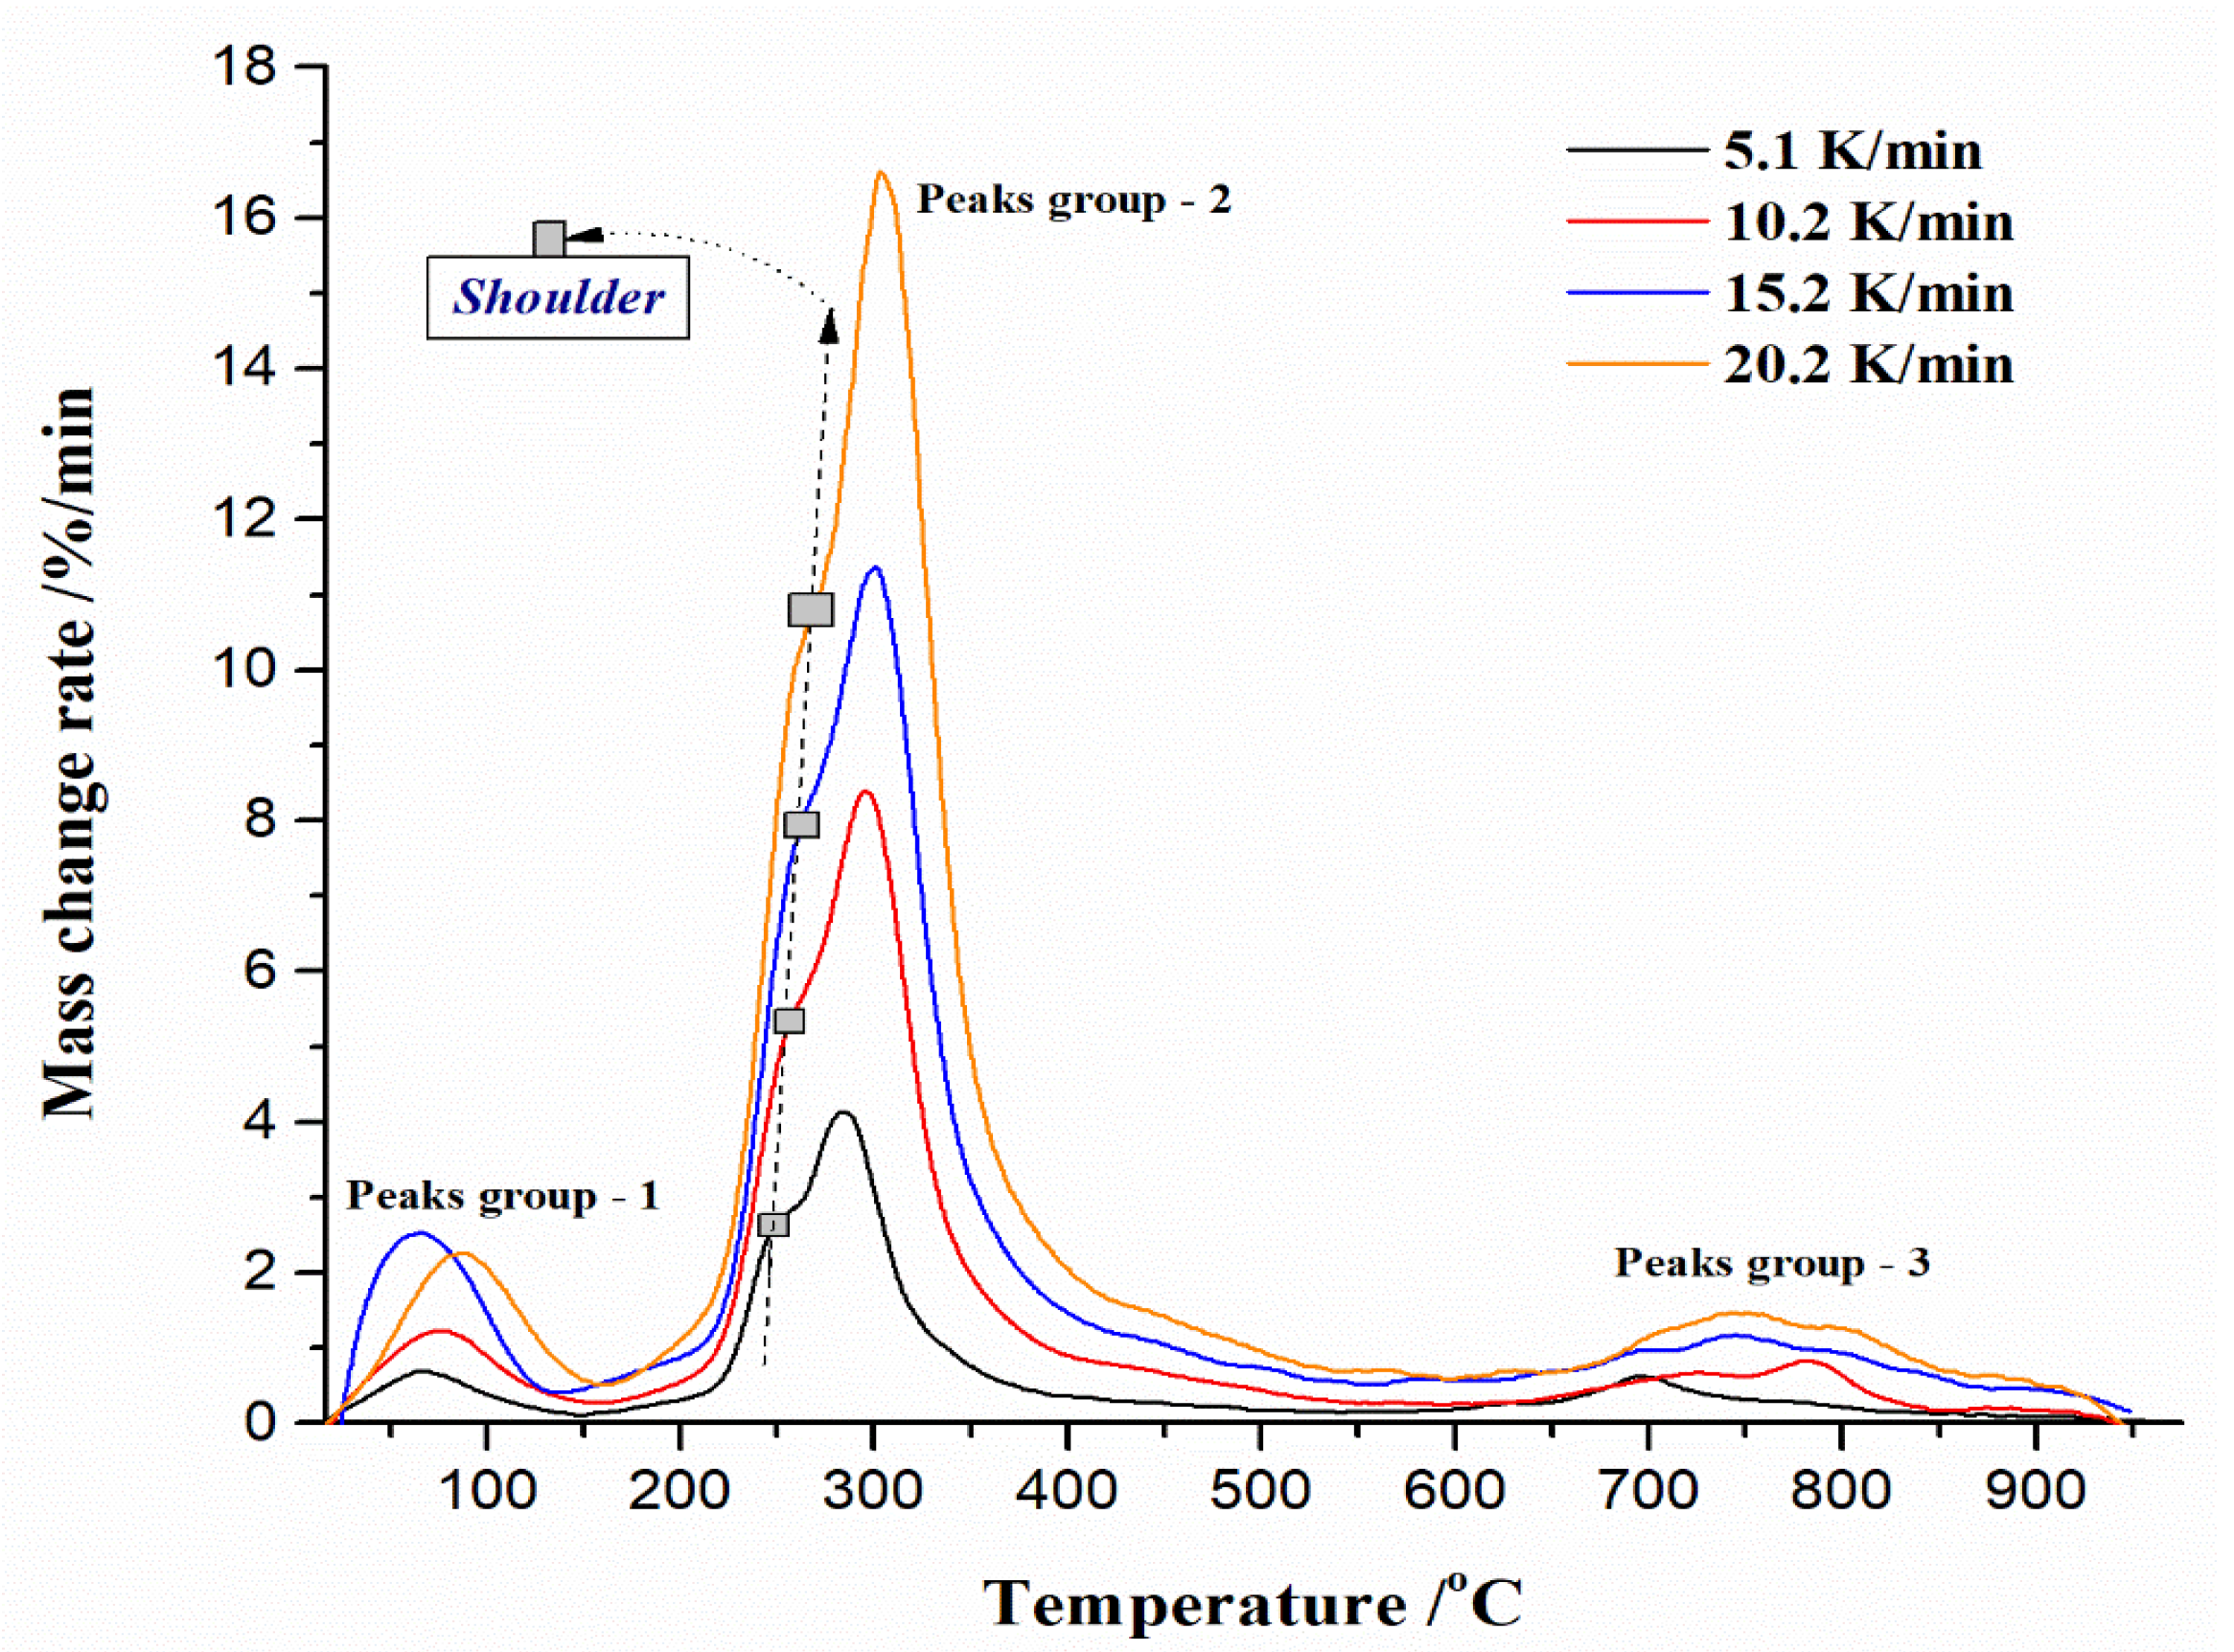
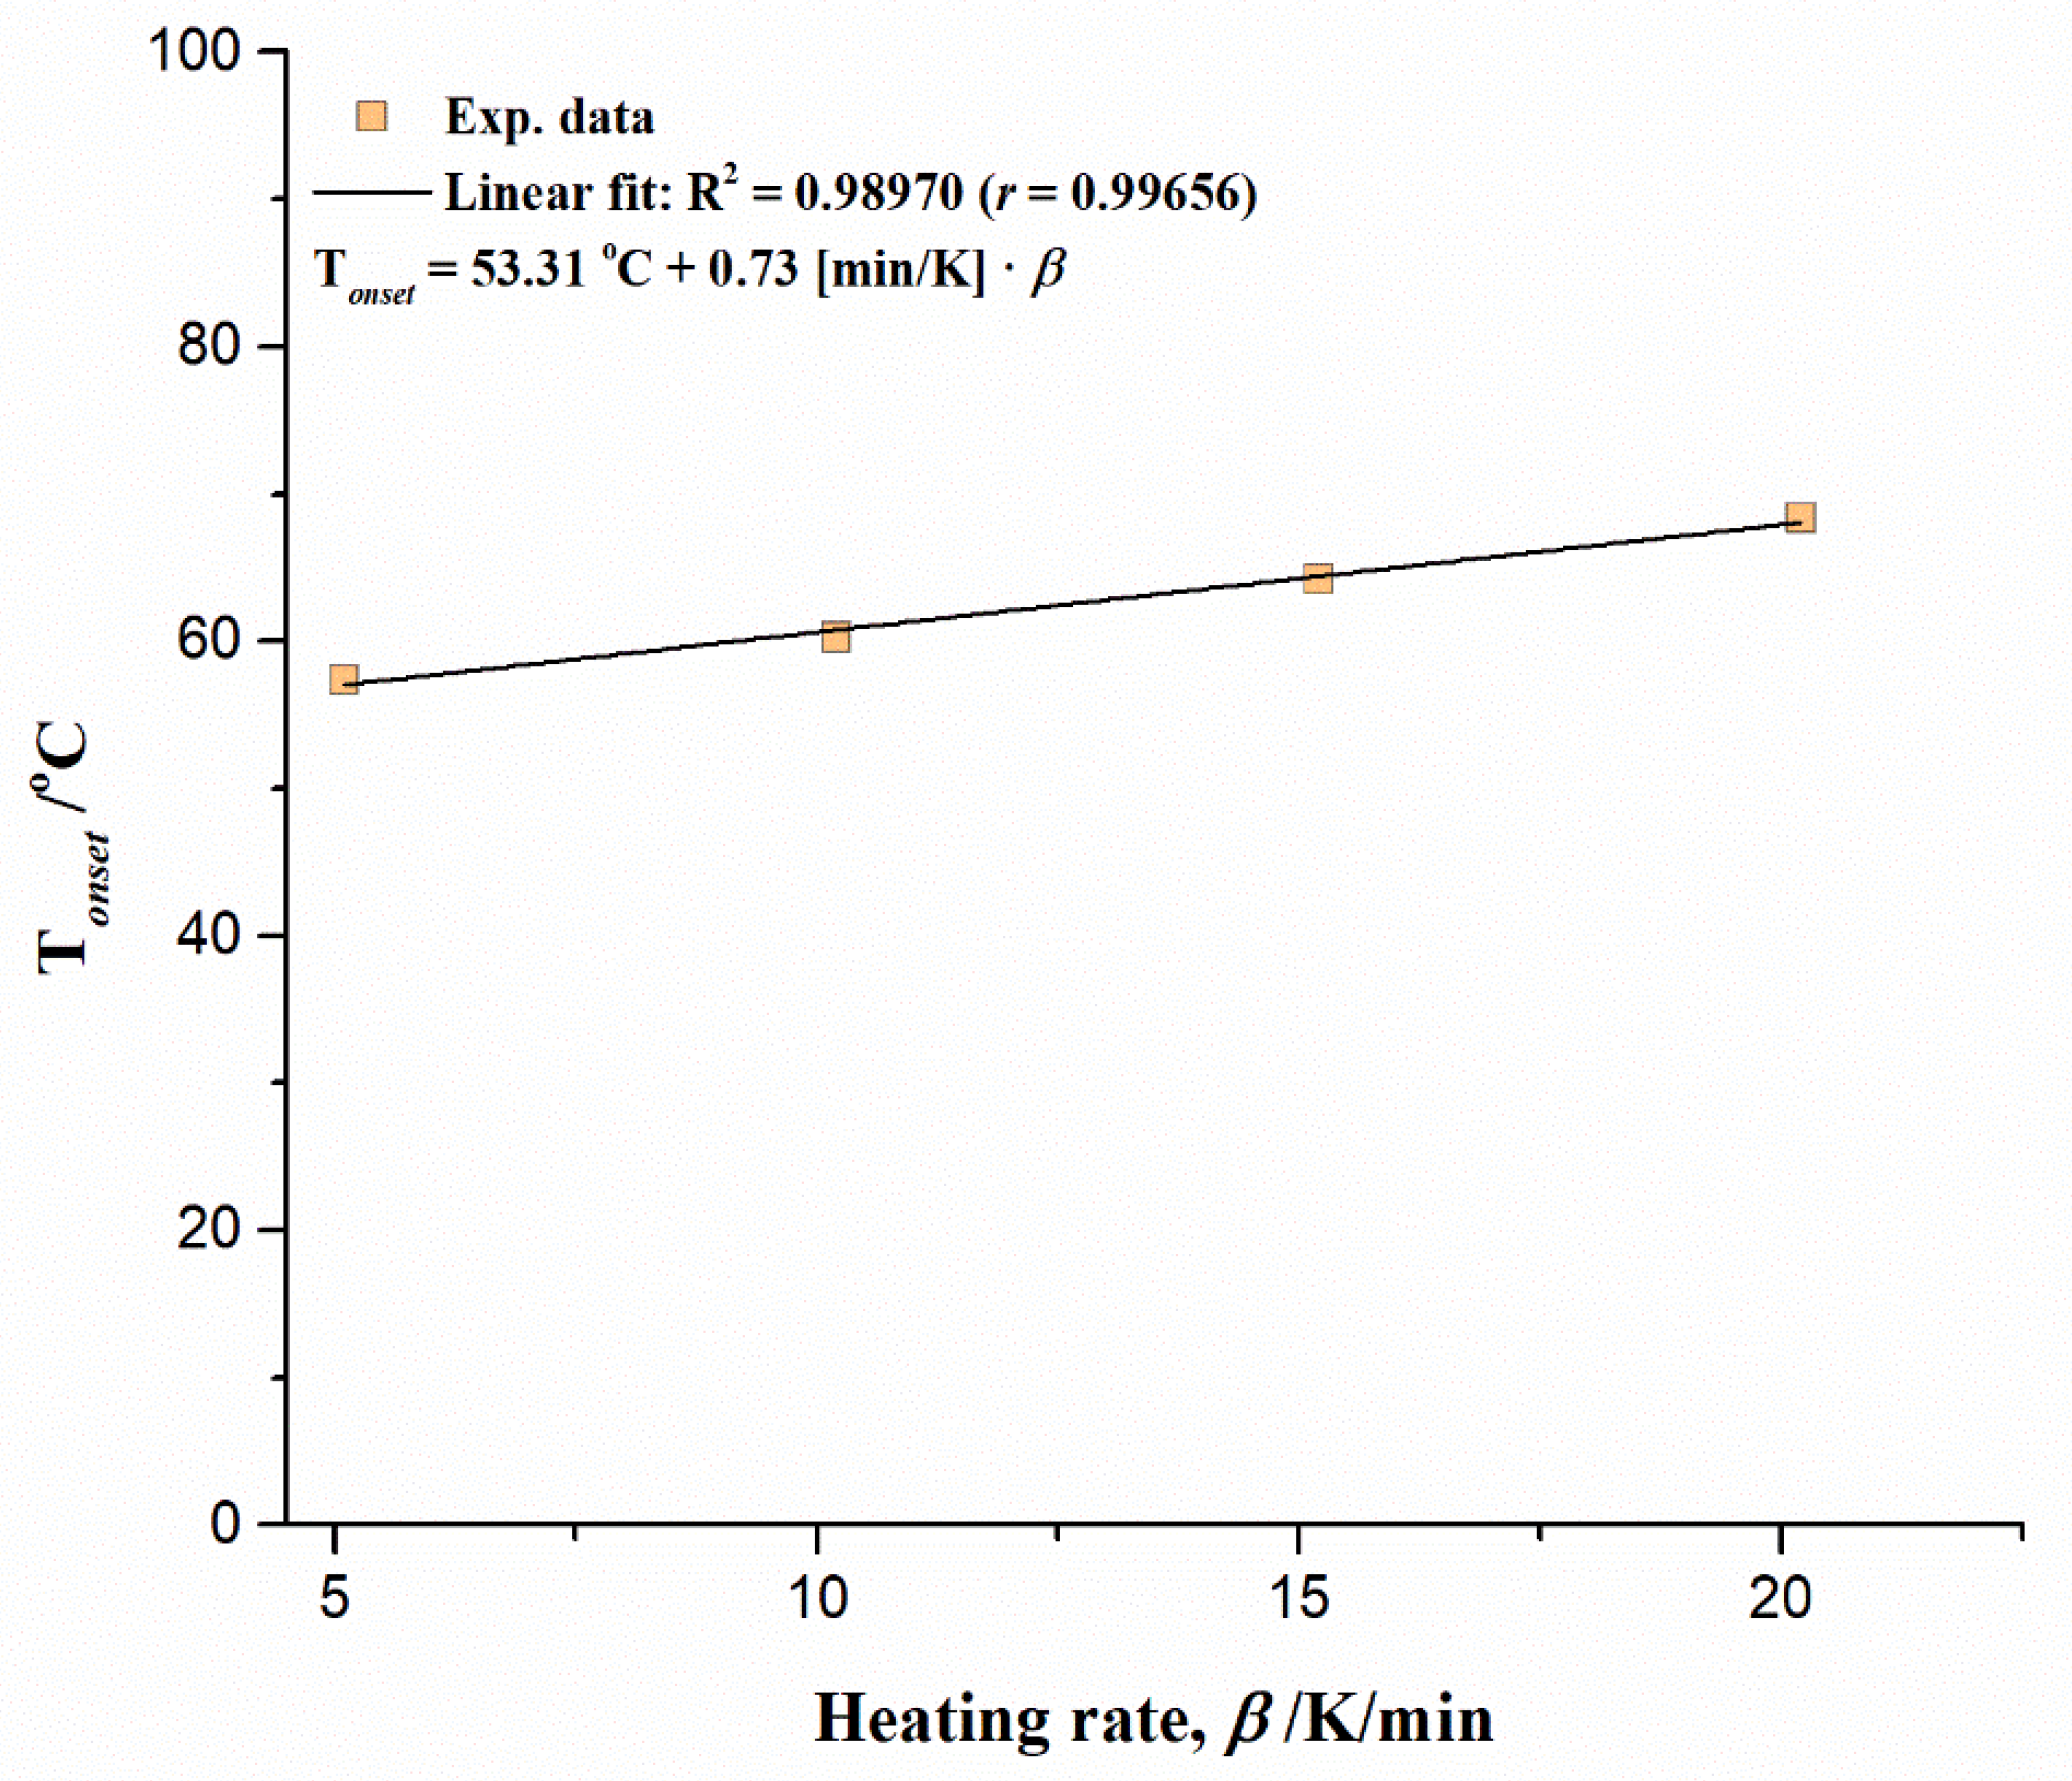
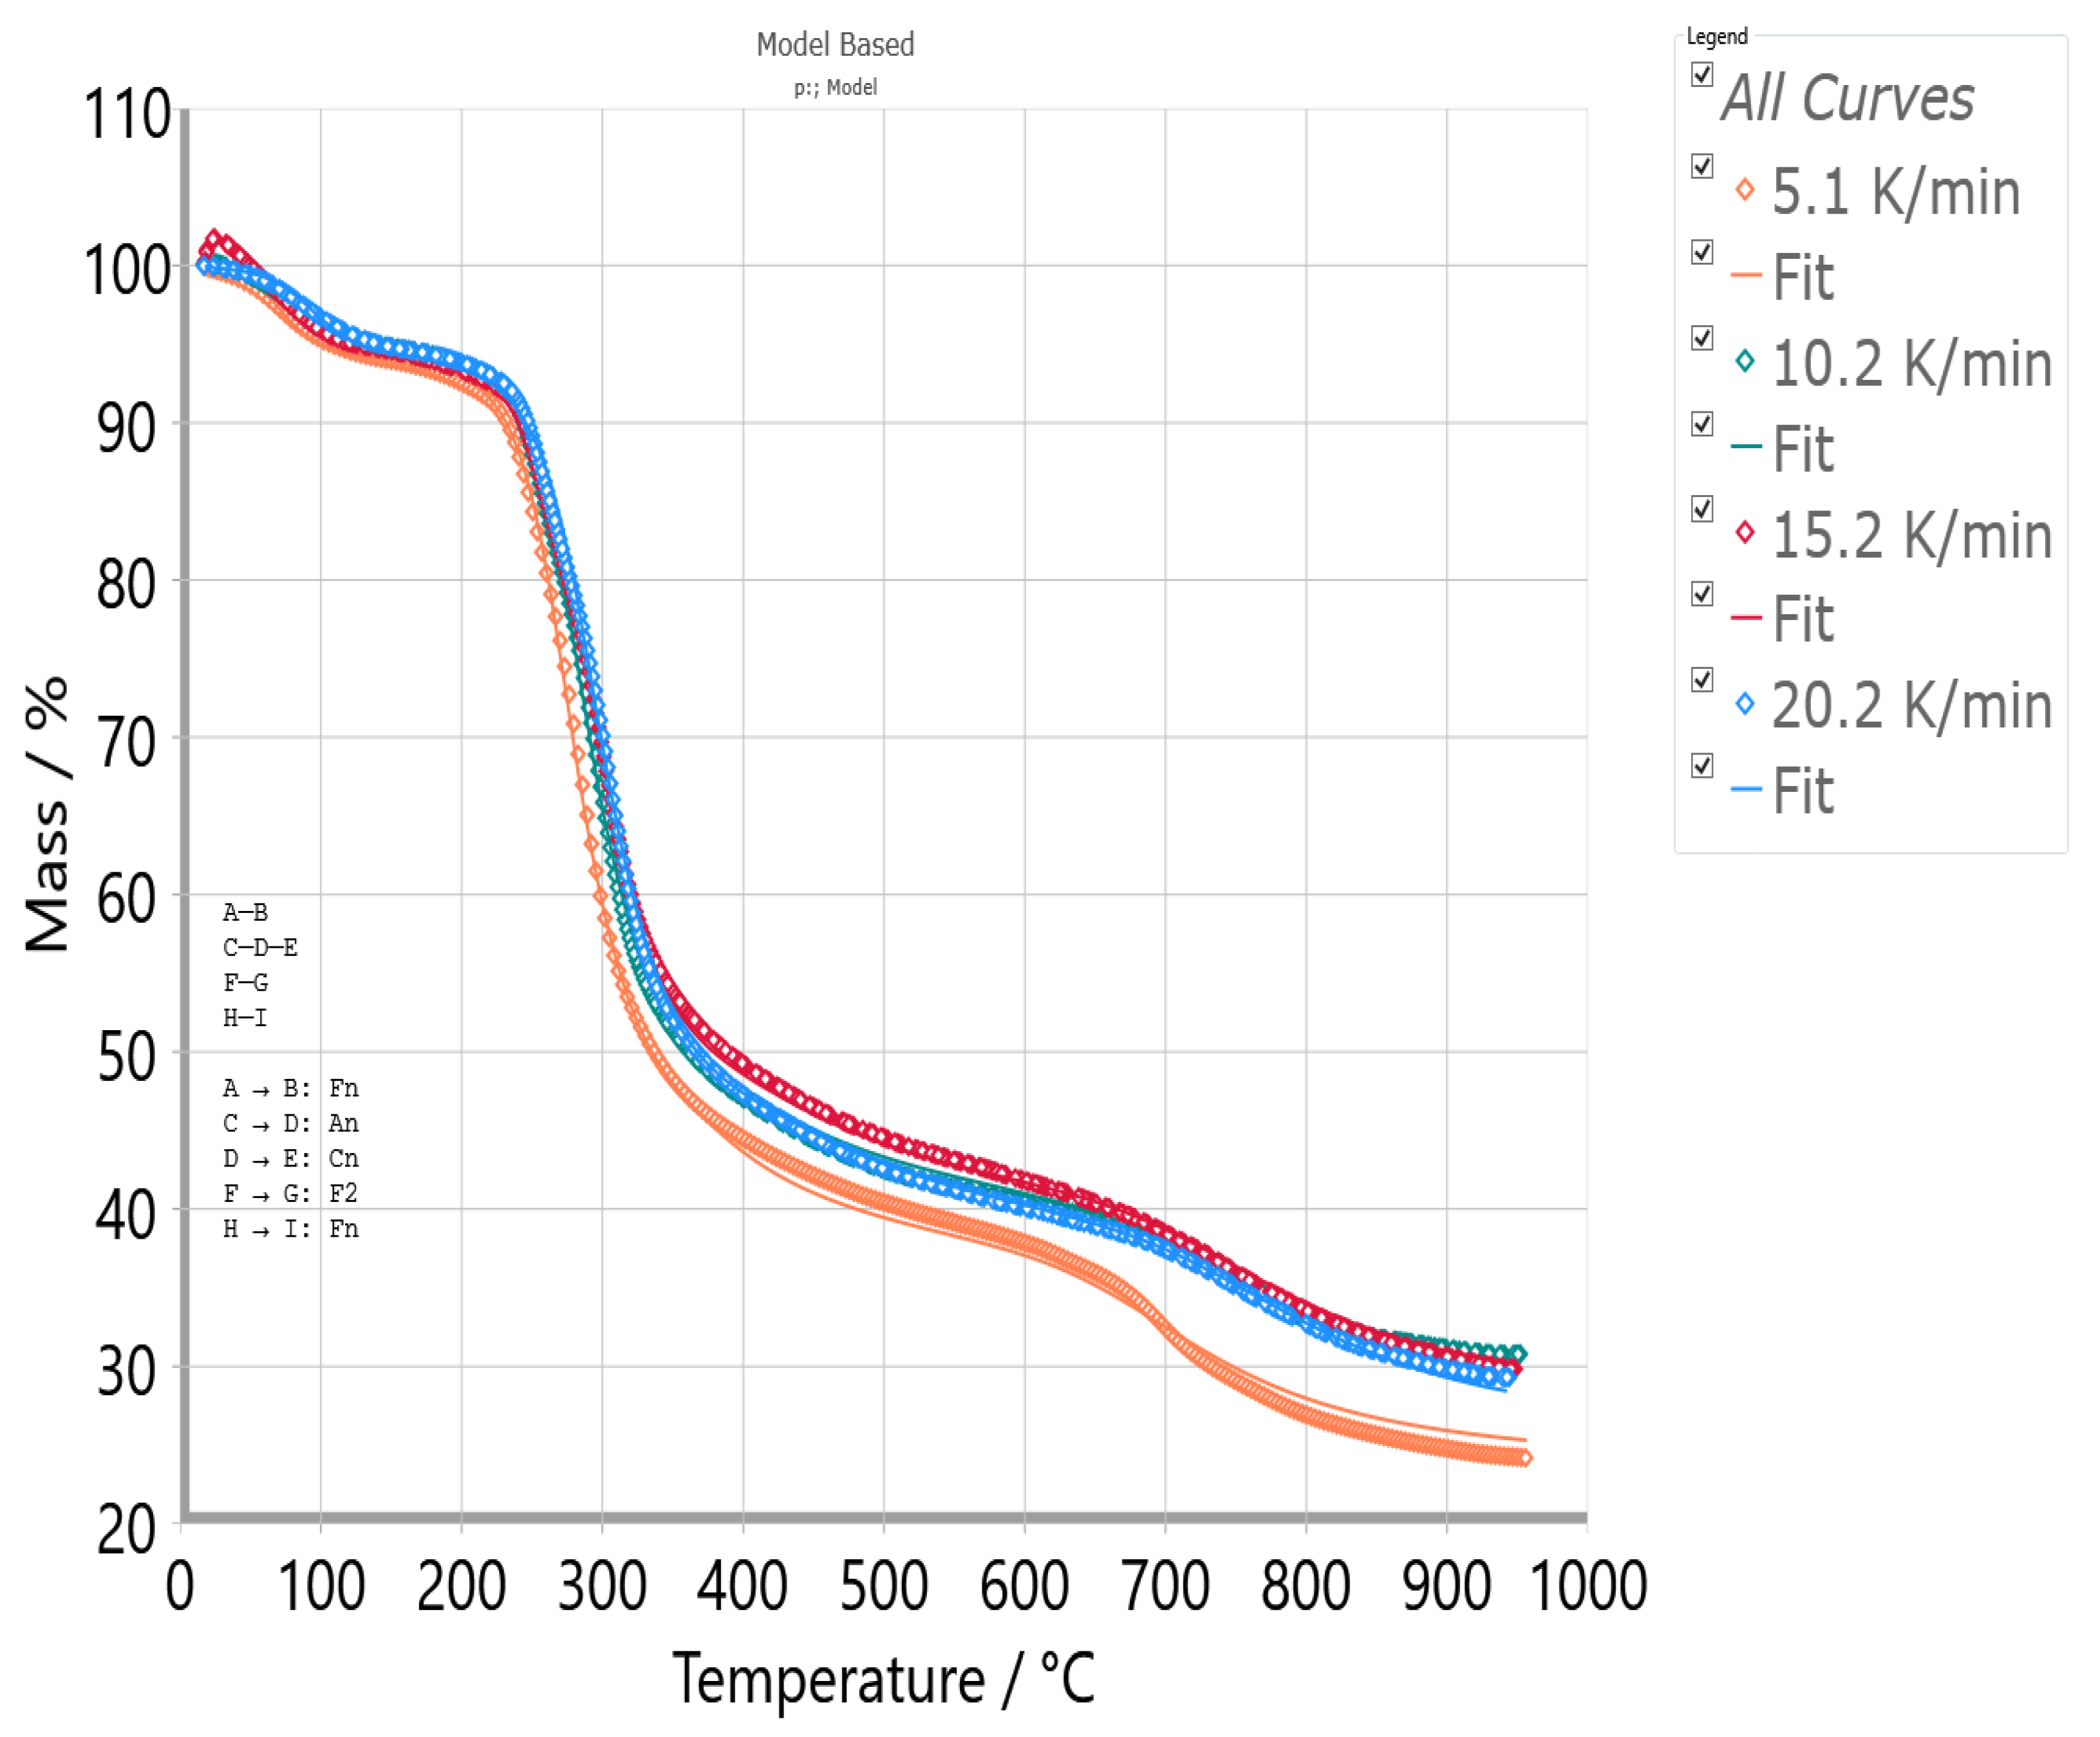
3.4. TG-DTG-DTA Measurements of UF-HC Composite Decomposition
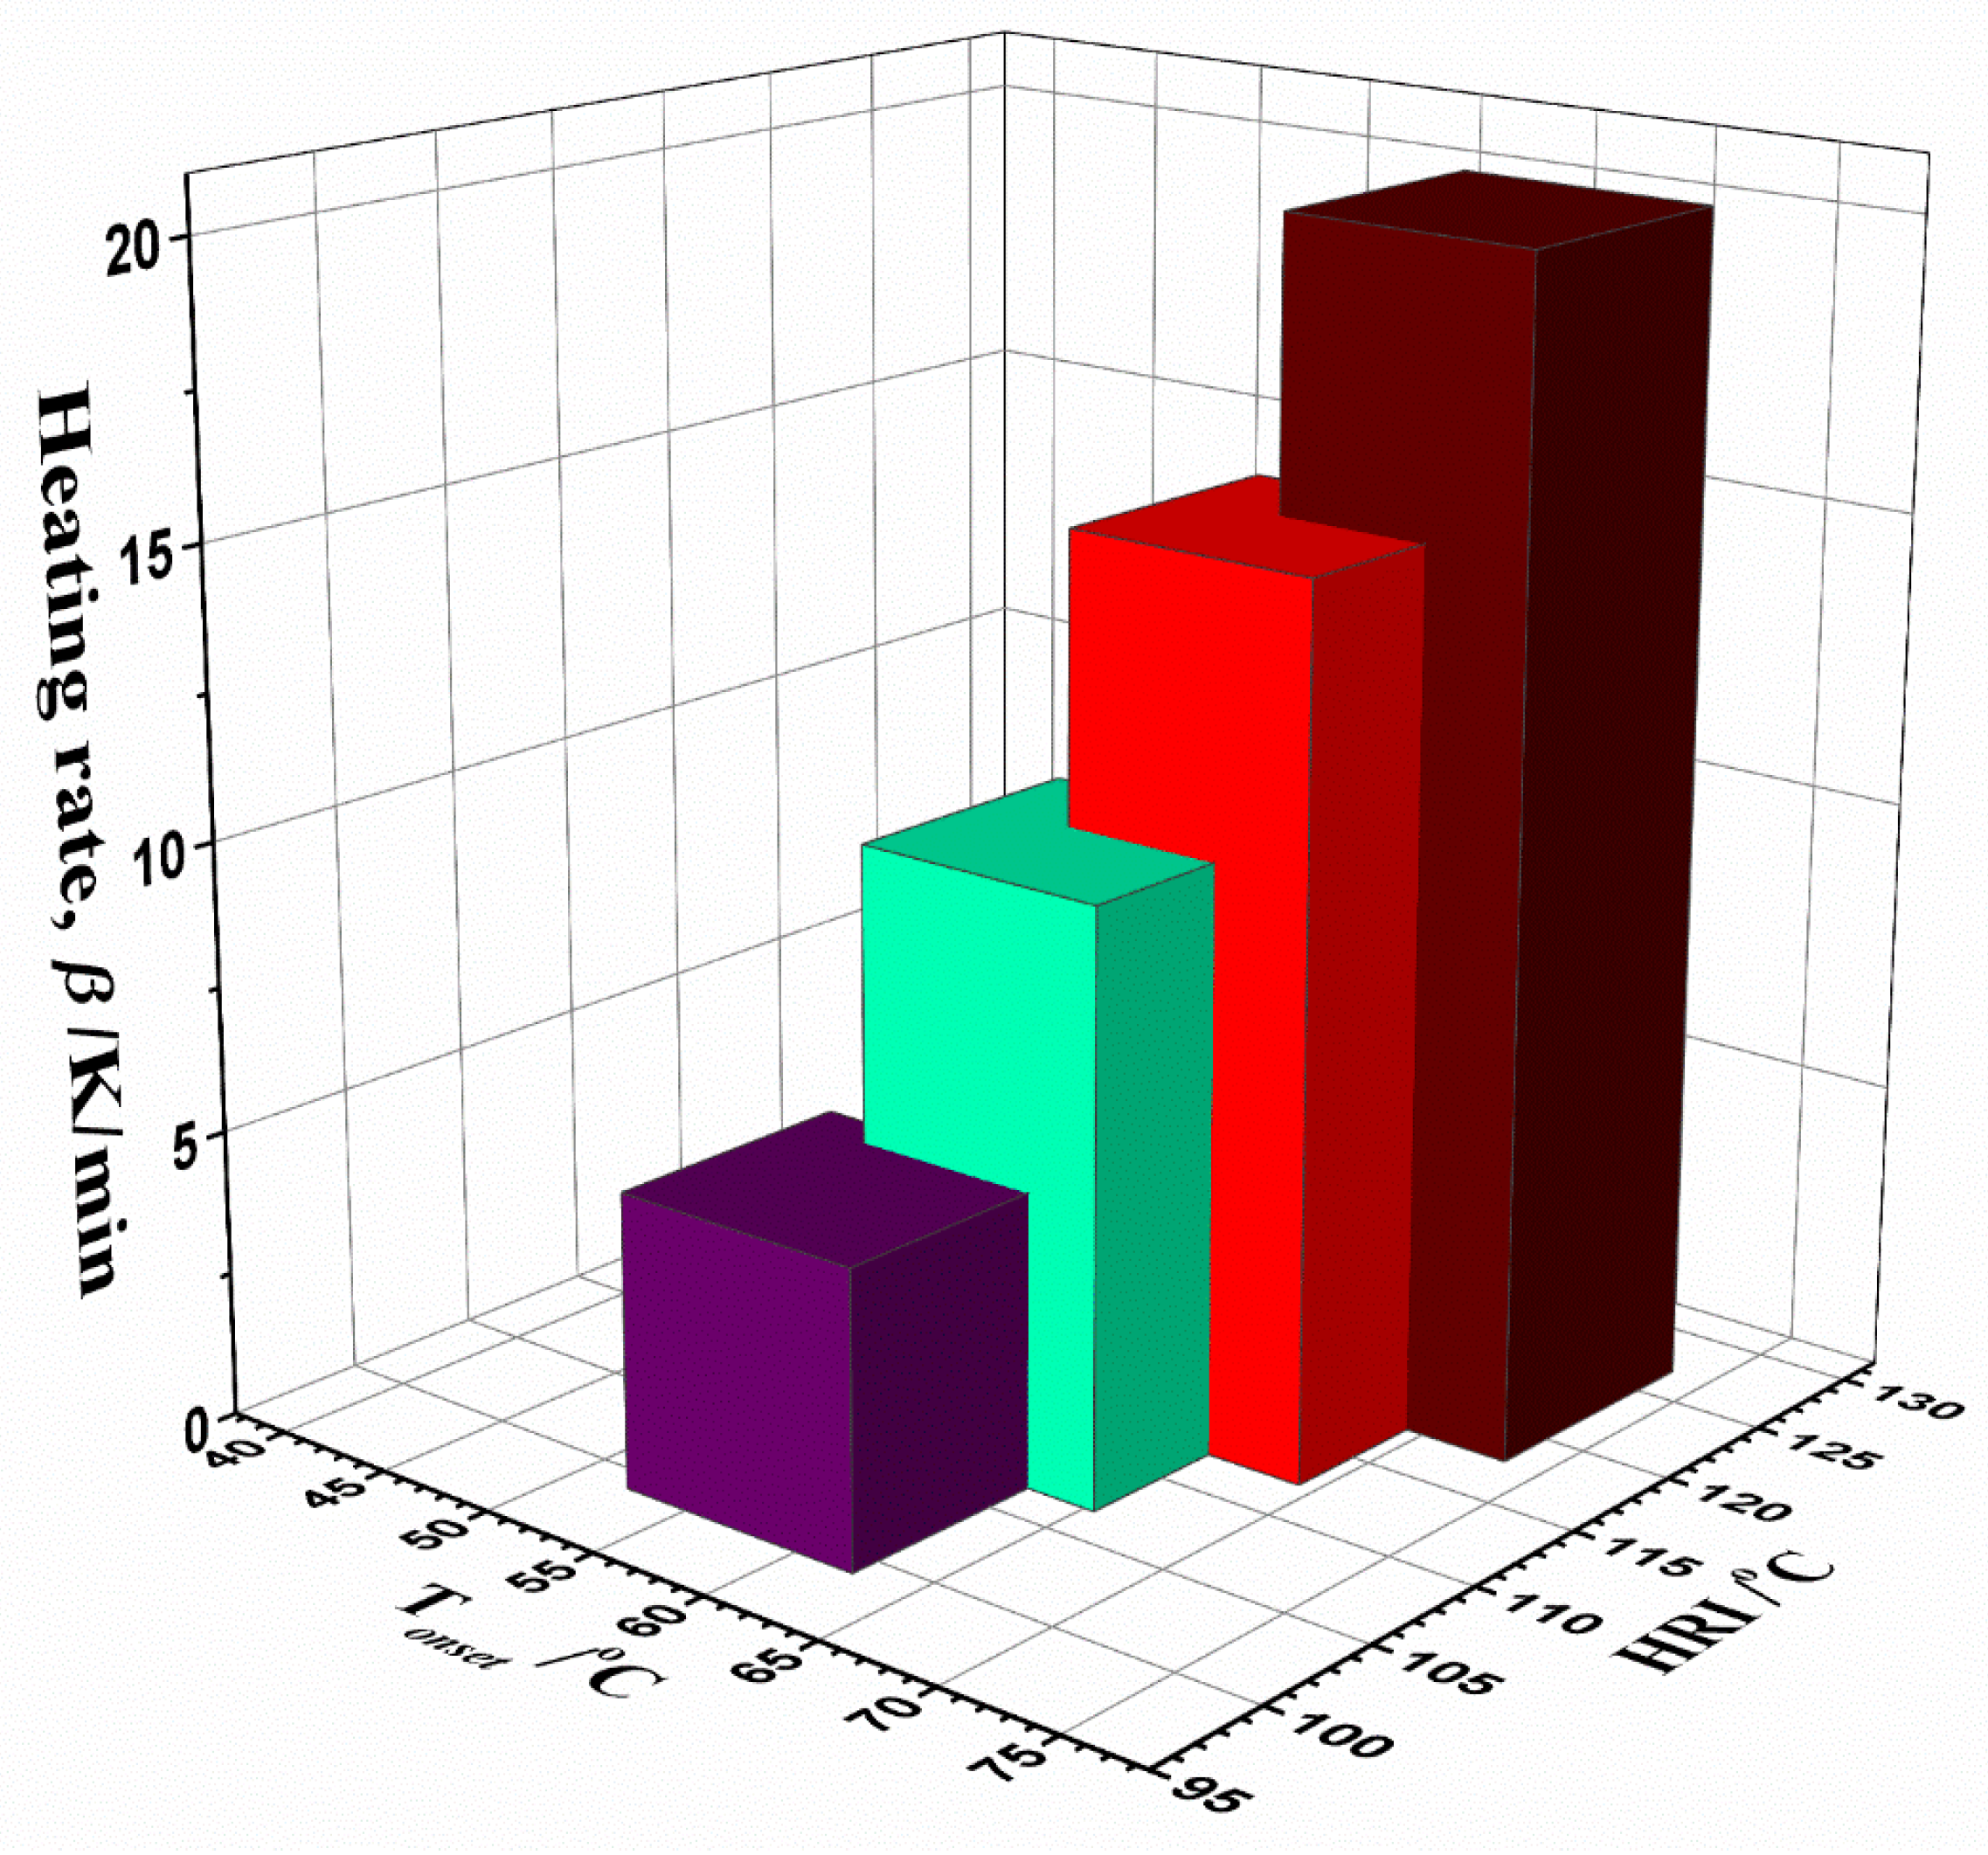
3.5. Inherent Thermal Stability Analysis Estimated from Thermo-Analytical Measurements
3.6. Isoconversional Kinetic Analysis and Mechanistic Predictions of UF-HC Thermal Decomposition
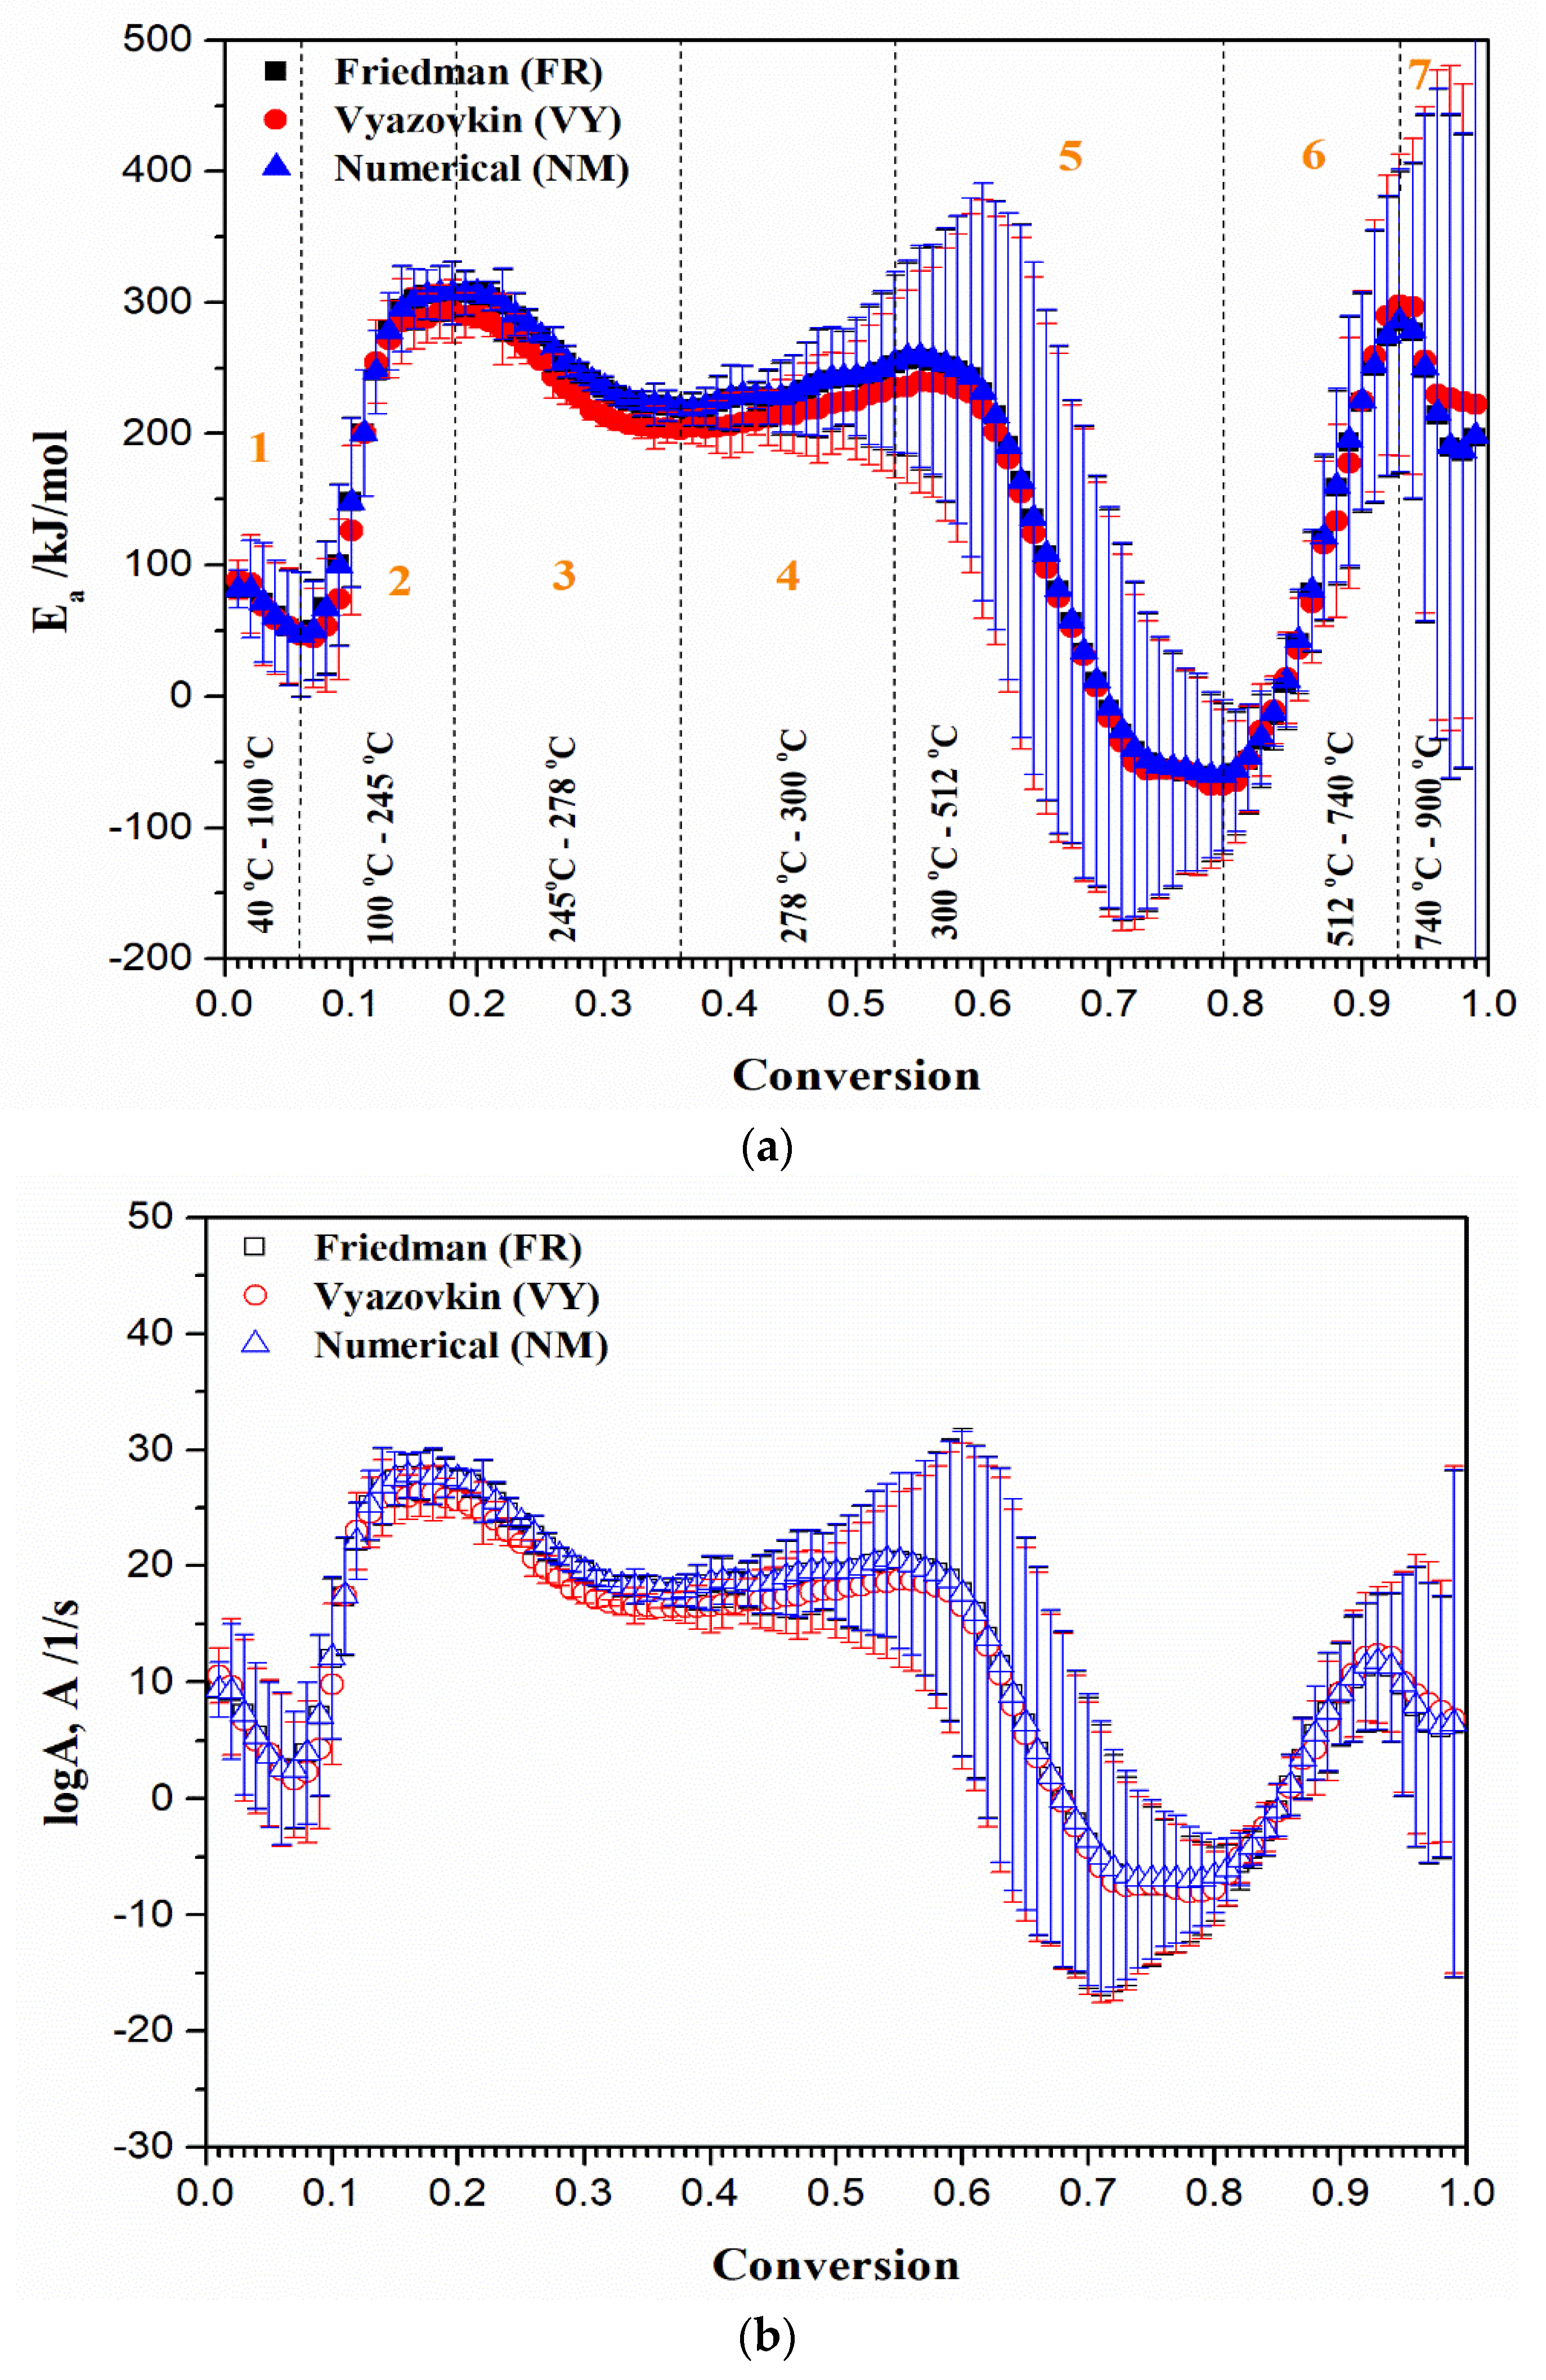
- For the first (1) region (for α = 0.01–0.06 and T = 40–100 °C) (Figure 9a) considering estimated values from the numerical optimization (NM) method): There is decrease in the Ea value, from 81.61 kJ/mol to 46.56 kJ/mol. This reaction zone corresponds predominantly to the initial mass loss of the sample, and can be attributed to the dehydration of resin and/or some weaker interactions present in the current macromolecular structure [57]. The mean effective activation energy value for the actual zone (Ea(mean1)) amounts 65.56 kJ/mol. This is a reasonable value, since dehydration energy covers values between 60 kJ/mol and 100 kJ/mol;
- For the second (2) region (for α = 0.07–0.18 and T = 100 °C–245 °C) (Figure 9a): The reaction zone is characterized by a jump in the value of effective activation energy, from 49.77 kJ/mol to 307.48 kJ/mol. In this part of the decomposition process, the mean effective activation energy value (Ea(mean2)) of 217.28 kJ/mol was obtained. This event can be attributed to the conversion of methyl ether functional groups into methylene functional groups, with the release of free formaldehyde. The Ea value estimated for the current conversion path may be also dependent on the F/U molar ratio, where it was reported that Ea increases with an increasing F/U molar ratio (for F/U molar ratio of 1.25, the Ea value of 287.2 kJ/mol was reported) [100]. Therefore, the obtained values of effective activation energy for the observed conversion path are quite realistic, considering the F/U molar ratio used here;
- For the third (3) and fourth (4) regions (for α = 0.19–0.36 and T = 245–278 °C, and for α = 0.37–0.53 and T = 278–300 °C, respectively) (Figure 9a): The two “joined” regions are characterized firstly by decreasing the value of Ea from 307.78 kJ/mol (α~0.19) to 218.94 kJ/mol (α~0.36/0.37), and then by the gradual increase in the value of Ea, from 220.60 kJ/mol (α~0.37/0.38) to 258.55 kJ/mol (α~0.53/0.54). These regions may include parallel temperature overlapping competitive reactions, in the multi-step complex reaction mechanism of UF-HC thermal decomposition. Namely, considering these reaction zones, the balance between bond breaking and cross-linking events coexists with each other. Within the third (3) region, the cleavage of C–N linkages to produce volatiles containing nitrogen should be expected [101], so that, probably, there are losses of chemical entities related to the reduction in N, O, and H; Further, a gradual increase in the Ea value in the fourth (4) region may include the decomposition of residual lignin (arises from HC bio-filler), which could produce H2, that acts as an oxidizer and hydrogen donor for resin further decomposition. The current reaction zone involves the decomposition of UF resin-releasing products (mostly volatile products emitted during the non-isothermal decomposition of the resin). Considering the actual process reactivity zones, the UF-HC sample has lost the highest percent of its initial mass, including the largest share of volatiles in its further decomposition. The mean effective activation energy value for these zones (Ea(mean3+4)) amounts to 246.92 kJ/mol. This value is in good agreement with the range of Ea values, obtained for UF resin decomposition (150 kJ/mol–300 kJ/mol) [102];
- For the fifth (5) region (for α = 0.54–0.79 and T = 300–512 °C) (Figure 9a): This part of the process is characterized by a drastic drop in the effective activation energy (Ea), which goes from approx. ~256.60 kJ/mol up to the lower values of Ea until ~–60.53 kJ/mol. This Ea area represents the transition from stage III to stage IV (the HC instability region) (Figure 5), in which decomposition of cellulose residues from HC mostly occurs, and also to the continued decomposition of biomass lignin. Namely, this part of the UF-HC thermo-chemical conversion is characterized by a primary charring process, where a fair amount of aromatic compounds is produced. Considering the thermo-analytical profiles of UF-HC decomposition shown in Figure 5, the main reinforcements arise from, firstly, stage IV, and then, and finally, stage V, where they slowly pace. Namely, the contribution of UF is minor, because, as can be seen from the TG curve of the UF-HC sample (Figure 5), the UF resin has lost the majority of its mass at an earlier stage, and here, only the release of volatiles from its further decomposition takes place, in a very slow rate manner. Therefore, chemical reactions which probably occur between UF resin and biomass residual components (primary cellulose-Cell) during the heating of the composite in earlier stages create an a more stable material thermally, at the end of this reaction region (at α ~ 0.79, Figure 9a). In other words, it can be said that the UF resin increases the thermal stability of lignocelluloses components left behind in HC, as it renders a decrease in their mass loss rate at the higher temperatures. However, the appearance of some negative Ea values was observed, as we approach at the end of this part of the process. This phenomenon has both a mathematical and a physical explanation, because the negative value means that by increasing the temperature of the process, the rate constant then decreases (the negative dependence on the temperature), and this behavior represents a non-Arrhenius addiction (it is possible that a reversible reaction exists, which should be justified by two reaction paths, each of which has a positive activation energy, E). Namely, it is possible that a reaction mechanism exists, which is a ‘composite’ of the several elementary reaction steps, which have a negative activation energy. It can be assumed that a rapid pre-equilibrium occurs, which is exothermic in the first reaction step, followed by a second reaction step, which has a low positive activation energy value. In this mechanism, the net temperature dependence of the rate will be negative, i.e., the rate decreases with a decreasing temperature, and that is because the equilibrium constant (Keq) for the first reaction step decreases with an increasing temperature. This can be expected, considering the existence of exothermicity, related to stage IV, shown in Figure 5. However, this also should be linked with thermodynamic feasibility, through the possible occurrence of intermediate species. Namely, the overall decrease in the rate of the process may implicate that a negative Ea exists in the current case, when reduction is caused by the decrease in the intermediate specie, as the process temperature is increased;
- For the sixth (6) region (for α = 0.80–0.93 and T = 512–740 °C) (Figure 9a): The region is characterized by rapid increase in the Ea value, from approx. ~–56.29 kJ/mol up to ~286.23 kJ/mol (at α ~ 0.93). The current reactivity region is strictly connected with the pyrolysis of the carbon framework. The removal of oxygen functional groups probably occurred previously, within the (5) region. The “oxidized” graphite (Figure 3) has a high level of oxygen groups, which requires a lower level of energy for its decomposition, compared to the graphene and graphite. So, higher Ea values are transferred to a high temperature zone (Figure 9a), since graphene demands a greater amount of thermal energy for the breaking of sp2 hybridized carbon atoms, ordered by covalent bonds in the hexagonal carbon framework. On the other hand, graphite, as the most thermodynamically stable carbon material, demands even more thermal energy, due to its strong 3D carbon network, consisting of a large number of graphene stacked layers, held by additional van der Waals forces [103];
- For the seventh (7) region (for α = 0.94–0.98/0.99 and T = 740–900 °C) (Figure 9a): Finally, the last region is characterized by decrease in the Ea value, from approx. ~279.07 kJ/mol, up to ~187.06 kJ/mol. This reactivity region of UF-HC can be attributed to the thermal conversion process, where the majority of carbon atoms are converted from graphitic sp2 to non-graphitic sp3 carbon material. In this ultimate stage, there is a high probability that most of the oxygen functional groups from graphene oxide (GO) have been removed, during the reduction from GO.
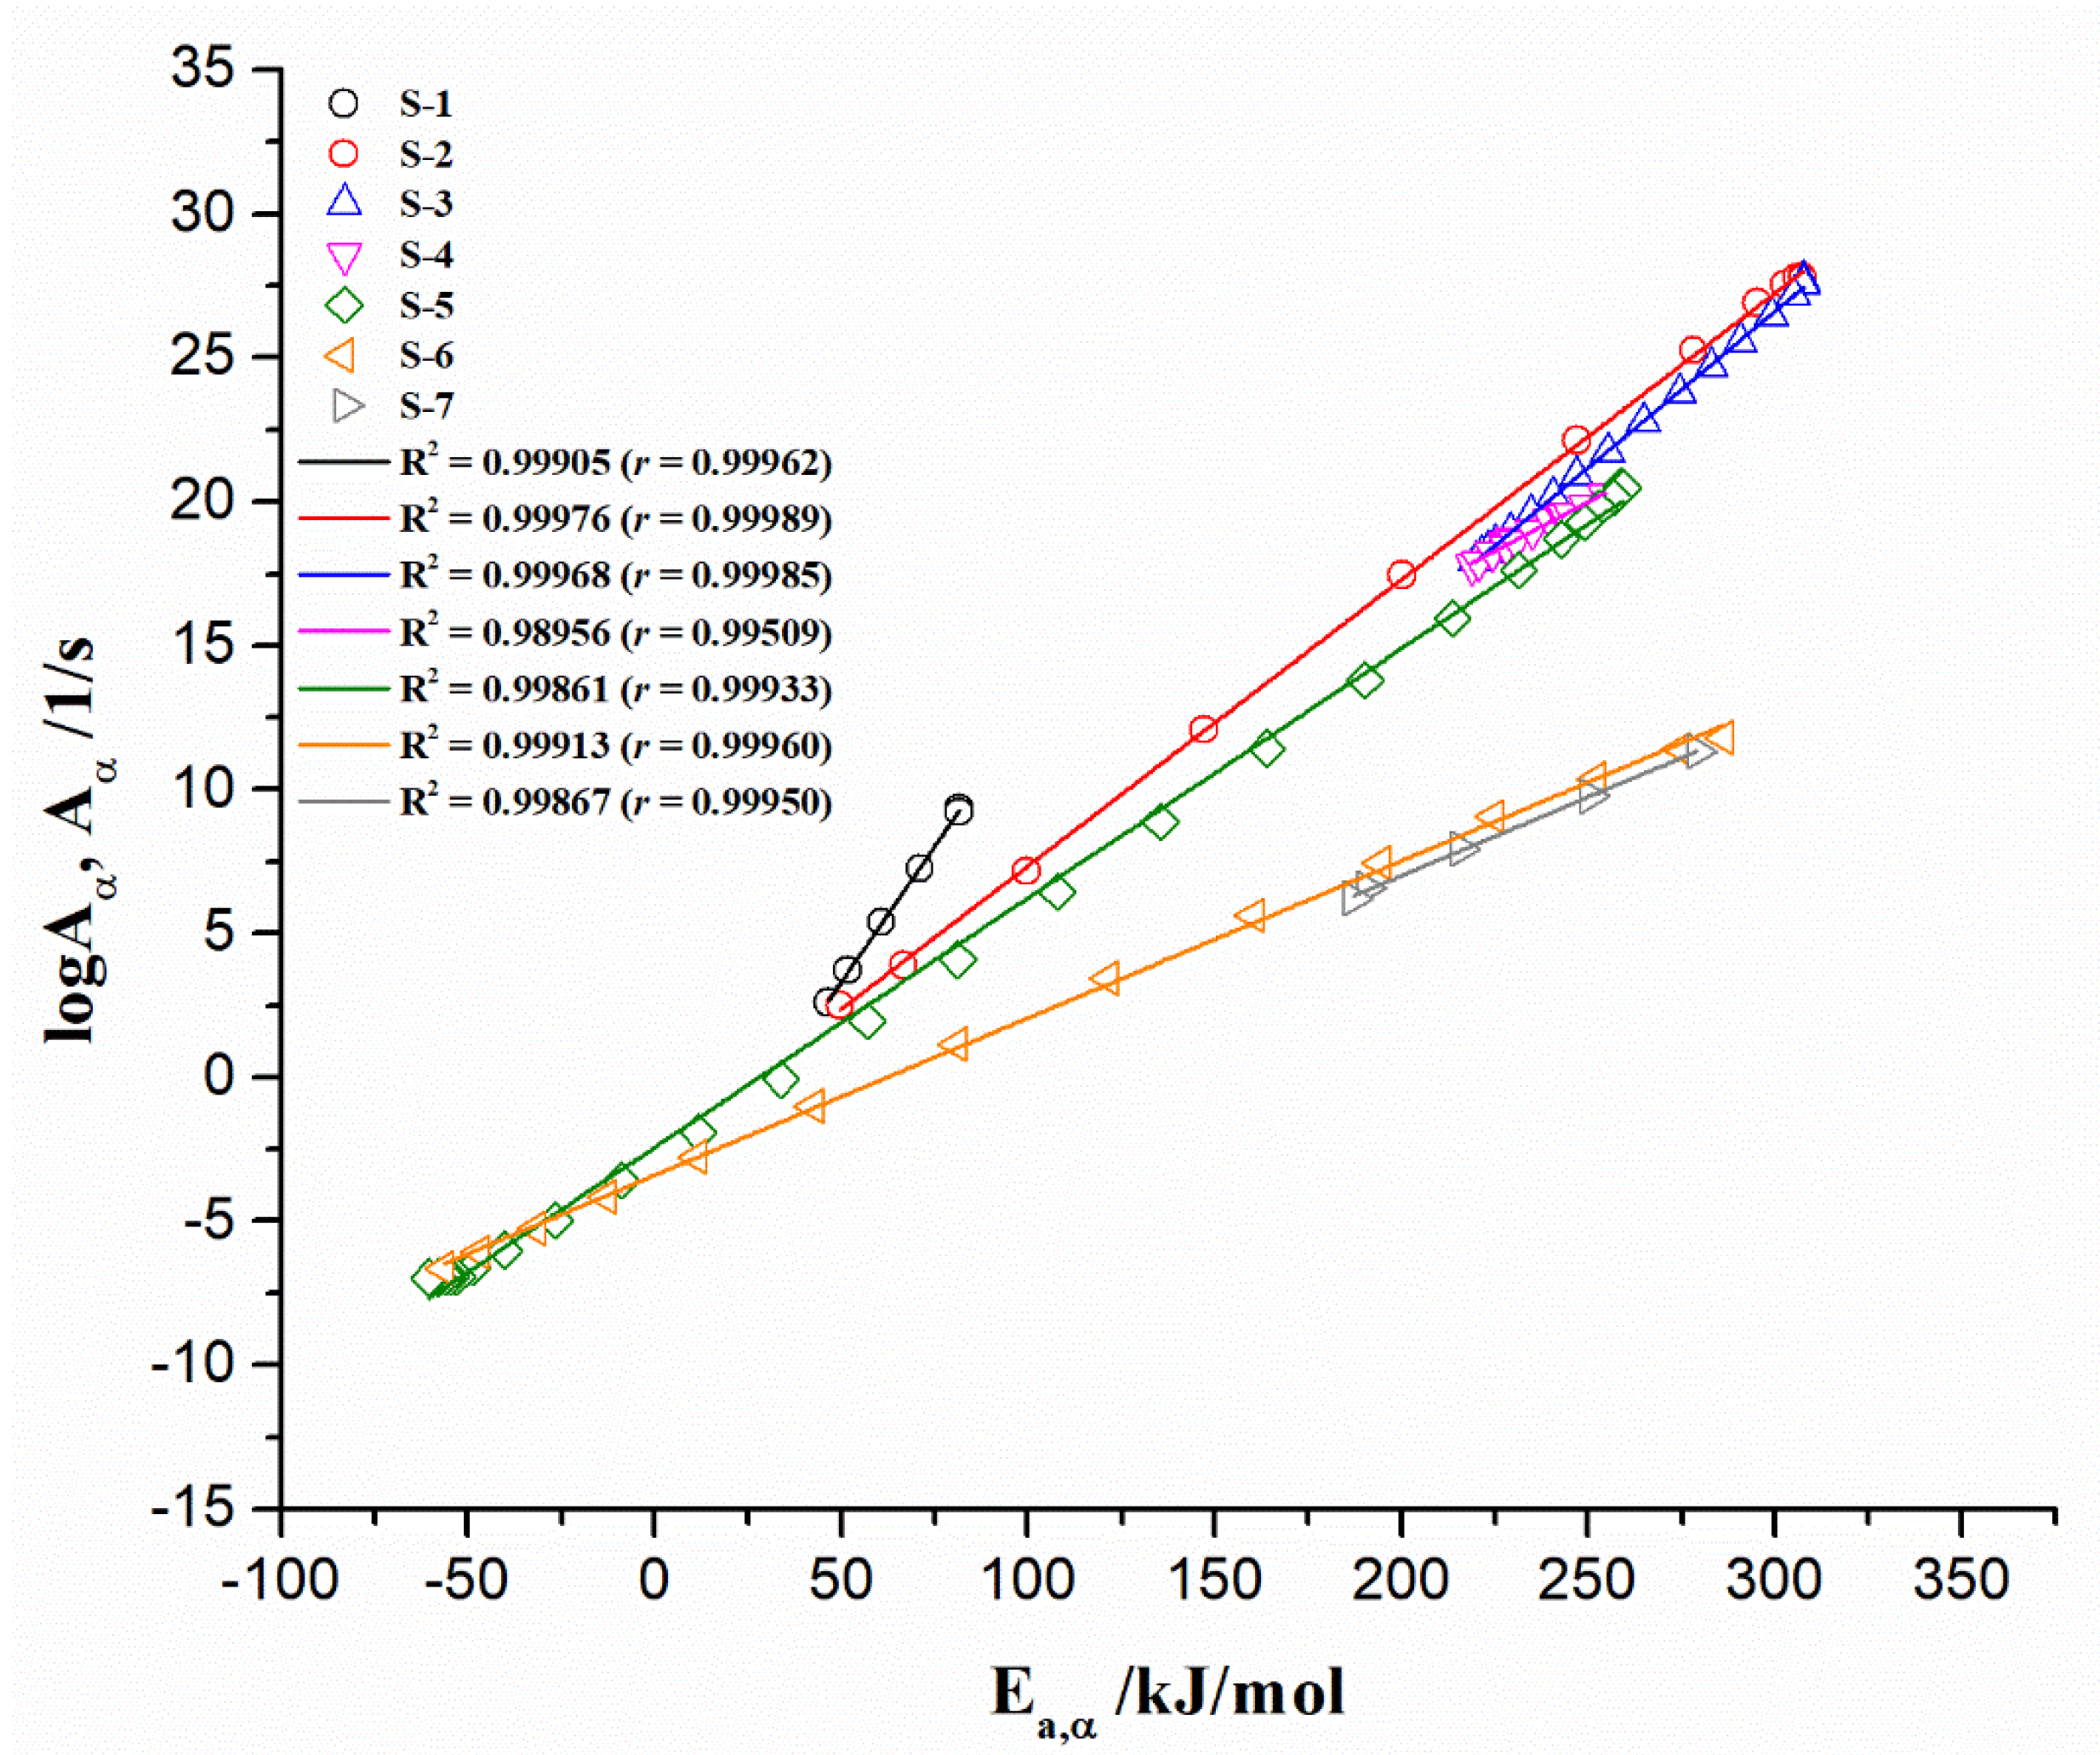
Emergence of Kinetic Compensation Effect (KCE) During UF-HC Decomposition Process and Its Analysis
3.7. Model-Based Kinetic Results—Decrypting Entire Reactions Mechanism for UF-HC Decomposition Process
3.8. Statistical Fit Quality Comparison Between Used Methods/Models, for Kinetic Investigation Related to Decomposition Process of UF-HC
4. Conclusions
- -
- Morphological characterization of the UF-HC by SEM showed enhanced hardness, in-creased the surface roughness, and most possibly enhanced the impact resistance. However, the adhesion strength depends on the applicable F/U ratio;
- -
- Further, the structural analysis by FTIR and XRD techniques showed the presence of crystalline regions of UF resin with an aggregated crystalline region of cellulose type I, which was left behind from the biomass part, after the implementation of hydrothermal carbonization under mild conditions. Also, the presence of impurity inside UF-HC, in the form of crystalline SiO2 (quartz), was also observed. Furthermore, it was confirmed that UF-HC contains lattices with an oxidized face—graphene oxide—GO, confirming the presence of oxygen-containing functional groups;
- -
- TGA-DTA measurements pointed to a highly complicated decomposition reaction profile for UF-HC. It comprises a number of parallel and consecutive reactions, occurring at the long-range of process temperatures. The inherent thermal stability analysis showed a high thermal resistance of UF-HC composite when subjected to thermal stress, which was clearly indicated by the IPDT parameter (the integral procedure decomposition temperature), which raised the value as the heating rate increased, to above 530 °C (with an average value of 545.41 °C). It was established that there is a large impact of heating rate on the thermal resistance of the UF-HC composite;
- -
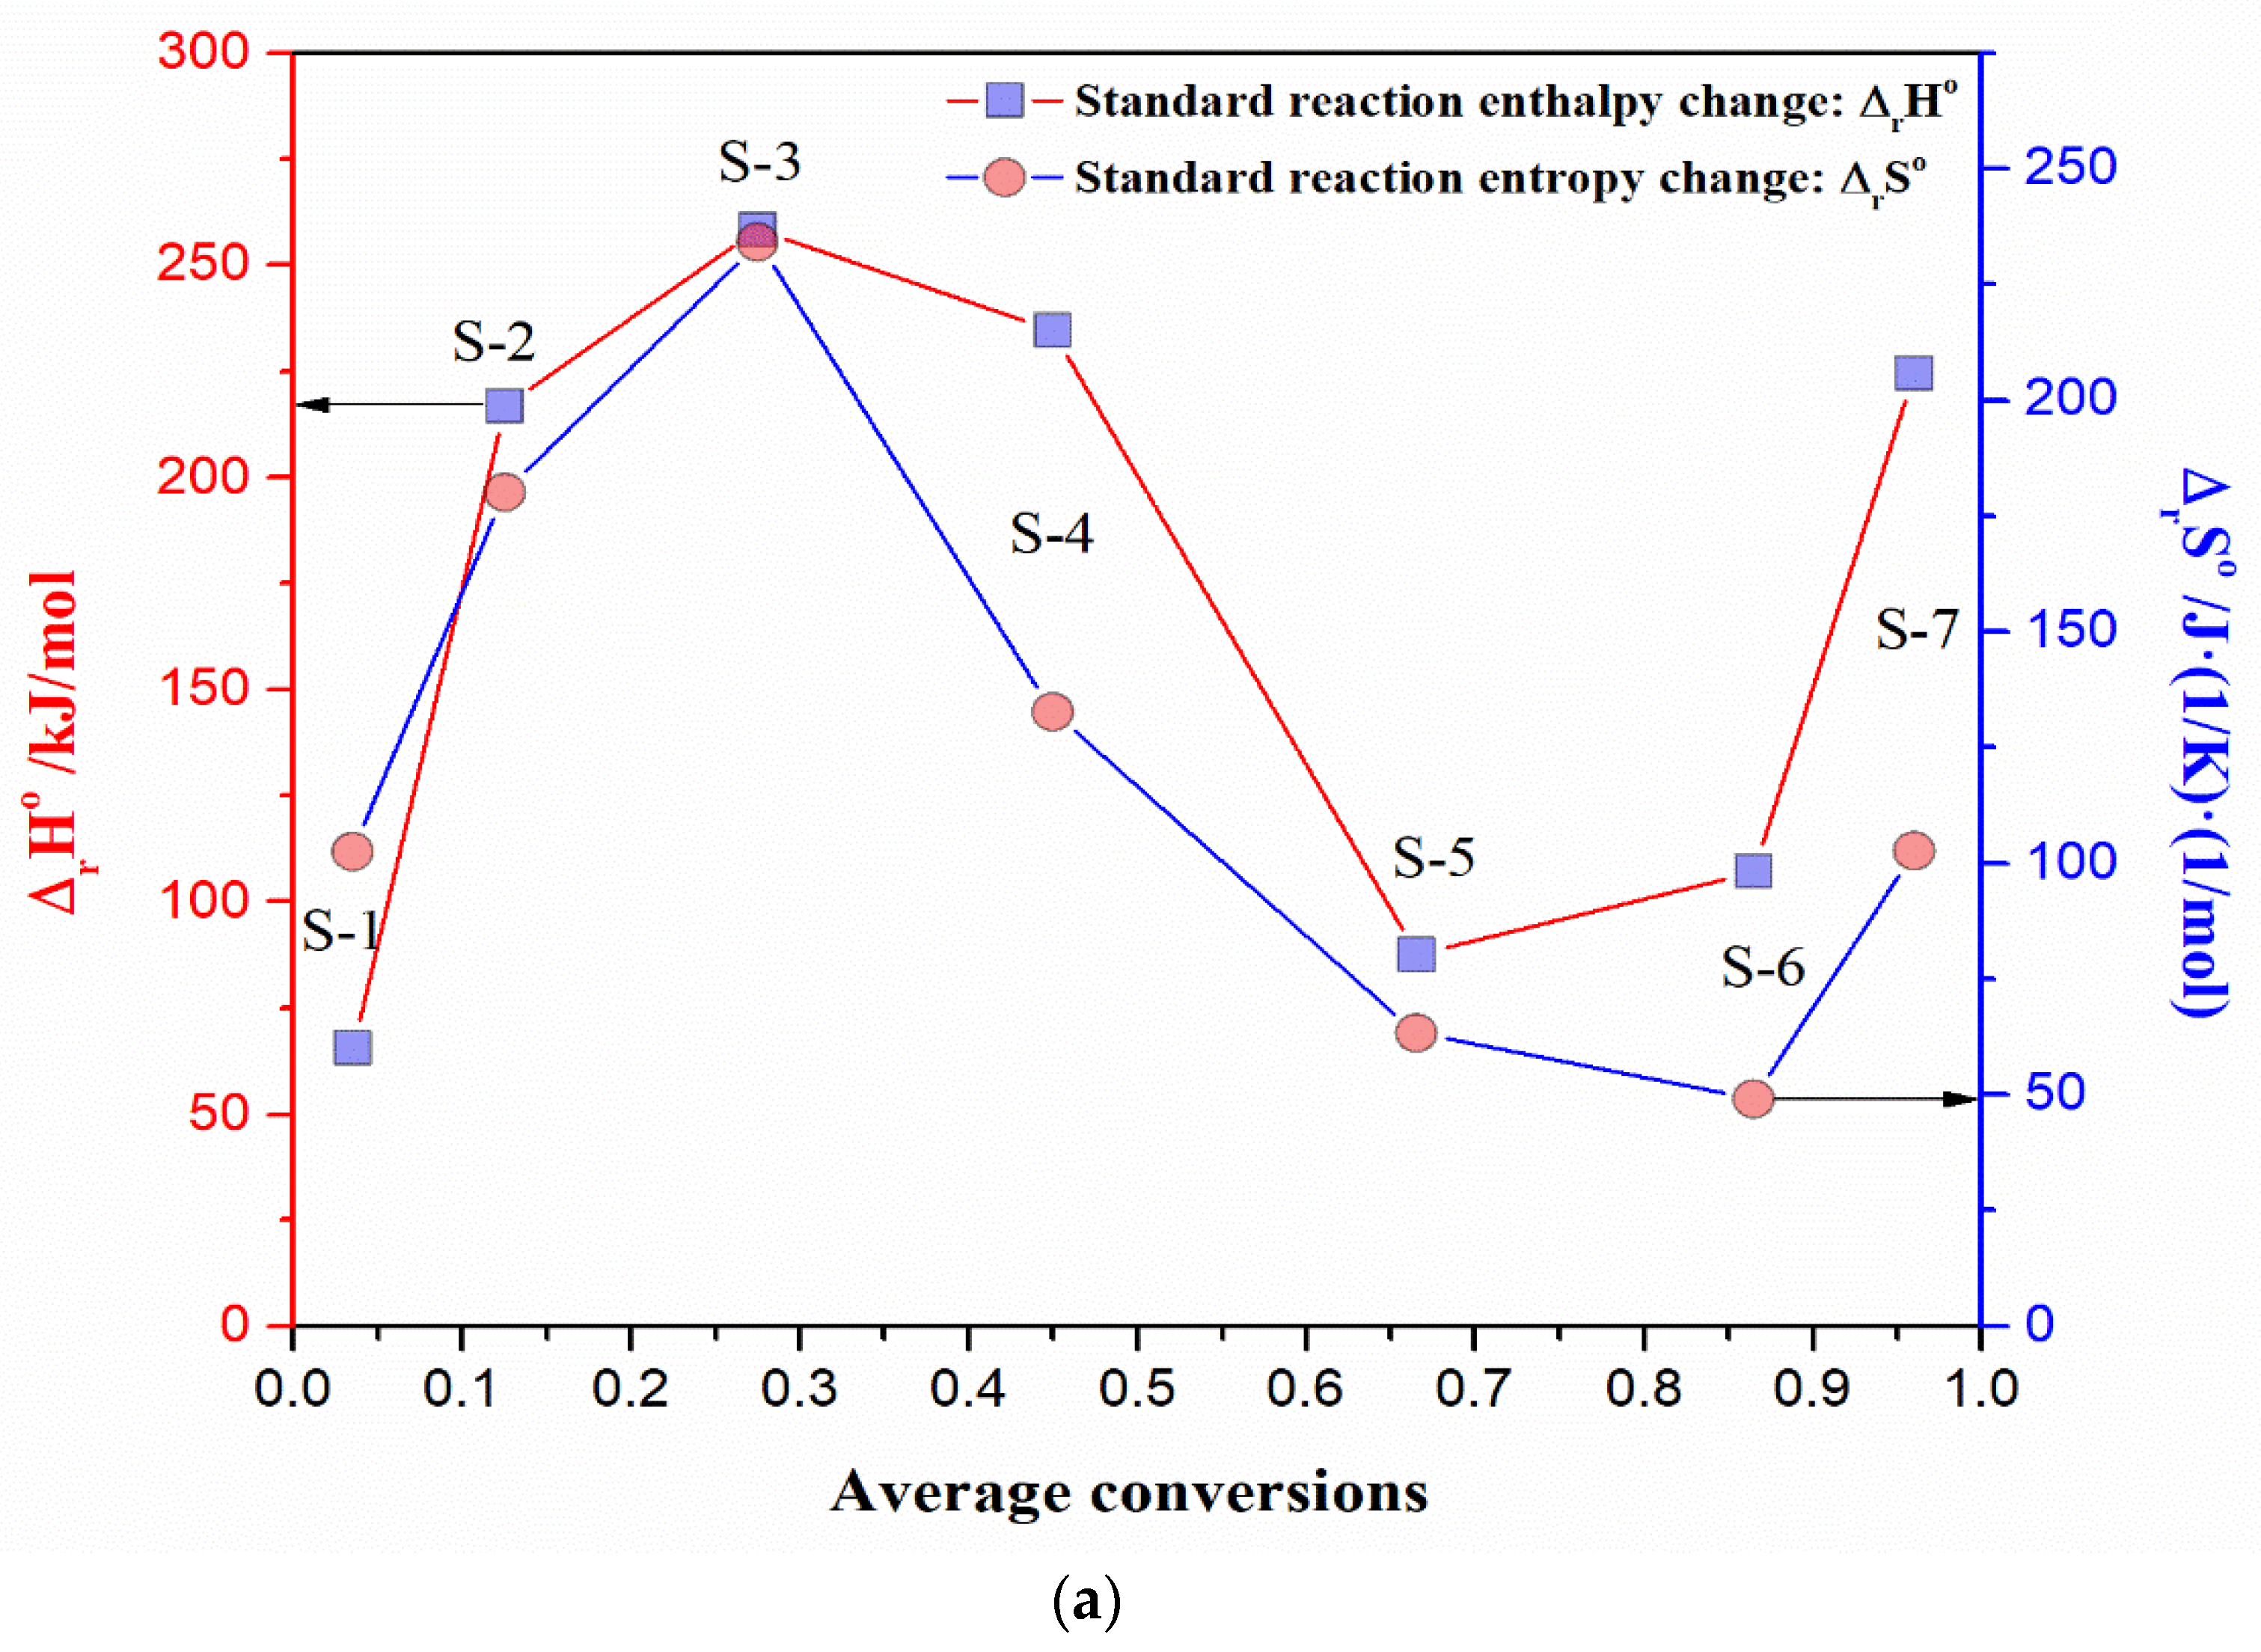
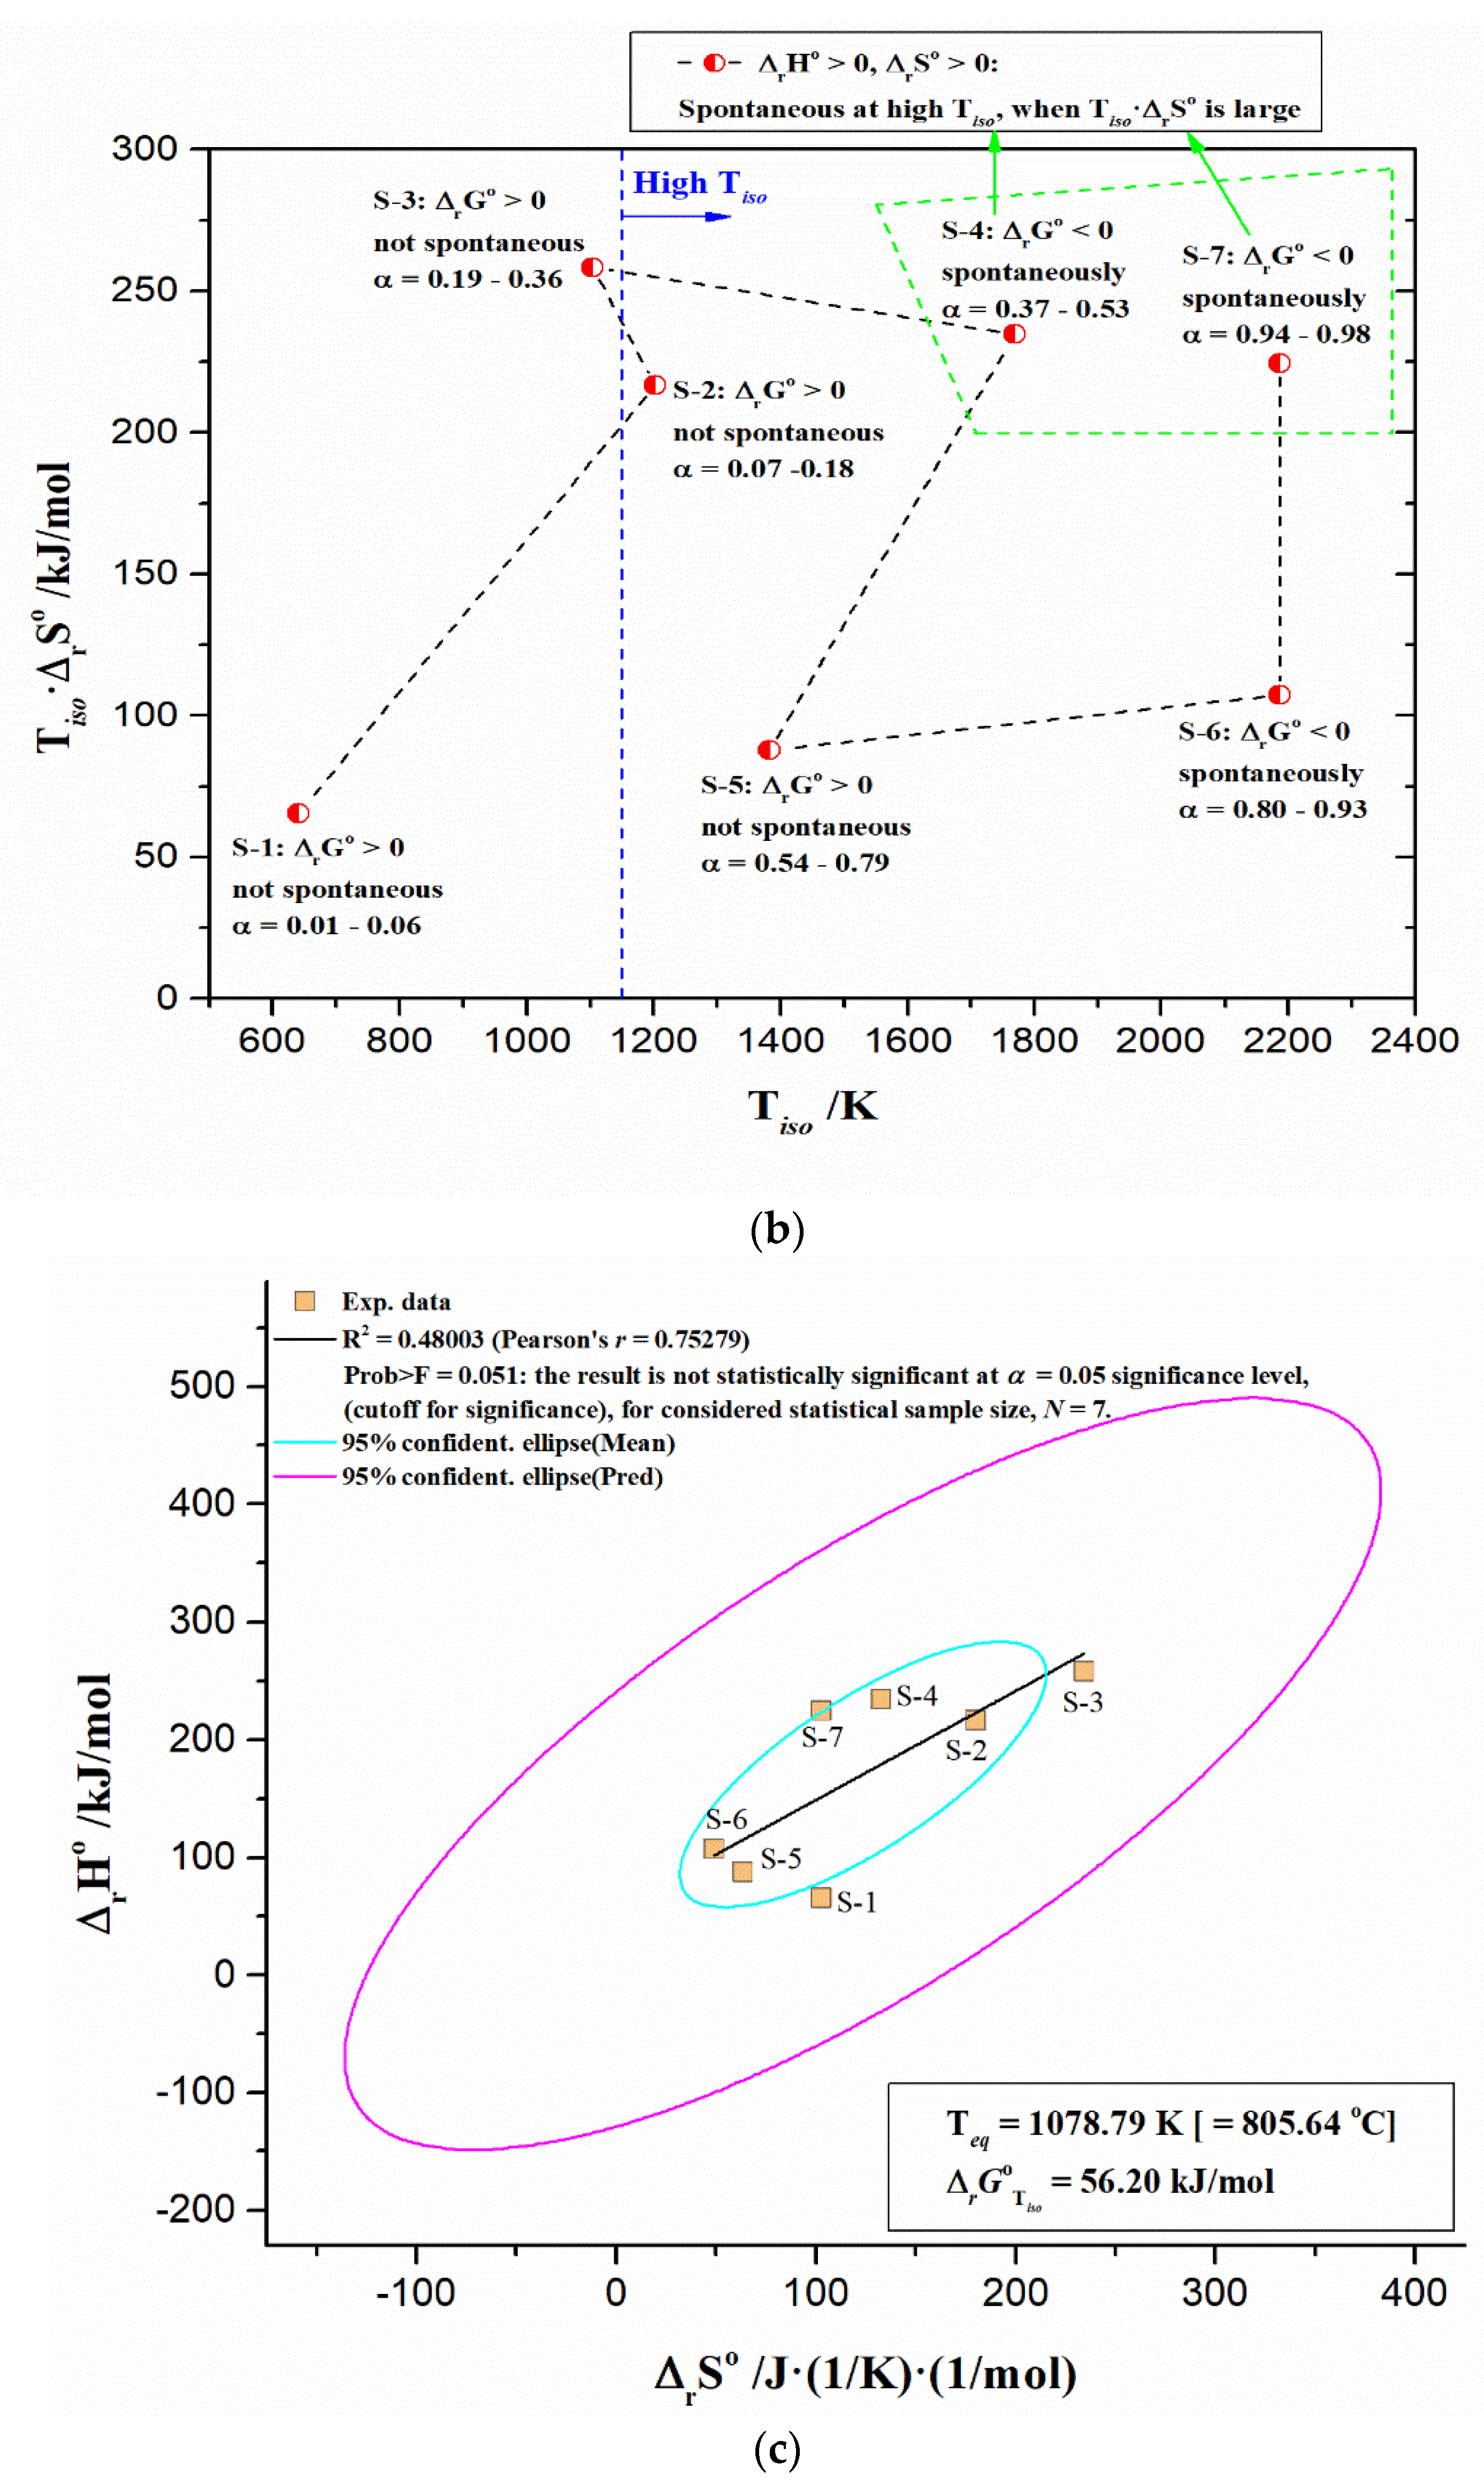
- The existence of a kinetic compensation effect (KCE) was found, but also the absence of thermodynamic (enthalpy-entropy) compensation. KCE appears as an “isentropic” equilibration of the kinetic parameters at isoconversional temperature, Tiso, close to the iso-equilibrium temperature (Teq = 805.64 °C);
- -
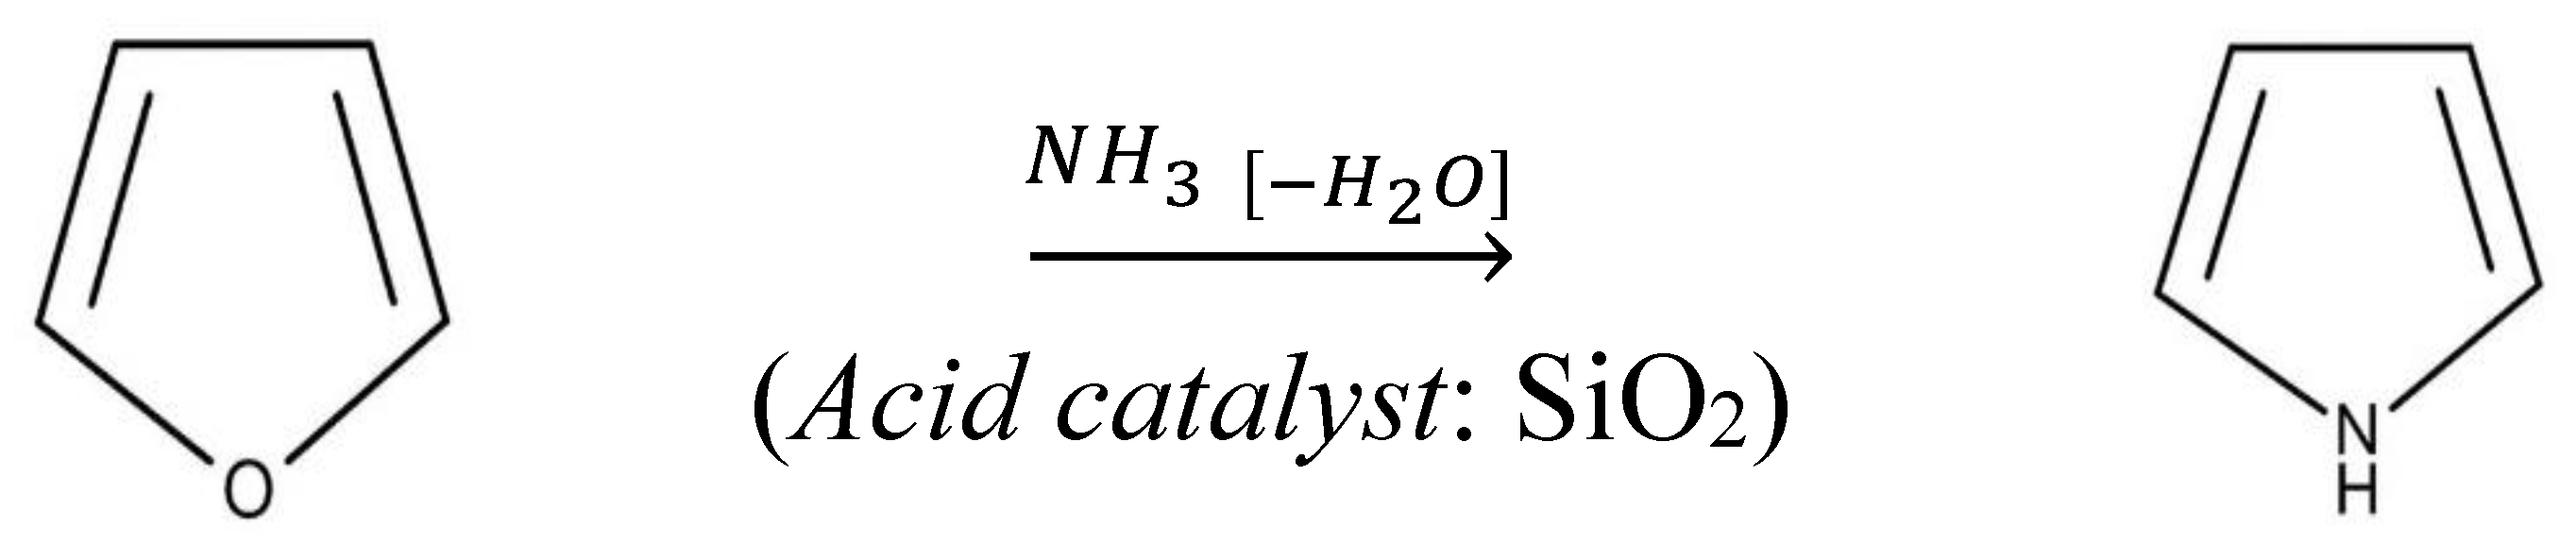
- The non-isothermal decomposition process of UF-HC having complex mechanistic scheme (p:, Model), consisting of three independent single-step reactions and one consecutive reactions step. The three independent single-step reactions are attributed to the following: (a) UF resin dehydration described by F2 model (ΔT = RT − 190 °C; H2O + CH2O releases), (b) cleavage and breaking of methylene ether bridges, with formation of methylolurea hemiformal (HFn), described by Fn model (ΔT = 200–400 °C), and (c) deoxygenation of graphene oxide (GO), which represents a chemically controlled reaction (Fn model) (ΔT = 500–950 °C). The consecutive reactions step consists of the following transformations: first, the direct reaction pathway of furan formation from cellulose, that includes a ring opening step, where glucose monomer (6-membered ring) is converted to a five-membered structure (the formed furan represents an intermediate specie, which becomes the reactant in the next step) (An model: n-dimensional nucleation, ΔT = 200–400 °C), and in the second, the furan reaction with NH3, in the presence of a solid acid catalyst (SiO2) to produce pyrrole (C4H5N), described by the n-th order with an autocatalysis (Cn) (ΔT = 300–500 °C);
- -
- It was found that the heating rate represents a regulatory factor in determining the rate-controlling step. It has been shown that for the consecutive decomposition stage, a high heating rate promotes the production of intermediates—furan (the high yield of furan can be estimated), and the slower generation of pyrrole (the lower pyrrole yield may be predicted). On the other hand, it was found that a low heating rate favors the production of pyrrole, but with a moderate yield. Likewise, in this study, it was shown that lower heating rates are recommended, if higher yields of urea compounds with oligomeric chains are to be obtained;
- -
- The synthesized bio-composite meets the requirements for a green adhesive, as an acceptable eco-friendly adhesive (in terms of reduced formaldehyde emission and ammonia, via the scavenger reaction pathways).
Supplementary Materials
Author Contributions
Funding
Institutional Review Board Statement
Informed Consent Statement
Data Availability Statement
Conflicts of Interest
Abbreviations
| UF | Urea–formaldehyde |
| MF | Melamine–formaldehyde |
| BG | Benzo–guanine |
| U | Urea |
| F | Formaldehyde |
| M | Melamine |
| FE | Formaldehyde emission |
| PLA | Polylactic acid |
| HTC | Hydrothermal carbonization |
| HHV | Higher heating value |
| HC | Hydrochar |
| SMS | Spent mushroom substrate |
| UF-HC | Urea–formaldehyde hydrochar |
| HRI | The heat-resistance index |
| IPDT | The integral procedure decomposition temperature |
| CPI | The comprehensive performance index |
| TGA | Thermogravimetric analysis |
| DTA | Differential thermal analysis |
| FTIR | Fourier transform infrared |
| SEM | Scanning electron microscopy |
| XRD | X-Ray diffraction |
| SMS-HTC | Spent mushroom substrate-hydrothermal carbonization |
| RM | Room temperature |
| ATR | Attenuated total reflectance |
| CrI | Crystallinity index |
| TG | Thermogravimetry |
| DTG | Derivative thermogravimetry |
| Q | Quartz |
| GO | Graphene oxide |
| Cell | Cellulose |
| MVarNLRM | The multivariate non-linear regression method |
| KCE | The kinetic compensation effect |
| IKP | The isokinetic point |
| UFC | Urea–formaldehyde cellulose |
| PU | Polyurethane |
| PU/HBNPSi | Polyurethane/hyper-branched nitrogen–phosphorous–silicon |
| HFn | Methylolurea hemiformal |
| FR | Friedman |
| VY | Vyazovkin |
| NM | Numerical optimization |
References
- Williams, L.L. Amino Resins and Plastics. In Kirk-Othmer Encyclopedia of Chemical Technology, 5th ed.; John Wiley and Sons: New York, NY, USA, 2000; Volume 2, pp. 340–371. [Google Scholar] [CrossRef]
- Dunky, M. Urea-formaldehyde (UF) adhesive resins for wood. Int. J. Adh. Adhes. 1998, 18, 95–107. [Google Scholar] [CrossRef]
- Gonçalves, M.; Paiva, N.T.; Ferra, J.M.; Martins, J.; Magalhães, F.D.; Carvalho, L. Chemical composition of melamine-urea-formaldehyde (MUF) resins assessed by near-infrared (NIR) spectroscopy. Int. J. Adh. Adhes. 2019, 93, 102327. [Google Scholar] [CrossRef]
- No, B.Y.; Kim, M.G. Syntheses and properties of low-level melamine-modified urea-melamine-formaldehyde resins. J. Appl. Polym. Sci. 2004, 93, 2559–2569. [Google Scholar] [CrossRef]
- Nuryawan, A.; Risnasari, I.; Sucipto, T.; Iswanto, A.H.; Dewi, R.R. Urea-formaldehyde resins: Production, application, and testing. IOP Conf. Ser. Mater. Sci. Eng. 2017, 223, 012053. [Google Scholar] [CrossRef]
- Ristić, M.; Samaržija-Jovanović, S.; Jovanović, V.; Kostić, M.; Jovanović, T.; Marković, G.; Kojić, M.; Vujčić, I.; Marinović-Cincović, M. The comparative study of biocomposites based on hydrochar and chitosan-modified urea-formaldehyde resins. J. Vinyl Addit. Technol. 2023, 29, 1070–1081. [Google Scholar] [CrossRef]
- Samaržija-Jovanović, S.; Jovanović, V.; Jovanović, T.; Petković, B.; Marković, G.; Porobić, S.; Marinović-Cincović, M. Synthesis, characterization, hydrolytic, and thermal stability of urea-formaldehyde composites based on modified montmorillonite K10. J. Therm. Anal. Calorim. 2022, 147, 9417–9429. [Google Scholar] [CrossRef]
- Que, Z.; Furuno, T.; Katoh, S.; Nishino, Y. Effects of urea-formaldehyde resin mole ratio on the properties of particleboard. Build. Environ. 2007, 42, 1257–1263. [Google Scholar] [CrossRef]
- Park, B.-D.; Kang, E.C.; Park, J.Y. Effects of formaldehyde to urea mole ratio on thermal curing behavior of urea-formaldehyde resin and properties of particleboard. J. Appl. Polym. Sci. 2006, 101, 1787–1792. [Google Scholar] [CrossRef]
- Delviawan, A.; Suzuki, S.; Kojima, Y.; Kobori, H. The influence of filler characteristics on the physical and mechanical properties of wood plastic composite(s). Rev. Agric. Sci. 2019, 7, 1–9. [Google Scholar] [CrossRef]
- Yasim-Anuarae, T.A.T.; Yee-Foong, L.N.; Lawal, A.A.; Farid, M.A.A.; Yusuf, M.Z.M.; Hassan, M.A.; Ariffin, H. Emerging application of biochar as a renewable and superior filler in polymer composites. RSC Adv. 2022, 12, 13938–13949. [Google Scholar] [CrossRef]
- Wang, X.; Sotoudehniakarani, F.; Yu, Z.; Morrell, J.J.; Cappellazzi, J.; McDonald, A.G. Evaluation of corrugated cardboard biochar as reinforcing fiber on properties, biodegradability and weatherability of wood-plastic composites. Polym. Degrad. Stab. 2019, 168, 108955. [Google Scholar] [CrossRef]
- Wang, B.; Gao, B.; Fang, J. Recent advances in engineered biochar productions and applications. Crit. Rev. Environ. Sci. Technol. 2017, 47, 2158–2207. [Google Scholar] [CrossRef]
- Vivekanandhan, S. Biochar as Sustainable Reinforcement for Polymer Composites. In Encyclopedia of Renewable and Sustainable Materials; Elsevier: Amsterdam, The Netherlands, 2020. [Google Scholar] [CrossRef]
- Aboughaly, M.; Babaei-Ghazvini, A.; Dhar, P.; Patel, R.; Acharya, B. Enhancing the potential of polymer composites using biochar as a filler: A review. Polymers 2023, 15, 3981. [Google Scholar] [CrossRef] [PubMed]
- Bartoli, M.; Arrigo, R.; Malucelli, G.; Tagliaferro, A.; Duraccio, D. Recent advances in biochar polymer composites. Polymers 2022, 14, 2506. [Google Scholar] [CrossRef]
- Das, C.; Tamrakar, S.; Kiziltas, A.; Xie, X. Incorporation of biochar to improve mechanical, thermal and electrical properties of polymer composites. Polymers 2021, 13, 2663. [Google Scholar] [CrossRef]
- Matykiewicz, D. Biochar as an effective filler of carbon fiber reinforced bio-epoxy composites. Processes 2020, 8, 724. [Google Scholar] [CrossRef]
- Bardha, A.; Prasher, S.; Villarta, J.; Francis, M.S.; Khirpin, C.Y.; Mehlem, J.J.; Dumont, M.-J. Nut shell and grain husk waste biochar as carbon black replacements in styrene-butadiene rubber composites and improvements through steam activation. Ind. Crops Prod. 2023, 203, 117180. [Google Scholar] [CrossRef]
- Anerao, P.; Kulkarni, A.; Munde, Y.; Shinde, A.; Das, O. Biochar reinforced PLA composite for fused deposition modelling (FDM): A parametric study on mechanical performance. Comp. Part C Open Access 2023, 12, 100406. [Google Scholar] [CrossRef]
- Vidal, J.L.; Yavitt, B.M.; Wheeler, M.D.; Kolwich, J.L.; Donovan, L.N.; Sit, C.S.; Hatzikiriakos, S.G.; Jalsa, N.K.; MacQuarrie, S.L.; Kerton, F.M. Biochar as a sustainable and renewable additive for the production of Poly(ε-caprolactone) composites. Sustain. Chem. Pharm. 2022, 25, 100586. [Google Scholar] [CrossRef]
- Ferra, J.M.M.; Ohlmeyer, M.; Mendes, A.M.; Costa, M.R.N.; Carvalho, L.H.; Magalhães, F.D. Evaluation of urea-formaldehyde adhesives performance by recently developed mechanical tests. Int. J. Adh. Adhes. 2011, 31, 127–134. [Google Scholar] [CrossRef]
- Akyüz, K.C.; Nemli, G.; Baharoğlu, M.; Zekoviç, E. Effects of acidity of the particles and amount of hardener on the physical and mechanical properties of particleboard composite bonded with urea formaldehyde. Int. J. Adh. Adhes. 2010, 30, 166–169. [Google Scholar] [CrossRef]
- Hongfei, D.; Zhenquan, J.; Shuyun, Z.; Pu, Y.; Qiang, S. New composite grouting materials: Modified urea-formaldehyde resin with cement. Int. J. Mining Sci. Technol. 2012, 22, 195–200. [Google Scholar] [CrossRef]
- Cheng, F.; Li, X. Preparation and application of biochar-based catalysts for biofuel production. Catalysts 2018, 8, 346. [Google Scholar] [CrossRef]
- Shen, Y. A review on hydrothermal carbonization of biomass and plastic wastes to energy products. Biomass Bioenergy 2020, 134, 105479. [Google Scholar] [CrossRef]
- Liu, H.; Chen, Y.; Yang, H.; Gentili, F.G.; Söderlind, U.; Wang, X.; Zhang, W.; Chen, H. Hydrothermal carbonization of natural microalgae containing a high ash content. Fuel 2019, 249, 441–448. [Google Scholar] [CrossRef]
- Gascó, G.; Paz-Ferreiro, J.; Álvarez, M.L.; Saa, A.; Méndez, A. Biochars and hydrochars prepared by pyrolysis and hydrothermal carbonisation of pig manure. Waste Manag. 2018, 79, 395–403. [Google Scholar] [CrossRef]
- Kambo, H.S.; Dutta, A. A comparative review of biochar and hydrochar in terms of production, physico-chemical properties and applications. Renew. Sustain. Energy Rev. 2015, 45, 359–378. [Google Scholar] [CrossRef]
- Bhandari, N.L.; Dhungana, B.R.; Lach, R.; Henning, S.; Adhikari, R. Synthesis and characterization of urea-formaldehyde eco-friendly composite based on natural fibers. J. Inst. Sci. Technol. 2019, 24, 19–25. [Google Scholar] [CrossRef]
- Kojić, M.M.; Petrović, J.T.; Petrović, M.S.; Stanković, S.M.; Porobić, S.J.; Marinović-Cincović, M.T.; Mihajlović, M.L. Hydrothermal carbonization of spent mushroom substrate: Physicochemical characterization, combustion behavior, kinetic and thermodynamic study. J. Anal. Appl. Pyrol. 2021, 155, 105028. [Google Scholar] [CrossRef]
- Koga, N.; Vyazovkin, S.; Burnham, A.K.; Favergeon, L.; Muravyev, N.V.; Pérez-Maqueda, L.A.; Saggese, C.; Sánchez-Jiménez, P.E. ICTAC Kinetics Committee recommendations for analysis of thermal decomposition kinetics. Thermochim. Acta 2023, 719, 179384. [Google Scholar] [CrossRef]
- Vyazovkin, S.; Burnham, A.K.; Favergeon, L.; Koga, N.; Moukhina, E.; Pérez-Maqueda, L.A.; Sbirrazzuoli, N. ICTAC Kinetics Committee recommendations for analysis of multi-step kinetics. Thermochim. Acta 2020, 689, 178597. [Google Scholar] [CrossRef]
- Jovanović, V.; Samaržija-Jovanović, S.; Petković, B.; Milićević, Z.; Marković, G.; Marinović-Cincović, M. Biocomposites based on cellulose and starch modified urea-formaldehyde resin: Hydrolytic, thermal, and radiation stability. Polym. Comp. 2019, 40, 1287–1294. [Google Scholar] [CrossRef]
- Park, B.-D.; Frihart, C.R.; Yu, Y.; Singh, A.P. Hardness evaluation of cured urea–formaldehyde resins with different formaldehyde/urea mole ratios using nanoindentation method. Eur. Polym. J. 2013, 49, 3089–3094. [Google Scholar] [CrossRef]
- El Achaby, M.; Kassab, Z.; Barakat, A.; Aboulkas, A. Alfa fibers as viable sustainable source for cellulose nanocrystals extraction: Application for improving the tensile properties of biopolymer nanocomposite films. Ind. Crops Prod. 2018, 112, 499–510. [Google Scholar] [CrossRef]
- Li, Y.; Xu, G.; Guo, Y.; Ma, T.; Zhong, X.; Zhang, Q.; Gu, J. Fabrication, proposed model and simulation predictions on thermally conductive hybrid cyanate ester composites with boron nitride fillers. Comp. A Appl. Sci. Manuf. 2018, 107, 570–578. [Google Scholar] [CrossRef]
- Bisen, D.; Singh Chouhan, A.P.; Sakthivel, R.M. A comparative study of thermal behavior and kinetics of the rice husk, low-density polyethylene (LDPE) and polyethylene terephthalate (PET) for pyrolysis. J. Renew. Energy Environ. 2024, in press. [Google Scholar] [CrossRef]
- Wan, H.-B.; Huang, Z. Pyrolysis and oxidative thermal decomposition investigations of tennis ball rubber wastes through kinetic and thermodynamic evaluations. Materials 2023, 16, 2328. [Google Scholar] [CrossRef]
- Arshad, M.A.; Maaroufi, A.; Benavente, R.; Pinto, G. Thermal degradation mechanisms of epoxy composites filled with tin particles. Polym. Comp. 2017, 38, 1529–1540. [Google Scholar] [CrossRef]
- Criado, J.M.; Sánchez-Jiménez, P.E.; Pérez-Maqueda, L.A. Critical study of the isoconversional methods of kinetic analysis. J. Therm. Anal. Calorim. 2008, 92, 199–203. [Google Scholar] [CrossRef]
- Vyazovkin, S.; Burnham, A.K.; Criado, J.M.; Pérez-Maqueda, L.A.; Popescu, C.; Sbirrazzuoli, N. ICTAC Kinetics Committee recommendations for performing kinetic computations on thermal analysis data. Thermochim. Acta 2011, 520, 1–19. [Google Scholar] [CrossRef]
- Friedman, H.L. Kinetic of thermal degradation of char-forming plastics from thermogravometry. Application to a phenolic plastic. J. Polym. Sci. Polym. Symp. 1964, 6, 183–195. [Google Scholar] [CrossRef]
- Vyazovkin, S. Evaluation of activation energy of thermally stimulated solid-state reactions under arbitrary variation of temperature. J. Comput. Chem. 1997, 18, 393–402. [Google Scholar] [CrossRef]
- Ramírez, E.; Hernández-López, S.; Torres-Garcia, E.; Reyes-Morales, K.; Balmaseda, J. pICNIK: A python package with isoconversional computations for non-isothermal kinetics. Compu. Phys. Commun. 2022, 278, 108416. [Google Scholar] [CrossRef]
- Sbirrazzuoli, N. Advanced isoconversional kinetic analysis for the elucidation of complex reaction mechanisms: A new method for the identification of rate-limiting steps. Molecules 2019, 24, 1683. [Google Scholar] [CrossRef]
- L’vov, B.V.; Galwey, A.K. Interpretation of the kinetic compensation effect in heterogeneous reactions: Thermochemical approach. Int. Rev. Phys. Chem. 2013, 32, 515–557. [Google Scholar] [CrossRef]
- Amri, A.; Hendri, Y.B.; Saputra, E.; Heltina, D.; Yin, C.-Y.; Rahman, M.M.; Minakshi, M.; Mondinos, N.; Jiang, Z.-T. Formation kinetics of sol-gel derived LiFePO4 olivine analyzed by reliable non-isothermal approach. Ceram. Int. 2022, 48, 17729–17737. [Google Scholar] [CrossRef]
- Moukhina, E. Determination of kinetic mechanisms for reactions measured with thermoanalytical instruments. J. Therm. Anal. Calorim. 2012, 109, 1203–1214. [Google Scholar] [CrossRef]
- Lyon, R.E. A physical basis for kinetic compensation. J. Phys. Chem. A 2023, 127, 2399–2406. [Google Scholar] [CrossRef]
- Barrie, P.J. The mathematical origins of the kinetic compensation effect: 1. the effect of random experimental errors. Phys. Chem. Chem. Phys. 2012, 14, 318–326. [Google Scholar] [CrossRef]
- Barrie, P.J. The mathematical origins of the kinetic compensation effect: 2. the effect of systematic errors. Phys. Chem. Chem. Phys. 2012, 14, 327–336. [Google Scholar] [CrossRef]
- Liu, L.; Guo, Q.-X. Isokinetic relationship, isoequilibrium relationship, and enthalpy-entropy compensation. Chem. Rev. 2001, 101, 673–696. [Google Scholar] [CrossRef] [PubMed]
- Leffler, J.E.; Grunwald, E. Rates and Equilibria of Organic Reactions: As Treated by Statistical, Thermodynamic, and Extrathermodynamic Methods; John Wiley and Sons: New York, NY, USA; Dover Publications, Inc.: Mineola, NY, USA, 1963; pp. 40–56. ISBN 10:0471523534. [Google Scholar]
- Liu, M.; Thirumalai, R.V.K.G.; Wu, Y.; Wan, H. Characterization of the crystalline regions of cured urea formaldehyde resin. RSC Adv. 2017, 7, 49536–49541. [Google Scholar] [CrossRef]
- Yan, X.; Peng, W. Preparation of microcapsules of urea formaldehyde resin coated waterborne coatings and their effect on properties of wood crackle coating. Coatings 2020, 10, 764. [Google Scholar] [CrossRef]
- Arshad, M.A.; Maaroufi, A.; Pinto, G.; Barkany, S.; Elidrissi, A. Morphology, thermal stability and thermal degradation kinetics of cellulose-modified urea-formaldehyde resin. Bull. Mater. Sci. 2016, 39, 1609–1618. [Google Scholar] [CrossRef]
- Luo, J.; Zhang, J.; Luo, J.; Li, J.; Gao, Q. Effect of melamine allocation proportion on chemical structures and properties of melamine-urea-formaldehyde resins. BioResources 2015, 10, 3265–3276. [Google Scholar] [CrossRef]
- Roy, R.; Jadhav, B.; Rahman, M.S.; Raynie, D.E. Characterization of residue from catalytic hydrothermal depolymerization of lignin. Curr. Res. Green Sustain. Chem. 2021, 4, 100052. [Google Scholar] [CrossRef]
- Giroto, A.S.; Guimarães, G.G.F.; Ribeiro, C. Simple route to produce urea: Urea-formaldehyde composites for controlled release of fertilizers. J. Polym. Environ. 2018, 26, 2448–2458. [Google Scholar] [CrossRef]
- Han, M.; Jiang, K.; Jiao, P.; Ji, Y.; Zhou, J.; Zhuang, W.; Chen, Y.; Liu, D.; Zhu, C.; Chen, X.; et al. Bio-butanol sorption performance on novel porous-carbon adsorbents from corncob prepared via hydrothermal carbonization and post-pyrolysis method. Sci. Rep. 2017, 7, 11753. [Google Scholar] [CrossRef]
- Wu, M.; Feng, Q.; Sun, X.; Wang, H.; Gielen, G.; Wu, W. Rice (Oryza sativa L.) plantation affects the stability of biochar in paddy soil. Sci. Rep. 2015, 5, 10001. [Google Scholar] [CrossRef]
- Gao, Y.; Wang, X.; Wang, J.; Li, X.; Cheng, J.; Yang, H.; Chen, H. Effect of residence time on chemical and structural properties of hydrochar obtained by hydrothermal carbonization of water hyacinth. Energy 2013, 58, 376–383. [Google Scholar] [CrossRef]
- Davis, W.M.; Erickson, C.L.; Johnston, C.T.; Delfino, J.J.; Porter, J.E. Quantitative Fourier Transform Infrared spectroscopic investigation humic substance functional group composition. Chemosphere 1999, 38, 2913–2928. [Google Scholar] [CrossRef]
- Abdel-Ghani, N.T.; El-Chaghaby, G.A.; Helal, F.S. Individual and competitive adsorption of phenol and nickel onto multiwalled carbon nanotubes. J. Adv. Res. 2015, 6, 405–415. [Google Scholar] [CrossRef] [PubMed]
- Theodosoglou, E.; Koroneos, A.; Soldatos, T.; Zorba, T.; Paraskevopoulos, K.M. Comparative Fourier transform infrared and X-ray powder diffraction analysis of naturally occurred K-feldspars. Bull. Geol. Soc. Greece 2010, 43, 2752–2761. [Google Scholar] [CrossRef]
- Yadav, A.K.; Singh, P. A review of the structures of oxide glasses by Raman spectroscopy. RSC Adv. 2015, 5, 67583–67609. [Google Scholar] [CrossRef]
- Khan, T.A.; Gupta, A.; Jamari, S.S.; Nasir, M.; Jang, S.; Kim, H.-J.; Asim, M. Synthesis of micro carbonaceous material by pyrolysis of rubber wood and its effect on properties of urea-formaldehyde (UF) resin. Int. J. Adh. Adhes. 2020, 99, 102589. [Google Scholar] [CrossRef]
- Kalra, S.; Singh, G.P. Preparation and characterization of clay/urea formaldehyde resin composites. Appl. Ecol. Environ. Sci. 2021, 9, 356–367. [Google Scholar] [CrossRef]
- Roumeli, E.; Papadopoulou, E.; Pavlidou, E.; Vourlias, G.; Bikiaris, D.; Paraskevopoulos, K.M.; Chrissafis, K. Synthesis, characterization and thermal analysis of urea-formaldehyde/nanoSiO2 resins. Thermochim. Acta 2012, 527, 33–39. [Google Scholar] [CrossRef]
- Gurses, A.; Karagöz, S.; Mindivan, F.; Güneş, K.; Doğar, Ç.; Aktürk, S. Preparation and characterization of urea/formaldehyde/Rosa Canina sp. seeds composites. Acta Phys. Pol. Ser. A 2014, 125, 368–373. [Google Scholar] [CrossRef]
- Tutus, A.; Eroğlu, H. An alternative solution to the silica problem in wheat straw pulping. Appita Technol. Innov. Manuf. Environ. 2004, 57, 214–217. [Google Scholar]
- Ebailila, M.; Kinuthia, J.; Oti, J. Role of gypsum content on the long-term performance of lime-stabilised soil. Materials 2022, 15, 5099. [Google Scholar] [CrossRef]
- Song, J.; Chen, S.; Yi, X.; Zhao, X.; Zhang, J.; Liu, X.; Liu, B. Preparation and properties of the urea-formaldehyde res-in/reactive halloysite nanocomposites adhesive with low-formaldehyde emission and good water resistance. Polymers 2021, 13, 2224. [Google Scholar] [CrossRef] [PubMed]
- Madhurambal, G.; Mariappan, M. Growth and characterization of urea-thiourea non-linear optical organic mixed crystal. Ind. J. Pure Appl. Phys. 2010, 48, 264–270. [Google Scholar]
- Park, B.-D.; Jeong, H.-W. Hydrolytic stability and crystallinity of cured urea-formaldehyde resin adhesives with different formaldehyde/urea mole ratios. Int. J. Adh. Adhes. 2011, 31, 524–529. [Google Scholar] [CrossRef]
- Levendis, D.; Pizzi, A.; Ferg, E. The correlation of strength and formaldehyde emission with the crystalline/amorphous structure of UF resins. Holzforschung 1992, 46, 263–269. [Google Scholar] [CrossRef]
- Ivanović, M.; Kljajević, L.; Nenadović, M.; Bundaleski, N.; Vukanac, I.; Todorović, B.; Nenadović, S. Physicochemical and radiological characterization of kaolin and its polymerization products. Mater. Constr. 2018, 68, e155. [Google Scholar] [CrossRef]
- Dutournié, P.; Bruneau, M.; Brendlé, J.; Limousy, L.; Pluchon, S. Mass transfer modelling in clay-based material: Estimation of apparent diffusivity of a molecule of interest. Comptes Rendus Chimie 2019, 22, 250–257. [Google Scholar] [CrossRef]
- Wang, W.; Cong, J.; Deng, J.; Weng, X.; Lin, Y.; Huang, Y.; Peng, T. Developing effective separation of feldspar and quartz while Recycling tailwater by HF pretreatment. Minerals 2018, 8, 149. [Google Scholar] [CrossRef]
- Motozuka, S.; Tagaya, M.; Ogawa, N.; Fukui, K.; Nishikawa, M.; Shiba, K.; Uehara, T.; Kobayashi, T. Effective preparation of graphite nanoparticles using mechanochemical solid-state reactions. Solid State Commun. 2014, 190, 28–32. [Google Scholar] [CrossRef]
- Shao, L.; Sang, Y.; Liu, N.; Liu, J.; Zhan, P.; Huang, J.; Chen, J. Selectable microporous carbons derived from poplar wood by three preparation routes for CO2 capture. ACS Omega 2020, 5, 17450–17462. [Google Scholar] [CrossRef]
- Howe, J.Y.; Rawn, C.J.; Jones, L.E.; Ow, H. Improved crystallographic data for graphite. Powder Diff. 2003, 18, 150–154. [Google Scholar] [CrossRef]
- Wang, D.; Botte, G.G. In situ X-Ray diffraction study of urea electrolysis on nickel catalysts. ECS Electrochem. Lett. 2014, 3, H29–H32. [Google Scholar] [CrossRef]
- Ariyanti, D.; Lesdantina, D.; Budiyono; Satriadi, H. Synthesis and characterization of graphene-like material derived from sugarcane bagasse. IOP Conf. Ser. Mater. Sci. Eng. 2021, 1053, 012013. [Google Scholar] [CrossRef]
- Mintz, K.J.; Bartoli, M.; Rovere, M.; Zhou, Y.; Hettiarachchi, S.D.; Paudyal, S.; Chen, J.; Domena, J.B.; Liyanage, P.Y.; Sampson, R.; et al. A deep investigation into the structure of carbon dots. Carbon 2021, 173, 433–447. [Google Scholar] [CrossRef]
- Abdolhosseinzadeh, S.; Asgharzadeh, H.; Kim, H.S. Fast and fully-scalable synthesis of reduced graphene oxide. Sci. Rep. 2015, 5, 10160. [Google Scholar] [CrossRef]
- Blanton, T.N.; Majumdar, D. X-ray diffraction characterization of polymer intercalated graphite oxide. Powder Diff. 2012, 27, 104–107. [Google Scholar] [CrossRef]
- Ren, T.; Wang, Y.; Wu, N.; Qing, Y.; Li, X.; Wu, Y.; Liu, M. Degradation of urea-formaldehyde resin residues by a hydrothermal oxidation method into recyclable small molecular organics. J. Hazard. Mater. 2022, 426, 127783. [Google Scholar] [CrossRef]
- Brown, E.N.; Kessler, M.R.; Sottos, N.R.; White, S.R. In situ poly(urea-formaldehyde) microencapsulation of dicyclopentadiene. J. Microencapsul. 2003, 20, 719–730. [Google Scholar] [CrossRef]
- Stein, M.; Bykov, V.; Kuntz, C.; Börnhorst, M.; Deutschmann, O.; Maas, U. Modeling the decomposition of urea-water-solution in films and droplets under SCR conditions with chemistry in the liquid phase. Int. J. Heat. Fluid. Flow 2022, 94, 108936. [Google Scholar] [CrossRef]
- Arshad, M.A.; Maaroufi, A.K.; Benavente, R.; Pinto, G. Kinetics of the thermal degradation mechanisms in urea-formaldehyde cellulose composites filled with zinc particles. J. Mater. Sci. Mater. Electron. 2017, 28, 11832–11845. [Google Scholar] [CrossRef]
- Gao, S.; Cheng, Z.; Zhou, X.; Liu, Y.; Chen, R.; Wang, J.; Wang, C.; Chu, F.; Xu, F.; Zhang, D. Unexpected role of amphiphilic lignosulfonate to improve the storage stability of urea formaldehyde resin and its application as adhesives. Int. J. Biol. Macromol. 2020, 161, 755–762. [Google Scholar] [CrossRef]
- van Krevelen, D.W.; te Nijenhuis, K. Properties of Polymers—Their Correlation with Chemical Structure; Their Numerical Estimation and Prediction from Additive Group Contributions, 4th ed.; Elsevier: Amsterdam, The Netherlands, 2009; Chapter 21; pp. 772–777. [Google Scholar]
- Chacón-Parra, A.; van Eyk, P. Reaction kinetics for the hydrothermal carbonisation of cellulose in a two-phase pathway. Fuel 2022, 309, 122169. [Google Scholar] [CrossRef]
- Camino, G.; Operti, L.; Trossarelli, L. Mechanism of thermal degradation of urea-formaldehyde polycondensates. Polym. Degrad. Stab. 1983, 5, 161–172. [Google Scholar] [CrossRef]
- Ahamad, T.; Alshehri, S.M. Thermal degradation and evolved gas analysis: A polymeric blend of urea formaldehyde (UF) and epoxy (DGEBA) resin. Arab. J. Chem. 2014, 7, 1140–1147. [Google Scholar] [CrossRef]
- Zorba, T.; Papadopoulou, E.; Hatjiissaak, A.; Paraskevopoulos, K.M.; Chrissafis, K. Urea-formaldehyde resins characterized by thermal analysis and FTIR method. J. Therm. Anal. Calorim. 2008, 92, 29–33. [Google Scholar] [CrossRef]
- Chen, C.-H.; Chiang, C.-L. Preparation and characteristics of an environmentally friendly hyperbranched flame-retardant polyurethane hybrid containing nitrogen, phosphorus, and silicon. Polymers 2019, 11, 720. [Google Scholar] [CrossRef]
- Zhang, J.; Wang, X.; Zhang, S.; Gao, Q.; Li, J. Effects of melamine addition stage on the performance and curing behavior of melamine-urea-formaldehyde (MUF) resin. BioResources 2013, 8, 5500–5514. [Google Scholar] [CrossRef]
- Hirata, T.; Kawamoto, S.; Okuro, A. Pyrolysis of melamine-formaldehyde and urea-formaldehyde resins. J. Appl. Polym. Sci. 1991, 42, 3147–3163. [Google Scholar] [CrossRef]
- Zhang, Y.; He, Z.B.; Xue, L.; Chu, D.M.; Mu, J. Influence of a urea-formaldehyde resin adhesive on pyrolysis characteristics and volatiles emission of poplar particleboard. RSC Adv. 2016, 6, 12850–12861. [Google Scholar] [CrossRef]
- Gadipelli, S.; Guo, Z.X. Graphene-based materials: Synthesis and gas sorption, storage and separation. Prog. Mater. Sci. 2015, 69, 1–60. [Google Scholar] [CrossRef]
- Tohmura, S.; Hse, C.-Y.; Higuchi, M. Formaldehyde emission and high-temperature stability of cured urea-formaldehyde resins. J. Wood Sci. 2000, 46, 303–309. [Google Scholar] [CrossRef]
- Luo, L.; Zhang, Z.; Li, C.; Nishu; He, F.; Zhang, X.; Cai, J. Insight into master plots method for kinetic analysis of lignocellulosic biomass pyrolysis. Energy 2021, 233, 121194. [Google Scholar] [CrossRef]
- Patidar, K.; Singathia, A.; Vashishtha, M.; Sangal, V.K.; Upadhyaya, S. Investigation of kinetic and thermodynamic parameters approaches to non-isothermal pyrolysis of mustard stalk using model-free and master plots methods. Mater. Sci. Energy Technol. 2022, 5, 6–14. [Google Scholar] [CrossRef]
- Capart, R.; Khezami, L.; Burnham, A.K. Assessment of various kinetic models for the pyrolysis of a microgranular cellulose. Thermochim. Acta 2004, 417, 79–89. [Google Scholar] [CrossRef]
- Jiang, M.; Bi, D.; Wang, T.; Gao, Z.; Liu, J. Co-pyrolysis of cellulose and urea blend: Nitrogen conversion and effects of parameters on nitrogenous compounds distributions in bio-oil. J. Anal. Appl. Pyrol. 2021, 157, 105177. [Google Scholar] [CrossRef]
- Hu, B.; Zhang, B.; Xie, W.-L.; Jiang, X.-Y.; Liu, J.; Lu, Q. Recent progress in quantum chemistry modeling on the pyrolysis mechanisms of lignocellulosic biomass. Energy Fuels 2020, 34, 10384–10440. [Google Scholar] [CrossRef]
- Mettler, M.S.; Mushrif, S.H.; Paulsen, A.D.; Javadekar, A.D.; Vlachos, D.G.; Dauenhauer, P.J. Revealing pyrolysis chemistry for biofuels production: Conversion of cellulose to furans and small oxygenates. Energy Environ. Sci. 2012, 5, 5414–5424. [Google Scholar] [CrossRef]
- Tzankova, D.; Vladimirova, S.; Peikova, L.; Georgieva, M. Synthesis of pyrrole and substituted pyrroles (Review). J. Chem. Technol. Metall. 2018, 53, 451–464, ISSN 1314-7471 (print)ISSN 1314-7978 (online). [Google Scholar]
- Vlocskó, R.B.; Xie, G.; Török, B. Green synthesis of aromatic nitrogen-containing heterocycles by catalytic and non-traditional activation methods. Molecules 2023, 28, 4153. [Google Scholar] [CrossRef]
- Schaberg, A.; Wroblowski, R.; Goertz, R. Comparative study of the thermal decomposition behaviour of different amino acids and peptides. J. Phys. Conf. Ser. 2018, 1107, 032013. [Google Scholar] [CrossRef]
- Li, T.; Guo, X.; Liang, J.; Wang, H.; Xie, X.; Du, G. Competitive formation of the methylene and methylene ether bridges in the urea-formaldehyde reaction in alkaline solution: A combined experimental and theoretical study. Wood Sci. Technol. 2015, 49, 475–493. [Google Scholar] [CrossRef]
- Siimer, K.; Christjanson, P.; Kaljuvee, T.; Pehk, T.; Saks, I. Thermal behaviour of hydroxymethyl compounds as models for adhesive resins. J. Therm. Anal. Calorim. 2009, 97, 459–466. [Google Scholar] [CrossRef]
- Kibrik, É.J.; Steinhof, O.; Scherr, G.; Thiel, W.R.; Hasse, H. Proof of ether-bridged condensation products in UF resins by 2D NMR spectroscopy. J. Polym. Res. 2013, 20, 79. [Google Scholar] [CrossRef]
- Yin, K.; Li, H.; Xia, Y.; Bi, H.; Sun, J.; Liu, Z.; Sun, L. Thermodynamic and kinetic analysis of lowtemperature thermal reduction of graphene oxide. Nano-Micro Lett. 2011, 3, 51–55. [Google Scholar] [CrossRef]
- Chen, S.; Wang, S.-Z.; Yang, S.-L.; Fu, X.; Yan, Q. Thermal behavior and thermolysis mechanisms of graphene oxide-intercalated energetic complexes of carbohydrazide. Chem. Thermodyn. Therm. Anal. 2023, 9, 100106. [Google Scholar] [CrossRef]
- Ni, K.; Du, G.; Liu, C.; Wu, Y.; Yang, H.; Yin, C.; Su, H.; Ran, X.; Gao, W.; Yang, L. Cross-linked entanglement of aldehyde and amine-functionalized nanocellulose reinforced with biomineralization to produce an all-bio-based adhesive. Chem. Eng. J. 2023, 465, 142888. [Google Scholar] [CrossRef]
- Jung, I.; Field, D.A.; Clark, N.J.; Zhu, Y.; Yang, D.; Piner, R.D.; Stankovich, S.; Dikin, D.A.; Geisler, H.; Ventrice, C.A., Jr.; et al. Reduction kinetics of graphene oxide determined by electrical transport measurements and temperature programmed desorption. J. Phys. Chem. C 2009, 113, 18480–18486. [Google Scholar] [CrossRef]
- Hossain, M.D.; Hassan, M.K.; Saha, S.; Yuen, A.C.Y.; Wang, C.; George, L.; Wuhrer, R. Thermal and pyrolysis kinetics analysis of glass wool and XPS insulation materials used in high-rise buildings. Fire 2023, 6, 231. [Google Scholar] [CrossRef]

| Model | Symbol | f(α) |
|---|---|---|
| Phase boundary-controlled reaction (contracting disk, 1D) | R1/F0 | (1 − α)0 |
| Phase boundary-controlled reaction (contracting area, 2D) | R2 | 2·(1 − α)1/2 |
| Phase boundary-controlled reaction (contracting volume, 3D) | R3 | 3·(1 − α)2/3 |
| Random nucleation, unimolecular decay law, and first-order chemical reaction | F1 | (1 − α) |
| Second-order chemical reaction | F2 | (1 − α)2 |
| n-th order chemical reaction (n ≠ 1) | Fn | (1 − α)n |
| Two-dimensional growth of nuclei (Avrami equation) | A2 | 2·(1 − α)[−ln(1 − α)]1/2 |
| Three-dimensional growth of nuclei (Avrami equation) | A3 | 3·(1 − α)[−ln(1 − α)]2/3 |
| n-dimensional nucleation (Avrami–Erofeev equation) | An | n·(1 − α)[−ln(1 − α)]1−1/n |
| One-dimensional diffusion, parabola law | D1 | 1/2α |
| Two-dimensional diffusion, Valensi equation | D2 | 1/[−ln(1 − α)] |
| Three-dimensional diffusion, Jander equation | D3 | (3/2)(1 − α)2/3/[1 − (1 − α)1/3] |
| Three-dimensional diffusion, Ginstling–Brounstein | D4 | (3/2)/[(1 − α)−1/3 − 1] |
| Prout–Tompkins equation | B1 | (1 − α)·α |
| Expanded Prout–Tompkins equation | Bna | (1 − α)n·αa |
| First order with autocatalysis | C1 | (1 + kcat·α)(1 − α) |
| n-th order with autocatalysis | Cn | (1 + kcat·α)(1 − α)n |
| n-th order and m-power with autocatalysis | Cnm | (1 − α)n·αm |
| Expanded Šestak–Berggren (SB) equation | SBnmq | (1 − α)n·αm·[−ln(1 − α)]q |
| Kamal–Sourour equation | KS | (k1 + k2·αm)(1 − α)n |
| Nakamura crystallization | Nk (An + H–L) | f(α)·K(T), f(α) = n·(1 − α)[−ln(1 − α)]1−1/n, where for analytical dependence of the rate constant K(T), Hoffman–Lauritzen (H–L) theory is used (non-Arrhenius) |
| Šestak–Berggren crystallization or Sbirrazzuoli crystallization | (SBC/SC) (SB + H–L) | f(α)·K(T), f(α) = (1 − α)n·αm·[−ln(1 − α)]q, where for analytical dependence of the rate constant K(T), Hoffman–Lauritzen (H–L) theory is used (non-Arrhenius) |
| β (K/min) | Tonset a (°C) | Tsh b (°C) | Tp b (°C) | Ti a (°C) | Tf a (°C) | T5 a (°C) | T10 a (°C) | T30 a (°C) | T50 a (°C) | Rmax b (%/min) | CPI (%2·min−2·°C−3) | HRI (°C) | IPDT (°C) |
|---|---|---|---|---|---|---|---|---|---|---|---|---|---|
| 5.1 | 57.40 | 244.04 | 279.49 | 233.85 | 879.44 | 106.19 | 235.07 | 281.28 | 335.51 | 3.420 | 3.400 × 10⁻⁷ | 103.51 | 534.54 |
| 10.2 | 60.30 | 255.16 | 293.44 | 236.64 | 885.55 | 129.40 | 248.48 | 292.60 | 355.06 | 8.377 | 1.551 × 10⁻⁶ | 111.39 | 540.54 |
| 15.2 | 64.20 | 262.87 | 299.20 | 240.18 | 899.25 | 134.53 | 262.28 | 307.94 | 377.83 | 11.346 | 2.939 × 10⁻⁶ | 116.90 | 548.84 |
| 20.2 | 68.34 | 269.65 | 303.91 | 246.98 | 910.47 | 141.78 | 275.31 | 321.78 | 389.30 | 16.616 | 5.040 × 10⁻⁶ | 122.39 | 557.71 |
| Stage | Δα | a (s−1) | b (mol·(kJ)−1) | kiso (s−1) | Tiso (°C) | Experimental T-Range/Effect | R2 | r |
|---|---|---|---|---|---|---|---|---|
| S-1 | 0.01–0.06 | −6.103 ± 0.173 | 0.188 ± 0.003 | 7.889 × 10⁻⁷ | 366.63 | Inside a | 0.99905 | 0.99962 |
| S-2 | 0.07–0.18 | −2.609 ± 0.111 | 0.1 ± / | 0.003 | 929.64 | Inside a | 0.99976 | 0.99989 |
| S-3 | 0.19–0.36 | −5.941 ± 0.123 | 0.109 ± / | 1.145 × 10⁻⁶ | 830.33 | Inside a | 0.99968 | 0.99985 |
| S-4 | 0.37–0.53 | 3.029 ± 0.409 | 0.068 ± 0.002 | 1.069 × 10³ | 1495.66 | Outside | 0.98956 | 0.99509 |
| S-5 | 0.54–0.79 | −2.441 ± 0.099 | 0.087 ± / | 0.004 | 1109.37 | Outside | 0.99861 | 0.99933 |
| S-6 | 0.80–0.93 | −3.407 ± 0.072 | 0.055 ± / | 0.0004 | 1913.74 | Outside | 0.99913 | 0.99960 |
| S-7 | 0.94–0.98 | −3.927 ± 0.227 | 0.055 ± / | 0.0001 | 1913.74 | Outside | 0.99867 | 0.99950 |
| Step a: A → B, Reaction Type: Fn | |
|---|---|
| Activation Energy, E (kJ/mol) | 164.933 |
| Log(PreExp.), logA, A (1/s) | 13.495 |
| Reaction Order, n | 3.438 |
| Contribution | 0.437 |
| Step a: C → D, Reaction Type: An | |
| Activation Energy, E (kJ/mol) | 352.831 |
| Log(PreExp.), logA (1/s) | 31.472 |
| Dimension, n | 0.181 |
| Contribution | 0.168 |
| Step a: D → E, Reaction Type: Cn | |
| Activation Energy, E (kJ/mol) | 60.429 |
| Log(PreExp.), logA, A (1/s) | 1.105 |
| Reaction Order, n | 11.396 |
| Log(AutocatPreExp.), logkcat | 1.450 |
| Contribution | 0.198 |
| Step a: F → G, Reaction Type: F2 | |
| Activation Energy, E (kJ/mol) | 58.750 |
| Log(PreExp.), logA (1/s) | 6.761 |
| Contribution | 0.071 |
| Step a: H → I, Reaction Type: Fn | |
| Activation Energy, E (kJ/mol) | 155.882 |
| Log(PreExp.), logA, A (1/s) | 5.534 |
| Reaction Order, n | 2.608 |
| Contribution | 0.126 |
| Method | Fit To | R2 | Sum of dev. Squares (S2) | Mean Residual (MR) | Students coef. 95% | F-Test |
|---|---|---|---|---|---|---|
| Friedman (FR) | TG a | 0.97506 | 67,429.646 | 3.329 | 1.961 | 114.435 |
| Vyazovkin (VY) | TG a | 0.97450 | 68,922.355 | 3.433 | 1.961 | 116.968 |
| Numerical (NM) | TG a | 0.99712 | 7877.474 | 1.096 | 1.961 | 13.369 |
| p:, Model | TG a | 0.99977 | 646.650 | 0.446 | 1.961 | 1.000 |
Disclaimer/Publisher’s Note: The statements, opinions and data contained in all publications are solely those of the individual author(s) and contributor(s) and not of MDPI and/or the editor(s). MDPI and/or the editor(s) disclaim responsibility for any injury to people or property resulting from any ideas, methods, instructions or products referred to in the content. |
© 2025 by the authors. Licensee MDPI, Basel, Switzerland. This article is an open access article distributed under the terms and conditions of the Creative Commons Attribution (CC BY) license (https://creativecommons.org/licenses/by/4.0/).
Share and Cite
Janković, B.; Dodevski, V.; Janković, M.; Milenković, M.; Samaržija-Jovanović, S.; Jovanović, V.; Marinović-Cincović, M. Synthesis and Characterization of Bio-Composite Based on Urea–Formaldehyde Resin and Hydrochar: Inherent Thermal Stability and Decomposition Kinetics. Polymers 2025, 17, 1375. https://doi.org/10.3390/polym17101375
Janković B, Dodevski V, Janković M, Milenković M, Samaržija-Jovanović S, Jovanović V, Marinović-Cincović M. Synthesis and Characterization of Bio-Composite Based on Urea–Formaldehyde Resin and Hydrochar: Inherent Thermal Stability and Decomposition Kinetics. Polymers. 2025; 17(10):1375. https://doi.org/10.3390/polym17101375
Chicago/Turabian StyleJanković, Bojan, Vladimir Dodevski, Marija Janković, Marija Milenković, Suzana Samaržija-Jovanović, Vojislav Jovanović, and Milena Marinović-Cincović. 2025. "Synthesis and Characterization of Bio-Composite Based on Urea–Formaldehyde Resin and Hydrochar: Inherent Thermal Stability and Decomposition Kinetics" Polymers 17, no. 10: 1375. https://doi.org/10.3390/polym17101375
APA StyleJanković, B., Dodevski, V., Janković, M., Milenković, M., Samaržija-Jovanović, S., Jovanović, V., & Marinović-Cincović, M. (2025). Synthesis and Characterization of Bio-Composite Based on Urea–Formaldehyde Resin and Hydrochar: Inherent Thermal Stability and Decomposition Kinetics. Polymers, 17(10), 1375. https://doi.org/10.3390/polym17101375