
The Incorporation of Graphene Nanoplatelets in Tung Oil–Urea Formaldehyde Microcapsules: A Paradigm Shift in Physicochemical Enhancement

 , , and
Abstract
1. Introduction
2. Materials and Methods
2.1. Materials
2.2. MC Formulation
2.3. Characterization Methods
2.3.1. Rheological Properties
2.3.2. Mastersizer
2.3.3. Optical Microscopy (OM), Transmission Electron Microscopy (TEM), and Scanning Electron Microscopy (SEM)
2.3.4. Raman Spectroscopy
2.3.5. Micromanipulation
3. Results and Discussion
3.1. Rheology
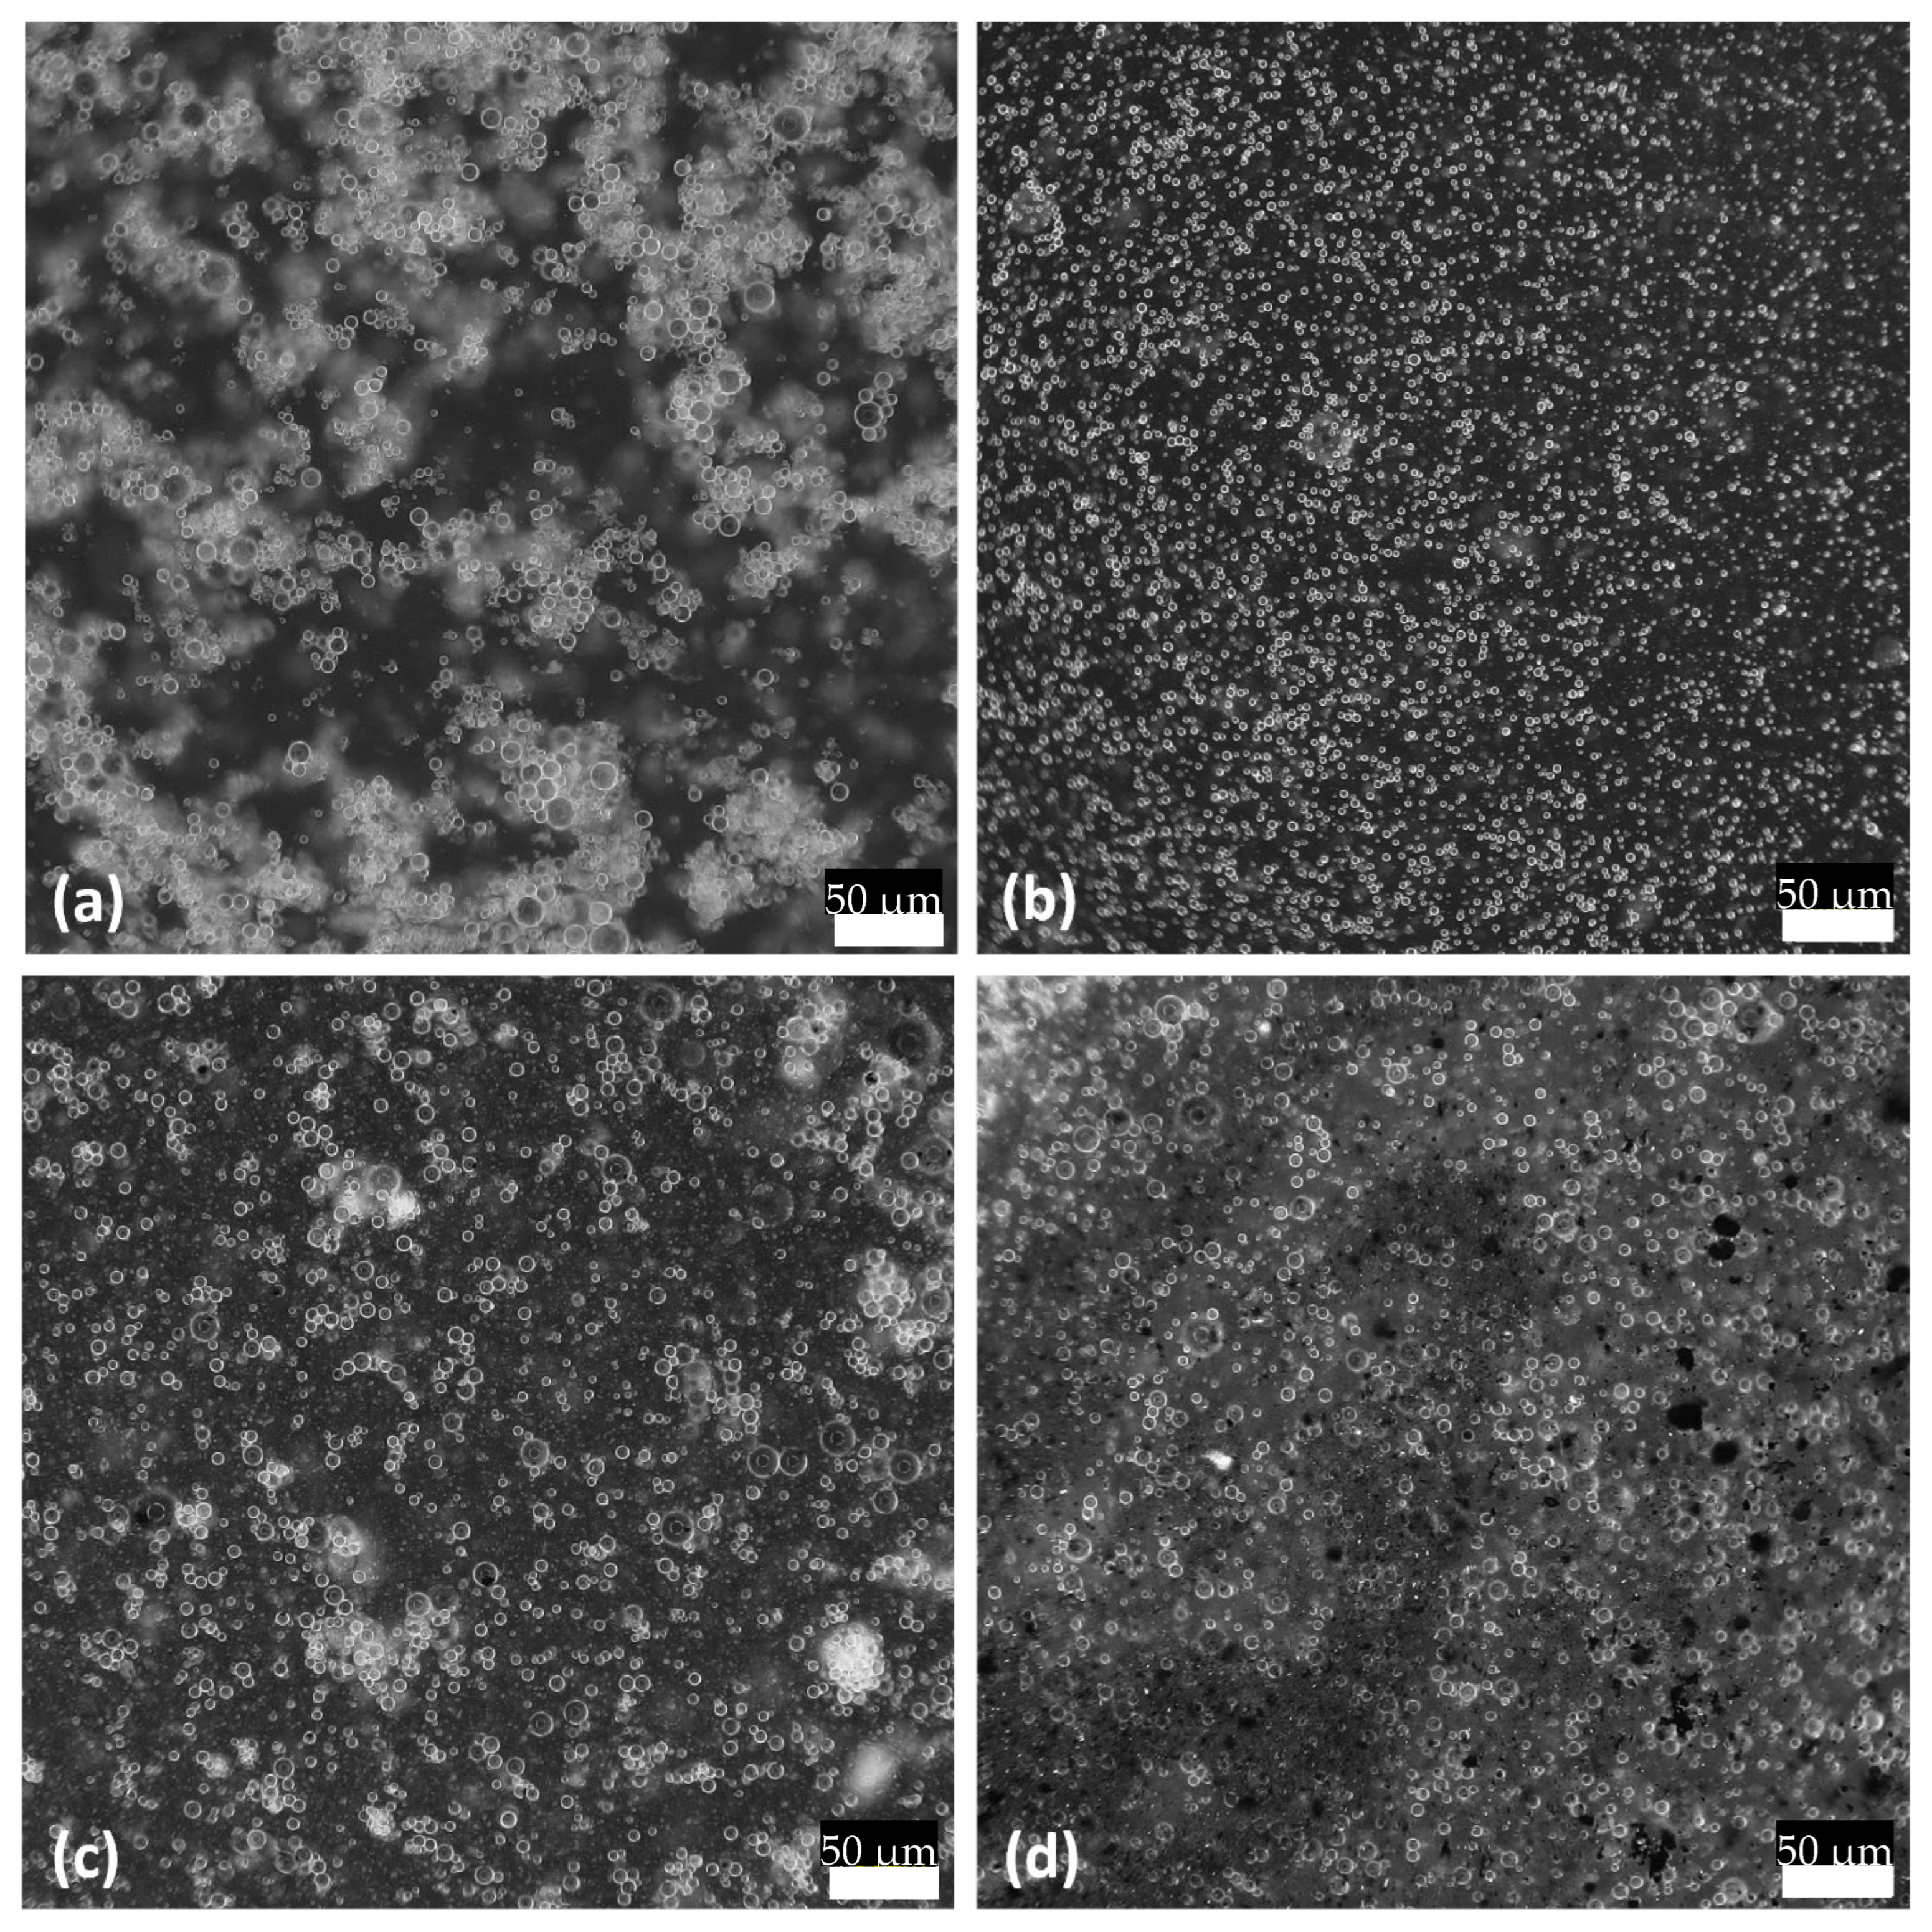
3.2. Size Distribution of Oil Droplets’ Diameter
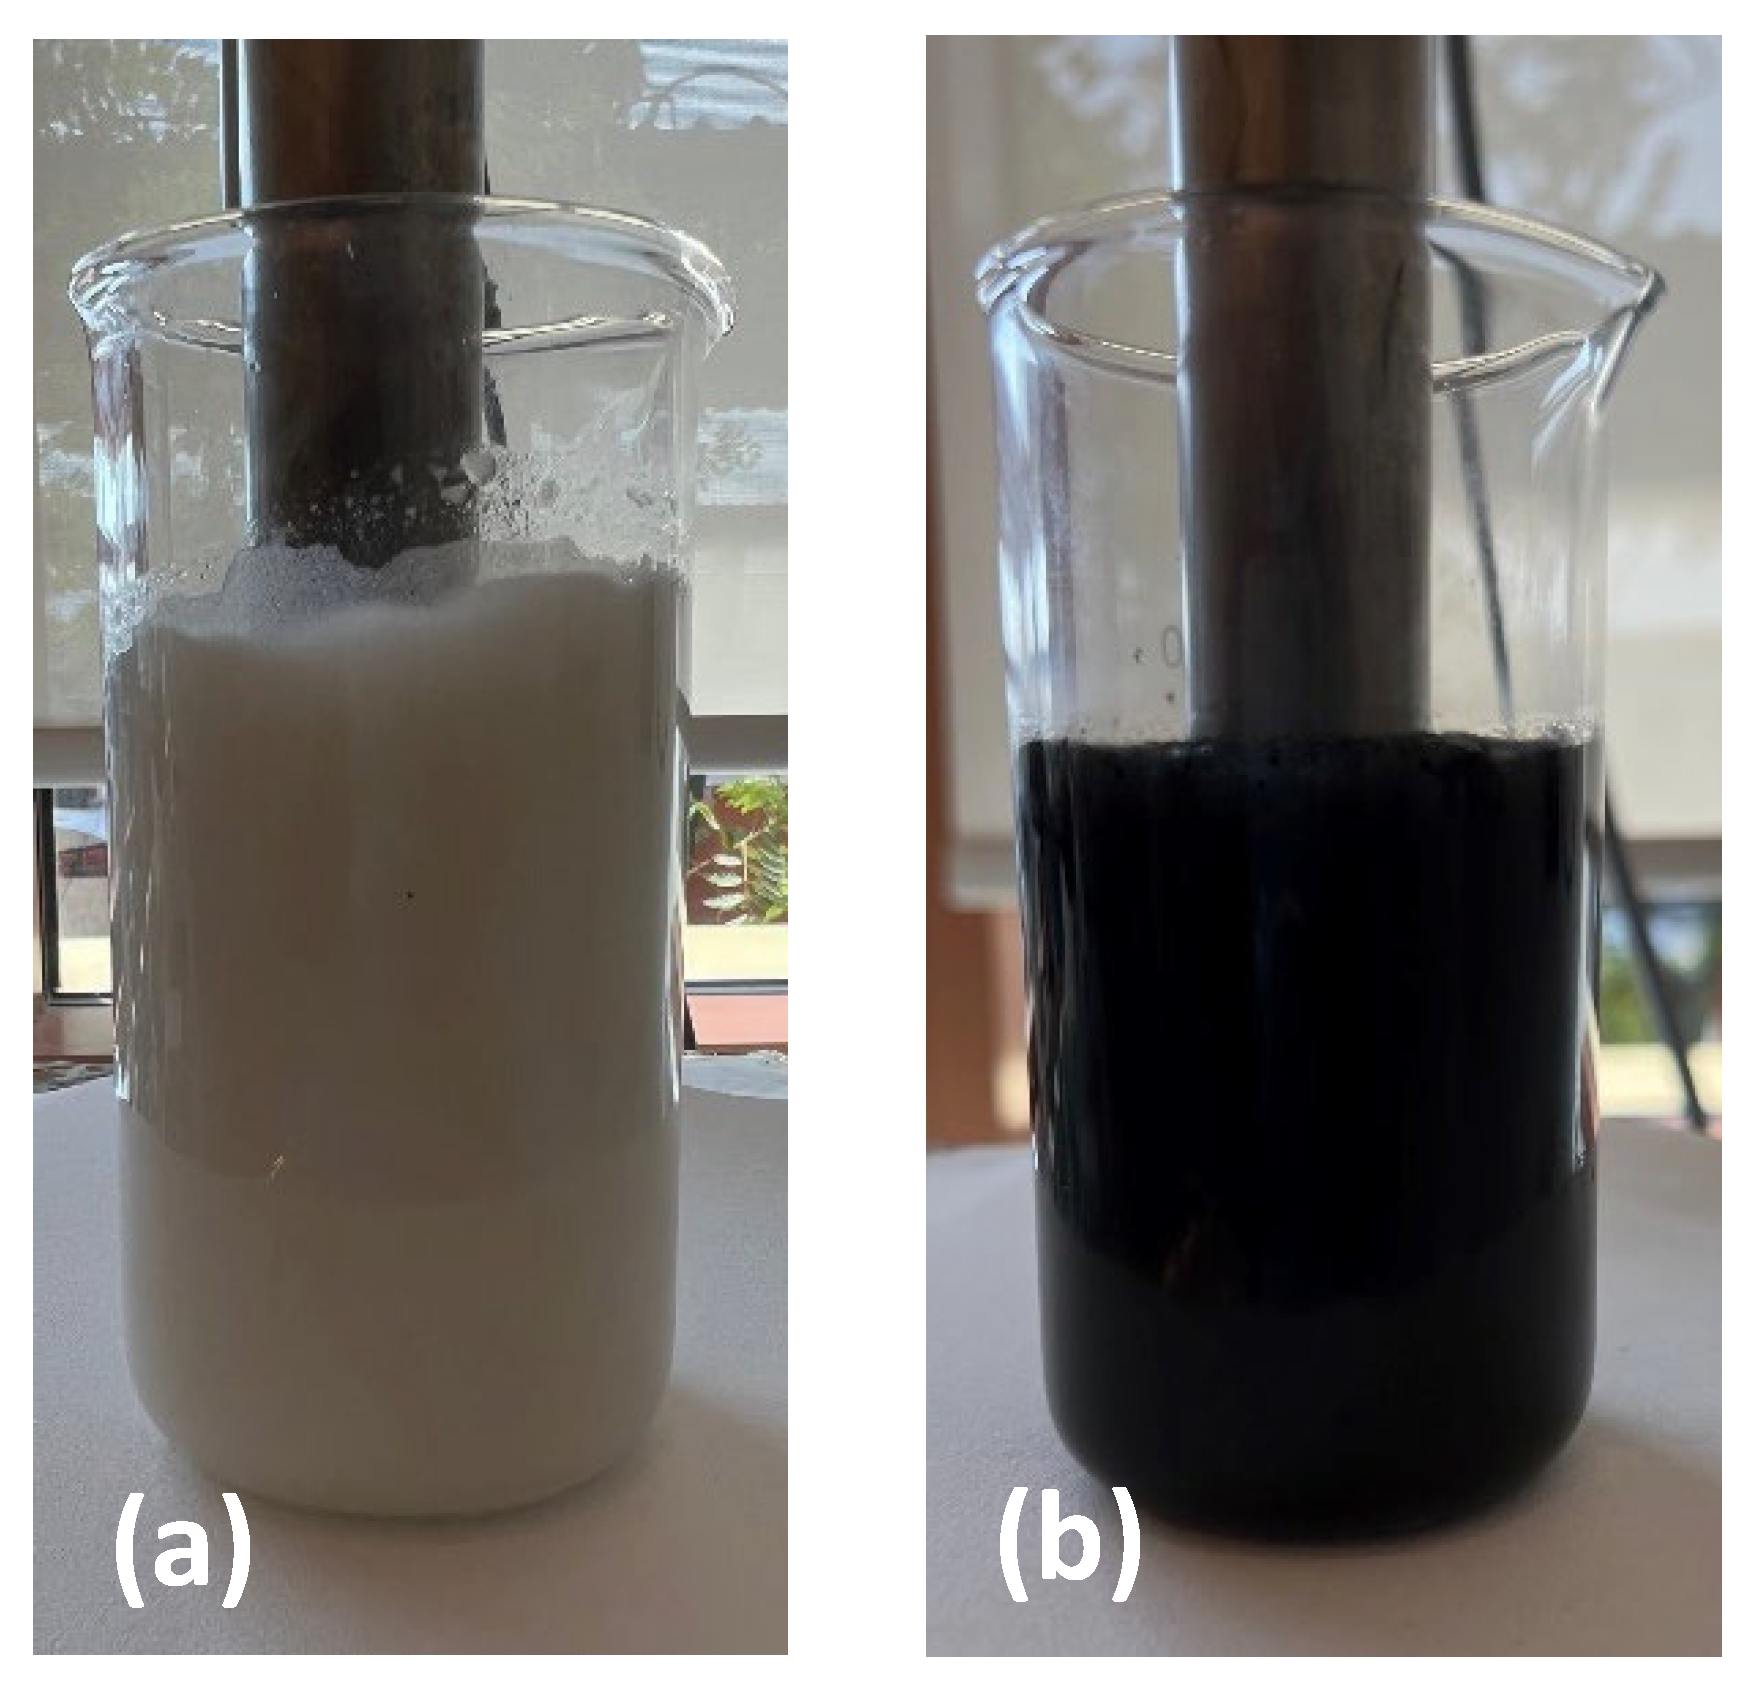
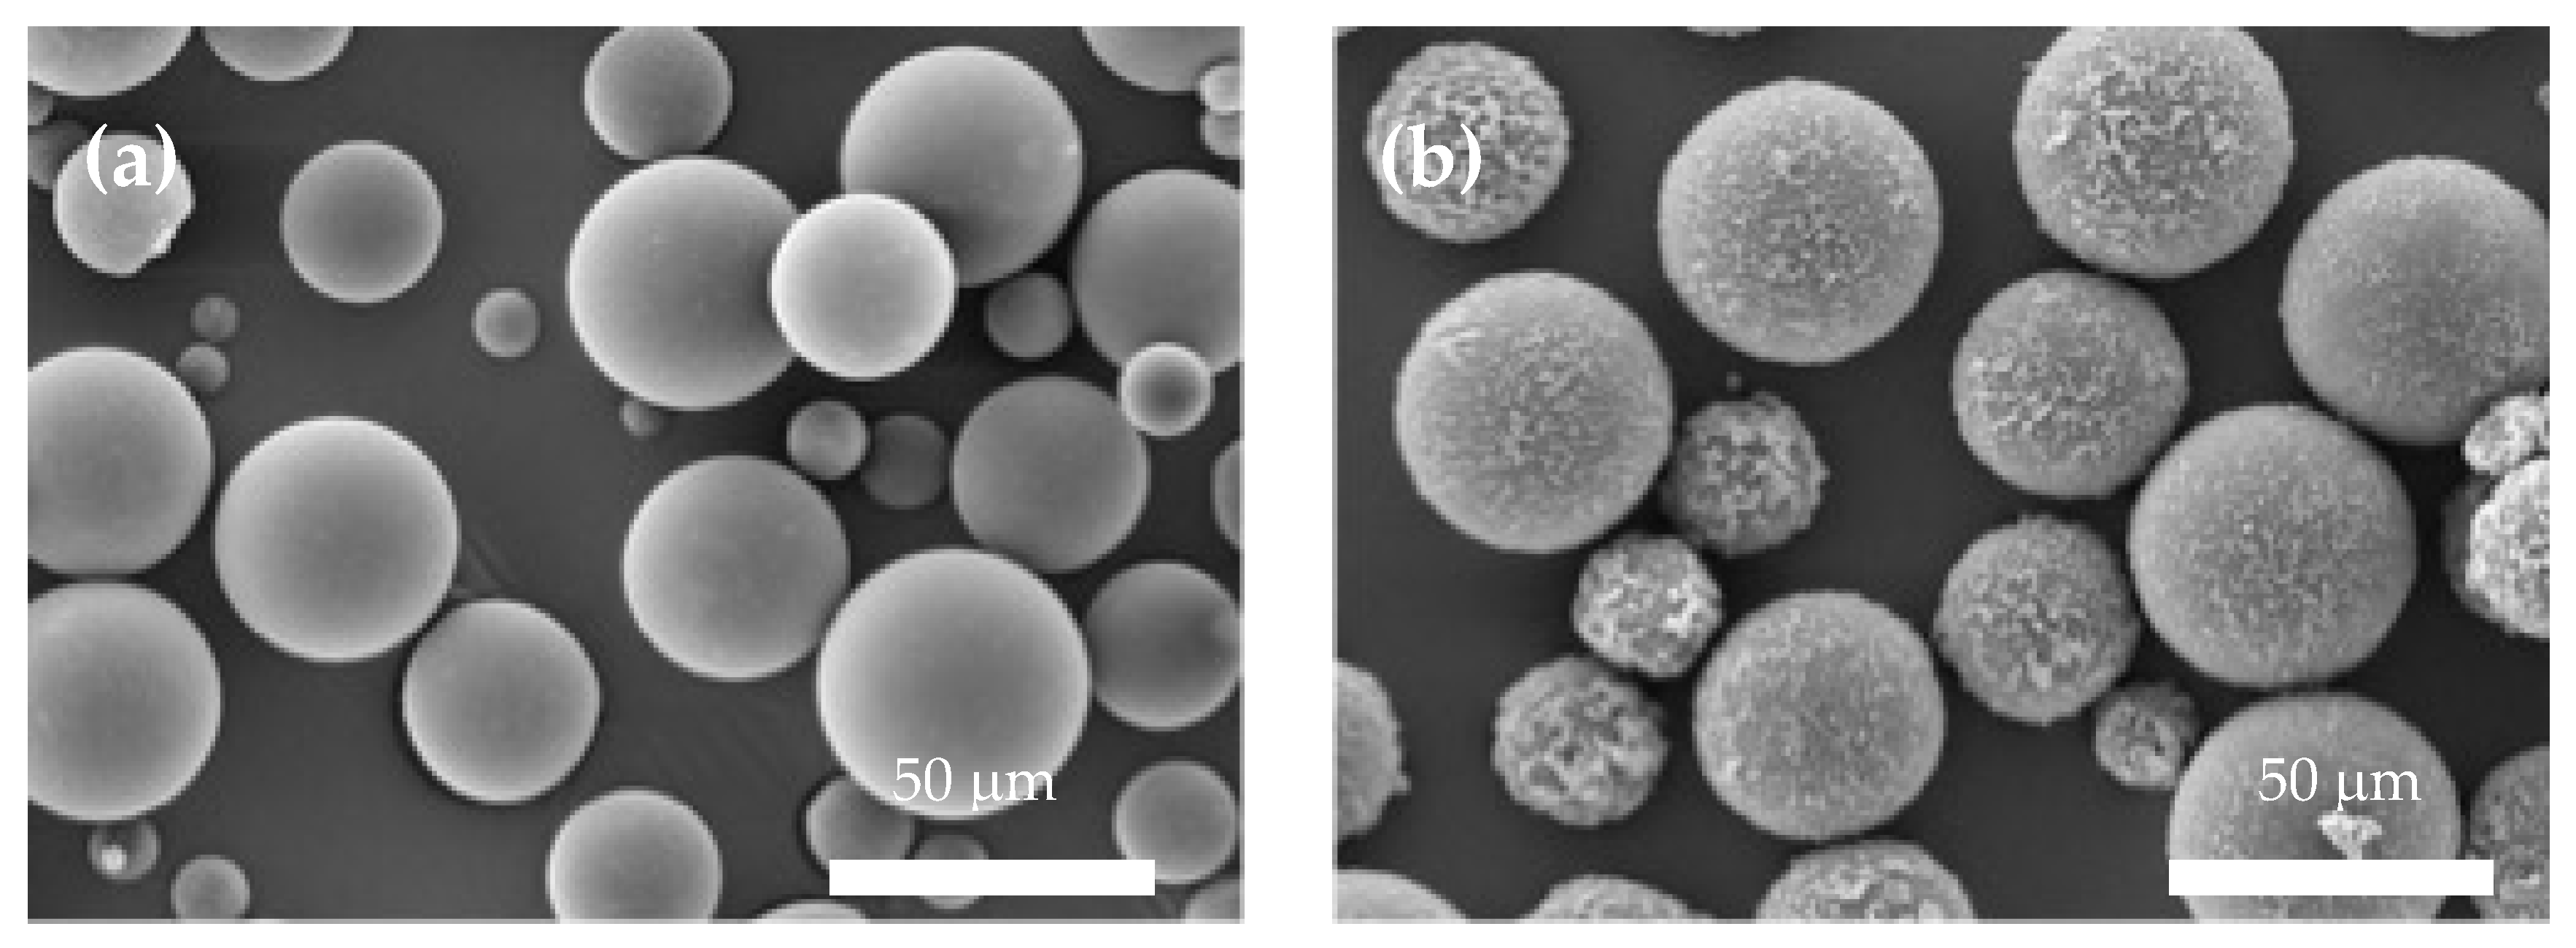
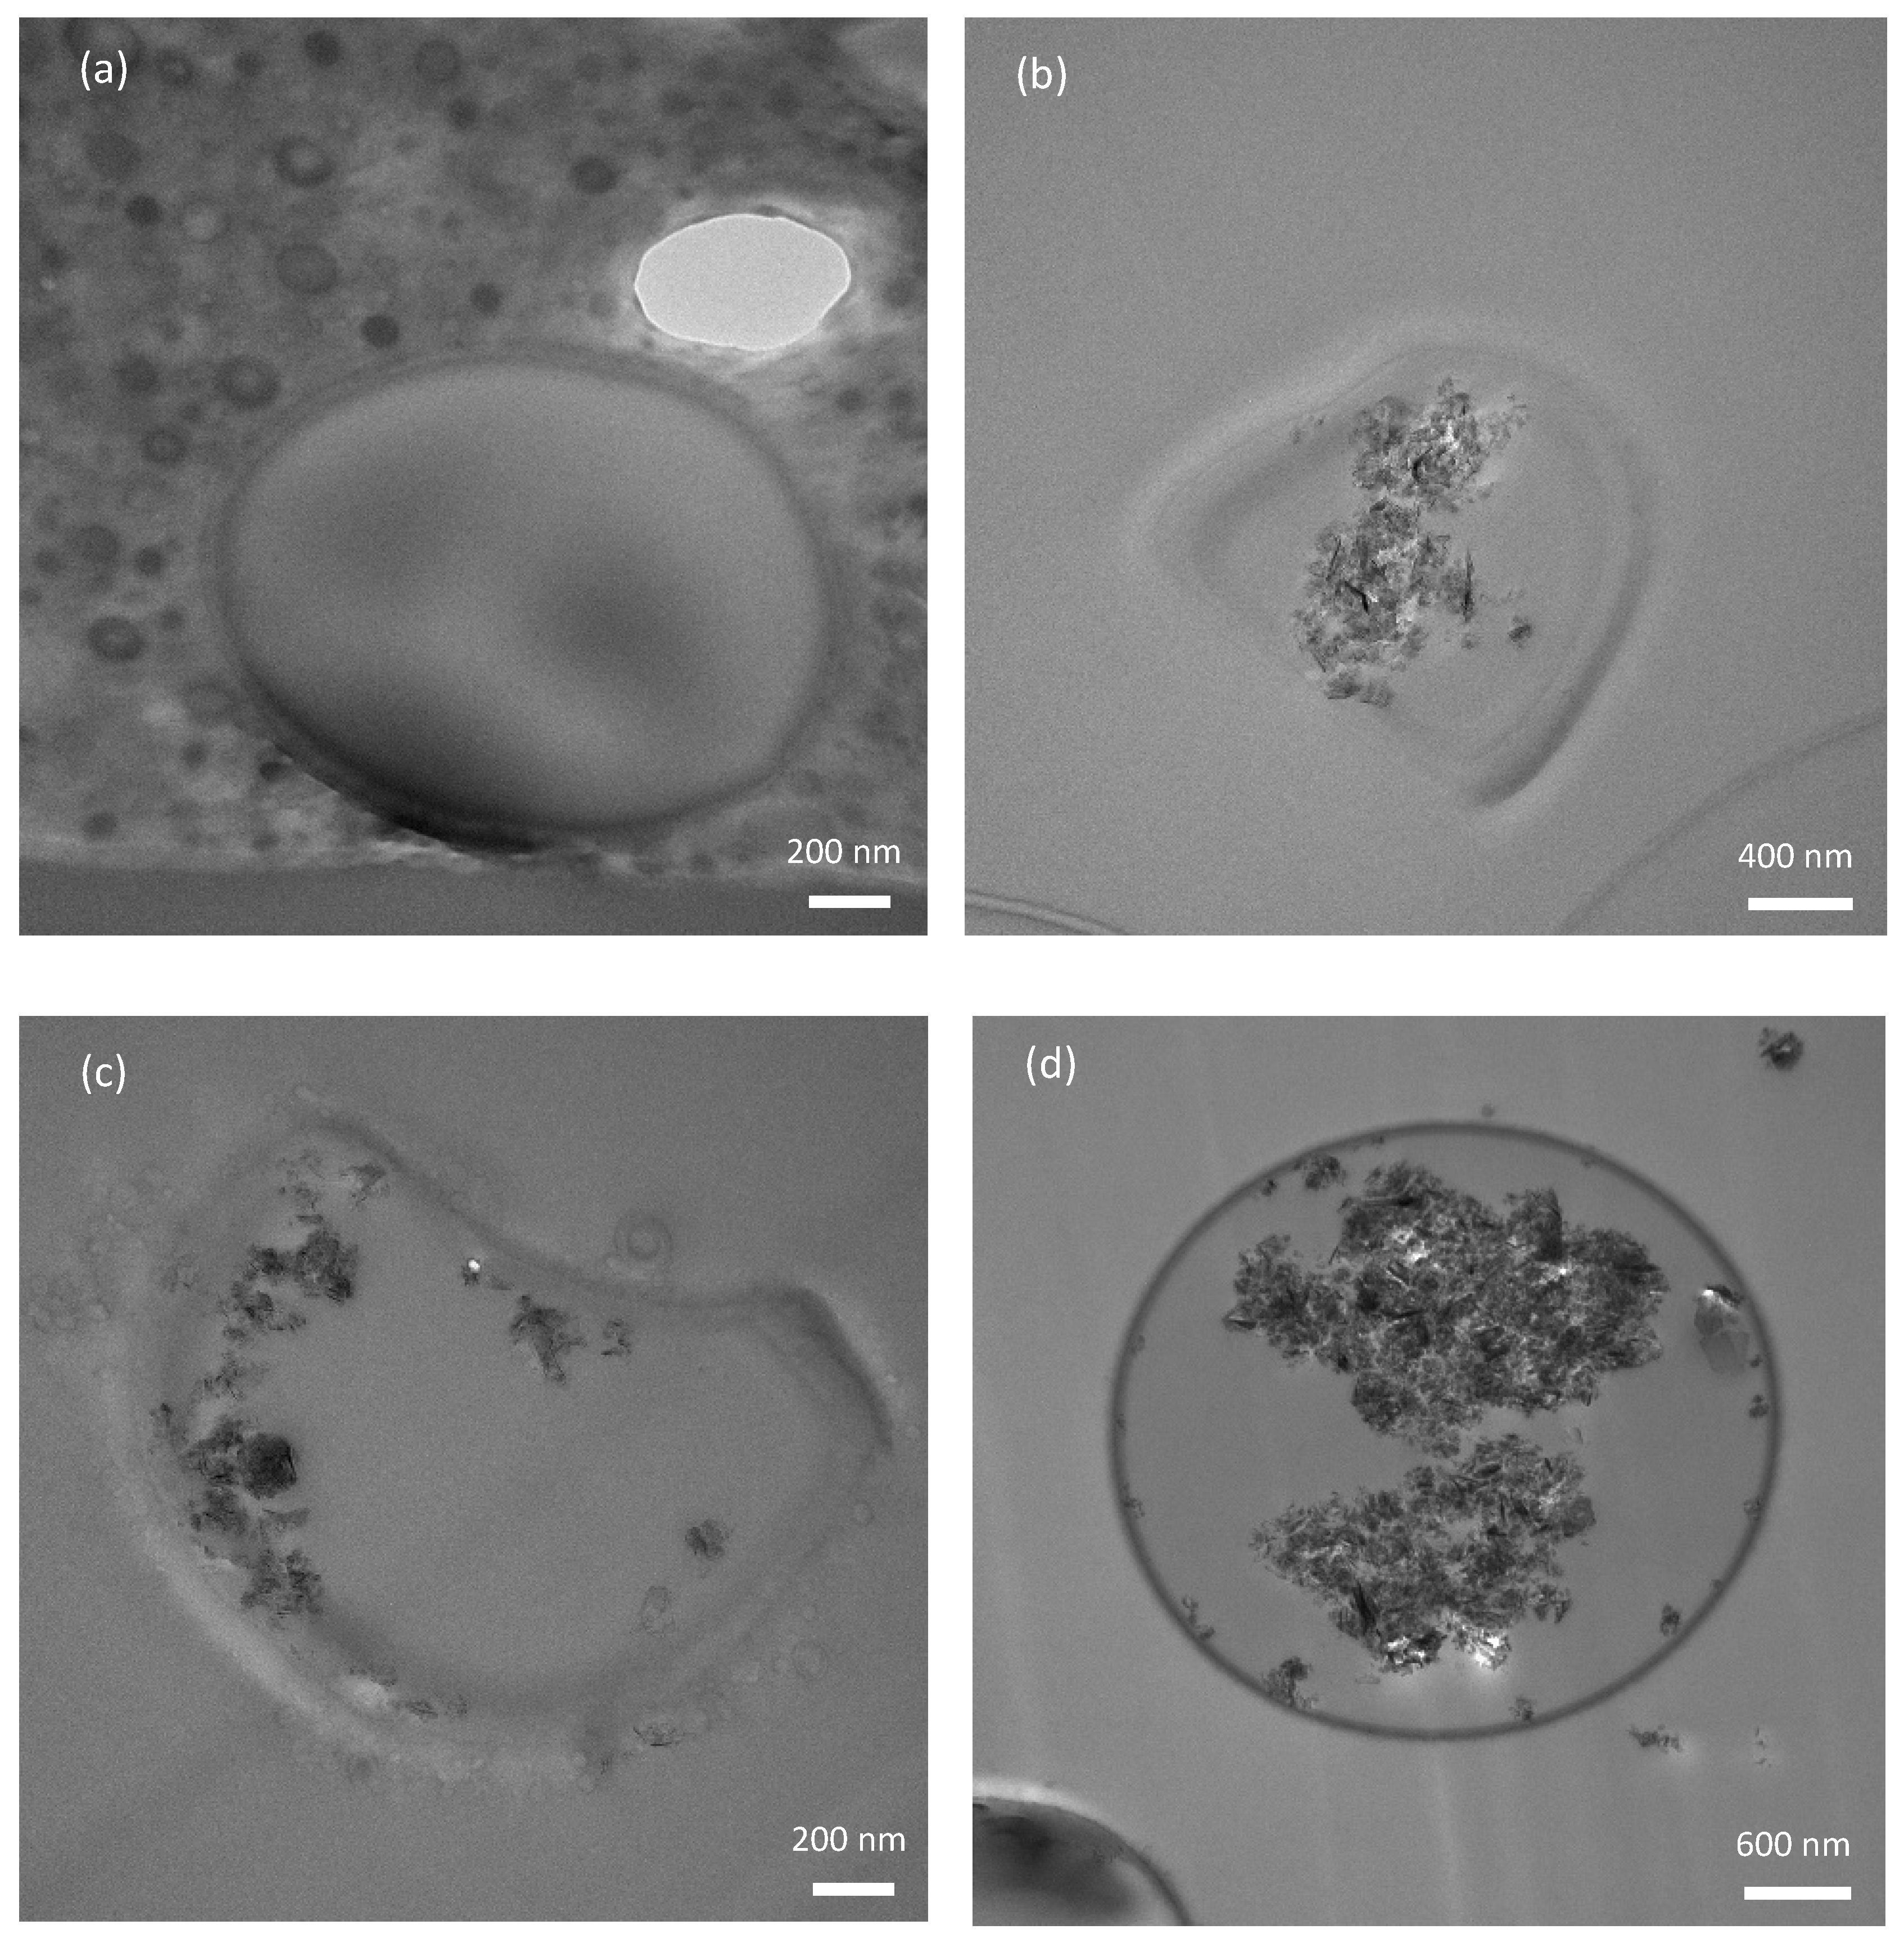
3.3. The Formulation of TO and GNP/TO MCs
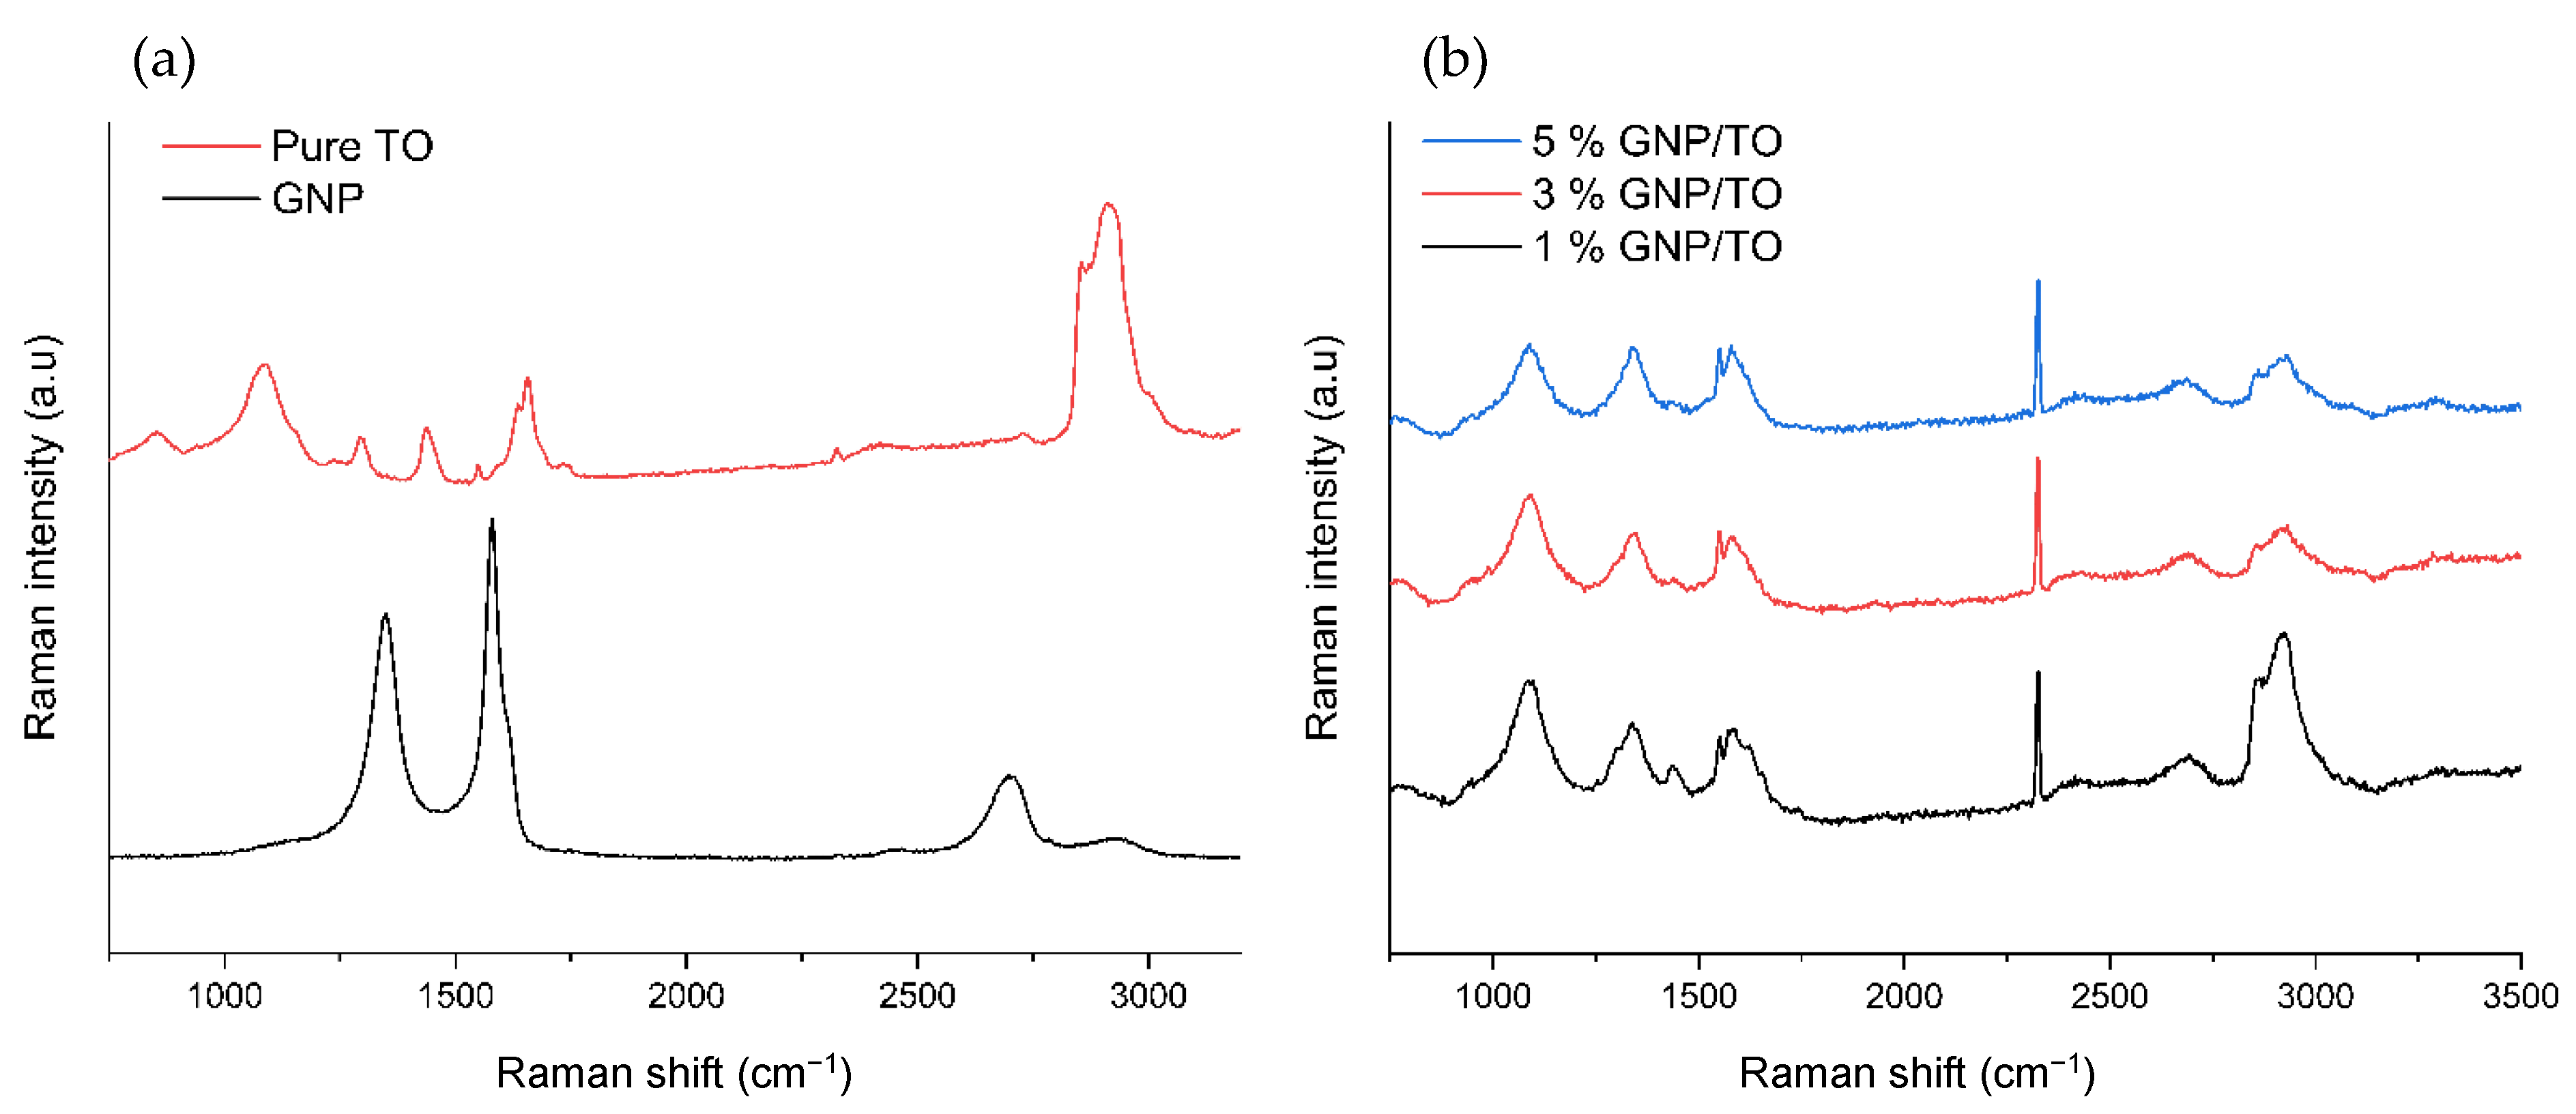
3.4. Raman Spectroscopy
3.5. Micromanipulation of the MCs
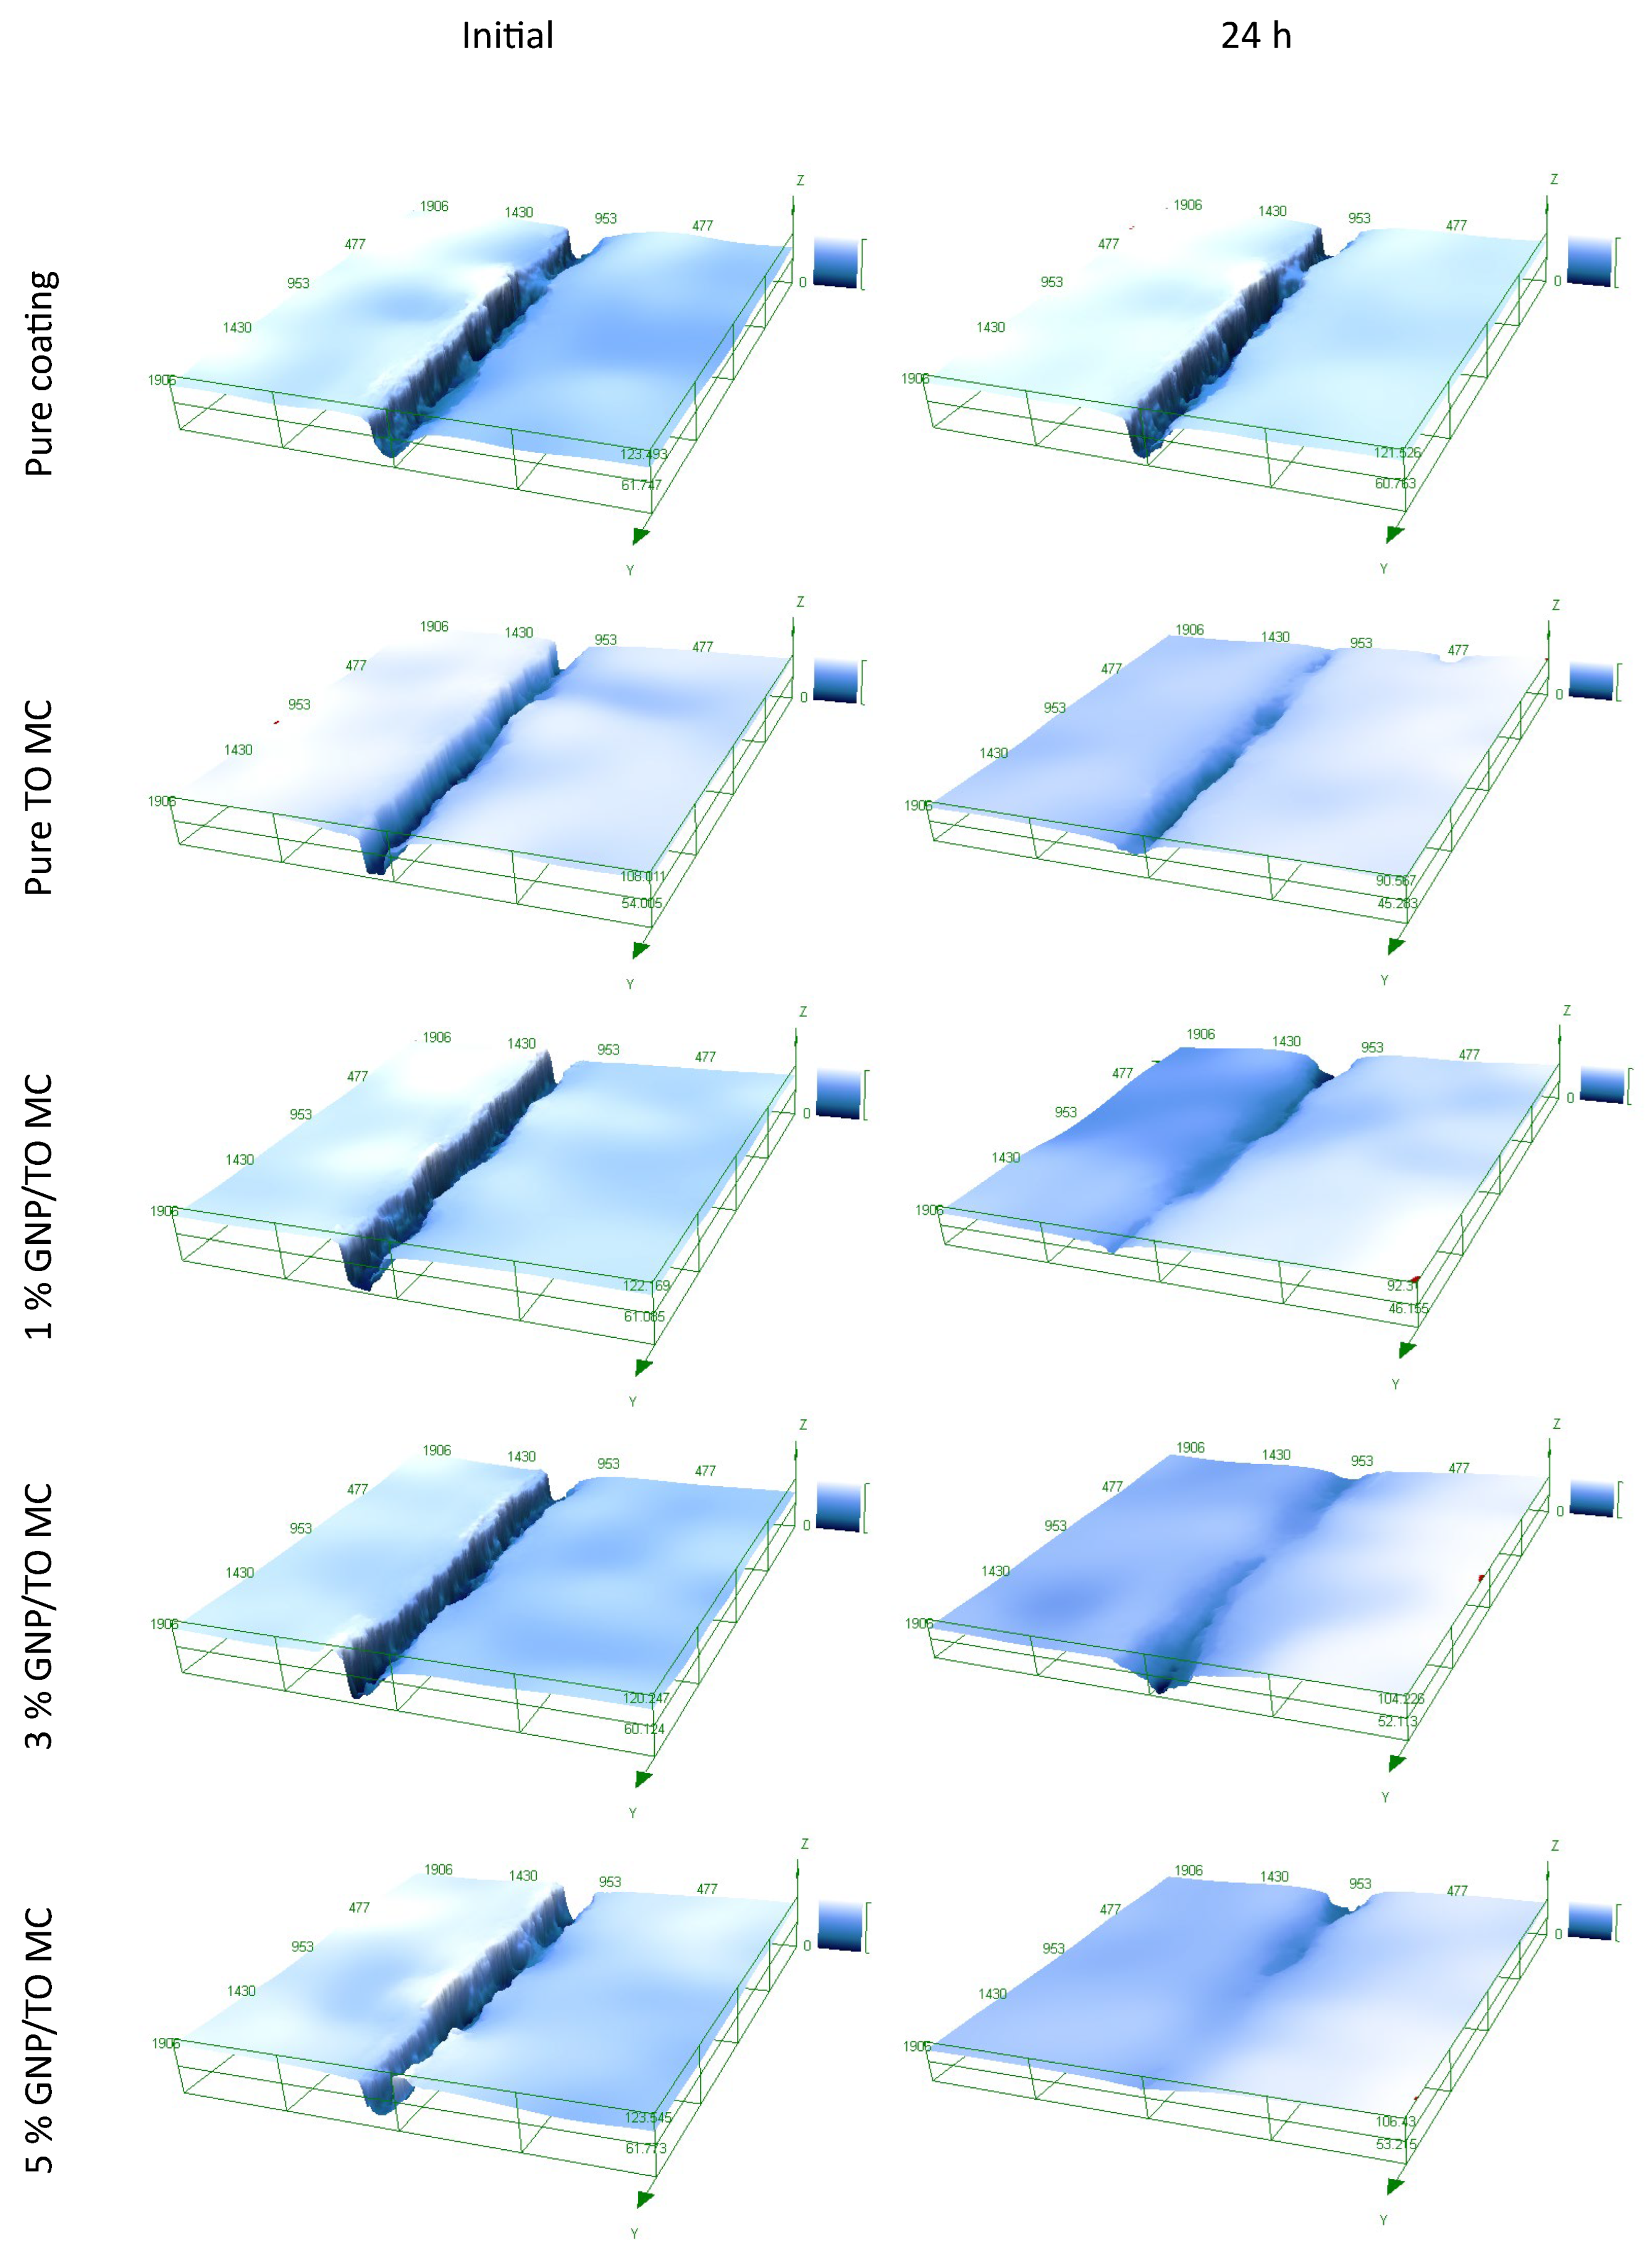
3.6. Self-Healing and Corrosion Resistance of the Coating
4. Conclusions
Supplementary Materials
Author Contributions
Funding
Institutional Review Board Statement
Data Availability Statement
Acknowledgments
Conflicts of Interest
References
- Samadzadeh, M.; Boura, S.H.; Peikari, M.; Ashrafi, A.; Kasiriha, M. Tung Oil: An Autonomous Repairing Agent for Self-Healing Epoxy Coatings. Prog. Org. Coat. 2010, 70, 383–387. [Google Scholar] [CrossRef]
- Li, H.; Cui, Y.; Li, Z.; Zhu, Y.; Wang, H. Fabrication of Microcapsules Containing Dual-Functional Tung Oil and Properties Suitable for Self-Healing and Self-Lubricating Coatings. Prog. Org. Coat. 2018, 115, 164–171. [Google Scholar] [CrossRef]
- Li, J.; Shi, H.; Liu, F.; Han, E.H. Self-Healing Epoxy Coating Based on Tung Oil-Containing Microcapsules for Corrosion Protection. Prog. Org. Coat. 2021, 156, 106236. [Google Scholar] [CrossRef]
- Zhang, Y.; Baiocco, D.; Mustapha, A.N.; Zhang, X.; Yu, Q.; Wellio, G.; Zhang, Z.; Li, Y. Hydrocolloids: Nova Materials Assisting Encapsulation of Volatile Phase Change Materials for Cryogenic Energy Transport and Storage. Chem. Eng. J. 2019, 382, 123028. [Google Scholar] [CrossRef]
- Mustapha, A.N.; Zhang, Y.; Zhang, Z.; Ding, Y.; Li, Y. A Systematic Study on the Reaction Mechanisms for the Microencapsulation of a Volatile Phase Change Material (PCM) via One-Step in Situ Polymerisation. Chem. Eng. Sci. 2022, 252, 117497. [Google Scholar] [CrossRef]
- Nguon, O.; Lagugné-Labarthet, F.; Brandys, F.A.; Li, J.; Gillies, E.R. Microencapsulation by in Situ Polymerization of Amino Resins. Polym. Rev. 2017, 58, 326–375. [Google Scholar] [CrossRef]
- Li, J.; Li, Z.; Feng, Q.; Qiu, H.; Yang, G.; Zheng, S.; Yang, J. Encapsulation of Linseed Oil in Graphene Oxide Shells for Preparation of Self-Healing Composite Coatings. Prog. Org. Coat. 2019, 129, 285–291. [Google Scholar] [CrossRef]
- Fan, L.W.; Fang, X.; Wang, X.; Zeng, Y.; Xiao, Y.Q.; Yu, Z.T.; Xu, X.; Hu, Y.C.; Cen, K.F. Effects of Various Carbon Nanofillers on the Thermal Conductivity and Energy Storage Properties of Paraffin-Based Nanocomposite Phase Change Materials. Appl. Energy 2013, 110, 163–172. [Google Scholar] [CrossRef]
- Yusuff, A.O.; Yahya, N.; Zakariya, M.A.; Sikiru, S. Investigations of Graphene Impact on Oil Mobility and Physicochemical Interaction with Sandstone Surface. J. Pet. Sci. Eng. 2021, 198, 108250. [Google Scholar] [CrossRef]
- Prasetya, N.B.A.; Ajizan, A.I.; Widodo, D.S.; Ngadiwiyana, N.; Gunawan, G. A Polyeugenol/Graphene Composite with Excellent Anti-Corrosion Coating Properties. Mater. Adv. 2023, 4, 248–255. [Google Scholar] [CrossRef]
- Zheludkevich, M.; Saji, V.S.; Kausar, A.; Ahmad, I.; Eisa, M.H.; Maaza, M. Avant-Garde Polymer/Graphene Nanocomposites for Corrosion Protection: Design, Features, and Performance. Corros. Mater. Degrad. 2023, 4, 33–53. [Google Scholar] [CrossRef]
- Thakur, A.; Ganjoo, R.; Kumar, A. Surface Modified Carbon Nanotubes in Corrosion Protection. ACS Symp. Ser. 2022, 1424, 235–255. [Google Scholar] [CrossRef]
- Kuan, C.F.; Chiang, C.L.; Lin, S.H.; Huang, W.G.; Hsieh, W.Y.; Shen, M.Y. Characterization and Properties of Graphene Nanoplatelets/XNBR Nanocomposites. Polym. Polym. Compos. 2018, 26, 59–67. [Google Scholar] [CrossRef]
- Wang, B.; Jiang, R.; Wu, Z. Investigation of the Mechanical Properties and Microstructure of Graphene Nanoplatelet-Cement Composite. Nanomaterials 2016, 6, 200. [Google Scholar] [CrossRef] [PubMed]
- Kalidasan, B.; Pandey, A.K.; Rahman, S.; Sharma, K.; Tyagi, V.V. Experimental Investigation of Graphene Nanoplatelets Enhanced Low Temperature Ternary Eutectic Salt Hydrate Phase Change Material. Energies 2023, 16, 1574. [Google Scholar] [CrossRef]
- Praveen, B.; Suresh, S.; Pethurajan, V. Heat Transfer Performance of Graphene Nano-Platelets Laden Micro-Encapsulated PCM with Polymer Shell for Thermal Energy Storage Based Heat Sink. Appl. Therm. Eng. 2019, 156, 237–249. [Google Scholar] [CrossRef]
- Anand, G.; Odillard, L.; Kibet, A.M. Performance Optimization by Study of Tribological and Rheological Properties of Dates Oil with Graphene Oxide Nano-Additives. Biofuels 2022, 13, 1055–1061. [Google Scholar] [CrossRef]
- Schmidts, T.; Dobler, D.; Guldan, A.C.; Paulus, N.; Runkel, F. Multiple W/O/W Emulsions-Using the Required HLB for Emulsifier Evaluation. Colloids Surf. A Physicochem. Eng. Asp. 2010, 372, 48–54. [Google Scholar] [CrossRef]
- Dickinson, E. Hydrocolloids as Emulsifiers and Emulsion Stabilizers. Food Hydrocoll. 2009, 23, 1473–1482. [Google Scholar] [CrossRef]
- Udomrati, S.; Cheetangdee, N.; Gohtani, S.; Surojanametakul, V.; Klongdee, S. Emulsion Stabilization Mechanism of Combination of Esterified Maltodextrin and Tween 80 in Oil-in-Water Emulsions. Food Sci. Biotechnol. 2020, 29, 387. [Google Scholar] [CrossRef]
- Lobo, L. Coalescence during Emulsification: 3. Effect of Gelatin on Rupture and Coalescence. J. Colloid Interface Sci. 2002, 254, 165–174. [Google Scholar] [CrossRef]
- Zhang, T.; Xu, J.; Zhang, Y.; Wang, X.; Lorenzo, J.M.; Zhong, J. Gelatins as Emulsifiers for Oil-in-Water Emulsions: Extraction, Chemical Composition, Molecular Structure, and Molecular Modification. Trends Food Sci. Technol. 2020, 106, 113–131. [Google Scholar] [CrossRef]
- Sta Maria, I.D.; Lim, M.W.; Lau, E. Von Multiple Roles of Graphene Nanoparticles (GNP) in Microbubble Flotation for Crude Oil Recovery from Sand. Results Eng. 2021, 11, 100271. [Google Scholar] [CrossRef]
- Mustapha, A.N.; Zhang, Y.; Zhang, Z.; Ding, Y.; Yuan, Q.; Li, Y. Taguchi and ANOVA Analysis for the Optimization of the Microencapsulation of a Volatile Phase Change Material. J. Mater. Res. Technol. 2021, 11, 667–680. [Google Scholar] [CrossRef]
- Brown, E.N.; Kessler, M.R.; Sottos, N.R.; White, S.R. In Situ Poly(Urea-Formaldehyde) Microencapsulation of Dicyclopentadiene. J. Microencapsul. 2003, 20, 719–730. [Google Scholar] [CrossRef]
- Schönemann, A.; Edwards, H.G.M. Raman and FTIR Microspectroscopic Study of the Alteration of Chinese Tung Oil and Related Drying Oils during Ageing. Anal. Bioanal. Chem. 2011, 400, 1173–1180. [Google Scholar] [CrossRef] [PubMed]
- Zhang, Y.; Wang, Y.; Li, Y.; Zhang, Z. The Mechanical Properties of Poly (Urea-Formaldehyde) Incorporated with Nano-SiO2 by Molecular Dynamics Simulation. Polymers 2019, 11, 1447. [Google Scholar] [CrossRef] [PubMed]
- Wu, W.; Chu, L.; Garcia, S.J.; van der Zwaag, S.; Li, M.; Shen, L.; Bao, N. Fabrication of Graphene Oxide-Modified Self-Healing Microcapsules for Cardanol-Based Epoxy Anti-Corrosion Coatings. Prog. Org. Coat. 2023, 183, 107777. [Google Scholar] [CrossRef]
- Cui, G.; Zhang, C.; Wang, A.; Zhou, X.; Xing, X.; Liu, J.; Li, Z.; Chen, Q.; Lu, Q. Research Progress on Self-Healing Polymer/Graphene Anticorrosion Coatings. Prog. Org. Coat. 2021, 155, 106231. [Google Scholar] [CrossRef]
- Meurer, J.; Hniopek, J.; Ahner, J.; Schmitt, M.; Popp, J.; Zechel, S.; Peneva, K.; Hager, M.D. In-Depth Characterization of Self-Healing Polymers Based on π–π Interactions. Beilstein J. Org. Chem. 2021, 17, 2496–2504. [Google Scholar] [CrossRef]
- Cunha, E.; Ren, H.; Lin, F.; Kinloch, I.A.; Sun, Q.; Fan, Z.; Young, R.J. The Chemical Functionalization of Graphene Nanoplatelets through Solvent-Free Reaction. RSC Adv. 2018, 8, 33564–33573. [Google Scholar] [CrossRef] [PubMed]


| Sample | Uniformity * | Ds, μm | Dv, μm | Dv (10), μm | Dv (50), μm | Dv (90), μm |
|---|---|---|---|---|---|---|
| Pure TO/gel | 1.1 | 3.7 | 10.7 | 1.6 | 6.6 | 26.0 |
| 1% TO-GNP/gel | 0.8 | 2.9 | 7.9 | 1.2 | 6.0 | 17.4 |
| 3% TO-GNP/gel | 0.9 | 3.4 | 10.5 | 1.4 | 7.6 | 23.1 |
| 5% TO-GNP/gel | 2.1 | 3.3 | 19.4 | 1.3 | 7.7 | 25.6 |
| Pure TO/tween 80 | 0.5 | 5.7 | 11.6 | 2.8 | 10.6 | 21.6 |
| 1% TO-GNP/tween 80 | 0.8 | 5.2 | 13.5 | 2.2 | 10.7 | 28.8 |
| 3% TO-GNP/tween 80 | 1.0 | 4.6 | 14.3 | 2.0 | 10.0 | 33.6 |
| 5% TO-GNP/tween 80 | 0.7 | 6.4 | 15.6 | 2.8 | 12.8 | 32.6 |
| 5% TO-GNP/gel/ tween 80 | 2.4 | 1.9 | 12 | 0.82 | 4.3 | 23.9 |
| Sample | Diameter (D), µm | Displacement at Rupture (δr), µm | Rupture Force (Fr), mN | Apparent Toughness (Tc), MPa | Apparent Young’s Modulus (E), MPa |
|---|---|---|---|---|---|
| Pure TO MC | 9.7 ± 0.8 | 3.0 ± 0.7 | 0.25 ± 0.10 | 0.52 ± 0.30 | 28 ± 4 |
| 1% GNP/TO MC | 15.2 ± 1.0 | 7.6 ± 0.5 | 0.76 ± 0.06 | 0.89 ± 0.10 | 39 ± 3 |
| 3% GNP/TO MC | 12.9 ± 0.7 | 6.6 ± 0.4 | 0.63 ± 0.04 | 0.82 ± 0.07 | 40 ± 2 |
| 5% GNP/TO MC | 11.2 ± 0.4 | 6.3 ± 0.2 | 0.66 ± 0.04 | 0.89 ± 0.06 | 38 ± 3 |
| Sample | Adhesion Strength (MPa) |
|---|---|
| Pure coating only | 12.82 ± 0.03 |
| Pure TO MC | 12.61± 0.05 |
| 1% GNP/TO MC | 12.22 ± 0.07 |
| 3% GNP/TO MC | 12.18 ± 0.06 |
| 5% GNP/TO MC | 12.16 ± 0.04 |
| Sample | Healing Efficiency (%) |
|---|---|
| Pure coating only | 3 ± 1 |
| Pure TO MC | 87± 1 |
| 1% GNP/TO MC | 91 ± 2 |
| 3% GNP/TO MC | 91 ± 1 |
| 5% GNP/TO MC | 93 ± 2 |
Disclaimer/Publisher’s Note: The statements, opinions and data contained in all publications are solely those of the individual author(s) and contributor(s) and not of MDPI and/or the editor(s). MDPI and/or the editor(s) disclaim responsibility for any injury to people or property resulting from any ideas, methods, instructions or products referred to in the content. |
© 2024 by the authors. Licensee MDPI, Basel, Switzerland. This article is an open access article distributed under the terms and conditions of the Creative Commons Attribution (CC BY) license (https://creativecommons.org/licenses/by/4.0/).
Share and Cite
Mustapha, A.N.; AlMheiri, M.; AlShehhi, N.; Rajput, N.; Matouk, Z.; Tomić, N. The Incorporation of Graphene Nanoplatelets in Tung Oil–Urea Formaldehyde Microcapsules: A Paradigm Shift in Physicochemical Enhancement. Polymers 2024, 16, 909. https://doi.org/10.3390/polym16070909
Mustapha AN, AlMheiri M, AlShehhi N, Rajput N, Matouk Z, Tomić N. The Incorporation of Graphene Nanoplatelets in Tung Oil–Urea Formaldehyde Microcapsules: A Paradigm Shift in Physicochemical Enhancement. Polymers. 2024; 16(7):909. https://doi.org/10.3390/polym16070909
Chicago/Turabian StyleMustapha, Abdullah Naseer, Maitha AlMheiri, Nujood AlShehhi, Nitul Rajput, Zineb Matouk, and Nataša Tomić. 2024. "The Incorporation of Graphene Nanoplatelets in Tung Oil–Urea Formaldehyde Microcapsules: A Paradigm Shift in Physicochemical Enhancement" Polymers 16, no. 7: 909. https://doi.org/10.3390/polym16070909
APA StyleMustapha, A. N., AlMheiri, M., AlShehhi, N., Rajput, N., Matouk, Z., & Tomić, N. (2024). The Incorporation of Graphene Nanoplatelets in Tung Oil–Urea Formaldehyde Microcapsules: A Paradigm Shift in Physicochemical Enhancement. Polymers, 16(7), 909. https://doi.org/10.3390/polym16070909