

Analysis of the Anisotropy of Sound Propagation Velocity in Thin Wooden Plates Using Lamb Waves

 , , , ,
Abstract
1. Introduction
2. Materials and Methods
2.1. Materials
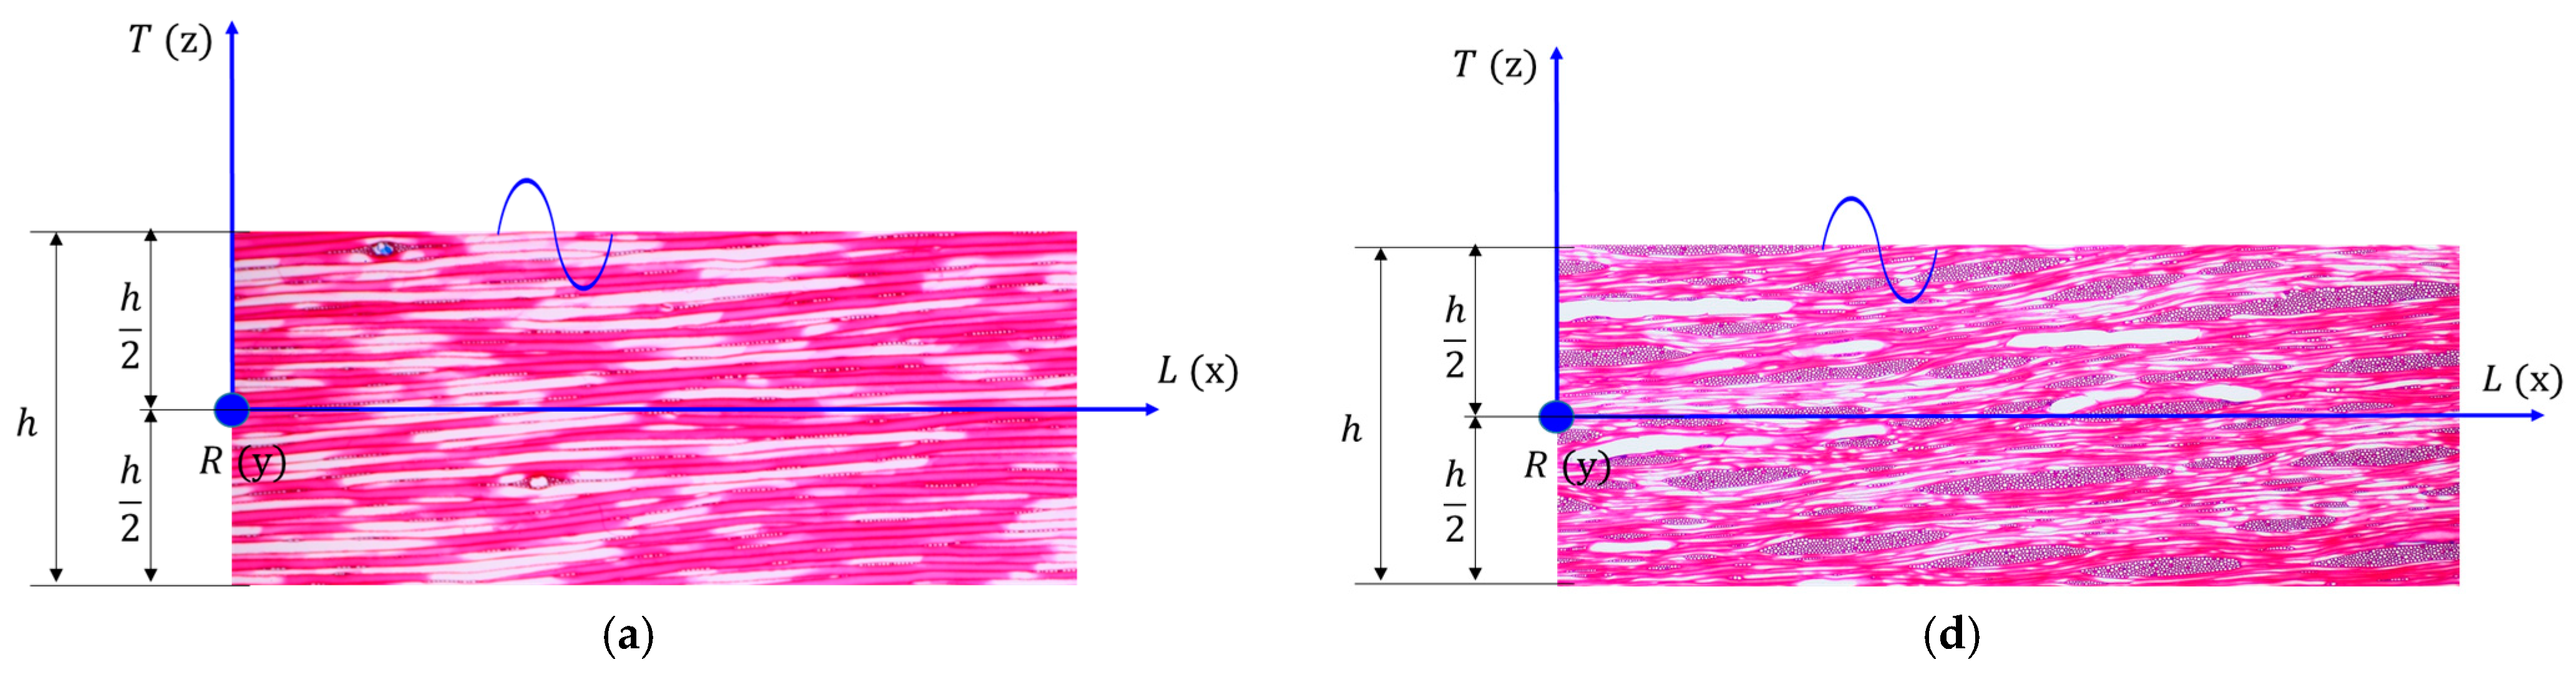
2.2. Methods
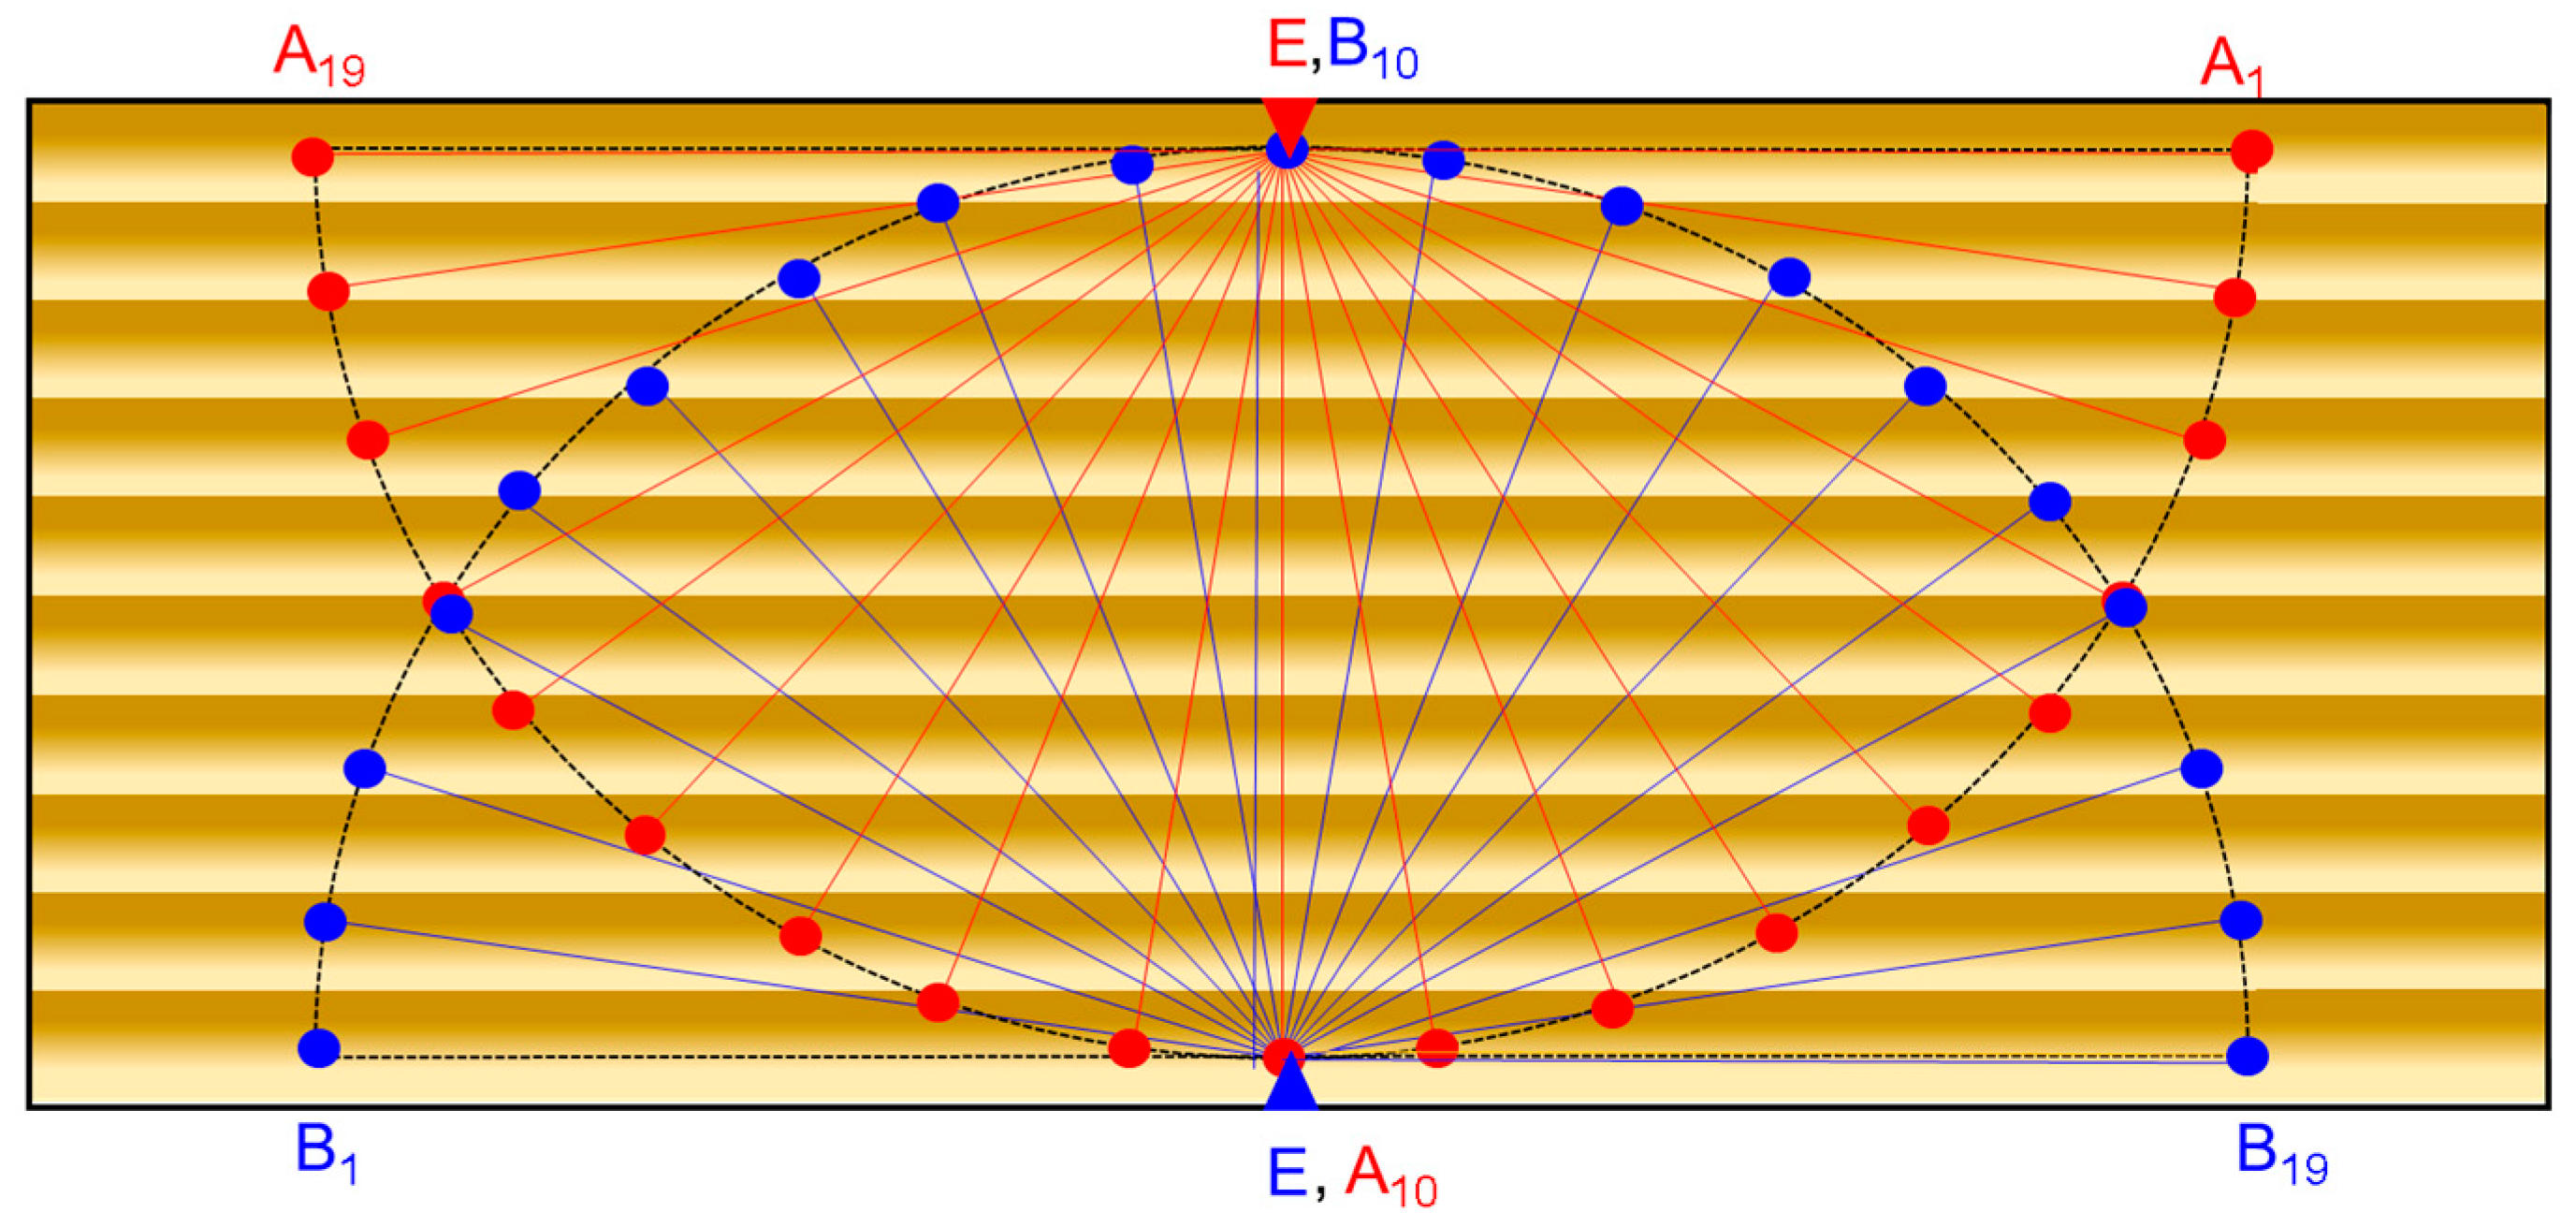
2.2.1. Experimental Set-Up
2.2.2. Statistical Analysis
3. Results and Discussion
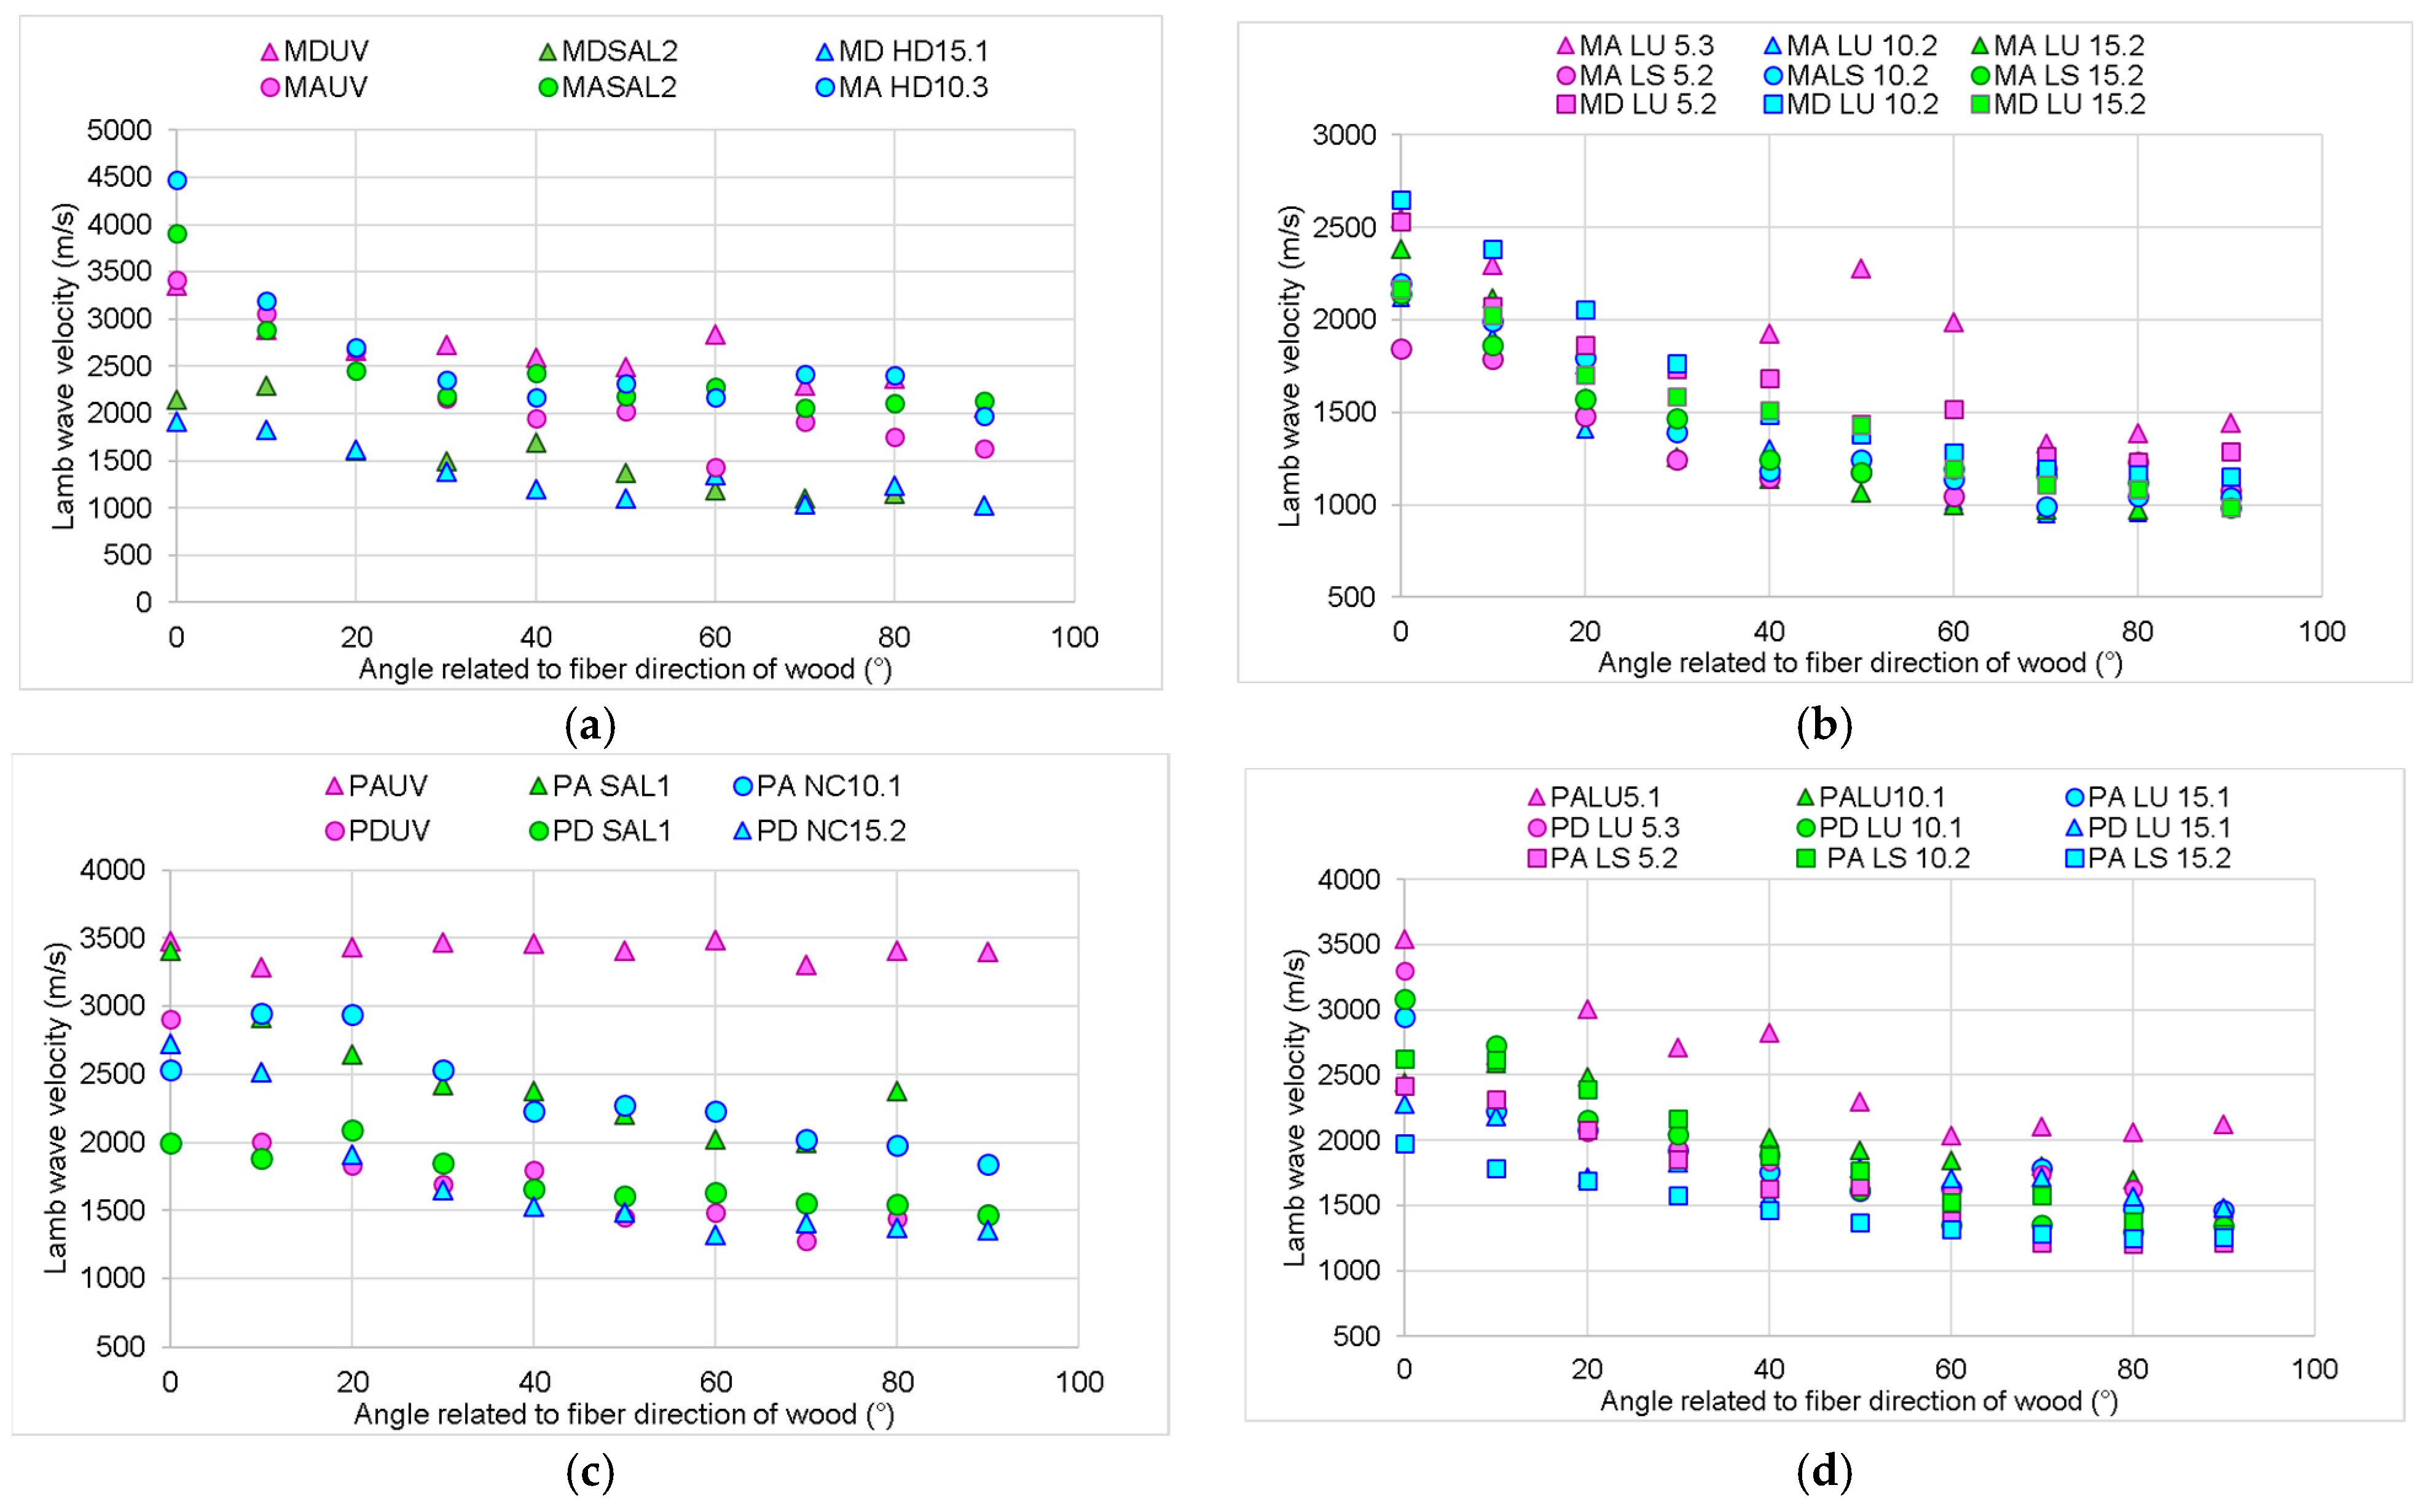
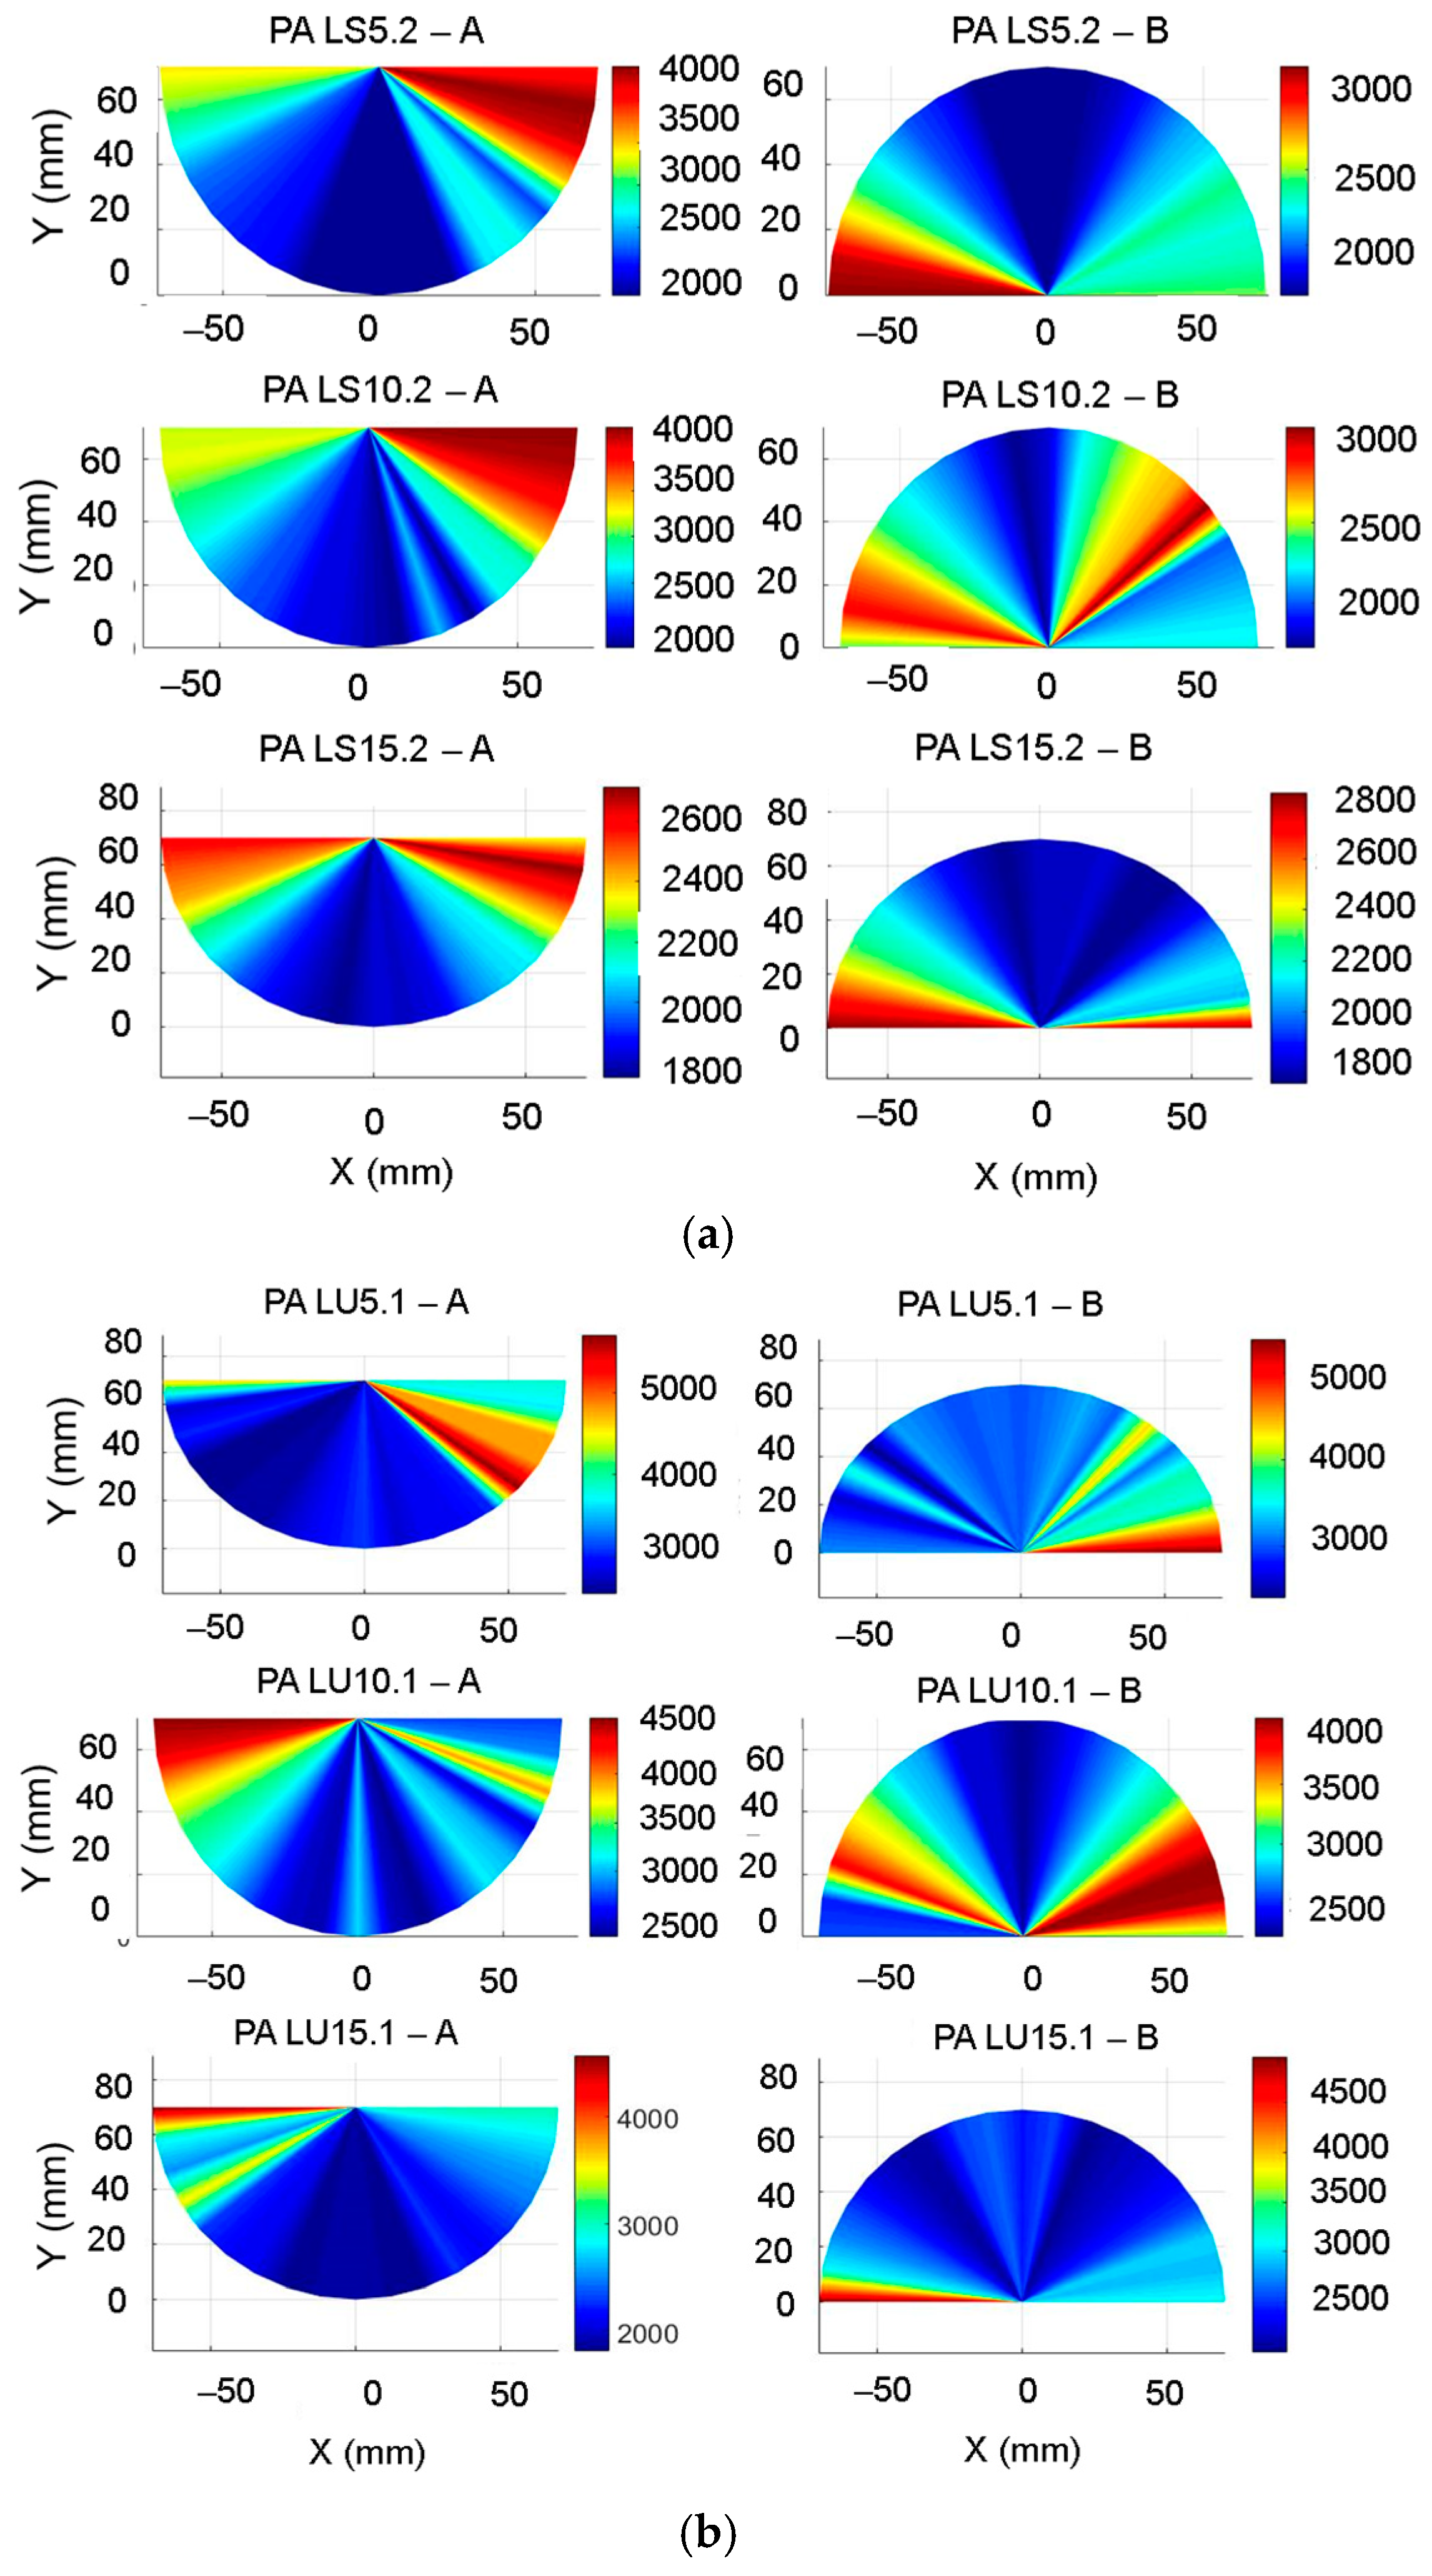
3.1. Grain Angle Dependence of Lamb Wave Velocity in Wooden Plates
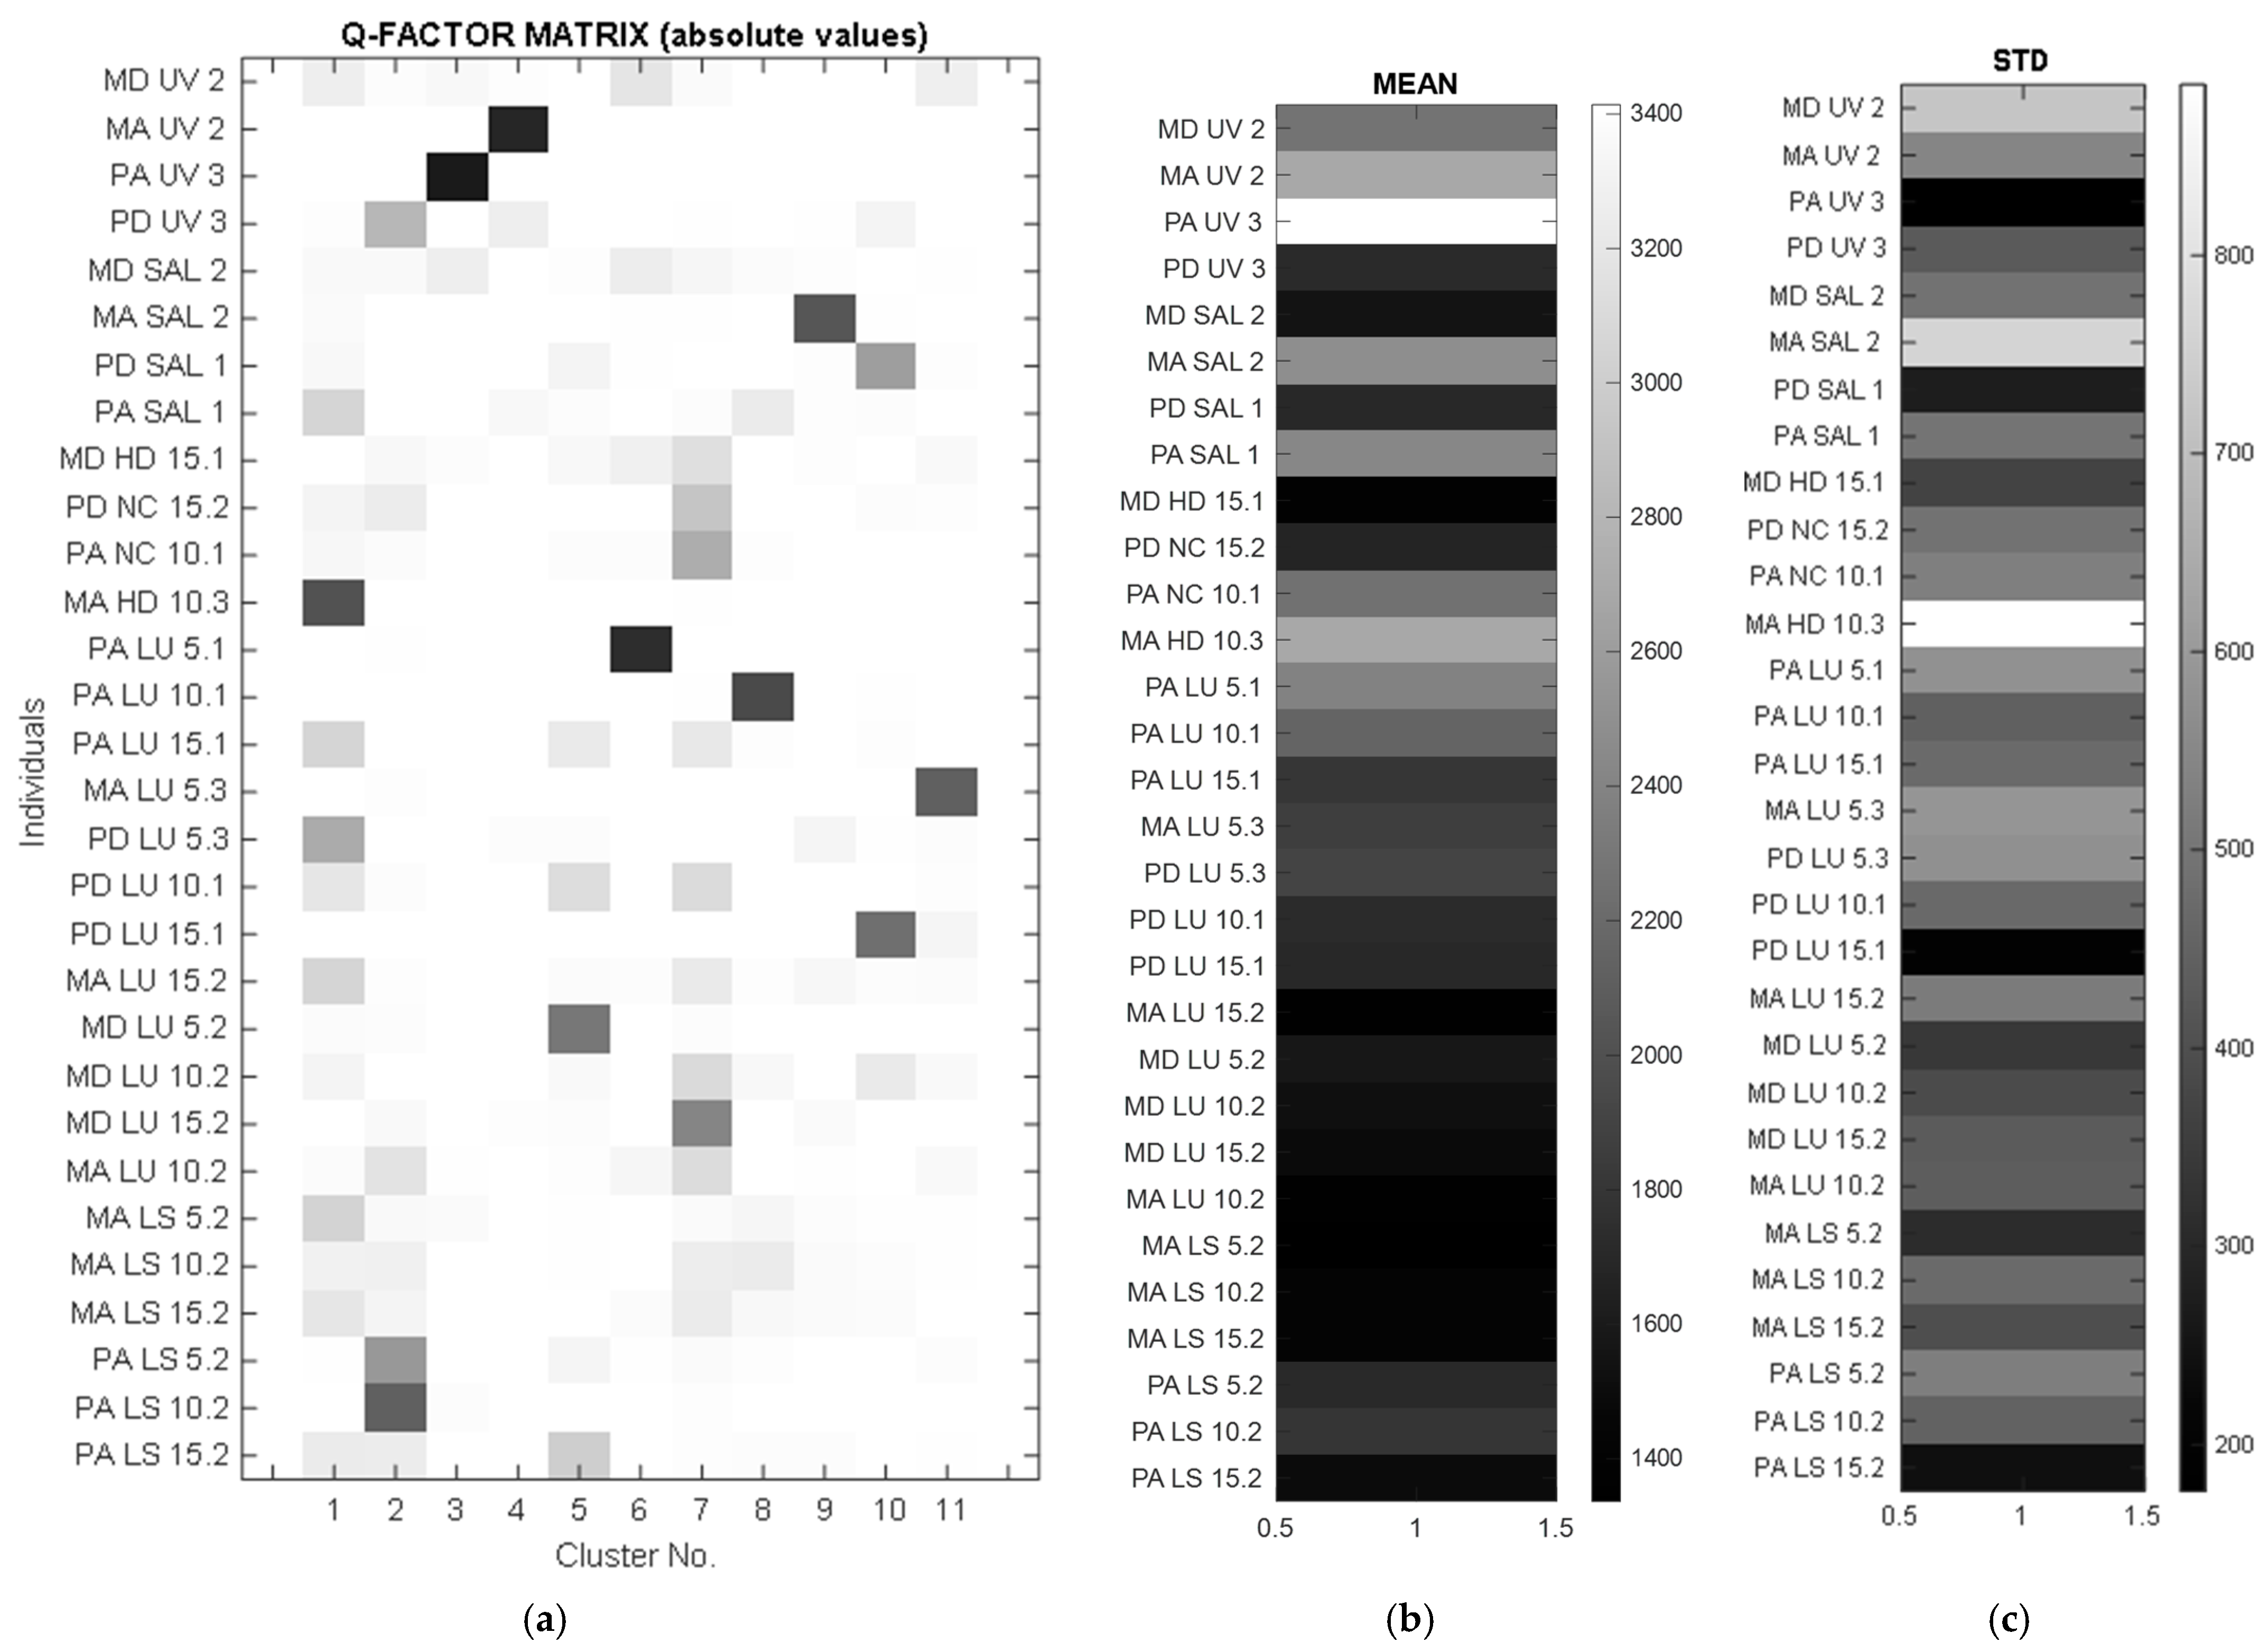
3.2. Statistical Results
4. Conclusions
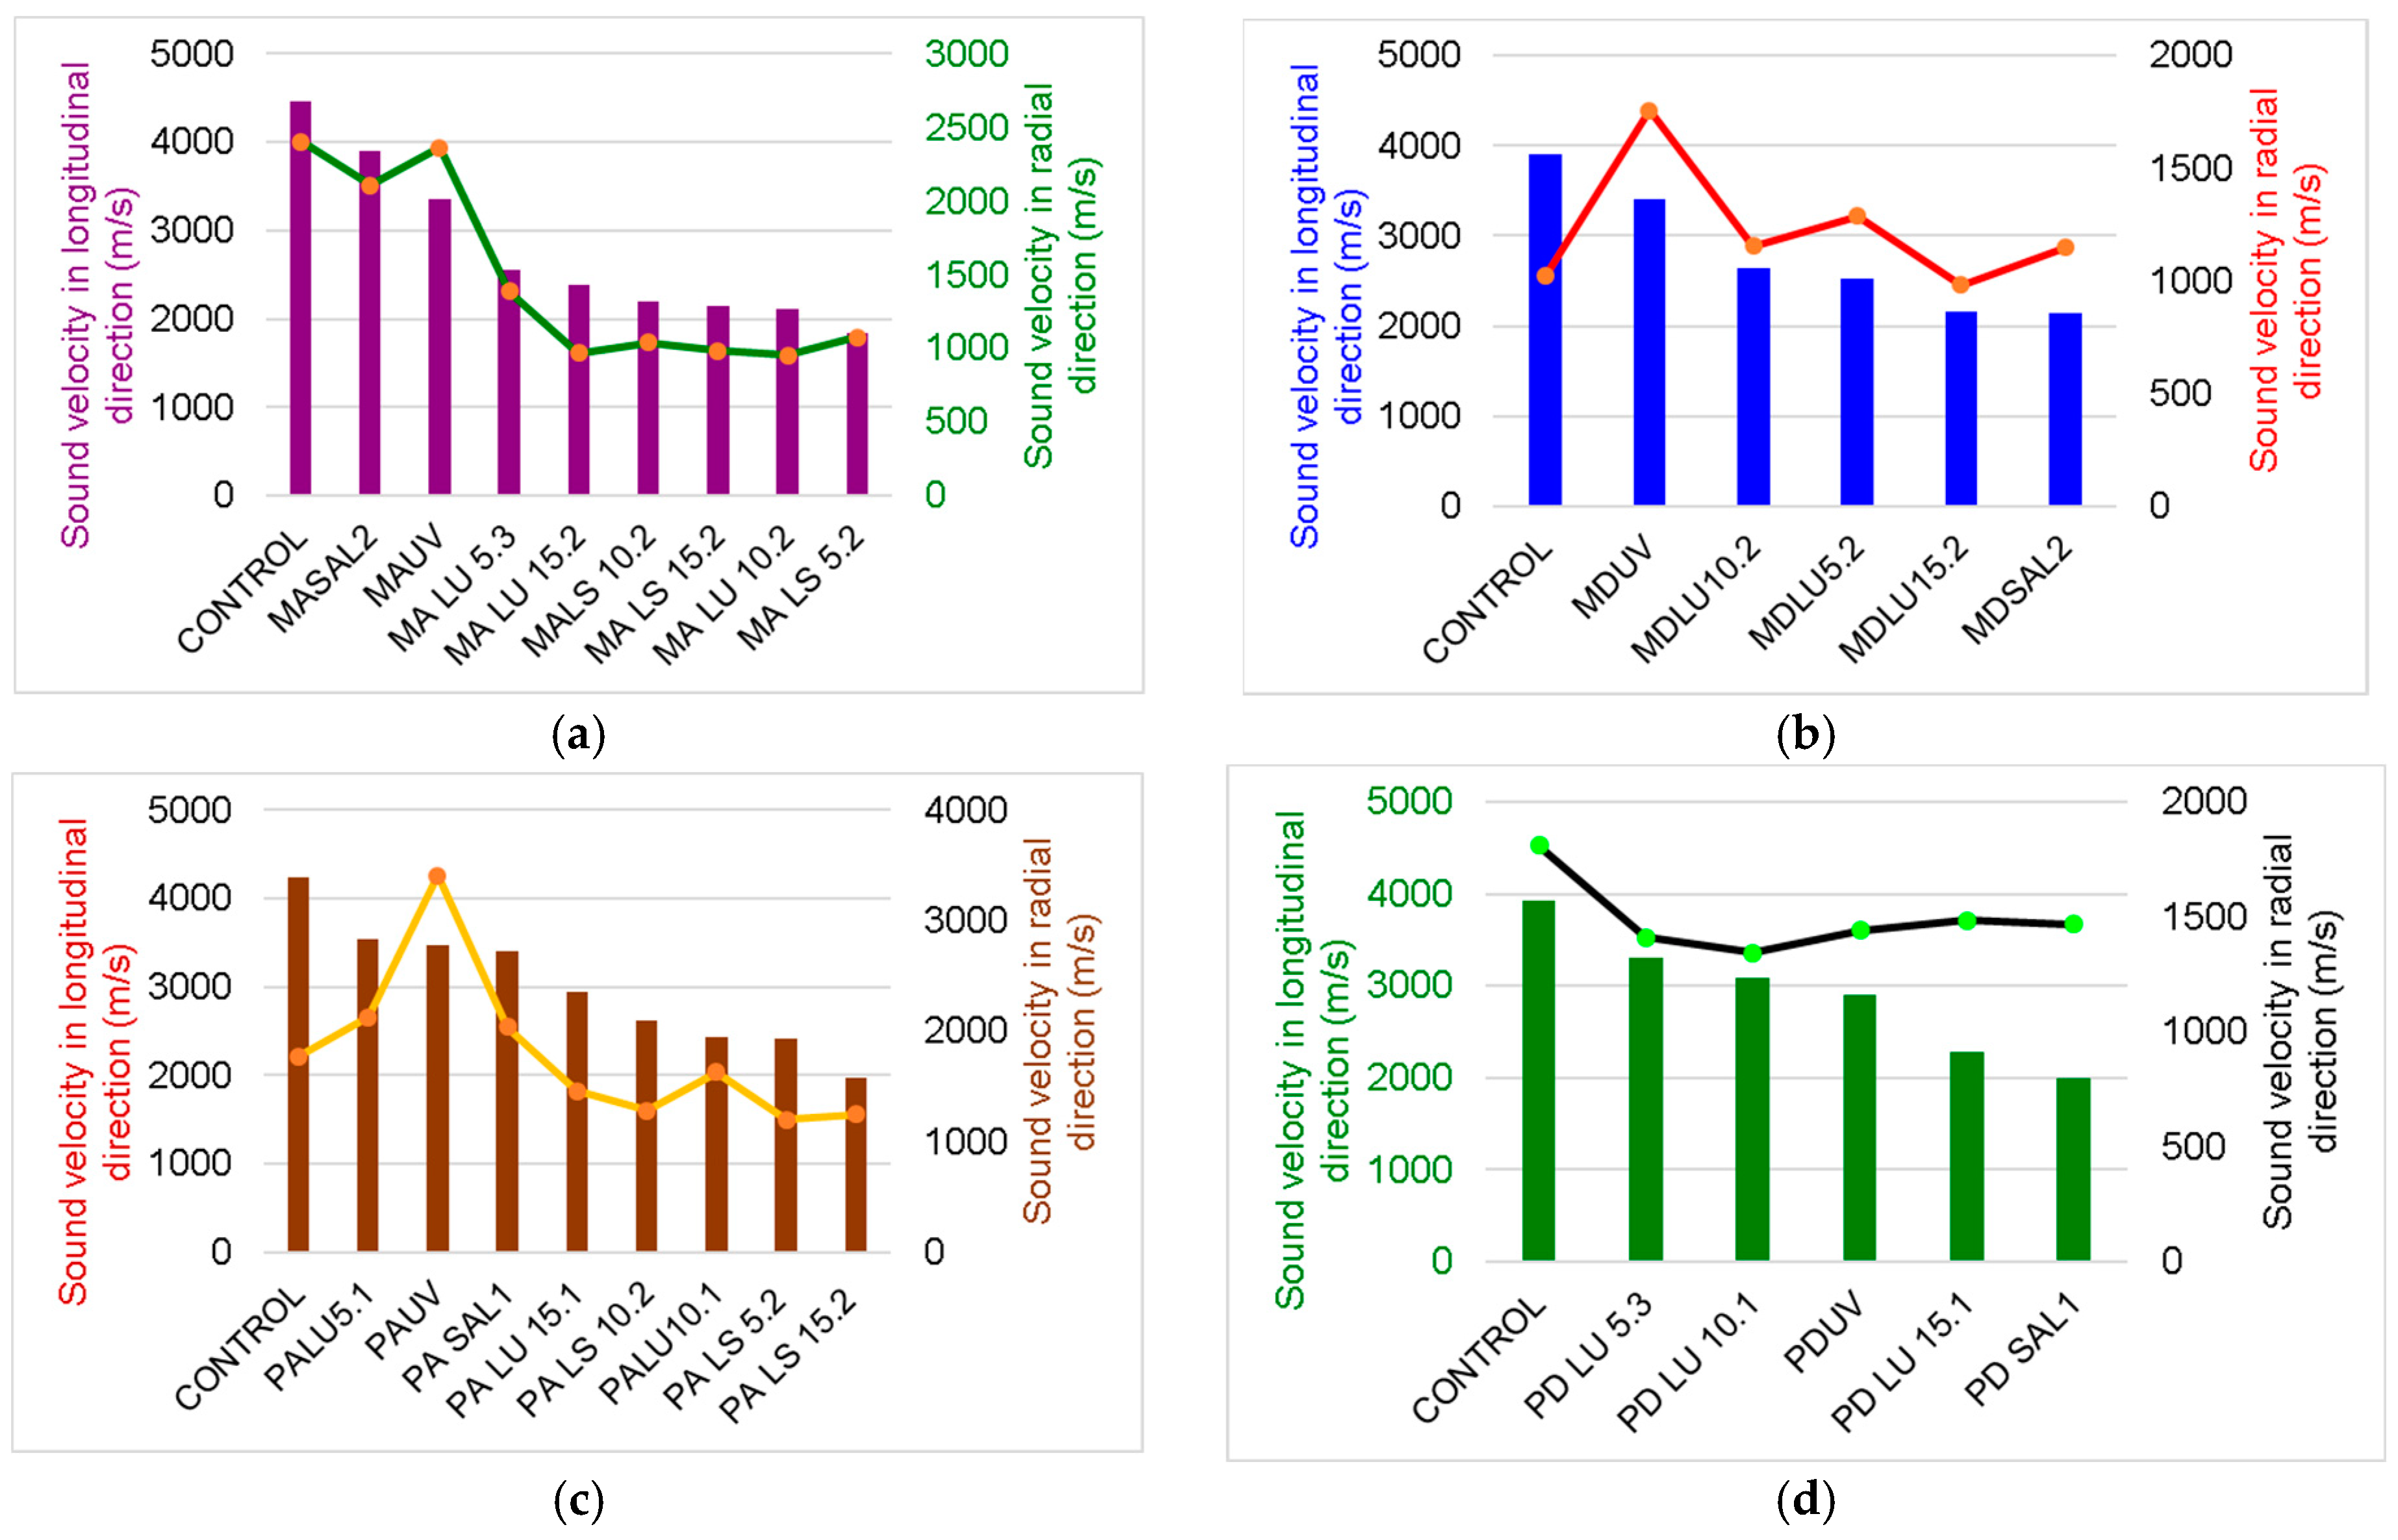
- The treatment applied to the surface of the wooden resonance plates influences the sound propagation speed both in the longitudinal and radial directions. The acoustic behavior of the wood depends both on the type of treatment and the anatomical characteristics of the wood, with differences in propagation speeds being recorded between samples of the same woody species but with different anatomical structures.
- In spruce wood samples, the film of alcohol varnish reduces the speed of propagation of sounds by approximately 42–58% in the longitudinal direction, and in the radial direction, the oil-based varnish reduces the speed of propagation by 60%.
- In the maple wood samples, the anisotropy ratio between the longitudinal and radial directions decreases with the increase in the thickness of the varnish film.
Author Contributions
Funding
Institutional Review Board Statement
Data Availability Statement
Acknowledgments
Conflicts of Interest
References
- Wegst, U.G.K. Wood for sound. Am. J. Bot. 2006, 93, 1439–1448. [Google Scholar] [CrossRef] [PubMed]
- Obataya, E.; Ono, T.; Norimoto, M. Vibrational properties of wood along the grain. J. Mater. Sci. 2000, 35, 2993–3001. [Google Scholar] [CrossRef]
- Brémaud, I.; Gril, J.; Thibaut, B. Anisotropy of wood vibrational properties: Dependence on grain angle and review of literature data. Wood Sci. Technol. 2011, 45, 735–754. [Google Scholar] [CrossRef]
- Ono, T. Effect of grain angle on dynamic mechanical properties of wood. J. Soc. Mater. Sci. Jpn. 1983, 32, 108–113. [Google Scholar] [CrossRef]
- Sedighi Gilani, M.; Pflaum, J.; Hartmann, S.; Kaufmann, R.; Baumgartner, M.; Schwarze, F.W.M.R. Relationship of vibro-mechanical properties and microstructure of wood and varnish interface in string instruments. Appl. Phys. A 2016, 122, 260. [Google Scholar] [CrossRef]
- Bucur, V. Handbook of Materials for String Musical Instruments; Springer: Berlin/Heidelberg, Germany, 2016. [Google Scholar] [CrossRef]
- Bernabei, M.; Bontadi, J. Determining the resonance wood provenance of stringed instruments from the Cherubini Conservatory Collection in Florence, Italy. J. Cult. Herit. 2011, 12, 196–204. [Google Scholar] [CrossRef]
- Schmidt-Vogt, H. Die Fichte Band I. Taxonomie-Verbreitung-Morphologie-Ökologie-Waldgesellschaften; Paul Parey: Hamburg/Berlin, Germany, 1977. [Google Scholar]
- Dinulică, F.; Albu, C.T.; Borz, S.A.; Vasilescu, M.M.; Petritan, I.C. Specific structural indexes for resonance Norway spruce wood used for violin manufacturing. Bioresources 2015, 10, 7525–7543. [Google Scholar] [CrossRef]
- Dinulică, F.; Stanciu, M.D.; Savin, A. Correlation between Anatomical Grading and Acoustic–Elastic Properties of Resonant Spruce Wood Used for Musical Instruments. Forests 2021, 12, 1122. [Google Scholar] [CrossRef]
- Viala, R.; Placet, V.; Cogan, S. Simultaneous non-destructive identification of multiple elastic and damping properties of spruce tonewood to improve grading. J. Cult. Herit. 2020, 42, 108–116. [Google Scholar] [CrossRef]
- Carlier, C.; Alkadri, A.; Gril, J.; Bremaud, I. Revisiting the notion of “resonance wood” choice: A decompartementalised approach from violin makers’ opinion and perception to characterization of material properties variability. wooden musical instruments. Wooden musical instruments—Different forms of knowledge: Book of end of WoodMusICK COST Action FP1302. 2018, pp. 119–142. Available online: https://hal.science/hal-02051004/document (accessed on 16 January 2024).
- Caldersmith, G. Vibrations of orthotropic rectangular plates. Acta Acust. United Acust. 1984, 56, 144–152. [Google Scholar]
- Mclntyre, M.; Woodhouse, J. On measuring wood properties, part 1–3. J. Catgut Acoust. Soc. 1984, 42, 1984–1986. [Google Scholar]
- Warguła, Ł.; Wojtkowiak, D.; Kukla, M.; Talaśka, K. Symmetric nature of stress distribution in the elastic-plastic range of Pinus L. pine wood samples determined experimentally and using the finite element method (FEM). Symmetry 2021, 13, 39. [Google Scholar] [CrossRef]
- Wang, R.; Liang, F.; Wang, B.; Mou, X. ODCA-YOLO: An Omni-Dynamic Convolution Coordinate Attention-Based YOLO for Wood Defect Detection. Forests 2023, 14, 1885. [Google Scholar] [CrossRef]
- Gonçalves, R.; Trinca, A.J.; Cerri, D.G.P. Comparison of elastic constants of wood determined by ultrasonic wave propagation and static compression testing. Wood Fiber Sci. 2011, 43, 64–75. [Google Scholar]
- Duquenme, L.; Moulin, E.; Assood, J.; Grandel, S. Transient modeling of Lamb wave generated in viscoelastic materials by surface bonded piezoelectric transducers. J. Acoust. Soc. Am. 2004, 116, 133–141. [Google Scholar] [CrossRef]
- Fang, Y.; Lin, L.; Feng, H.; Lu, Z.; Emms, G.W. Review of the use of air-coupled ultrasonic technologies for nondestructive testing of wood and wood products. Comput. Electron. Agric. 2017, 137, 79–87. [Google Scholar] [CrossRef]
- Bucur, V.; Archer, R.R. Elastic constants for wood by an ultrasonic method. Wood Sci. Technol. 1984, 18, 255–265. [Google Scholar] [CrossRef]
- Bucur, V. Varieties of resonance wood and their elastic constants. J. Catgut Acoust. Soc. 1987, 47, 42–48. [Google Scholar]
- Bucur, V. Wood structural anisotropy estimated by acoustic invariants. IAWA Bull. 1988, 9, 67–74. [Google Scholar] [CrossRef]
- Dinulică, F.; Savin, A.; Stanciu, M.D. Physical and Acoustical Properties of Wavy Grain Sycamore Maple (Acer pseudoplatanus L.) Used for Musical Instruments. Forests 2023, 14, 197. [Google Scholar] [CrossRef]
- Schmerr, L.W., Jr. Fundamentals of Ultrasonic Nondestructive Evaluation—A Modeling Approach; Plenum Press: New York, NY, USA, 1998. [Google Scholar]
- Grimberg, R.; Savin, A.; Steigmann, R.; Stanciu, M.D.; Grum, J. Determination of Elastic Properties of CFRP Using Lamb Waves Resonant Spectroscopy. In Proceedings of the 2nd International Symposium on NDT in Aerospace, Hamburg, Germany, 22–24 November 2010. [Google Scholar]
- Alleyne, D.N.; Cawley, P. A two dimensional Fourier transform method for the measurement of propagating multimode signals. J. Acoust. Soc. Am. 1991, 89, 1159–1168. [Google Scholar] [CrossRef]
- Neau, G.; Deschamps, M.; Lowe, M.J.S. Group velocity of Lamb waves in anisotropic plates: Comparison between theory and experiments. AIP Conf. Proc. 2001, 557, 81–88. [Google Scholar] [CrossRef]
- Kuznetsov, S.V. Resonance phenomena in layered media: Merging proper and quasi-resonances. Z. Angew. Math. Phys. 2023, 74, 245. [Google Scholar] [CrossRef]
- Nowak, T.; Hamrol-Bielecka, K.; Jasienko, J. Non-destructive testing of wood–correlation of ultrasonic and stress wave test results in glued laminated timber members. Annals of Warsaw University of Life Sciences-SGGW. For. Wood Technol. 2015, 92, 317–324. [Google Scholar]
- ISO 13061-1:2014/Amd 1:2017; Physical and Mechanical Properties of Wood. Test Methods for Small Clear Wood Specimens. Part 1: Determination of Moisture Content for Physical and Mechanical Tests. ISO: Geneva, Switzerland, 2017.
- Schelleng, J.C. Acoustical Effects of Violin Varnish. J. Acoust. Soc. Am. 1968, 4, 1175–1183. [Google Scholar] [CrossRef]
- Schleske, M. Contemporary violin making. Analysis of design, materials, varnish and normal modes. Catgut Acoust. Soc. J. 2002, 4, 50–65. [Google Scholar]
- Nagyvary, J.; Guillemette, R.N.; Spiegelman, C.H. Mineral Preservatives in the Wood of Stradivari and Guarneri. PLoS ONE 2009, 4, e4245. [Google Scholar] [CrossRef] [PubMed]
- Cai, W.; Tai, H.-C. String Theories: Chemical Secrets of Italian Violins and Chinese Guqins. AsiaChem 2020, 11, 10–17. [Google Scholar] [CrossRef]
- Skrodzka, E.B.; Linde, B.J.B.; Krupa, A. Modal Parameters of Two Violins with Different Varnish Layers and Subjective Evaluation of Their Sound Quality. Arch. Acoust. 2013, 38, 75–81. [Google Scholar] [CrossRef]
- Lämmlein, S.L.; Van Damme, B.; Mannes, D.; Schwarze, F.W.M.; Burgert, I. Violin varnish induced changes in the vibro-mechanical properties of spruce and maple wood. Holzforschung 2020, 4, 765–776. [Google Scholar] [CrossRef]
- Odlyha, M.; Lucejko, J.J.; Lluveras-Tenorio, A.; di Girolamo, F.; Hudziak, S.; Strange, A.; Bridarolli, A.; Bozec, L.; Colombini, M.P. Violin Varnishes: Microstructure and Nanomechanical Analysis. Molecules 2022, 27, 6378. [Google Scholar] [CrossRef]
- Stanciu, M.D.; Cosnita, M.; Gliga, G.V.; Gurau, L.; Timar, C.M.; Guiman, M.V.; Năstac, S.M.; Roșca, I.C.; Bucur, V.; Dinulică, F. Tunable Acoustic Properties Using Different Coating Systems on Resonance Spruce Wood. Adv. Mat. Interfaces 2024, 1, 2300781. [Google Scholar] [CrossRef]
- Stobbe, D.M.; Grünsteidl, C.M.; Murray, T.W. Propagation and Scattering of Lamb Waves at Conical Points in Plates. Sci. Rep. 2019, 9, 15216. [Google Scholar] [CrossRef]
- Bucur, V. A Review on Acoustics of Wood as a Tool for Quality Assessment. Forests 2023, 14, 1545. [Google Scholar] [CrossRef]
- Fathi, H.; Kazemirad, S.; Nasir, V. A nondestructive guided wave propagation method for the characterization of moisture-dependent viscoelastic properties of wood materials. Mater. Struct. 2020, 53, 147. [Google Scholar] [CrossRef]
- Wiedenhoeft, A.C.; Miller, R.B. Structure and Function of Wood. In Handbook of Wood Chemistry and Wood Composites; Rowell, R.M., Ed.; CRC Press: Boca Raton, FL, USA, 2005. [Google Scholar]
- Dinulică, F. Forest Products: Structure and Properties of Wood (in Romanian Language); Publishing House Transilvania University of Brasov: Brasov, Romania, 2021. [Google Scholar]
- Gurău, L.; Timar, M.C.; Coșereanu, C.; Cosnita, M.; Stanciu, M.D. Aging of Wood for Musical Instruments: Analysis of Changes in Color, Surface Morphology, Chemical, and Physical-Acoustical Properties during UV and Thermal Exposure. Polymers 2023, 15, 1794. [Google Scholar] [CrossRef] [PubMed]
- Guiman, M.V.; Stanciu, M.D.; Roșca, I.C.; Georgescu, S.V.; Năstac, S.M.; Câmpean, M. Influence of the Grain Orientation of Wood upon Its Sound Absorption Properties. Materials 2023, 16, 5998. [Google Scholar] [CrossRef]
- Spycher, M.; Schwarze, F.W.M.R.; Steiger, R. Assesment of resonance wood quality by comparing its physical and histological properties. Wood Sci. Technol. 2008, 42, 325–342. [Google Scholar] [CrossRef]
- Crețu, N.; Roșca, I.C.; Stanciu, M.D.; Gliga, V.G.; Cerbu, C. Evaluation of Wave Velocity in Orthotropic Media Based on Intrinsic Transfer Matrix. Exp. Mech. 2022, 62, 1595–1602. [Google Scholar] [CrossRef]


| Samples Code | WS | ρ (kgm−3) | EMC (%) | AML (g/m2) | T |
|---|---|---|---|---|---|
| MDHD15.1 | spruce | 391.01 (33.42) | 6.4 (0.4) | 0.000 | Untreated |
| MAHD10.3 | spruce | 470.83 (18.68) | 7.9 (0.5) | 0.000 | |
| PDNC15.1 | maple | 605.72 (17.54) | 6.1 (0.3) | 0.000 | |
| PANC10.1 | maple | 656.90 (15.82) | 7.3 (0.5) | 0.000 | |
| MDUV2 | spruce | 421.50 (27.92) | 6.8 (0.5) | −10.318 | UV exposure 300 h |
| MAUV2 | spruce | 473.45 (18.32) | 6.2 (0.4) | −13.979 | |
| PDUV3 | maple | 565.40 (17.62) | 6.2 (0.2) | −12.432 | |
| PAUV3 | maple | 640.36 (11.75) | 6.4 (0.7) | −17.813 | |
| MDSAL2 | spruce | 429.33 (10.19) | 8.3 (1.3) | 16.047 | Salt fog exposure NaCl 3.5% 72 h |
| MASAL2 | spruce | 491.16 (13.81) | 8.8 (1.4) | 21.563 | |
| PDSAL1 | maple | 679.17 (35.24) | 9.1 (1.2) | 27.135 | |
| PASAL1 | maple | 669.77 (24.71) | 8.5 (1.8) | 30.146 | |
| MALU5.3 | spruce | 399.31 (45.60) | 7.4 (0.9) | 11.755 | 5 layers of oil-based varnish |
| MDLU5.2 | spruce | 407.85 (37.50) | 7.8 (0.7) | 9.807 | |
| PALU5.1 | maple | 662.57 (33.14) | 8.4 (0.6) | 8.375 | |
| PDLU5.3 | maple | 652.23 (19.20) | 7.4 (0.5) | 6.938 | |
| MALU10.2 | spruce | 556.98 (29.40) | 7.8 (0.3) | 15.969 | 10 layers of oil-based varnish |
| MDLU10.2 | spruce | 496.42 (32.12) | 7.3 (0.7) | 17.526 | |
| PALU10.1 | maple | 705.36 (41.24) | 8.7 (0.3) | 14.708 | |
| PDLU10.1 | maple | 611.77 (32.15) | 8.2 (0.4) | 14.380 | |
| MALU15.2 | spruce | 522.55 (21.35) | 8.0 (0.5) | 22.979 | 15 layers of oil-based varnish |
| MDLU15.2 | spruce | 511.99 (22.31) | 7.9 (0.4) | 23.599 | |
| PALU15.1 | maple | 744.69 (34.32) | 8.3 (0.3) | 23.443 | |
| PDLU15.1 | maple | 694.91 (21.12) | 7.8 (0.6) | 24.229 | |
| MALS5.2 | spruce | 430.08 (36.23) | 7.2 (0.4) | 2.865 | 5 layers of spirit varnish |
| PALS5.2 | maple | 657.79 (15.43) | 7.3 (0.2) | 11.453 | |
| MALS10.2 | spruce | 417.60 (18.45) | 7.5 (0.2) | 7.042 | 10 layers of spirit varnish |
| PALS10.2 | maple | 672.47 (21.34) | 7.1 (0.3) | 12.896 | |
| MALS15.2 | spruce | 491.42 (35.82) | 7.6 (0.5) | 13.234 | 15 layers of spirit varnish |
| PALS15.2 | maple | 621.58 (28.12) | 7.7 (0.2) | 16.651 |
Disclaimer/Publisher’s Note: The statements, opinions and data contained in all publications are solely those of the individual author(s) and contributor(s) and not of MDPI and/or the editor(s). MDPI and/or the editor(s) disclaim responsibility for any injury to people or property resulting from any ideas, methods, instructions or products referred to in the content. |
© 2024 by the authors. Licensee MDPI, Basel, Switzerland. This article is an open access article distributed under the terms and conditions of the Creative Commons Attribution (CC BY) license (https://creativecommons.org/licenses/by/4.0/).
Share and Cite
Faktorová, D.; Stanciu, M.D.; Krbata, M.; Savin, A.; Kohutiar, M.; Chlada, M.; Năstac, S.M. Analysis of the Anisotropy of Sound Propagation Velocity in Thin Wooden Plates Using Lamb Waves. Polymers 2024, 16, 753. https://doi.org/10.3390/polym16060753
Faktorová D, Stanciu MD, Krbata M, Savin A, Kohutiar M, Chlada M, Năstac SM. Analysis of the Anisotropy of Sound Propagation Velocity in Thin Wooden Plates Using Lamb Waves. Polymers. 2024; 16(6):753. https://doi.org/10.3390/polym16060753
Chicago/Turabian StyleFaktorová, Dagmar, Mariana Domnica Stanciu, Michal Krbata, Adriana Savin, Marcel Kohutiar, Milan Chlada, and Silviu Marian Năstac. 2024. "Analysis of the Anisotropy of Sound Propagation Velocity in Thin Wooden Plates Using Lamb Waves" Polymers 16, no. 6: 753. https://doi.org/10.3390/polym16060753
APA StyleFaktorová, D., Stanciu, M. D., Krbata, M., Savin, A., Kohutiar, M., Chlada, M., & Năstac, S. M. (2024). Analysis of the Anisotropy of Sound Propagation Velocity in Thin Wooden Plates Using Lamb Waves. Polymers, 16(6), 753. https://doi.org/10.3390/polym16060753