Abstract
CO2 capture, applied in CO2 separation from natural gas or in CO2/N2 separation from power plant flue gas streams, is of great importance for technical, economic, and environmental reasons. The latter seems important because CO2, as a greenhouse gas, is considered the main contributor to global warming. Using polymeric membranes for CO2 separation presents several advantages, such as low energy demand, small equipment volume, and the absence of liquid waste. In this study, two ionic liquids (ILs) were used for the preparation of cellulose acetate (CA)–IL blend membranes for potential CO2 capture applications, namely, 1-butyl-3-methylimidazolium hydrogen sulfate ([]) and choline glycine (), as they present adequate CO2 dissolution ability. The first IL is commercially available, whereas the latter was synthesized by a novel route. Several composite membranes were prepared through the solvent casting technique and characterized by a variety of methods, including thermogravimetry, calorimetry, FTIR spectroscopy, and X-ray diffraction. The CO2 sorption in the composite membranes was experimentally measured using the mass loss analysis (MLA) technique. The results showed that the ILs strongly interacted with the C=O groups of CA, which exhibited high affinity with CO2. In the case of [], a reduction in the available sites that allow strong intermolecular interactions with CO2 resulted in a decrease in CO2 sorption compared to that of pure CA. In the case of , the reduction was balanced out by the presence of specific groups in the IL, which presented high affinity with CO2. Thus, the CA- blend membranes exhibited increased CO2 sorption capability, in addition to other advantages such as non-toxicity and low cost.
1. Introduction
CO2 capture is of great importance for technical, economic, and environmental reasons. Natural gas treatment, which includes CO2 separation from natural gas, is essential for meeting the pipeline flow specifications and increasing the heating value of the gas [1]. Other examples of industrial processes in which CO2 recovery is a crucial part of the overall procedure are CO2/N2 separation from power plant flue gas streams, CO2/H2 separation from fuel gas (syngas) in hydrogen production, and CO2/O2 separation in food packaging [2,3]. On the other hand, CO2, as a greenhouse gas, is considered the main contributor to climate change [4]. Different carbon capture (CC) technologies have been developed for CO2 recovery from the aforementioned gas streams, such as physical or chemical adsorption by liquid solvents, pressure or temperature swing adsorption, cryogenic distillation, and membrane separation [2,3]. Among the available carbon capture technologies, the absorption−desorption process using alkanolamines is considered the most mature one due to its extensive application for acid gas removal from natural gas streams [1,4]. Also, pressure swing adsorption (PSA) and cryogenic distillation technologies are used for CO2/H2 separation [5,6]. However, the major drawback of these technologies is their high energy consumption [7]. Also, chemical solvents, such as alkanolamines, due to their high volatility and significant degradation during thermal processes, are considered a potential threat to the environment and human health [8].
Using polymeric membranes for CO2 capture is an emerging, environmentally benign separation method due to its inherent merits over traditional chemical absorption, such as low energy demand, easy maintenance, and compactness of the separation medium [9]. Polymeric membranes were first commercialized in the 1980s for CO2 removal from natural gas [10]. Among the polymers used in membranes for gas separations are cellulose acetate, polyethersulfone, polyphenyl oxide, polyimides such as Matrimid®, and polycarbonates such as Kevlar® [11,12,13] (Figure S1 of the Supplementary Information file). Although such membranes have been used in gas separation processes for decades, their widespread use is limited, mainly due to their low separation efficiency and poor stability [11]. The semi-crystalline nature of these polymers results in decreased CO2 solubility, diffusivity, and permeability, increasing the required membrane area and consequently the capital and operational costs [14,15]. Another major drawback is the plasticization of such membranes in the presence of CO2 as well as other highly plasticizing components, such as hexane and toluene, included in some gas streams [16,17]. Research efforts have been directed to enhance separation efficiency in terms of the optimal combination of permeability, selectivity, and membrane stability and to reduce the plasticization effect of CO2 using various approaches, such as thermal treatment [16], chemical cross-linking [18,19], synthesis of poly-ionic liquids [20], and the use of polymer blends [21,22]. Although these approaches, in general, result in better stability, they are often related to lower gas permeability [11].
The introduction of a liquid into a supporting polymeric membrane (SLM) is a promising approach to improving the efficiency of such membranes because it induces CO2 diffusivity and may result in a significant improvement in CO2 permeability [23]. Despite such advantages, employing SLMs for CO2 capture in large-scale industrial applications is hindered by problems related to long term stability, mainly due to the extraction of the liquid from the polymer matrix [24,25] and solvent losses due to vaporization [26,27]. These drawbacks, combined with solvent losses due to swelling and leaching of the liquid solvent into a contacting liquid phase, for instance, in pervaporation, result in deterioration of the separation performance [24,25]. Also, solvents used in these processes are, in general, volatile, toxic, and highly flammable, thus raising environmental and health concerns [28,29,30,31].
One promising alternative to overcome these drawbacks is using ionic liquids (ILs) as transport media in specially designed polymer membranes (supported IL membranes, SILM) to selectively remove CO2 from gas streams. Due to their unique nature, i.e., organic salts consist of ions with a rather high molecular weight, ILs show several interesting properties, including very low vapor pressure [32], non-flammability [33], and high stability at temperatures above 200 ℃ [34]. Along with these properties, their relatively high viscosity results in higher capillary forces with the supporting media [35]. Three main techniques have been reported in the literature for the preparation of supported ionic liquid membranes (SILMs), such as penetration of IL into membrane pores by direct immersion of the polymer into the IL [36], application of vacuum [37], or pressure [38]. Despite their performance, which has often been encouraging [39], SILMs present a major drawback regarding their stability. In addition, the dissolution of the supported liquid phase if such membranes encounter another liquid phase, for instance, in pervaporation, leads to ultimate membrane failure [40].
Another approach to avoiding these stability problems regarding SILMs is the preparation of polymeric room-temperature ionic liquids (PILs) [3]. Although such membranes are more stable with good separation characteristics [3], in some cases, they use particular polymerizable monomers and require complex polymerization techniques; thus, the preparation cost becomes significantly high. The solution casting method used in this work, in which the polymeric matrix is mixed with the ionic liquid and then cast to form a blend film (polymer inclusion membranes, PIMs), is the most cost-effective technique because it is an easy-to-maintain and low-cost route to prepare stable ionic liquid membranes [41].
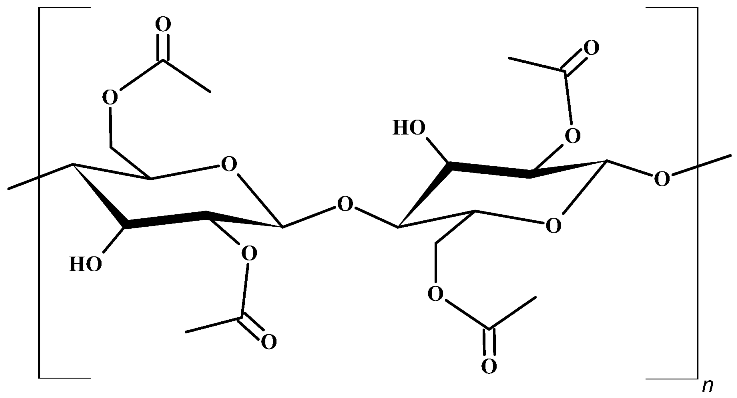
The selection of the supporting polymer and the liquid medium is the key factor in designing highly efficient membranes for CO2 separation. Several polymers, such as polyimides [42], polyvinylidene fluoride [43], and cellulose acetate (CA) [44] were investigated. The latter, CA (Table 1), is a reasonable option for the supporting material due to advantages such as high CO2/N2 selectivity under common operating conditions and low plasticization induced by heavy hydrocarbons [45]. Also, it is a non-toxic and biodegradable material derived from cellulose, which is an abundant biomaterial, and presents high affinity with many ILs [46]. Such advantages, combined with its low cost, render it a popular polymer matrix for the development of membranes.

Table 1.
Structure of cellulose acetate (CA), used as a polymeric base, and ionic liquids (ILs), used as liquid mediums, for the preparation of the CA-IL membranes.
Choline (Ch), a nutrient found in many food products [47], is known to be non-toxic and biodegradable [48]. Cholinium-based ILs are biodegradable [49], with low toxicity [48] and high CO2 capture efficiency [50]. Thus, the cation of choline can be considered a potential constituent of an efficient IL for CO2 removal. Considering the anion of the ionic liquid, CO2 measurements in three amino-acid-based ionic liquids with 1-butyl-3-methylimidazolium (Bmim) as cation and glycine (Gly), alanine (Ala), or valine (Val) as anion showed that the glycine-based ionic liquid presented the highest CO2 sorption [51]. Furthermore, the number of amine groups in the amino acid anion strongly affects the stoichiometric CO2 loading (due to chemical absorption). For example, asparagine-based ILs, with two amine groups in asparagine, follow the 2:1 mechanism (2 mol CO2/mol IL) [52], whereas glycine-based ILs, with one amino group in glycine, follow the 1:1 mechanism (1 mol CO2/mol IL) [51]. Unlike most ILs, which, in general, show relatively high viscosity [53], choline glycine IL () (Table 1) presents moderate viscosity [54].
Imidazolium-based ILs show very high SO2 solubility, moderate CO2 solubility, and relatively poor N2 and O2 solubilities, suggesting their potential for gas separation [55]. The interaction of CO2 (Lewis acid, LA) with the anion of ILs (Lewis base, LB) is an important factor in determining the CO2 solubility of ILs. For example, it was shown that there are two contributing factors to the relative high CO2 solubility in 1-ethyl-3-methylimidazolium hydrogen sulfate ([]): the high sulfonyl group (S=O) polarization, which leads to stronger intermolecular interactions with CO2 [56], and the high negative charge of all oxygen atoms in the HSO4− anion, resulting in strong polar interactions with the positively charged carbon atom of CO2 [57]. By considering this aspect, the CO2 solubility in 1-butyl-3-methylimidazolium hydrogen sulfate ([]) (Table 1), which has a larger alkyl chain in the cation than the [] and consequently presents a larger free volume, is expected to be higher than the CO2 solubility in [] or at least in the same order.
Therefore, in this work, [] and (Table 1) were chosen as additives to CA membranes. The aim of this work was to prepare and characterize CA-IL membranes and explore their potential for CO2 capture applications.
2. Materials and Methods
2.1. Materials and Instruments
Potassium bromide (KBr), purity > 99.5% wt., was purchased from Chem-Lab (Zedelgem, Belgium). Cellulose acetate (39.7% wt. acetyl content, with a degree of substitution (DS) of 2.45 and Mn equal to 50,000 g mol−1) was purchased from Sigma-Aldrich (St. Louis, MO, USA). 1-Butyl-3-methylimidazolium hydrogen sulfate ([]), purity > 94.5% wt., was purchased from Aldrich. To evaluate the structural characteristics of the CA-IL films, X-ray diffraction (XRD) measurements were carried out at room temperature. The XRD data of sample films (20 mm × 15 mm) were collected by a Brucker (model D8 Advance, Billerica, MA, USA) diffractometer equipped with a Siemens X-ray tube (Cu, 1.54 Å) at a scan range of 5–40° and a rate of 0.5° min−1.
FTIR spectrometry using the KBr method was carried out with a Biorad FTS-175 spectrometer (Bio Rad, Hercules, CA, USA). Pieces of the samples were mixed with KBr (mass proportion ~1:200) and pressed into pellets by a hydraulic press (100 Bar). The spectra resulted from an average of 64 scans at 2 cm−1 resolution between 400 and 4000 cm−1.
Thermogravimetric analysis (TGA) was performed on a thermogravimetry thermal analyzer (Shimadzu TGA-50, Shimadzu, Tokyo, Japan) under a nitrogen gas flow of 20 mL min−1. The measurements were conducted with the CA-IL samples heated to 450 °C at a heating rate of 10 °C min−1. TGA curves were used to determine the degradation onset temperature using the tangent method (Section S5 in ESI).
To determine the thermal transitions of the CA-IL blends, differential scanning calorimetry (DSC) measurements were carried out by the DSC-50 calorimeter (Shimadzu DSC-50, Shimadzu, Tokyo, Japan) under a nitrogen gas flow of 20 mL min−1. The DSC equipment was calibrated using an indium standard (melting point of 156.65 °C, ΔHf = 28.45 J/g), and errors were found to be less than 2% in the heat flow calibration. DSC samples (~1–5 mg) were sealed in an aluminum pan. The measurements were conducted with the samples heated to 250 °C at a heating rate of 10 °C min−1.
2.2. Synthesis of
was synthesized using a two-step reaction procedure (Scheme S1 in the Supplementary Information file in Section S2). The first reaction was the metathesis reaction between choline chloride () and sodium hydroxide (NaOH), which took place in ethanol under stirring for 2 h. Choline hydroxide () remained dissolved, while NaCl precipitated as a white powder (Figure S2). Once NaCl was removed by filtration, glycine (Gly) was added. The second reaction was the neutralization reaction between and glycine to form the desirable IL and water as a by-product (Figure S2 in the Supplementary Information file). The unreacted amino acid was removed by filtration. The produced water was removed using a rotary evaporator under vacuum for at least 48 h. Three criteria were used for a preliminary identification of the synthesized IL, namely, color, viscosity (evaluated visually), and decomposition temperature, using TGA analysis. The resulting IL was a brown-yellowish, semi-transparent viscous liquid with a decomposition temperature below 180 °C, a value between those of and glycine and close to that reported in the literature for [58,59]. TGA analysis was also used for an initial estimation of the water content of the produced IL. For an accurate estimation, coulometric Karl Fischer titration was used, and the water content was determined to be less than 1.71% wt. Such a relatively high water content, which remained after an intense purification method, indicates the well-known difficulty in the purification of ILs. The successful synthesis was finally confirmed by 1H and 13C NMR analyses. 1H and 13C NMR data are reported in the Supplementary Information file (Section S2).
2.3. CA-IL Film Preparation
The composite CA- and CA-[] membranes were prepared through the solvent casting method (Figure S5 in the Supplementary Information file). In more detail, cellulose acetate was dissolved in acetic acid, up to 5% wt., and the ionic liquid was subsequently added, resulting in solutions containing ionic liquid in the range of 0–30% wt. with respect to the polymer weight. The polymer–IL solutions were cast into Petri dishes. After slow drying at ambient temperature for 3 days, the films were further dried in a vacuum at 70 °C for 4 h. Finally, the free-standing films were peeled from the substrate, and they were stored in a vacuum desiccator until use to avoid the sorption of water.
2.4. CO2 and N2 Sorption Measurements and Estimation of Diffusion Coefficients and Permeability
The mass loss analysis (MLA) method [60] was used for measuring the sorption of CO2 (or N2) by the produced membranes. The experimental apparatus (see Figure S6 in the Supplementary Information file) used to apply the mass loss analysis (MLA) technique consisted of an ISCO high-pressure syringe pump (model 100DX), an ISCO SFX 2-10 thermostatic high-pressure extractor, a high-pressure cell sealed by a screw cap, and a pump/pressure controller. The variable-volume high-pressure cylinder of the syringe pump, filled with liquid CO2, was cooled with the aid of a Haake refrigerated circulating bath to keep the temperature constant around −2 °C. After placing a known amount of the polymer sample in the sorption cell, the cell was evacuated to remove any gases that might have been sorbed by the polymer. Then, CO2 was introduced and pressurized to the targeted value at a constant temperature of 35 °C. The sample was exposed to CO2 until sorption equilibrium was achieved. After preliminary sorption experiments at three different times (30, 60, and 90 min), it was found that 30 min were adequate for the establishment of equilibrium. After equilibrium was reached, the cell was rapidly depressurized, followed by, as quickly as possible, the transfer of the specimen to a fast response electronic balance (precision = 0.0001 g). The time was set equal to zero (t = 0) when the valve was opened (start of depressurization). During the desorption of the gas under ambient conditions, the sample weight was recorded as a function of time.
The Fickian diffusion (FD) model assumes that pressure, temperature, and polymer film thickness (L) are constant, and the diffusion is unidirectional. In the case of flat geometry, the CO2 uptake at time t ( and the equilibrium uptake () are related by the following simplified equation [61]:
where D is the diffusion coefficient. Equation (1) can be rearranged in terms of the mass of gas remaining in the polymer () as follows:
This formula allows the determination of the diffusion coefficient D from the slope of a plot of versus , while is given by the y-intercept (see Figure S7 in the Supplementary Information file). was calculated using this approach. For each one of the samples, was found to depend linearly on pressure, that is, Henry’s law was obeyed. Thus, the solubility coefficient S (Henry’s law constant) can be calculated by the following equation:
For the diffusion coefficient, alternatively, if the time at which half of the equilibrium mass has been desorbed is known (that is, the time at which it holds ), then D can be calculated by the following equation [62]:
In this study, we used Equation (4) for the calculation of the diffusion coefficient D. In each experiment, the thickness (L) of the membrane was measured with a micrometer. In all cases, the thickness was of the same order of magnitude and in the range of 0.1–0.3 mm.
From the value of diffusion coefficient D as well as the value of the solubility coefficient S, the gas permeability P can be calculated from the following equation:
In order to calculate P in its common units, that is, in Barrer (), it is necessary to use cmHg units for in Equation (3) and to express in cm3 STP/cm3. We calculated and presented the results of in units of g CO2/100 g of membrane. In order to transform the g CO2/100 g of membrane into cm3 STPCO2/cm3 of membrane, we used a value of 1.977 kg/m3 for the STP density of CO2 [63] and a value of 1300 kg/m3 for the density of cellulose acetate [64]. For the CA-IL membranes, for the sake of simplicity, the same density as that for the pure CA film was used. Because the density of ILs is typically in the range 1000–1400 kg/m3 [65], that is, rather close to the density of CA, the above simplification has a very small effect on the values of S.
3. Results and Discussion
3.1. CA-IL Membrane Characterization
3.1.1. Membrane Structural Properties by X-ray Diffraction Studies
The X-ray diffraction patterns of the CA composite membranes and the reference membrane of the pure polymer are presented in Figure 1. Pure CA presented two main peaks located at 2θ values of 8 and 17 degrees, related to the crystalline and amorphous phases, respectively [15,44,66,67]. More specifically, the broad peak at 2θ values of approximately 8 degrees is considered the principal characteristic of the semicrystalline acetylated derivative cellulose [66]. It corresponds to an interplanar distance of 11.1 Ǻ, which is higher than the distance of 6.13 Ǻ observed for neat cellulose due to the disorder induced by the acetylation [68,69].
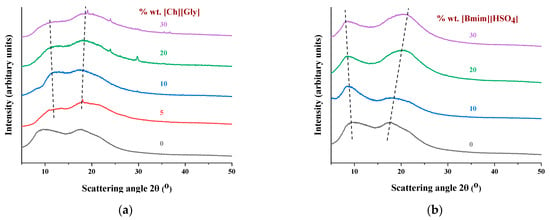
Figure 1.
XRD patterns of CA-IL blends: (a) CA- and (b) CA-[]. The numbers denote the % wt. IL in composite membranes. The dashed lines act as a visual guide.
As shown in Figure 1a, the crystalline peak of the -containing membranes was observed at a slightly higher 2θ compared to that of the neat polymer, while the amorphous halo was located almost at the same angle. Also, upon addition of , the amorphous halo became dominant, indicating that significantly reduced the CA crystallinity. In the case of [], the crystalline peak at 8 degrees shifted to a slightly lower value, while the amorphous halo at 17 degrees shifted to a higher value. The ratio of those two areas remained almost constant, with an exception at 10% IL loading, in which the crystalline peak was dominant. These findings suggest that the addition of [] had no significant effect on the crystallinity of the CA, with an exception at 10%. Such qualitative observations are better analyzed by the estimation of the crystalline/total area ratio, which is indicative of the overall crystallinity, as presented below.
Table 2 summarizes the degree of crystallinity (xc) of the CA-IL films using a procedure described in detail in the Supplementary Information file (Section S5). Figure 2 presents the degree of crystallinity as a function of the IL content for the composite membranes. In more detail, as shown in Figure 2a, the addition of , even at the lowest investigated content of 5% wt., clearly decreased the CA crystallinity. Furthermore, as presented in Figure 2b for the []-containing membrane, the crystallinity increased upon addition of 10% wt. [], while it decreased with further addition of IL. Similar behavior has been reported for cellulose triacetate membranes doped with imadazolium-based ILs [44]. This can be attributed to two antagonistic phenomena. Firstly, the addition of the IL facilitated chain mobility, rendering their reorientation more feasible and consequently favoring crystallization. For this reason, the CA membrane containing 10% wt. [] presented increased crystallinity compared to the neat CA. However, at the same time, the addition of IL resulted in the dilution of polymer chains, facilitating the destruction of the crystal structure. The results revealed that upon addition of more than 10% wt. [], the latter effect was the dominant one, leading to a decrease in crystallinity. Furthermore, as presented in Figure 2a, the addition of , even at the lowest investigated content of 5% wt., clearly decreased the CA crystallinity. These findings suggest that is significantly more effective than [] in disrupting the CA crystal structure, probably due to the more pronounced capability of glycine to form strong, specific intermolecular interactions, e.g., hydrogen bonds, with CA groups.

Table 2.
Degree of crystallinity (xc) * for CA doped with IL blends.
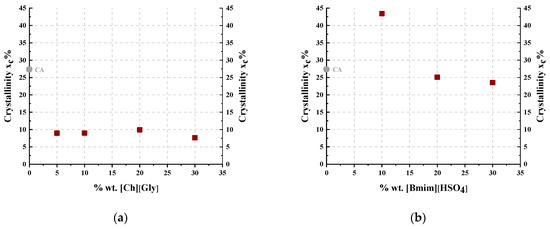
Figure 2.
Degree of crystallinity as a function of IL content for CA-IL blends: (a) CA- and (b) CA-[].
3.1.2. FTIR Analysis
To identify the effect of added ILs on the CA matrix, IR spectroscopy measurements were performed for CA-doped with [] or , and the obtained spectra were compared to those of pure CA. However, for the CA- membranes, most likely due to the rather high water content of , it was not possible to obtain a spectrum of good quality. Nevertheless, regarding the []-containing membranes, very interesting conclusions were obtained. In more detail, as shown in Figure 3, the pure CA membrane spectrum presented FTIR peaks corresponding to C-H stretching at around 2900 cm−1, O-H stretching in the region of 3700–3200 cm−1, and carbonyl stretching at around 1750 cm−1 [70]. Upon addition of [], two new peaks, attributed to the IL, were observed: a characteristic C-H stretch double peak at 3200–3000 cm−1 and a characteristic C=N vibration peak at 1575 cm−1. The other three characteristic peaks of [] at 3000–2900 cm−1 (C–H stretch), 1431 cm−1 (C=C stretch), and 1055 cm−1 (S=O bending) [42] overlapped with CA bands.
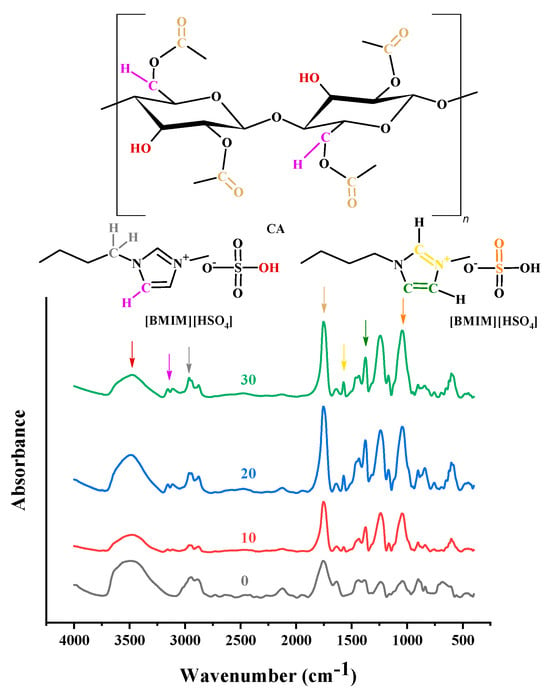
Figure 3.
FTIR spectra of CA-[] membranes (with 0, 10, 20, 30% wt. []) in the region 4000–400 cm−1.
It is known that CA suffers from the vinegar syndrome (acetic acid is produced due to the hydrolysis of some acetate groups) [71]. The existence of free acid and water within the CA membrane renders the evaluation of the O-H stretching region quite complex. For this reason, in order to explore any interactions between CA and [], only the region of the carbonyl stretching vibration was examined. In Figure 4, the CA spectrum along with the subtracted spectra of the []-containing membranes (blend membrane spectrum minus CA spectrum) are presented in the region of 1900–1590 cm−1. As can be observed, CA exhibited two bands: one at around 1630 cm−1, which is attributed to water bending vibration, and one at around 1760 cm−1, which is attributed to C=O stretching. In the subtracted spectra, various negative peaks were observed. From the negative peak at 1630 cm−1, it can be concluded that the blend membranes exhibited a lower water content than pure CA. A negative peak at around 1710 cm−1 was also observed. The absorption in this region is typically attributed to the acid carbonyl group. Thus, the negative peak at 1710 cm−1 could be attributed to the lower free acetic acid content of the blend membranes. Before proceeding, it must be recalled that strong, specific intermolecular interactions can weaken the chemical bonds and alter their force constant, resulting in a decrease in the vibration frequency of the bond [72]. The negative peak at around 1780 cm−1 points out that the CA-free C=O groups decreased in the blend membranes. This suggests that the C=O groups of CA were influenced by the presence of IL and were most likely involved in strong intermolecular interactions with IL groups. This is reasonable for the used CA sample (with a high degree of substitution (DS) of 2.45). More precisely, the high DS of CA translated to a high C=O to OH ratio. In other words, there were not enough OH groups to strongly bind with all the C=O groups. The addition of IL provided an excess of groups that could strongly interact with the C=O groups. Thus, it is reasonable to find that the number of free C=O groups in the blend membranes decreased compared to that of neat CA. This is an important observation and can be considered for interpreting the thermal analysis and sorption results.
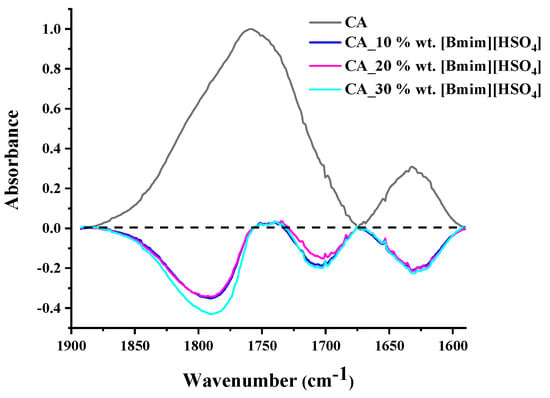
Figure 4.
CA spectrum and subtracted spectra of the blend membranes in the region 1900–1590 cm−1 (the CA spectrum was subtracted from the blend membrane spectra).
3.1.3. Thermal Behavior
Recently, some new insights on the thermal behavior of CA have been reported [72,73,74], and it was shown that the thermal behavior of CA is not the typical one that involves thermophysical transitions, i.e., glass transition, melting point, and simple evaporation of impurities. On the contrary, the thermal behavior of CA was reported to be characterized by various peculiarities. CA exhibits similar effects to those of thermoplastic polymers, e.g., softening and evaporation of impurities; however, all these effects are of a thermochemical nature, that is, alteration of the chemical structure of CA occurs during softening or vaporization of impurities. More precisely, the broad endothermic peak at around 100 °C in the DSC curve of CA arose mainly from the enthalpy of esterification (the free acid upon heating reacted with the OH groups of CA, and water was produced) and some water evaporation (Figure 5). In other words, CA contains free acetic acid (the acetic acid may be a residue of the preparation of CA or is produced by the hydrolysis of acetate groups). By heating, the free acetic acid esterifies the free OH groups of CA, and water is produced. Similarly, the endodermic peak observed in the first DSC scan of CA around 230 °C was not due to neat melting but rather to simultaneous softening and decomposition (Figure 5). The term “thermochemical transition” was proposed to describe this effect (simultaneous softening and decomposition), and more recently, it was recognized that this is just a special case of a more general property named “melting inability” [75]. Also, recently, it was reported that substances with an increased number of hydrogen-bonded groups, such as gallic acid and quercetin, cause a depression of the thermochemical transition temperature of CA [72]. This was explained based on the weakening of the chemical bonds due to the formation of strong intermolecular interactions between the additive (e.g., gallic acid) and CA. The addition of such substances in CA, as mentioned above for the case of IL, provides an excess of groups to interact with the C=O (or other groups) of CA. Thus, the thermal behavior of pure CA will not be further discussed.
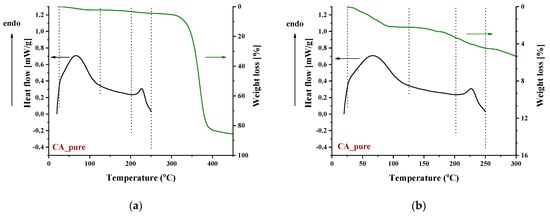
Figure 5.
DSC and TGA curves of pure CA in the temperature range: (a) 0–450 °C and (b) 0–300 °C.
To identify the thermal events taking place upon heating in the composite CA-IL matrix, the DSC and TGA heating curves of CA membranes containing 10% wt. and 10% wt. [] are presented in Figure 6 and Figure 7, respectively. In both cases (Figure 6 and ), the DSC curves of the CA doped with IL membranes showed a broad endothermic peak up to 125 °C corresponding to the evaporation of IL and CA impurities as well as evaporation of water produced by esterification, in agreement with the mass loss of 2.5% wt. shown in the TGA curves. However, the thermal behavior of the two composites differed with a further increase in temperature. In more detail, the DSC curve of CA doped with membrane presented two events, one around 130 °C and another around 175 °C, while the DSC curve of CA doped with [] membrane showed only one significant thermal event around 175 °C. It should be noted that the event for -containing membranes is not associated with mass loss, as shown by the respective TGA curve. Such behavior was also observed by Lam et al. [44] for cellulose triacetate (CTA) membranes containing imidazolium-based ILs, and it was attributed to the glass transition of the polymer. However, recently, some new insights into the thermal behavior of CA have been reported [72,73,74]. Also, in this work, acetic acid was used as a solvent for the membrane preparation, and thus, acetic acid residue would be expected due to the strong intermolecular interactions with the membrane’s constituents. The presence of carboxyl groups may interfere with the esterification reaction between free acetic acid and the OH groups of CA (CTA normally should not have any free OH). The thermal effect around 130 °C (see Figure 6) began to occur at a temperature very close to the boiling point of acetic acid (118 °C). Based on the above, this signal alteration seems to be related to acetic acid evaporation. The fact that no mass loss was detected in TGA was simply because it was lower than the detection limit. In any case, multiple effects took place, and for the explanation of this phenomenon, further investigation is needed. Furthermore, the endothermic DSC peaks that were observed around 175 °C were associated with approximately 10% and 2.5% wt. mass loss for the and []-containing membranes, respectively. Such mass loss is presumably attributed to the decomposition of the IL-rich regions because, in this temperature range, the decomposition of pure (Figure 8) and the partial decomposition of [] (Figure 9) occur. Finally, for both membranes, the thermochemical transition of CA occurred around 230 °C, which is associated with mass loss steps of 15% and 5% wt. for the CA- and the CA-[] membranes, respectively.
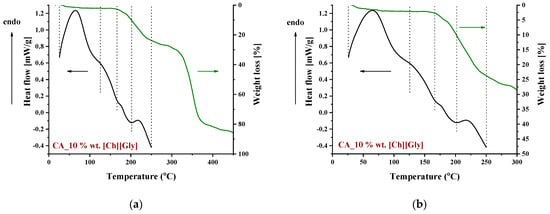
Figure 6.
DSC and TGA curves of a CA membrane doped with 10% wt. in the temperature range: (a) 0–450 °C and (b) 0–300 °C.
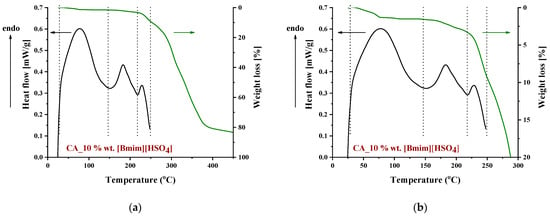
Figure 7.
DSC and TGA curves of a CA membrane doped with 10% wt. [] in the temperature range: (a) 0–450 °C and (b) 0–300 °C.
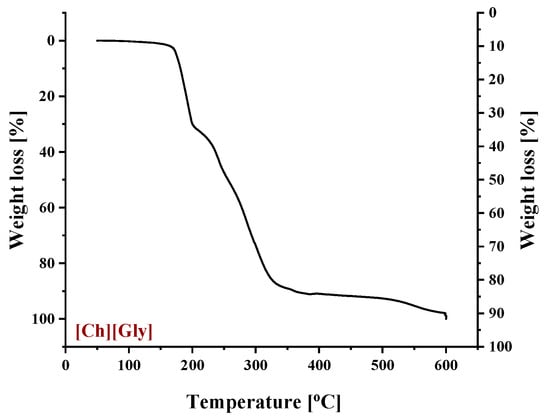
Figure 8.
Thermogravimetric curve of pure .
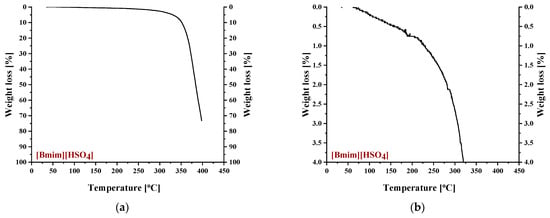
Figure 9.
Thermogravimetric curves of pure [] for weight loss range: (a) 0–100% and (b) 0–4%.
Figure 10 shows the thermogravimetric (TGA) curves of CA-IL composite membranes at a heating rate of 10 °C min−1. It was observed that the degradation temperature of CA decreased with increasing IL content. This decrease was higher for the CA- blends, indicating that was more effective than [] in CA polymer chain disruption, lowering the polymer chain bonding energy and subsequently increasing their mobility. This is expected due to the increased strong molecular interactions that can be formed between glycine and CA. This was also confirmed by the significant decrease in crystallinity (Figure 2) observed for blends.
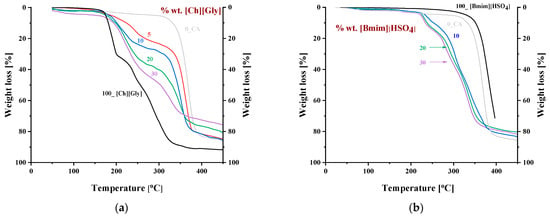
Figure 10.
Thermogravimetric curves of CA doped with (a) and (b) []. The numbers denote the % wt. IL content in the composite membranes.
The DSC curves obtained by heating up to 250 °C using a heating rate of 10 °C min−1 for the CA-IL blends are shown in Figure 11. As can be seen, in all cases, the thermochemical transition temperature of CA was depressed. Also, a similar depression could be observed for the temperature related to the decomposition temperature of IL (around 175 °C). Such observation is in agreement with the TGA results and, based on the abovementioned FTIR discussion, can be explained by keeping in mind the weakening of the chemical bond strength due to the strong intermolecular interactions.
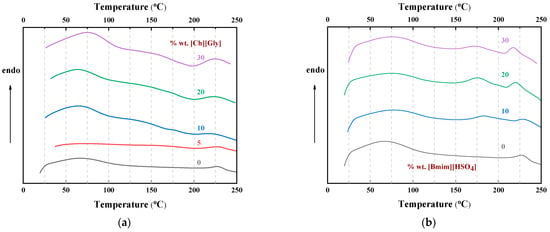
Figure 11.
DSC heat flow curves of CA-IL blends obtained at a heating rate of 10 °C/min for (a) and (b) []. The numbers denote the % wt. IL content in the composite membranes.
3.2. CO2 Sorption Measurements in CA-IL Membranes
The sorption of N2 was too low to be measured by the adopted method. Until the sample could be transferred to the scale, desorption occurred, and any detectable mass loss was very close to the scale’s readability (0.0001 g). Thus, only the results for CO2 sorption will be presented. Clearly, the above shows that the membranes exhibit selectivity for CO2 compared to N2; however, this selectivity cannot be quantified due to the lack of data for the N2 sorption.
Table 3 and Table 4 summarize the CO2 sorption results for the studied membranes, which were obtained at 35 °C and in the pressure range of 50 to 70 bar. The results are illustrated in Figure 12 and Figure 13, where the CO2 sorption isotherms and the effect of the IL content on sorption are presented for all investigated membranes. The results of the pure CA membrane were in agreement with those reported in the literature [15]. The IL loading effect on CO2 sorption was more apparent with increasing pressure (Figure 12a and Figure 13a).

Table 3.
CO2 sorption (g CO2 per 100 g of film) of CA films containing at 35 °C.

Table 4.
CO2 sorption (g CO2 per 100 g of film) of CA films containing [] at 35 °C.
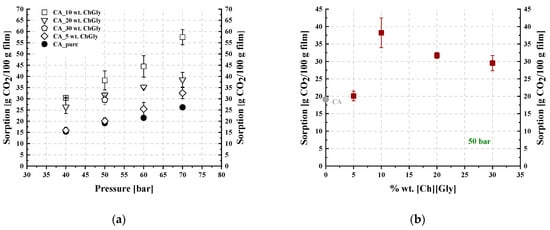
Figure 12.
(a) CO2 sorption isotherms at 35 °C and (b) trend of CO2 sorption as a function of the IL content at 50 bar and 35 °C, for CA- blends.
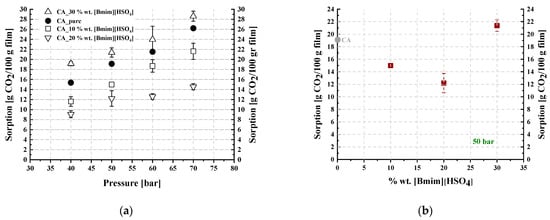
Figure 13.
(a) CO2 sorption isotherms at 35 °C and (b) trend of CO2 sorption as a function of the IL content at 50 bar and 35 °C, for CA-[] blends.
As shown in Figure 12a, all investigated -containing membranes presented increased CO2 sorption compared to that of neat CA. However, as presented in Figure 12b, sorption did not change monotonically when plotted against the IL content, with a maximum observed for the 10% wt. -containing membrane. A similar observation was reported by Reed et al. [65], who revealed increasing CO2 solubility in cellulose membranes containing a solid ammonium-based organic salt, i.e., tetraethyl ammonium acetate, for up to 25% wt. of salt content and a subsequent decrease in CO2 solubility by increasing the salt content to 50% wt. In other words, they observed a maximum CO2 solubility similar to the maximum presented in Figure 12b.
Furthermore, as presented in Figure 13, the addition of [] in the CA membrane up to 20% wt. reduced the overall sorption ability per membrane unit mass, while further addition of [] to 30% wt. resulted in an increase in CO2 dissolution. Thus, minimum CO2 sorption was observed at 20% wt. [] content. Such behavior was also observed by Lam et al. [44], who reported decreasing CO2 solubility in cellulose triacetate membranes containing an imidazolium-based IL, i.e., 1-ethyl-3-methylimidazolium dicyanamide, for up to 40% wt. IL content and a subsequent increase in CO2 solubility by increasing the IL content to 50% wt. In other words, they observed a minimum CO2 solubility similar to the minimum presented in Figure 13b.
Let us first comment on the strong CO2-IL intermolecular interactions. As mentioned in the introduction section, the interaction of CO2 (Lewis acid, LA) with the anion of ILs (Lewis base, LB) is an important factor for determining CO2 solubility in ILs. It was shown that there are two contributing factors to the relative high CO2 solubility in 1-ethyl-3-methylimidazolium hydrogen sulfate ([]): the high sulfonyl group (S=O) polarization, which leads to stronger LA-LB interactions with CO2 [56], and the high negative charge of all oxygen atoms in the HSO4− anion, resulting in strong polar interactions with the positively charged carbon atom of CO2 [57]. Furthermore, the interaction of CO2 with the positively charged nitrogen atom in the imidazolium ring or the cation of choline is expected to be less strong due to the sterical hindrance imposed by the alkyl groups connected to nitrogen. Such intermolecular interactions are schematically presented in Figure 14.

Figure 14.
Main intermolecular (dashed lines) and chemical interactions (red line) of CO2 with and [].
However, the existence of extrema (minimum or maximum) of CO2 sorption reveals antagonistic phenomena. Nevertheless, only the strong and/or chemical interactions of CO2-IL cannot explain the CO2 sorption behavior because the competitive CA-CO2 and CA-IL intermolecular interactions are also important.
In more detail, Kazarian [76], using an FTIR analysis, showed that polymers containing >C=O groups presented significantly higher CO2 sorption ability due to the rather strong LA-LB interactions between the positively charged carbon atom of CO2 and the oxygen of the carbonyl group. Consequently, the sorption of CO2 increased with the increasing number of >C=O groups in the polymer chains.
However, the addition of ILs inside the polymer matrix, which presents a lot of groups that can strongly interact with >C=O groups of the polymer chain, reduces the available (unbound) carbonyl groups for interaction with CO2, thereby reducing the ability of CA to dissolve CO2. This is in accordance with the experimental DSC/TGA and FTIR observations. Specifically, as discussed in the previous section, the thermal analysis showed a depression of the thermochemical transition temperature of the IL-containing membranes, an observation that can be attributed to increased IL-CA intermolecular interactions. Furthermore, the FTIR results presented in a previous section showed a reduction in the unbound >C=O groups of the polymer that are available for interaction with CO2. Some important polymer–IL interactions for both the investigated ILs are shown in Figure 15.
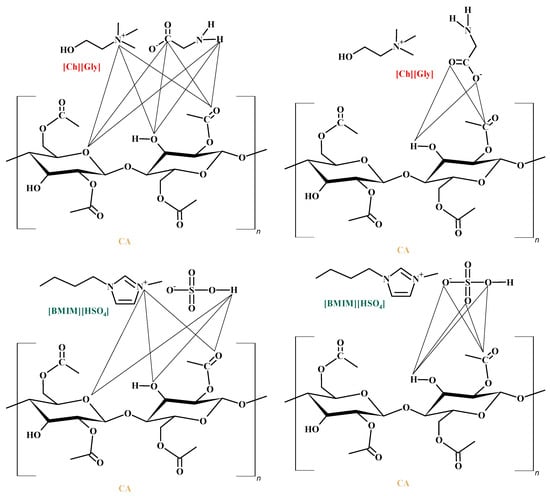
Figure 15.
Main CA-ILs with strong intermolecular interactions.
Nevertheless, as discussed above and shown in Figure 14, the addition of ILs not only reduces the available (unbound) polymer groups for interaction with CO2, thus tending to reduce the overall CO2 sorption, but, at the same time, introduces new sites on the IL ions that can strongly interact with CO2, thereby favoring the sorption of the gas inside the composite membrane matrix. Thus, upon the addition of an IL to the polymer membrane, there is an interplay of favorable CA-IL interactions, acting competitively with the favorable CO2-CA and CO2-IL intermolecular interactions. The net effect of such competing phenomena is the existence of extrema when sorption is plotted against the IL content.
More specifically, as shown in Figure 12b, upon addition of to the CA membranes up to 10% wt., the introduction of -NH2 groups that are capable of CO2 chemical absorption and the introduction of the rest of the IL sites that are capable of strong physical intermolecular interactions with CO2 were the dominating factors resulting in the increase in the overall CO2 dissolution in the membrane. At contents higher than 20% wt., the reduction in the polymer groups that are capable of strong interactions with CO2 dominated, resulting in a small decrease in CO2 solubility and the appearance of a maximum in the plot (Figure 12b).
On the other hand, as shown in Figure 13b, upon addition of [] in the CA membranes up to 20% wt., the reduction in the polymer groups that are capable of strong intermolecular interactions with CO2 had a more severe effect than the introduction of new IL sites, causing a reduction in the overall CO2 solubility in the membrane. Further addition of [] up to 30% wt. was translated to the addition of new IL sites, increasing CO2 solubility and resulting in the appearance of a minimum in the plot of Figure 13b.
In conclusion, the CO2 sorption behavior of CA-IL composite membranes cannot be explained only by strong CO2-IL intermolecular or/and chemical interactions, and CA-CO2 and CA-IL intermolecular interactions must also be considered. In general, CO2 sorption in low-molecular-weight systems, such as ionic liquids, is affected by the presence of a third component [77,78] (CA in this case).
As mentioned above, it is known [76] that polymers with C=O groups exhibit increased CO2 sorption capability. The solubility of CO2 in the pure CA membranes that were developed in this study (solubility at 35 °C and 50 bar equal to 19.1 g CO2/100 g polymer) was similar or higher than that in other polymers with C=O groups, e.g., poly(methyl methacrylate) (solubility at 35 °C and 50 bar equal to 12.5 g CO2/100 g polymer [79]) and almost triple than the solubility in polymers without C=O groups, e.g., poly(styrene) (solubility at 35 °C and 50 bar equal to 7 g CO2/100 g polymer [79]). For cellulose triacetate at the same temperature but lower pressures, e.g., 13 bar, the solubility has been reported to be 6 g CO2/100 g polymer [44]. At 35 °C and 20 bar, the solubility in polycarbonate has been reported to be 5 g CO2/100 g polymer [80]. For PPO (poly(2,6-dimethyl-1,4-phenylene ether)) at similar pressures as those used in this study (40 bar) but at higher temperatures, e.g., 100 °C, the solubility has been reported to be 5 g CO2/100 g polymer, while at the same temperature but considerably higher pressure (200 bar), the solubility increases to 17.5 g CO2/100 g polymer [81], that is, slightly lower than the solubility of CO2 in the CA membrane measured at 35 °C and 50 bar. Also, in the literature, cellulose triacetate–IL membranes have been found to exhibit a behavior similar to the studied CA-[] membranes [44]. Finally, the studied CA- membranes with 10% IL exhibited practically double solubility values compared to the pure CA membranes, which, as just discussed, exhibited high solubility compared to other polymers. Thus, the CA-10% membrane has a great potential for CO2 sorption as it exhibits higher solubility compared to other available polymeric materials.
In Table 5 and Table 6, the diffusion coefficients (D) of CO2 in the studied membranes are presented. It should be stressed that the calculation of D by the adopted procedure, though it is common in the literature, is based on various assumptions, e.g., Fickian desorption, D being independent of concentration, etc. Thus, the presented values of D cannot be considered accurate values; nevertheless, useful conclusions can be extracted by comparing the order of magnitude of these values. As can be seen in Table 5, the addition of 5% in CA increased the diffusion coefficient by one order of magnitude, while at higher concentrations, the increase was by two orders of magnitude. These values are comparable with the literature values for polymer–IL membranes [43]. The value of D for pure CA was lower compared to the ones of polymers with C=O groups, e.g., PMMA [82]. An explanation for this could be that, in a polymer like PMMA, plasticization occurs during sorption, while sorption occurs faster in the rubbery state than in the glassy state [82]. In any case, the values of D further support the high potential and the beneficial effect of as the addition of results in not only increased equilibrium concentration but also faster sorption. However, this is not the case for the CA-[] membranes, as can be seen in Table 6. In the values of D of the CA-[] membranes, some increasing tendency could be observed, but the composite membranes exhibited only slightly higher values of D and of the same order of magnitude as the ones of pure CA. The addition of IL, which is a low-molecular-weight substance, to a polymer would be expected to increase the mobility of the macromolecules and increase the free volume of the polymer to some extent (such effects are very intense during plasticization). Thus, in the presence of small molecules, the CO2 molecules can diffuse faster inside the polymer network. This mechanism contributed to the increase in D in both cases. However, such effects are expected to be more intense in the -containing membranes because the interactions of CA with is stronger than those of CA with []. In addition, in the case of and due to its intermolecular interactions with CO2, an additional mechanism for the diffusion of CO2 is present, and for these reasons, the increase in D was much higher in the corresponding -containing membranes.

Table 5.
Diffusion coefficient of CO2 in CA films containing at 35 °C.

Table 6.
Diffusion coefficient of CO2 in CA films containing [] at 35 °C.
A similar increase can be observed in the permeability values of the CA- membranes (Table 7). More specifically, the permeability of CA increased by one or two orders of magnitude, depending on the amount of . It is worth mentioning that these values were higher than the values of other polymer–IL membranes, despite the fact that the latter might exhibit higher D values [43]. This is due to the high CO2 solubility in the -containing membranes. It should be recalled that the permeability is proportional to the solubility and the diffusion coefficient. By keeping this in mind, the permeability results for the CA-[] membranes (Table 8) can be understood. The solubility of the composite membranes was lower; however, the slightly increased D values resulted in a (slight) increase in the permeability values, which was comparable to the literature values [43].

Table 7.
Permeability of CO2 in CA films containing at 35 °C.

Table 8.
Permeability of CO2 in CA films containing [] at 35 °C.
4. Conclusions
Two different ILs ([] and ) were used for the preparation of CA-IL composite membranes. A new route was used to synthesize a biodegradable and non-toxic [Ch+][Gly-] ionic liquid. The synthesized membranes were characterized by a variety of methods, and their potential for utilization in CO2 separation processes was evaluated by experimental measurements of CO2 sorption.
The characterization results showed that the addition of ILs facilitated the chain mobility, rendering their reorientation more feasible and consequently favoring crystallization. However, at the same time, the addition of ILs resulted in the dilution of polymer chains, facilitating the destruction of the crystal structure. Such competitive phenomena resulted in a severe decrease in CA crystallinity upon addition of [Ch+][Gly−] up to 30% wt., while they resulted in the appearance of a maximum in crystallinity upon addition of 10% wt. [].
The FTIR analysis for the []-containing CA membranes showed that the addition of IL decreased the number of free C=O groups in the blend membranes compared to the neat CA because IL provided an excess of groups that could strongly interact with the C=O groups of the polymer.
The investigation of the thermal behavior of the composite membranes showed that the membranes were, in general, less thermally stable than the [] membranes, while the degradation temperature of CA decreased with increasing IL content. In all cases, upon the addition of IL, the thermochemical transition temperature of CA was depressed.
Upon the addition of an IL to the polymer, there was an interplay of favorable CA-IL interactions acting competitively with the favorable CO2-CA and CO2-IL intermolecular interactions. Such behavior resulted in the appearance of extrema when the CO2 sorption was plotted against the IL content, i.e., a maximum appeared for the -containing membranes and a minimum for the []-containing membranes. In all cases, membranes presented higher CO2 solubility than neat CA and [] membranes. The membranes also exhibited significantly higher diffusion coefficients and permeability values. In other words, they not only absorbed higher amounts of CO2 but also absorbed these amounts at a higher rate than pure CA. In combination with the poor solubility of N2 in these membranes (too low to be measured), it can be concluded that these membranes exhibit selectivity and a high potential for increased and fast CO2 capture.
Besides these aspects, exhibits additional advantages over the other ILs, such as non-toxicity, biodegradability, and the low cost of the precursor chemicals. Thus, it seems that the combination of with an eco-friendly and low-cost CA polymer is a very promising approach for effective and sustainable CO2 capture applications.
Supplementary Materials
The following supporting information can be downloaded at: https://www.mdpi.com/article/10.3390/polym16040554/s1, Figure S1. Commercial polymeric membranes used in industrial CO2 separation processes; Scheme S1. Metathesis reaction between choline chloride ([Ch+][Cl−]) and sodium hydroxide (NaOH) in ethanol under stirring for 2 h (Stage 1) and neutralization reaction between choline hydroxide ([Ch+][OH−]) and glycine to form the desirable [Ch+][Gly−] IL and water as a by-product (Stage 2); Figure S2. Choline chloride and sodium hydroxide in EtOH at t = 0 h and t = 2 h. Note that NaCl precipitated as white powder (Stage 1) and choline hydroxide and glycine in EtOH at t = 0 h and t = 2 h (Stage 2); Figure S3. 1H NMR spectra (600 MHz) of the synthesized [Ch+][Gly−] in D2O; Figure S4. 13C NMR spectra of the synthesized [Ch+][Gly−] in D2O; Figure S5. Composite membrane film preparation using the solution casting method; Figure S6. Sketch of the experimental setup that was used for the sorption measurements: 1: high-pressure gas tank; 2: cooler; 3: syringe pump; 4: oven; 5: high-pressure cell; Figure S7. CO2 desorption from CA doped with 10% wt. [Bmim+][HSO4−] at 25 °C and atmospheric pressure after exposure to a CO2 atmosphere at 35 °C and 40 bar (a) and extrapolation to time zero using the FD model (b); Figure S8. Degree of crystallinity calculation of the CA doped with 20% wt. [Bmim+][HSO4−] using the Gaussian function to determine the crystalline peak and the amorphous halo. References [83,84] are cited in the supplementary materials.
Author Contributions
Conceptualization, G.K. and I.T.; methodology, G.K., C.T. and I.T.; software, G.K. and C.T.; validation, G.K., C.T. and I.T.; formal analysis, G.K., C.T. and I.T.; investigation, G.K. and C.T.; resources, I.T.; data curation, G.K. and C.T.; writing—original draft preparation, G.K.; writing—review and editing, C.T. and I.T.; visualization, G.K. and C.T.; supervision, I.T.; funding acquisition, G.K. and I.T. All authors have read and agreed to the published version of the manuscript.
Funding
This research was co-financed by Greece and the EU through the Operational Program “Human Resources Development through PhD studies”, implemented by the State Scholarships Foundation (IKY).
Institutional Review Board Statement
Not applicable.
Data Availability Statement
All data are included in the article.
Acknowledgments
The authors would like to acknowledge Sevasti Matsia for the NMR measurements and Xanthi Ntampou for the XRD measurements. G.K. would like to acknowledge the State Scholarships Foundation (IKY) of Greece.
Conflicts of Interest
The authors declare no conflicts of interest.
References
- Kohl, A.L.; Nielsen, R. Gas Purification; Elsevier: Amsterdam, The Netherlands, 1997. [Google Scholar]
- Bernardo, P.; Drioli, E.; Golemme, G. Membrane gas separation: A review/state of the art. Ind. Eng. Chem. Res. 2009, 48, 4638–4663. [Google Scholar] [CrossRef]
- Tomé, L.C.; Marrucho, I.M. Ionic liquid-based materials: A platform to design engineered CO2 separation membranes. Chem. Soc. Rev. 2016, 45, 2785–2824. [Google Scholar] [CrossRef]
- IEA. World Energy Outlook 2022; IEA: Paris, France, 2022. [Google Scholar]
- Turner, J.A. Sustainable hydrogen production. Science 2004, 305, 972–974. [Google Scholar] [CrossRef]
- Yang, S.-I.; Choi, D.-Y.; Jang, S.-C.; Kim, S.-H.; Choi, D.-K. Hydrogen separation by multi-bed pressure swing adsorption of synthesis gas. Adsorption 2008, 14, 583–590. [Google Scholar] [CrossRef]
- Davidson, R.M. Post-Combustion Carbon Capture from Coal Fired Plants-Solvent Scrubbing; IEA Clean Coal Centre: London, UK, 2007. [Google Scholar]
- Haszeldine, R.S. Carbon capture and storage: How green can black be? Science 2009, 325, 1647–1652. [Google Scholar] [CrossRef]
- Perry, J.D.; Nagai, K.; Koros, W.J. Polymer membranes for hydrogen separations. MRS Bull. 2006, 31, 745–749. [Google Scholar] [CrossRef]
- Haggin, J. New generation of membranes developed for industrial separations. Chem. Eng. News 1988, 66, 7–16. [Google Scholar] [CrossRef]
- Sanders, D.F.; Smith, Z.P.; Guo, R.; Robeson, L.M.; McGrath, J.E.; Paul, D.R.; Freeman, B.D. Energy-efficient polymeric gas separation membranes for a sustainable future: A review. Polymer 2013, 54, 4729–4761. [Google Scholar] [CrossRef]
- Scholes, C.A.; Stevens, G.W.; Kentish, S.E. Membrane gas separation applications in natural gas processing. Fuel 2012, 96, 15–28. [Google Scholar] [CrossRef]
- Stern, S.A. Polymers for gas separations: The next decade. J. Membr. Sci. 1994, 94, 1–65. [Google Scholar] [CrossRef]
- Lin, H.; Freeman, B.D. Gas solubility, diffusivity and permeability in poly (ethylene oxide). J. Membr. Sci. 2004, 239, 105–117. [Google Scholar] [CrossRef]
- Puleo, A.; Paul, D.R.; Kelley, S. The effect of degree of acetylation on gas sorption and transport behavior in cellulose acetate. J. Membr. Sci. 1989, 47, 301–332. [Google Scholar] [CrossRef]
- Bos, A.; Pünt, I.; Wessling, M.; Strathmann, H. CO2-induced plasticization phenomena in glassy polymers. J. Membr. Sci. 1999, 155, 67–78. [Google Scholar] [CrossRef]
- White, L.S.; Blinka, T.A.; Kloczewski, H.A.; Wang, I.-F. Properties of a polyimide gas separation membrane in natural gas streams. J. Membr. Sci. 1995, 103, 73–82. [Google Scholar] [CrossRef]
- Buchtová, N.; Guyomard-Lack, A.; Le Bideau, J. Biopolymer based nanocomposite ionogels: High performance, sustainable and solid electrolytes. Green Chem. 2014, 16, 1149–1152. [Google Scholar] [CrossRef]
- Guyomard-Lack, A.; Buchtová, N.; Humbert, B.; Le Bideau, J. Ion segregation in an ionic liquid confined within chitosan based chemical ionogels. Phys. Chem. Chem. Phys. 2015, 17, 23947–23951. [Google Scholar] [CrossRef]
- Tomé, L.C.; Isik, M.; Freire, C.S.; Mecerreyes, D.; Marrucho, I.M. Novel pyrrolidinium-based polymeric ionic liquids with cyano counter-anions: High performance membrane materials for post-combustion CO2 separation. J. Membr. Sci. 2015, 483, 155–165. [Google Scholar] [CrossRef]
- Li, J.; Wang, S.; Nagai, K.; Nakagawa, T.; Mau, A.W. Effect of polyethyleneglycol (PEG) on gas permeabilities and permselectivities in its cellulose acetate (CA) blend membranes. J. Membr. Sci. 1998, 138, 143–152. [Google Scholar] [CrossRef]
- Yates, S.; Zaki, R.; Arzadon, A.; Liu, C.; Chiou, J. Thin Film Gas Separation Membranes. U.S. Patent US8016124B2, 13 September 2011. [Google Scholar]
- Chakma, A. Separation of CO2 and SO2 from flue gas streams by liquid membranes. Energy Convers. Manag. 1995, 36, 405–410. [Google Scholar] [CrossRef]
- Kemperman, A.J.; Bargeman, D.; Van Den Boomgaard, T.; Strathmann, H. Stability of supported liquid membranes: State of the art. Sep. Sci. Technol. 1996, 31, 2733–2762. [Google Scholar] [CrossRef]
- Teramoto, M.; Sakaida, Y.; Fu, S.S.; Ohnishi, N.; Matsuyama, H.; Maki, T.; Fukui, T.; Arai, K. An attempt for the stabilization of supported liquid membrane. Sep. Purif. Technol. 2000, 21, 137–144. [Google Scholar] [CrossRef]
- Kocherginsky, N.; Yang, Q.; Seelam, L. Recent advances in supported liquid membrane technology. Sep. Purif. Technol. 2007, 53, 171–177. [Google Scholar] [CrossRef]
- San Román, M.; Bringas, E.; Ibañez, R.; Ortiz, I. Liquid membrane technology: Fundamentals and review of its applications. J. Chem. Technol. Biotechnol. 2010, 85, 2–10. [Google Scholar] [CrossRef]
- Brennecke, J.F.; Maginn, E.J. Ionic liquids: Innovative fluids for chemical processing. Am. Inst. Chem. Eng. AIChE J. 2001, 47, 2384. [Google Scholar] [CrossRef]
- Maiyoh, G.K.; Njoroge, R.W.; Tuei, V.C. Effects and mechanisms of kerosene use-related toxicity. Environ. Toxicol. Pharmacol. 2015, 40, 57–70. [Google Scholar] [CrossRef]
- Takeuchi, H.; Takahashi, K.; Goto, W. Some observations on the stability of supported liquid membranes. J. Membr. Sci. 1987, 34, 19–31. [Google Scholar] [CrossRef]
- Tormoehlen, L.; Tekulve, K.; Nañagas, K. Hydrocarbon toxicity: A review. Clin. Toxicol. 2014, 52, 479–489. [Google Scholar] [CrossRef]
- Endres, F.; Abbott, A.P.; MacFarlane, D.R. Electrodeposition from Ionic Liquids; Wiley-VCH Verlag GmbH & Co. KGaA: Weinheim, Germany, 2008. [Google Scholar]
- Wasserscheid, P.; Welton, T. Ionic Liquids in Synthesis; Wiley Online Library: Hoboken, NJ, USA, 2008; Volume 1. [Google Scholar]
- Papaiconomou, N.; Estager, J.; Traore, Y.; Bauduin, P.; Bas, C.; Legeai, S.; Viboud, S.; Draye, M. Synthesis, physicochemical properties, and toxicity data of new hydrophobic ionic liquids containing dimethylpyridinium and trimethylpyridinium cations. J. Chem. Eng. Data 2010, 55, 1971–1979. [Google Scholar] [CrossRef]
- Luis, P.; Van Gerven, T.; Van der Bruggen, B. Recent developments in membrane-based technologies for CO2 capture. Prog. Energy Combust. Sci. 2012, 38, 419–448. [Google Scholar] [CrossRef]
- Wang, C.; Mahurin, S.M.; Luo, H.; Baker, G.A.; Li, H.; Dai, S. Reversible and robust CO2 capture by equimolar task-specific ionic liquid–superbase mixtures. Green Chem. 2010, 12, 870–874. [Google Scholar] [CrossRef]
- Akhmetshina, A.I.; Gumerova, O.R.; Atlaskin, A.A.; Petukhov, A.N.; Sazanova, T.S.; Yanbikov, N.R.; Nyuchev, A.V.; Razov, E.N.; Vorotyntsev, I.V. Permeability and selectivity of acid gases in supported conventional and novel imidazolium-based ionic liquid membranes. Sep. Purif. Technol. 2017, 176, 92–106. [Google Scholar] [CrossRef]
- Huang, K.; Zhang, X.-M.; Li, Y.-X.; Wu, Y.-T.; Hu, X.-B. Facilitated separation of CO2 and SO2 through supported liquid membranes using carboxylate-based ionic liquids. J. Membr. Sci. 2014, 471, 227–236. [Google Scholar] [CrossRef]
- Teramoto, M.; Takeuchi, N.; Maki, T.; Matsuyama, H. Gas separation by liquid membrane accompanied by permeation of membrane liquid through membrane physical transport. Sep. Purif. Technol. 2001, 24, 101–112. [Google Scholar] [CrossRef]
- Cascon, H.R.; Choudhari, S.K. 1-Butanol pervaporation performance and intrinsic stability of phosphonium and ammonium ionic liquid-based supported liquid membranes. J. Membr. Sci. 2013, 429, 214–224. [Google Scholar] [CrossRef]
- Rynkowska, E.; Fatyeyeva, K.; Kujawski, W. Application of polymer-based membranes containing ionic liquids in membrane separation processes: A critical review. Rev. Chem. Eng. 2018, 34, 341–363. [Google Scholar] [CrossRef]
- Kanehashi, S.; Kishida, M.; Kidesaki, T.; Shindo, R.; Sato, S.; Miyakoshi, T.; Nagai, K. CO2 separation properties of a glassy aromatic polyimide composite membranes containing high-content 1-butyl-3-methylimidazolium bis (trifluoromethylsulfonyl) imide ionic liquid. J. Membr. Sci. 2013, 430, 211–222. [Google Scholar] [CrossRef]
- Chen, H.Z.; Li, P.; Chung, T.-S. PVDF/ionic liquid polymer blends with superior separation performance for removing CO2 from hydrogen and flue gas. Int. J. Hydrogen Energy 2012, 37, 11796–11804. [Google Scholar] [CrossRef]
- Lam, B.; Wei, M.; Zhu, L.; Luo, S.; Guo, R.; Morisato, A.; Alexandridis, P.; Lin, H. Cellulose triacetate doped with ionic liquids for membrane gas separation. Polymer 2016, 89, 1–11. [Google Scholar] [CrossRef]
- Lin, H.; White, L.S.; Lokhandwala, K.; Baker, R.W. Natural gas purification. Encycl. Membr. Sci. Technol. 2013, 1–25. [Google Scholar] [CrossRef]
- Swatloski, R.P.; Spear, S.K.; Holbrey, J.D.; Rogers, R.D. Dissolution of cellose with ionic liquids. J. Am. Chem. Soc. 2002, 124, 4974–4975. [Google Scholar] [CrossRef]
- Higdon. Choline. Available online: https://lpi.oregonstate.edu/mic/other-nutrients/choline (accessed on 3 September 2023).
- Blusztajn, J.K. Choline, a vital amine. Science 1998, 281, 794–795. [Google Scholar] [CrossRef]
- Bernot, R.J.; Brueseke, M.A.; Evans-White, M.A.; Lamberti, G.A. Acute and chronic toxicity of imidazolium-based ionic liquids on Daphnia magna. Environ. Toxicol. Chem. Int. J. 2005, 24, 87–92. [Google Scholar] [CrossRef]
- Li, X.; Hou, M.; Zhang, Z.; Han, B.; Yang, G.; Wang, X.; Zou, L. Absorption of CO 2 by ionic liquid/polyethylene glycol mixture and the thermodynamic parameters. Green Chem. 2008, 10, 879–884. [Google Scholar] [CrossRef]
- Noorani, N.; Mehrdad, A. CO2 solubility in some amino acid-based ionic liquids: Measurement, correlation and DFT studies. Fluid Phase Equilibria 2020, 517, 112591. [Google Scholar] [CrossRef]
- Saravanamurugan, S.; Kunov-Kruse, A.J.; Fehrmann, R.; Riisager, A. Amine-functionalized amino acid-based ionic liquids as efficient and high-capacity absorbents for CO2. ChemSusChem 2014, 7, 897–902. [Google Scholar] [CrossRef]
- Van Valkenburg, M.E.; Vaughn, R.L.; Williams, M.; Wilkes, J.S. Thermochemistry of ionic liquid heat-transfer fluids. Thermochim. Acta 2005, 425, 181–188. [Google Scholar] [CrossRef]
- Yuan, S.; Yang, Z.; Ji, X.; Chen, Y.; Sun, Y.; Lu, X. CO2 absorption in mixed aqueous solution of MDEA and cholinium glycinate. Energy Fuels 2017, 31, 7325–7333. [Google Scholar] [CrossRef]
- Anderson, J.L.; Dixon, J.K.; Brennecke, J.F. Solubility of CO2, CH4, C2H6, C2H4, O2, and N2 in 1-Hexyl-3-methylpyridinium Bis (trifluoromethylsulfonyl) imide: Comparison to Other Ionic Liquids. Acc. Chem. Res. 2007, 40, 1208–1216. [Google Scholar] [CrossRef]
- Raveendran, P.; Wallen, S.L. Cooperative C−H···O Hydrogen Bonding in CO2−Lewis Base Complexes: Implications for Solvation in Supercritical CO2. J. Am. Chem. Soc. 2002, 124, 12590–12599. [Google Scholar] [CrossRef]
- Mejía, I.; Stanley, K.; Canales, R.; Brennecke, J.F. On the high-pressure solubilities of carbon dioxide in several ionic liquids. J. Chem. Eng. Data 2013, 58, 2642–2653. [Google Scholar] [CrossRef]
- Liu, Q.-P.; Hou, X.-D.; Li, N.; Zong, M.-H. Ionic liquids from renewable biomaterials: Synthesis, characterization and application in the pretreatment of biomass. Green Chem. 2012, 14, 304–307. [Google Scholar] [CrossRef]
- Moriel, P.; García-Suárez, E.J.; Martínez, M.; García, A.B.; Montes-Morán, M.A.; Calvino-Casilda, V.; Bañares, M.A. Synthesis, characterization, and catalytic activity of ionic liquids based on biosources. Tetrahedron Lett. 2010, 51, 4877–4881. [Google Scholar] [CrossRef]
- Kiran, E.; Sarver, J.A.; Hassler, J.C. Solubility and diffusivity of CO2 and N2 in polymers and polymer swelling, glass transition, melting, and crystallization at high pressure: A critical review and perspectives on experimental methods, data, and modeling. J. Supercrit. Fluids 2022, 185, 105378. [Google Scholar] [CrossRef]
- Felder, R.; Huvard, G. 17. Permeation, diffusion, and sorption of gases and vapors. In Methods in Experimental Physics; Elsevier: Amsterdam, The Netherlands, 1980; Volume 16, pp. 315–377. [Google Scholar]
- Crank, J. The Mathematics of Diffusion, 2nd ed.; Clarendon Press: Oxford, UK, 1975. [Google Scholar]
- WebBook, N.C. Available online: https://webbook.nist.gov/chemistry/ (accessed on 10 February 2024).
- Yang, Y. Polymer Data Handbook; Mark, J.E., Ed.; Oxford University Press: Oxford, UK, 1999. [Google Scholar]
- Reed, D.G.; Dowson, G.R.; Styring, P. Cellulose-supported ionic liquids for low-cost pressure swing CO2 capture. Front. Energy Res. 2017, 5, 13. [Google Scholar] [CrossRef]
- Barud, H.S.; de Araújo Júnior, A.M.; Santos, D.B.; de Assunção, R.M.; Meireles, C.S.; Cerqueira, D.A.; Rodrigues Filho, G.; Ribeiro, C.A.; Messaddeq, Y.; Ribeiro, S.J. Thermal behavior of cellulose acetate produced from homogeneous acetylation of bacterial cellulose. Thermochim. Acta 2008, 471, 61–69. [Google Scholar] [CrossRef]
- Kamide, K.; Saito, M. Thermal analysis of cellulose acetate solids with total degrees of substitution of 0.49, 1.75, 2.46, and 2.92. Polym. J. 1985, 17, 919–928. [Google Scholar] [CrossRef]
- Doyle, S.E.; Pethrick, R.A. Structure of fibrous cellulose acetate: X-ray diffraction, positron annihilation and electron microscopy investigations. J. Appl. Polym. Sci. 1987, 33, 95–106. [Google Scholar] [CrossRef]
- Rodrigues Filho, G.; da Cruz, S.F.; Pasquini, D.; Cerqueira, D.A.; de Souza Prado, V.; de Assunção, R.M.N. Water flux through cellulose triacetate films produced from heterogeneous acetylation of sugar cane bagasse. J. Membr. Sci. 2000, 177, 225–231. [Google Scholar] [CrossRef]
- Stuart, B.H. Infrared Spectroscopy: Fundamentals and Applications; John Wiley & Sons: Hoboken, NJ, USA, 2004. [Google Scholar]
- Ahmad, I.R.; Cane, D.; Townsend, J.H.; Triana, C.; Mazzei, L.; Curran, K. Are we overestimating the permanence of cellulose triacetate cinematographic films? A mathematical model for the vinegar syndrome. Polym. Degrad. Stab. 2020, 172, 109050. [Google Scholar] [CrossRef]
- Tsioptsias, C.; Foukas, G.-R.P.; Papaioannou, S.-M.; Tzimpilis, E.; Tsivintzelis, I. On the Thermochemical Transition Depression of Cellulose Acetate Composite Membranes. Polymers 2022, 14, 3434. [Google Scholar] [CrossRef]
- Tsioptsias, C.; Karabinaki, O.; Christofilos, D.; Tzimpilis, E.; Tsivintzelis, I.; Panayiotou, C. On polymer-polymer miscibility and cellulose ester blends: A case study. Thermochim. Acta 2022, 714, 179265. [Google Scholar] [CrossRef]
- Tsioptsias, C.; Nikolaidou, E.G.; Ntampou, X.; Tsivintzelis, I.; Panayiotou, C. Thermo-chemical transition in cellulose esters and other polymers. Thermochim. Acta 2022, 707, 179106. [Google Scholar] [CrossRef]
- Tsioptsias, C. Thermodynamic explanation and criterion for the exhibition of melting inability in molecular species. AIMS Mater. Sci. 2023, 10, 618–636. [Google Scholar] [CrossRef]
- Kazarian, S.G.; Vincent, M.F.; Bright, F.V.; Liotta, C.L.; Eckert, C.A. Specific intermolecular interaction of carbon dioxide with polymers. J. Am. Chem. Soc. 1996, 118, 1729–1736. [Google Scholar] [CrossRef]
- Finotello, A.; Bara, J.E.; Narayan, S.; Camper, D.; Noble, R.D. Ideal gas solubilities and solubility selectivities in a binary mixture of room-temperature ionic liquids. J. Phys. Chem. B 2008, 112, 2335–2339. [Google Scholar] [CrossRef] [PubMed]
- Shannon, M.S.; Tedstone, J.M.; Danielsen, S.P.; Hindman, M.S.; Irvin, A.C.; Bara, J.E. Free volume as the basis of gas solubility and selectivity in imidazolium-based ionic liquids. Ind. Eng. Chem. Res. 2012, 51, 5565–5576. [Google Scholar] [CrossRef]
- Pantoula, M.; Panayiotou, C. Sorption and swelling in glassy polymer/carbon dioxide systems: Part I. Sorption. J. Supercrit. Fluids 2006, 37, 254–262. [Google Scholar] [CrossRef]
- Sanders, E.S.; Koros, W.J.; Hopfenberg, H.B.; Stannett, V.T. Mixed gas sorption in glassy polymers: Equipment design considerations and preliminary results. J. Membr. Sci. 1983, 13, 161–174. [Google Scholar] [CrossRef]
- Sato, Y.; Takikawa, T.; Yamane, M.; Takishima, S.; Masuoka, H. Solubility of carbon dioxide in PPO and PPO/PS blends. Fluid Phase Equilibria 2002, 194–197, 847–858. [Google Scholar] [CrossRef]
- Tsioptsias, C.; Panayiotou, C. Simultaneous determination of sorption, heat of sorption, diffusion coefficient and glass transition depression in polymer–CO2 systems. Thermochim. Acta 2011, 521, 98–106. [Google Scholar] [CrossRef]
- Hermans, P.; Weidinger, A. Estimation of crystallinity of some polymers from x-ray intensity measurements. J. Polym. Sci. 1949, 4, 709–723. [Google Scholar] [CrossRef]
- Krimm, S.; Tobolsky, A.V. Quantitative x-ray studies of order in amorphous and crystalline polymers. Quantitative x-ray determination of crystallinity in polyethylene. J. Polym. Sci. 1951, 7, 57–76. [Google Scholar] [CrossRef]
Disclaimer/Publisher’s Note: The statements, opinions and data contained in all publications are solely those of the individual author(s) and contributor(s) and not of MDPI and/or the editor(s). MDPI and/or the editor(s) disclaim responsibility for any injury to people or property resulting from any ideas, methods, instructions or products referred to in the content. |
© 2024 by the authors. Licensee MDPI, Basel, Switzerland. This article is an open access article distributed under the terms and conditions of the Creative Commons Attribution (CC BY) license (https://creativecommons.org/licenses/by/4.0/).
